

Sample Category Title
AUD/USD Weekly Outlook
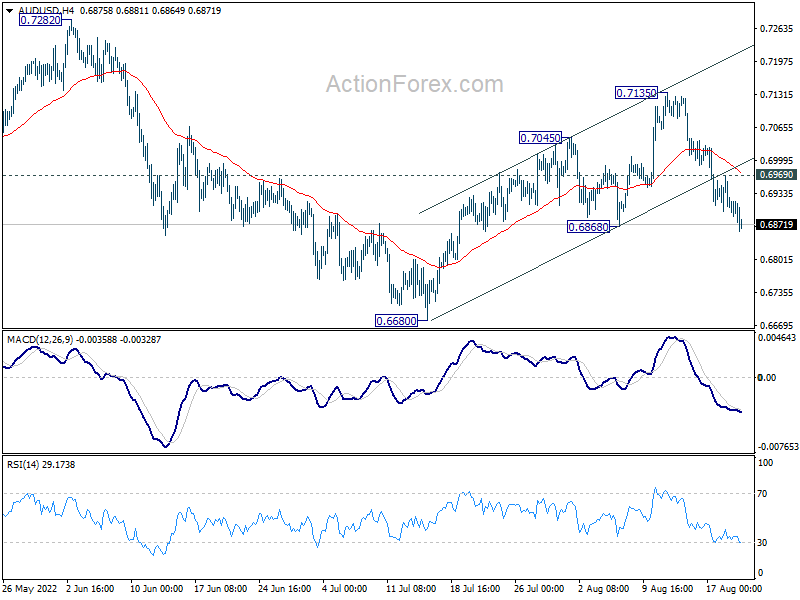
AUD/USD's decline last week argues that corrective rebound from 0.6680 has completed with three waves up to 0.7135. Initial bias stays on the downside this week for retesting 0.6680 low next. On the upside, above 0.6969 minor resistance will mix up the outlook and turn intraday bias neutral first.
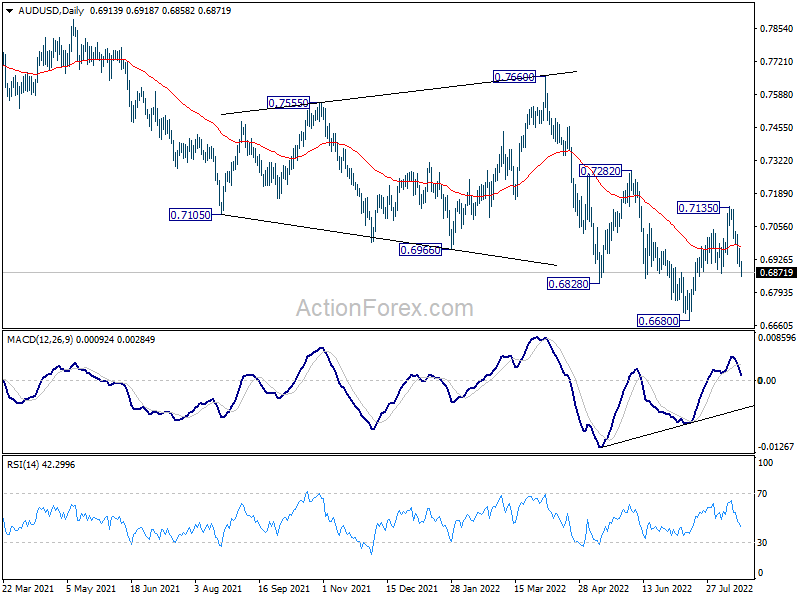
In the bigger picture, price actions from 0.8006 (2021 high) is seen more as a corrective pattern to rise from 0.5506 (2020 low). Or it could also be a bearish impulsive move. In either case, outlook will remain bearish as long as 0.7282 resistance holds. Next target is 61.8% retracement of 0.5506 to 0.8006 at 0.6461.
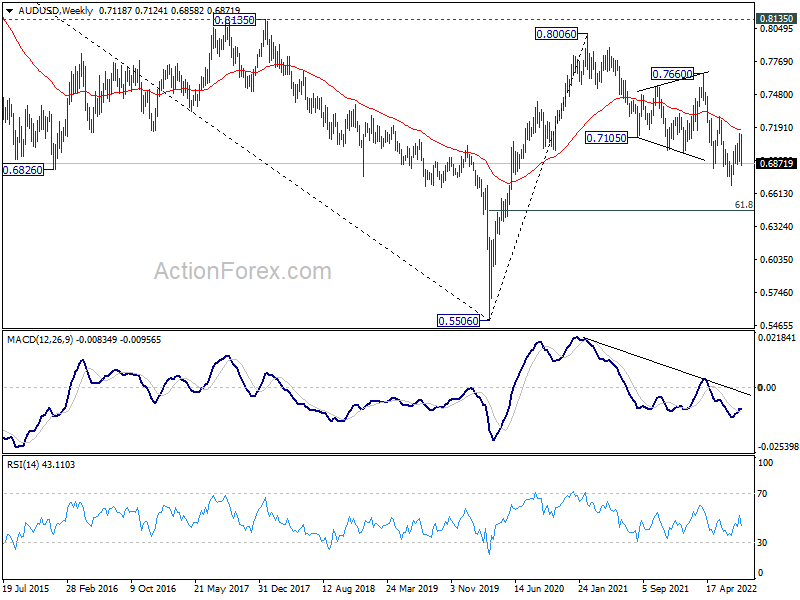
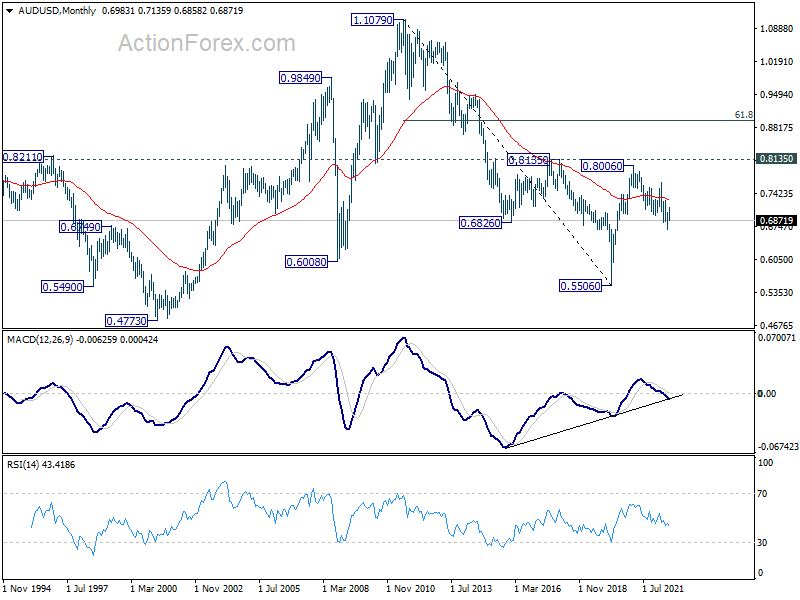
In the long term picture, rejection by 0.8135 resistance suggests that the long term down trend from 1.1079 (2011 high) is not ready to reverse. Yet, the structure of the fall from 0.8006 still argues that it's a corrective move. Hence, break of 0.5506 low is not envisaged for now. The long term outlook stays neutral first, and will be reassessed later after the fall from 0.8006 completes.
USD/CAD Weekly Outlook
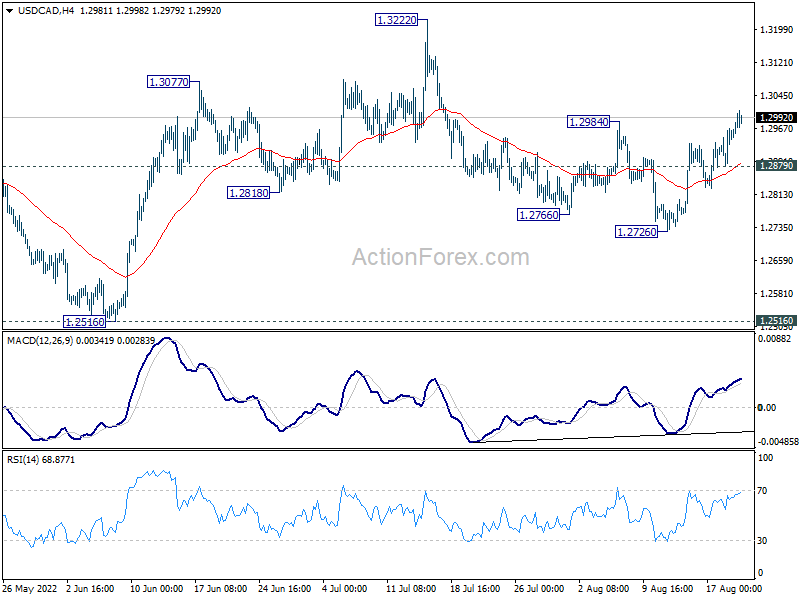
USD/CAD's break of 1.2984 resistance suggests that corrective decline from 1.3222 has completed with three waves down to 1.2726. Initial bias is now on the upside this week for retesting 1.3222 high next. On the downside, break of 1.2879 minor support will mix up the outlook and turn intraday bias neutral again.
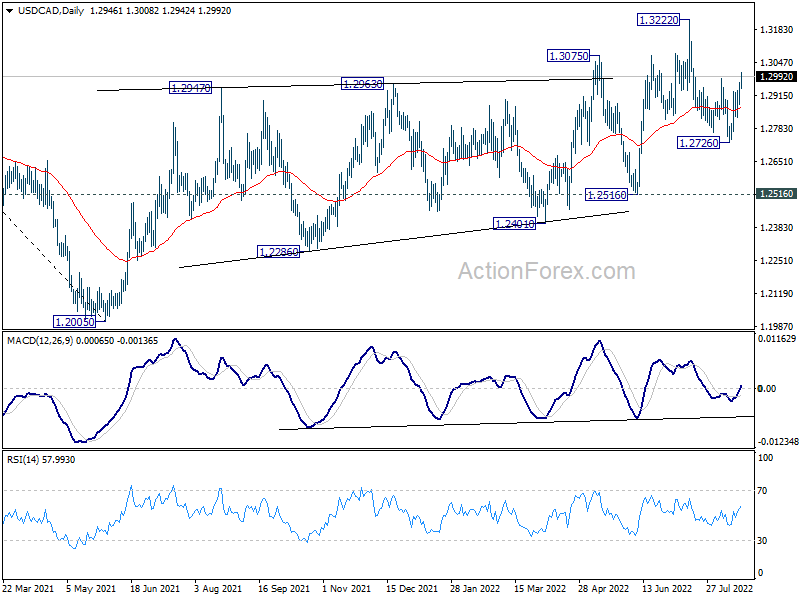
In the bigger picture, down trend from 1.4667 (2020 high) should have completed at 1.2005, after defending 1.2061 long term cluster support. Rise from there should target 61.8% retracement of 1.4667 to 1.2005 (2021 low) at 1.3650. This will remain the favored case now as long as 1.2516 support holds.
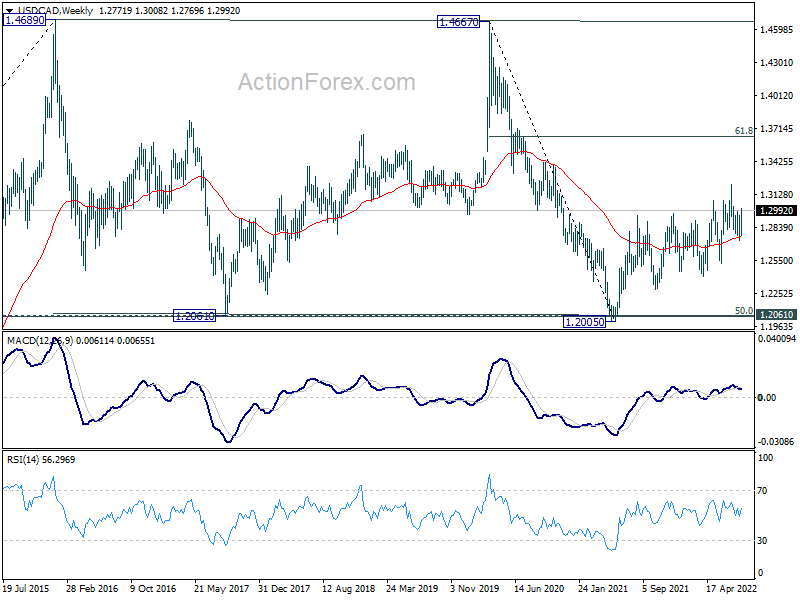
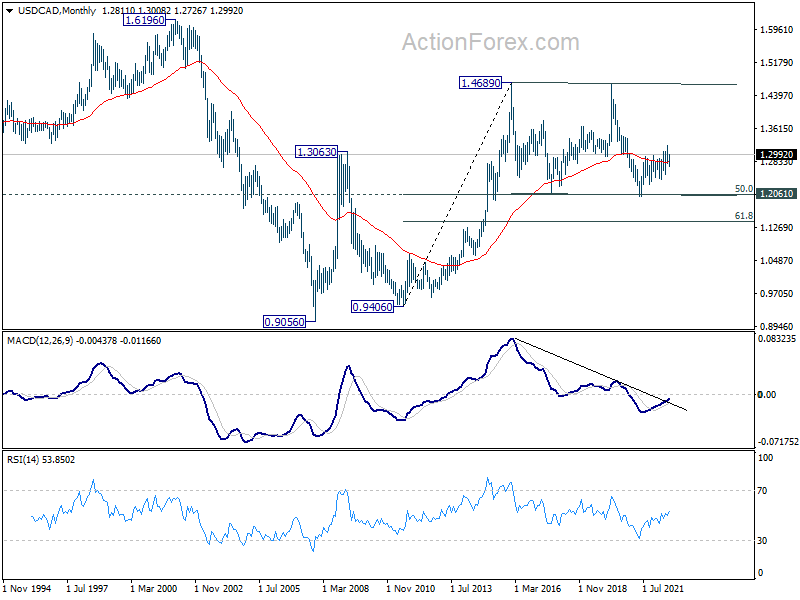
In the longer term picture, price actions from 1.4689 (2016 high) are seen as a consolidation pattern only. That is, up trend from 0.9506 (2007 low) is still expected to resume at a later stage. This will remain the favored case as long as 1.2061 support holds, which is close to 50% retracement of 0.9406 to 1.4689 at 1.2048.
GBP/JPY Weekly Outlook
GBP/JPY extended the consolidation pattern from 168.67 last week. Initial bias stays neutral this week first. On the upside, break of 163.91 will bring stronger rise to 166.31 resistance. On the downside, below 160.07 will turn bias to the downside for 159.42 and below.
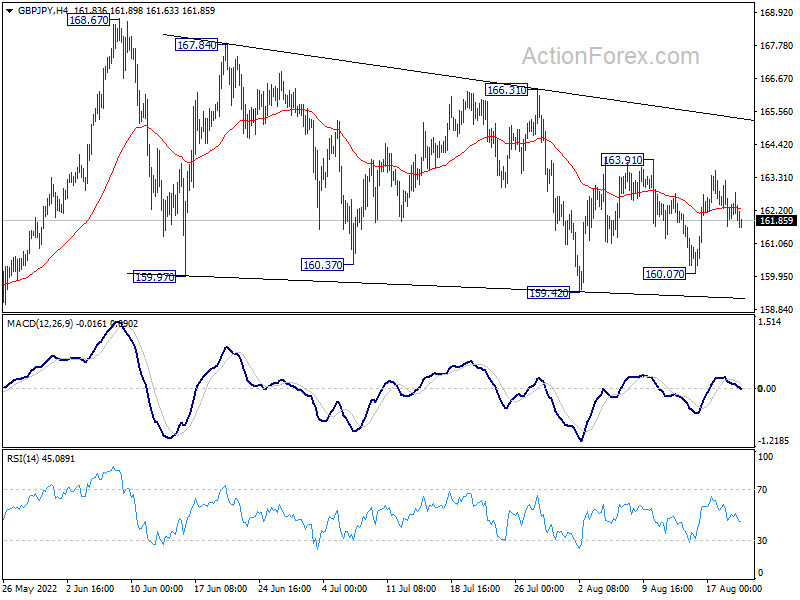
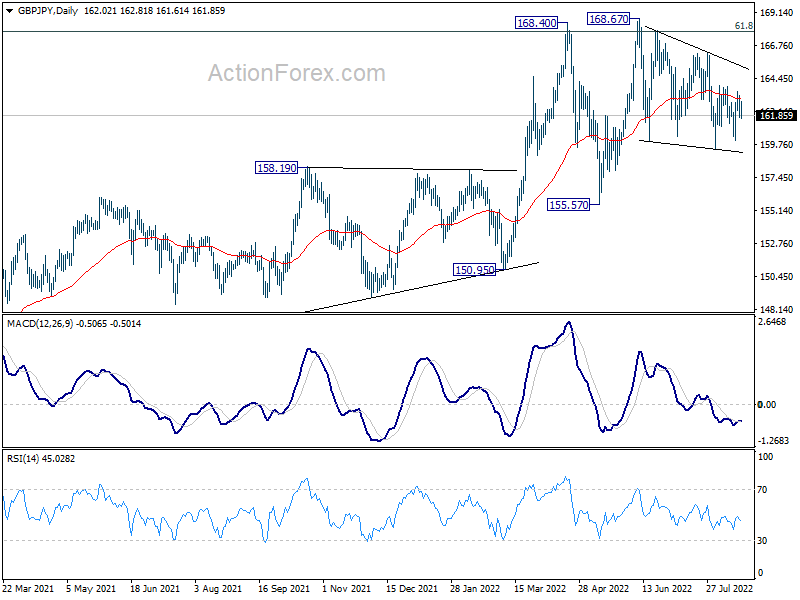
In the bigger picture, up trend from 123.94 (2020 low) is still in progress. Sustained break of 61.8% retracement of 195.86 (2015 high) to 122.75 (2016 low) at 167.93 will be a long term bullish signal, and could pave the way back to 195.86 high. This will remain the favored case as long as 155.57 support holds, even in case of deep pull back.
src="https://www.actionforex.com/wp-content/uploads/2022/08/gbpjpy20220820w2-600x450.png" alt="" width="600" height="450" class="aligncenter size-medium wp-image-459499" />
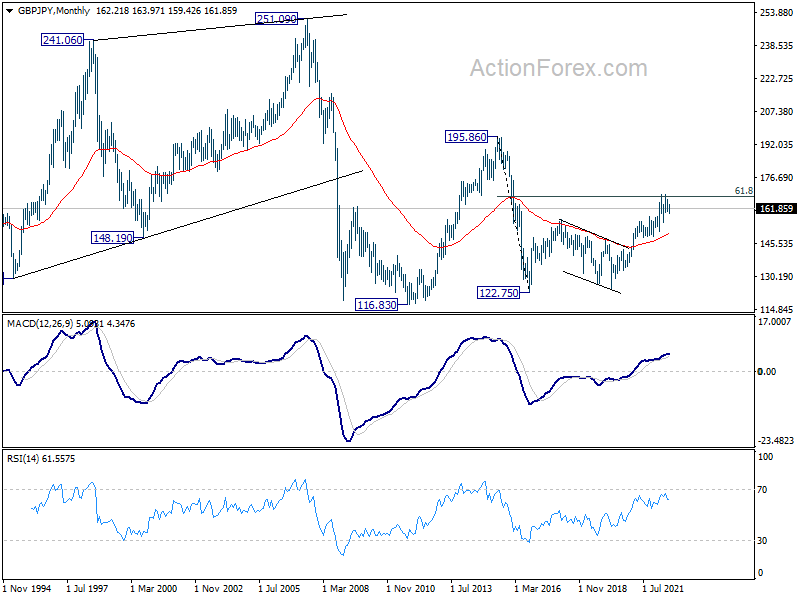
In the longer term picture, rise from 122.75 could be the third leg the the pattern from 116.83 (2011 low). Further rise will remain in favor as long as 55 month EMA (now at 149.84) holds. Sustained break of 61.8% retracement of 195.86 to 122.75 at 167.93. will pave the way to 195.86 (2015 high).
EUR/JPY Weekly Outlook
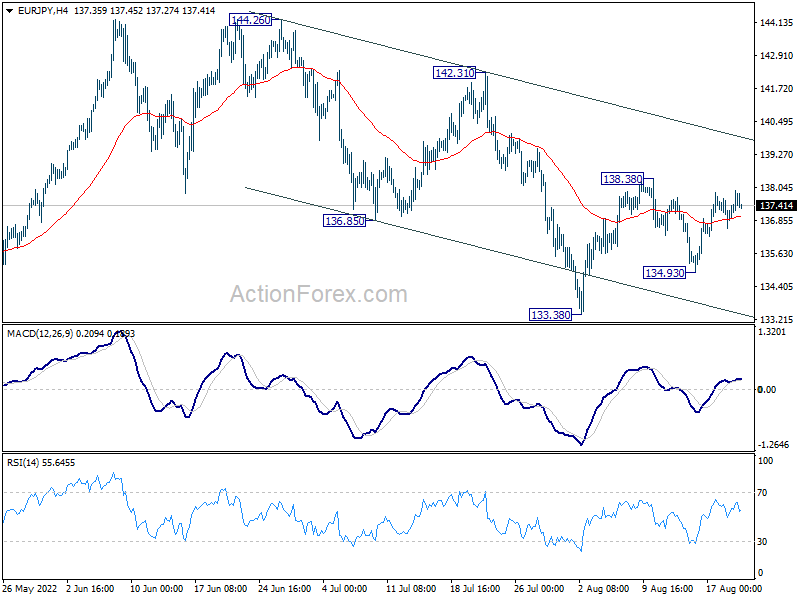
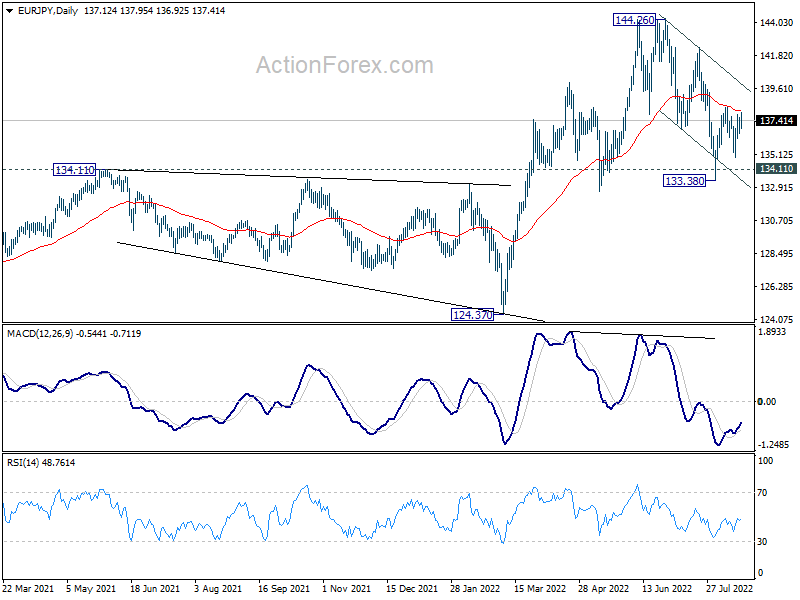
EUR/JPY stayed in established last week and initial bias stays neutral this week first. On the upside, break of 138.38 resistance will resume the rebound from 133.38 towards 142.31 resistance. On the downside, break of 134.93 will turn bias back to the downside for 133.38 support. Overall, corrective pattern from 144.26 could extend further with more choppy trading.
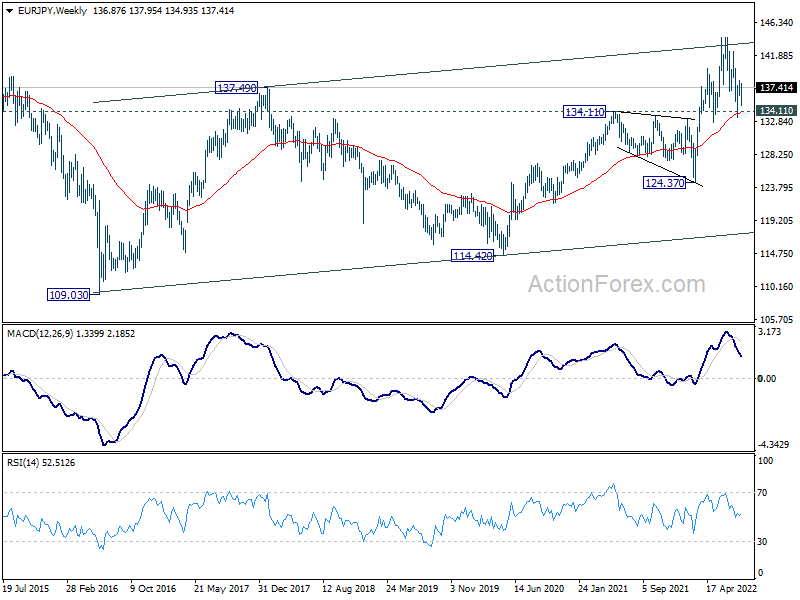
In the bigger picture, up trend from 114.42 (2020 low) is seen as the third leg of the pattern from 109.30 (2016 low). Further rally is in favor as long as 134.11 resistance turned support holds, even in case of deep pull back. Next target is 149.76 (2015 high). However, sustained break of 134.11 will be a sign of medium term bearish reversal and turn focus to 124.37 support for confirmation.
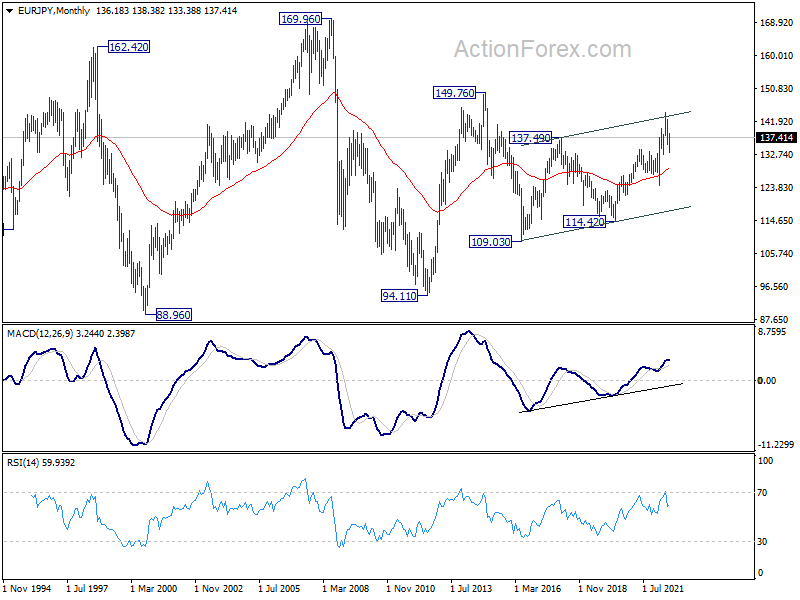
In the long term picture, up trend from 94.11 (2012 low) is seen as in the third leg. Further rally would be seen to 149.76 resistance (2014 high) and above. This will remain the favored case as long as 55 month EMA (now at 128.86) holds.
EUR/GBP Weekly Outlook
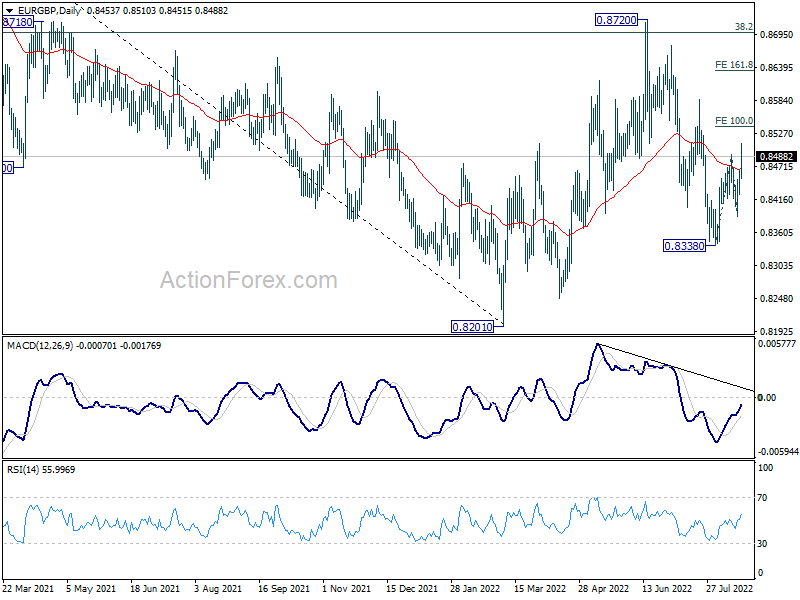
EUR/GBP's rebound from 0.8338 resumed last week by breaking through 0.8491 resistance. Current development argues that choppy fall from 0.8720 might be completed. Initial bias is now on the upside this week for 100% projection of 0.8338 to 0.8491 from 0.8386 at 0.8539. Firm break there will affirm this bullish case and prompt upside acceleration to 161.8% projection at 0.8634 and above. On the downside, break of 0.8386 will resume the fall from 0.8720 through 0.8338 low instead.
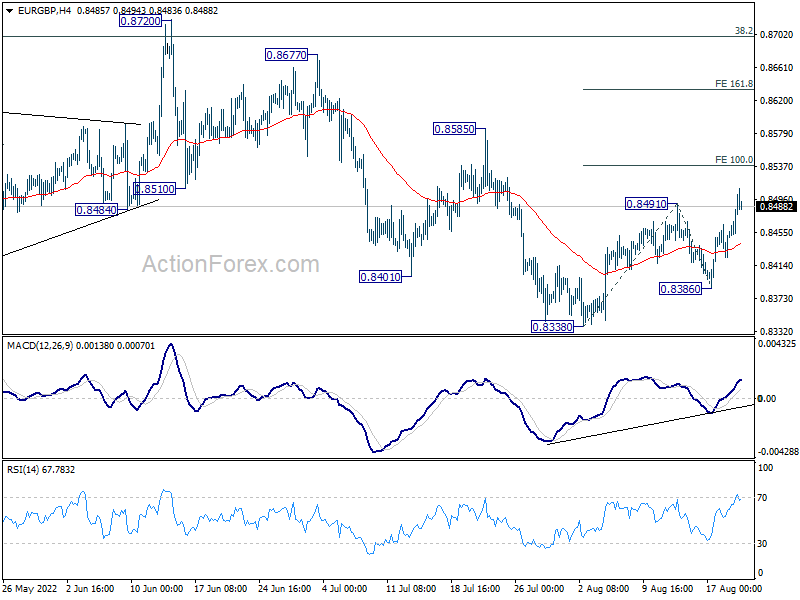
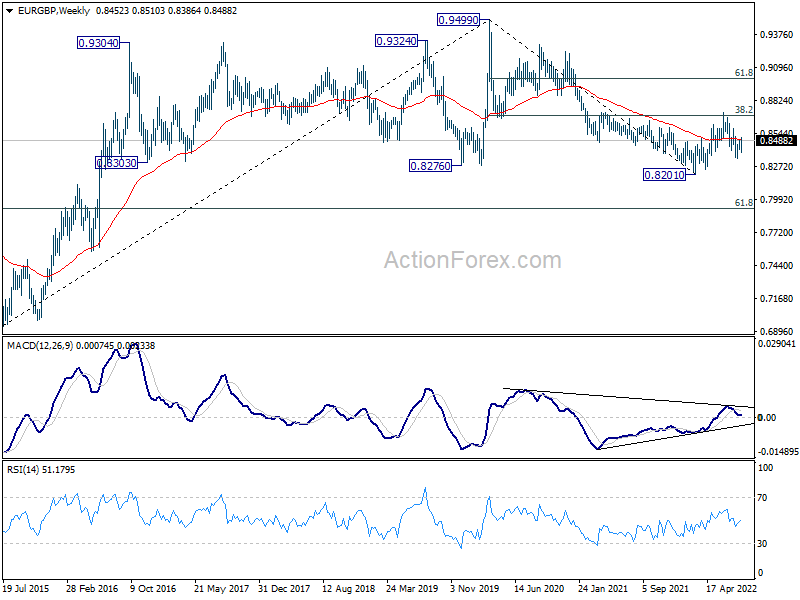
In the bigger picture, medium term bearishness is maintained with prior rejection by 38.2% retracement of 0.9499 to 0.8201 at 0.8697. Break of 0.8201 will resume larger down trend from 0.9499 (2020 high). Nevertheless, sustained break of 0.8697 will affirm the case that rise from 0.8201 is a medium term up trend itself.
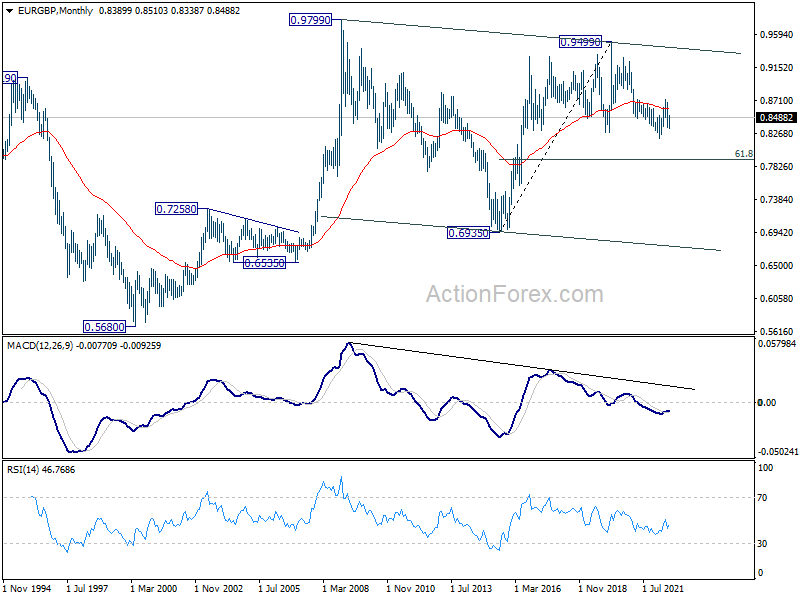
In the long term picture, the lack of medium term downside momentum suggests that fall from 0.9499 (2020 high) is merely a correction to rise from 0.6935 (2015 high). In case of another fall, downside should be contained by 61.8% retracement of 0.6935 to 0.9499 at 0.7917 to bring rebound. Sustained trading above 55 month EMA (now at 0.8591) will indicate that the correction has completed and bring retest of 0.9499.
EUR/AUD Weekly Outlook
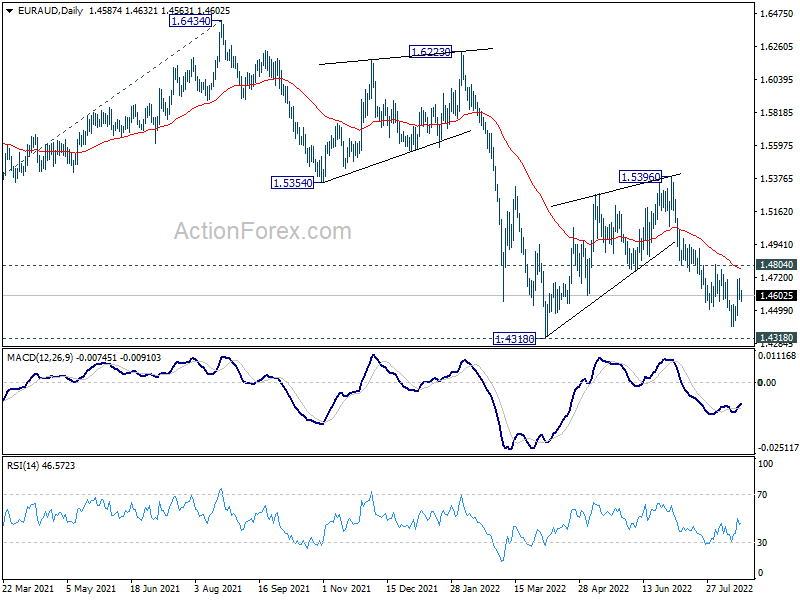
EUR/AUD recovered ahead of 1.4318 low last week, but recovery is limited below 1.4804 resistance. Initial bias remains neutral this week first and further decline is expected. On the downside, firm break of 1.4318 low will resume larger down trend to medium term projection level at 1.3623. However, break of 1.4804 will delay the bearish case and turn bias to the upside for stronger rebound first.
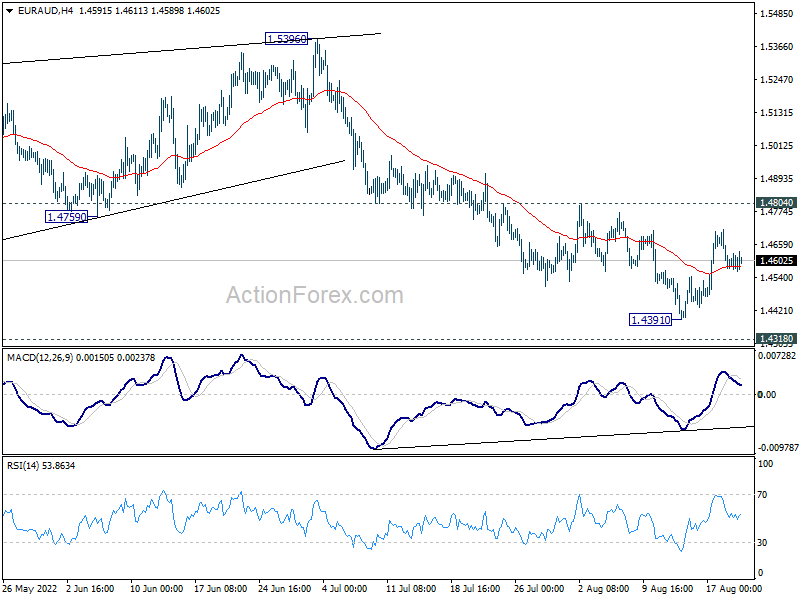
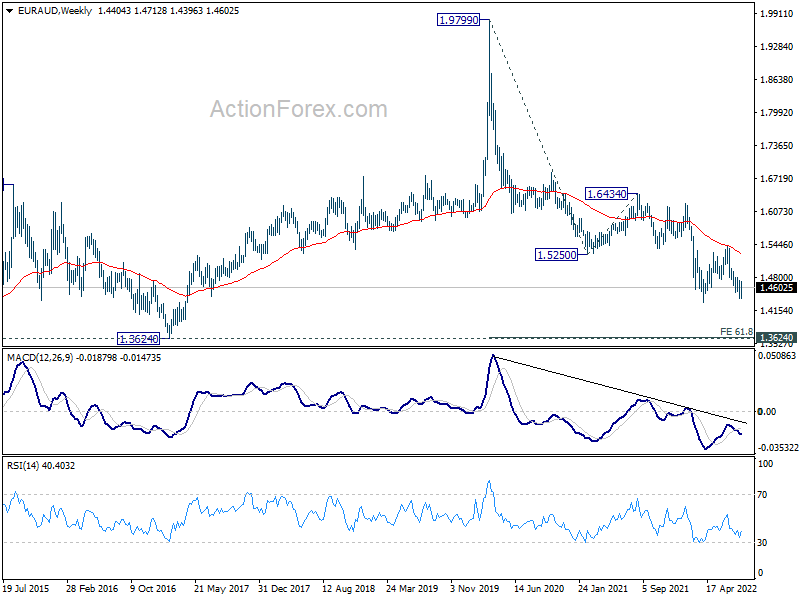
In the bigger picture, down trend from 1.9799 is still in progress. Break of 1.4318 low will target 61.8% projection of 1.9799 to 1.5250 from 1.6434 at 1.3623, which is close to 1.3624 long term support (2017 low). This will remain the favored case now as long as 1.5396 resistance holds.
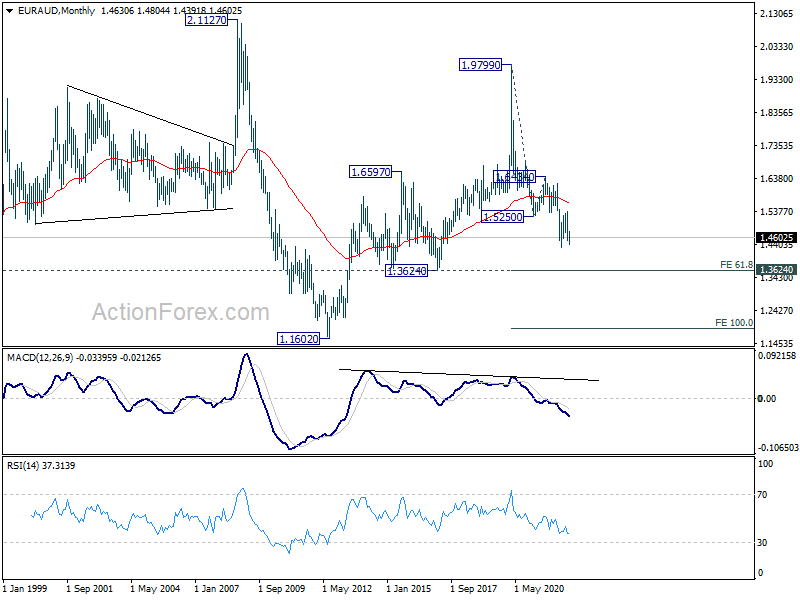
In the longer term picture, fall from 1.9799 (2020 high) is seen as the third leg of the pattern from 2.1127 (2008 high). Deeper fall should be seen to 1.3624 support. Decisive break there would pave the way back to 1.1602 (2012 low). This will remain the favored case as long as 55 month EMA (now at 1.5656) holds.
EUR/CHF Weekly Outlook
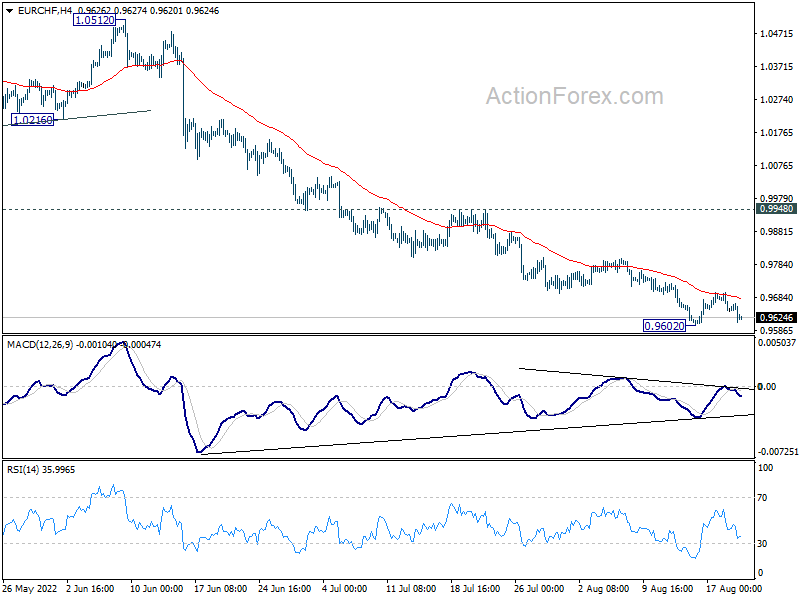
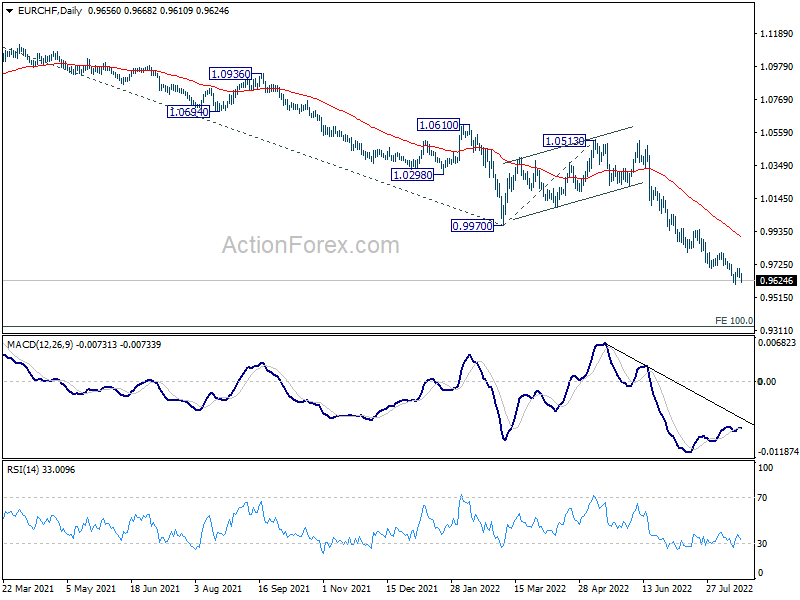
EUR/CHF dropped further to 0.9602 last week but turned sideway since then. Initial bias remains neutral this week first. In case of another recovery, upside should be limited well below 0.9948 resistance to bring another fall. Break of 0.9602 will resume larger down trend to 100% projection of 1.1149 to 0.9970 from 1.0513 at 0.9334.
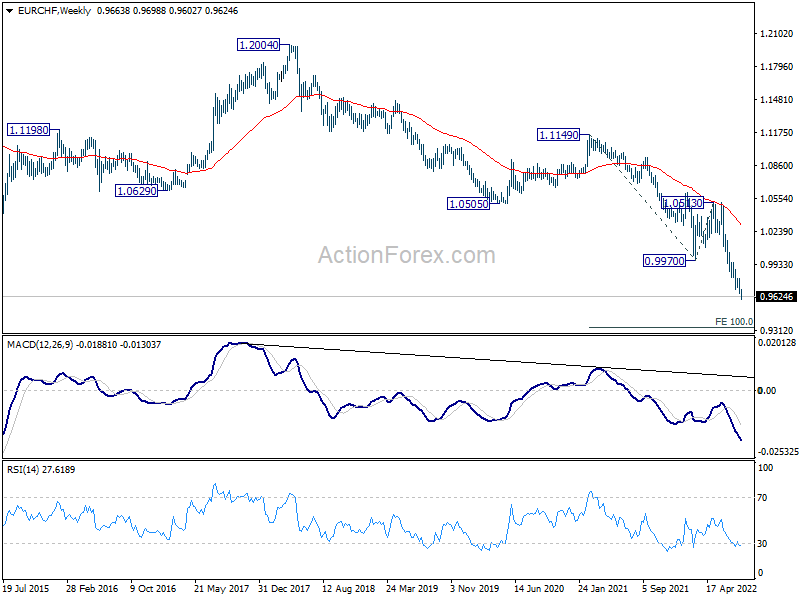
In the bigger picture, long term down trend from 1.2004 (2018 high) is still in progress. Next target is 138.2% projection of 1.2004 to 1.0505 to 1.1149 at 0.9033. On the upside, break of 0.9970 support turned resistance is needed to be the first sign of medium term bottoming. Otherwise, outlook will stay bearish in case of strong rebound.
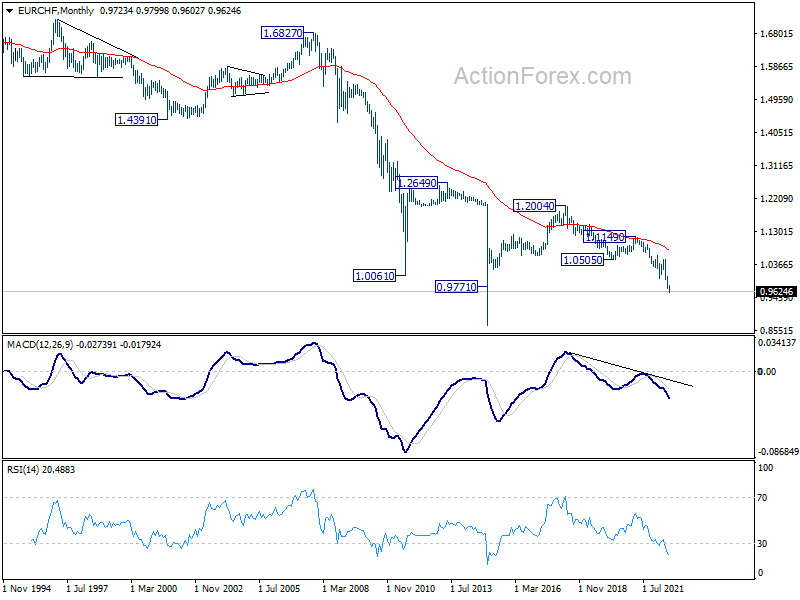
In the long term picture, capped below 55 month EMA, EUR/CHF is seen as extending the multi-decade down trend. There is no prospect of a bullish reversal until firm break of 1.0505 support (2020 low).
Dollar Rally Rejuvenated as Risk-on Sentiment Lost Steam, Yields Jumped
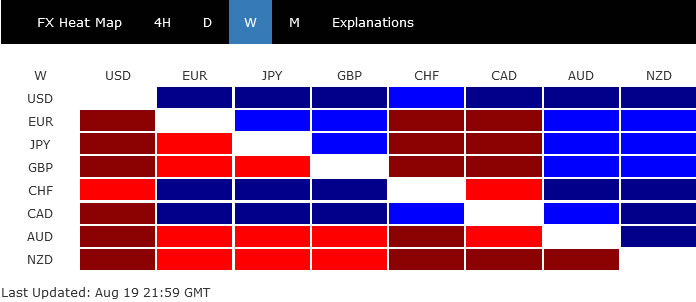
Dollar ended as the strongest one, closing notably higher against all other major currencies, as risk-on sentiment lost steam while treasury yields surged. The late momentum was rather impressive and argues that the greenback might be ready for breakouts. While Canadian Dollar ended as the second strongest, it's Swiss Franc's resilience, and strength against European majors that's worth more attention.
New Zealand Dollar ended as worst performing one despite RBNZ's hawkish rate hike. Aussie was a close second. But at the same time, Yen, Euro and Sterling were also weak. These three have the potential to overtake and loser spots in the near future.
Dollar index rose strongly, yields surged, stocks lost momentum
Investors continued adjust their expectations on Fed's next step, even though there wasn't any clarify from policymakers' comments. But that's rightly so with one more set of job and inflation data to be released before the next FOMC meeting. Much attention will be on the upcoming Jackson Hole symposium, but Fed chair Jerome Powell is unlikely to offer anything concrete.
The expectation adjustments resulted in sharp rally in US benchmark treasury yield while stocks ended mildly lower. Dollar was given a strong boost.
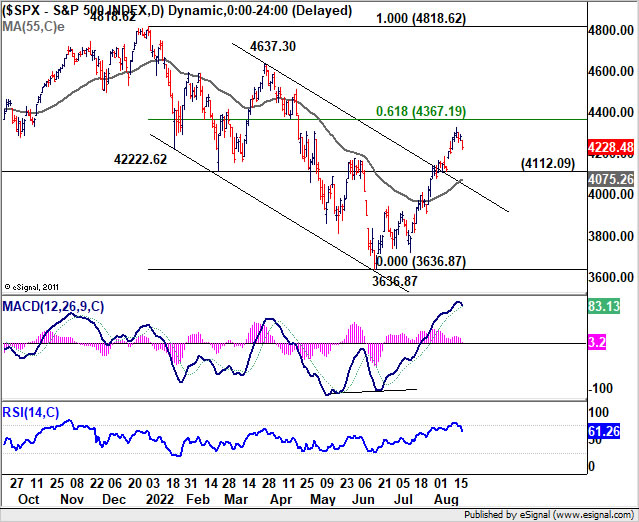
S&P 500's rebound from 3636.87 lost momentum ahead of 61.8% retracement of 4818.62 to 3636.87 at 4367.19. But it's still early to call for near term reversal. Further rise would remain in favor as long as 4112.09 support holds. Sustained trading above 4367.19 will set the stage for retesting 4637.30/4818.62 resistance zone later in the year. However, decisive break of 4112.09 support will argue that the rebound is over.
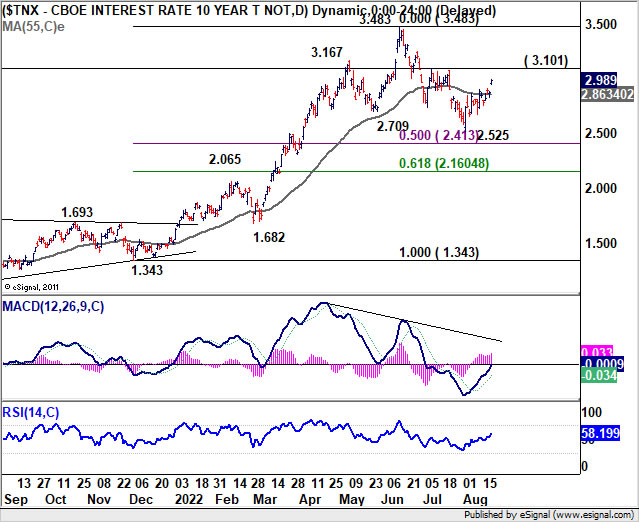
10-year yield closed sharply higher at 2.989 after gapping up on Friday. There is no change in the view that the first leg of the consolidation pattern from 3.483 has completed at 2.525. Rise from there is seen as the second leg and would probably extend through 3.101 resistance. But there is little prospect of breaking through 3.483 high for now.
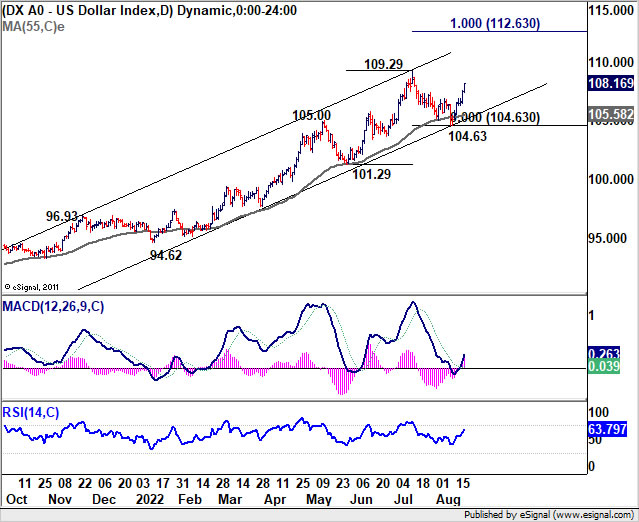
Dollar index staged a strong rally last week to close at 108.16. The upside momentum is very impressive and it's raising the chance of up trend resumption. 109.29 high is now back as a near term focus. Decisive break there will push DXY towards 100% projection of 101.29 to 109.29 from 104.63 at 112.63. Such development would probably require extended rise in 10-year yield towards 3.483, and a near term reversal in stocks and risk sentiment, to happen together.
Bitcoin might have completed corrective recovery
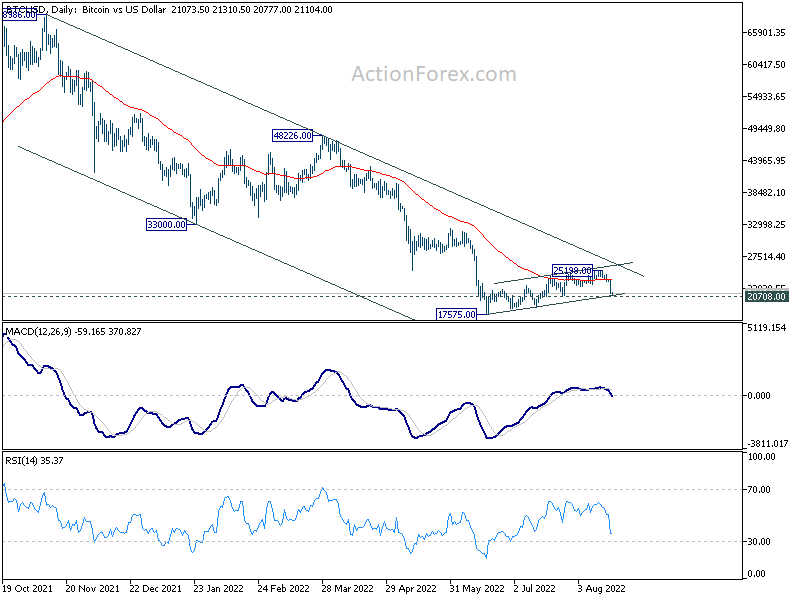
Talking about risk sentiment, the development in Bitcoin might be a hint on what's next. The sharp decline raises the chance that consolidation from 17575 has completed at 25198, ahead of medium term channel resistance. Immediate focus is now on 20708 support. Decisive break there should sent Bitcoin through 17575 lo. That, if happens, could be a leading indicator of troubles in NASDAQ, and the broader stock markets.
GBP/CHF extending down trend, CHF/JPY ready for breakout
In addition to Dollar, the strength in Swiss Franc is also worth a mention. It's clear that SNB is not done with tightening yet and another rate hike, at least 50bps, is expected at the September quarterly meeting. More important, SNB is also clear that it'd like to see appreciation of the Swiss Franc to help curb inflation. These two factors should continue to support the Franc, in particular against European majors.
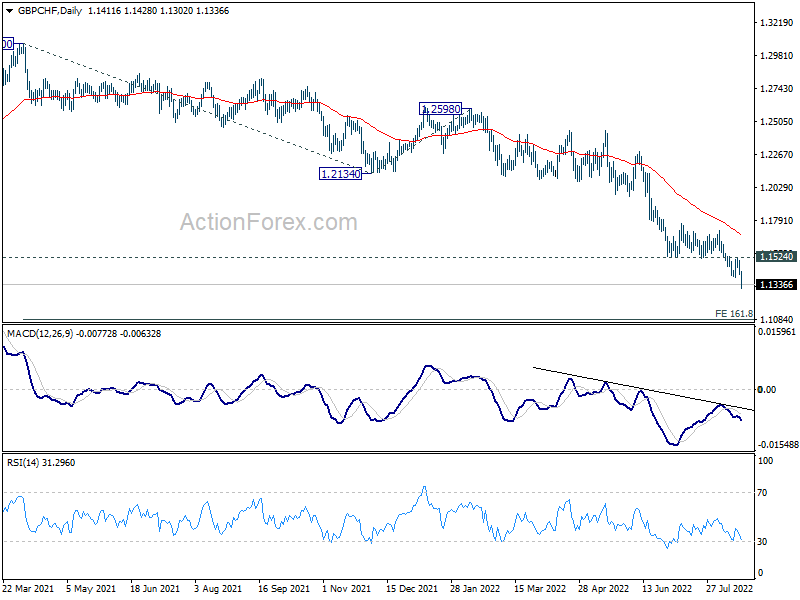
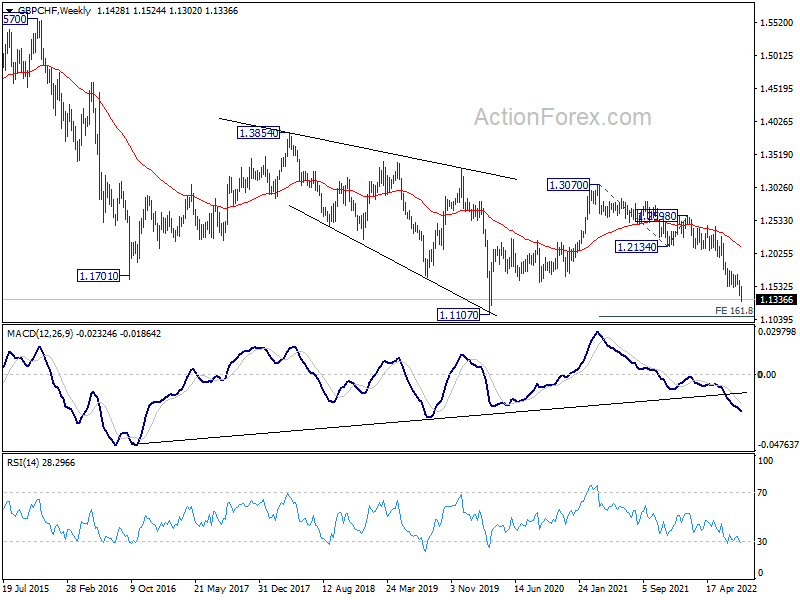
GBP/CHF's down trend continued last week despite brief interim recovery, and hit as low as 1.1302. Near term outlook remains bearish as long as 1.1524 resistance holds. Next target is 161.8% projection of 1.3070 to 1.2134 from 1.2598 at 1.1084, which is close to 1.1107 (2020 low). That could happen rather quickly if speculation of a larger rate hike builds up in the coming weeks.
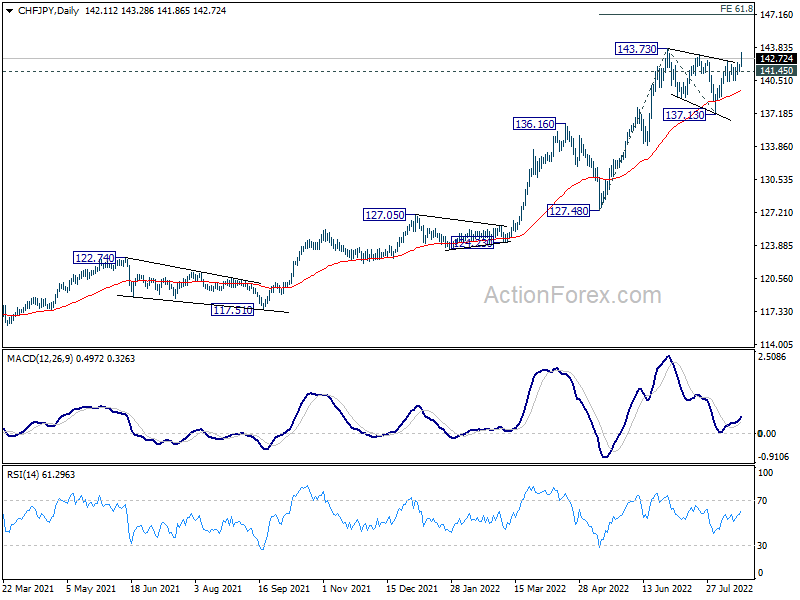
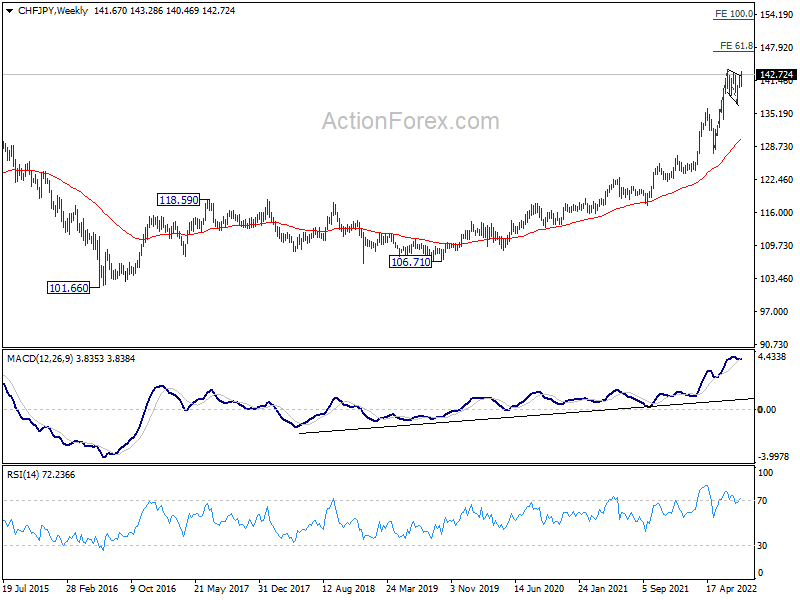
CHF/JPY's up trend is still in acceleration phase, from medium term point of view, with BoJ standing firmly on its dovish stance. Immediate focus is now on 143.73 high. Firm break there will resume larger up trend to 61.8% projection of 127.48 to 143.73 from 137.13 at 147.1, and then 100% projection at 153.38. Nevertheless, break of 141.45 support will delay the bullish case and extend the consolidation from 143.73 with another falling leg first.
EUR/USD Weekly Outlook
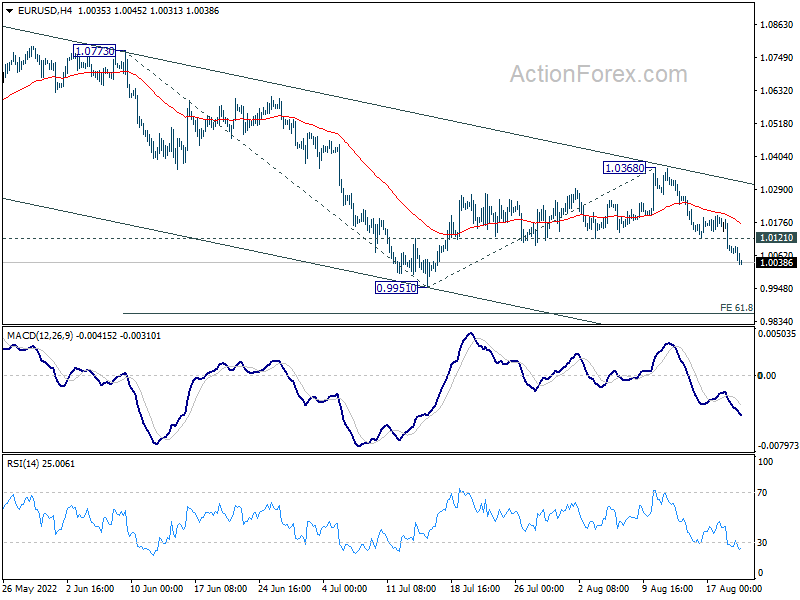
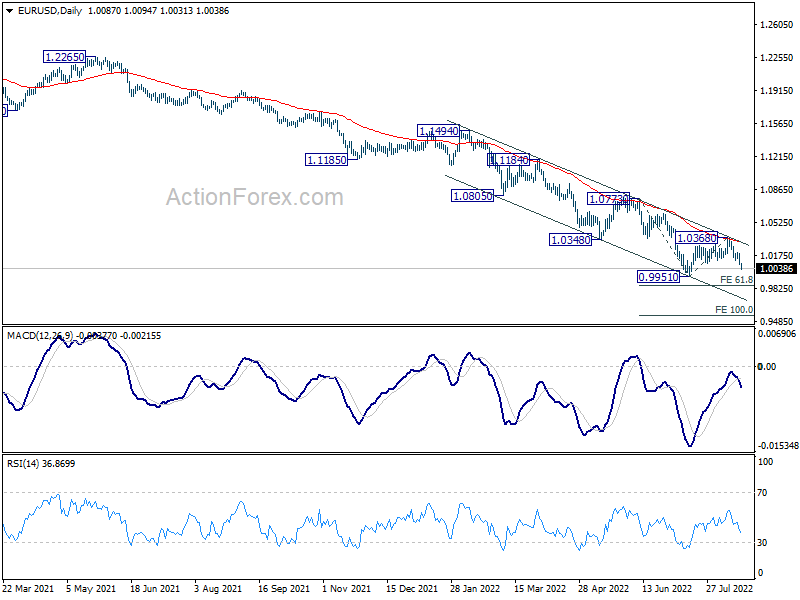
EUR/USD's decline last week suggests that corrective recovery from 0.9951 has completed at 1.0368, after rejection by channel resistance and 55 day EMA. Initial bias stays on the downside this week for retesting 0.9951 low first. Break will resume larger down trend to 61.8% projection of 1.0773 to 0.9951 from 1.0368 at 0.9860, and then 100% projection at 0.9546. On the upside, above 1.0121 minor resistance will turn intraday bias neutral first. But outlook will stay bearish as long as 1.0368 resistance holds.
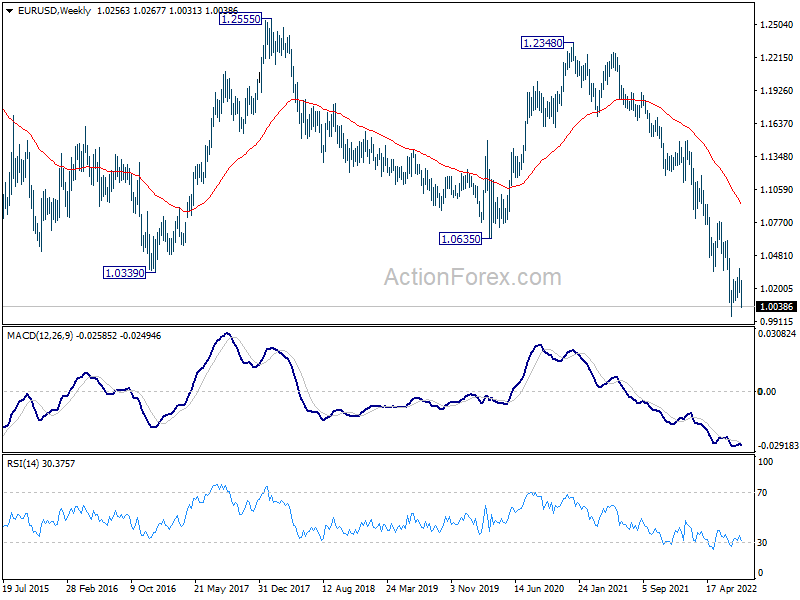
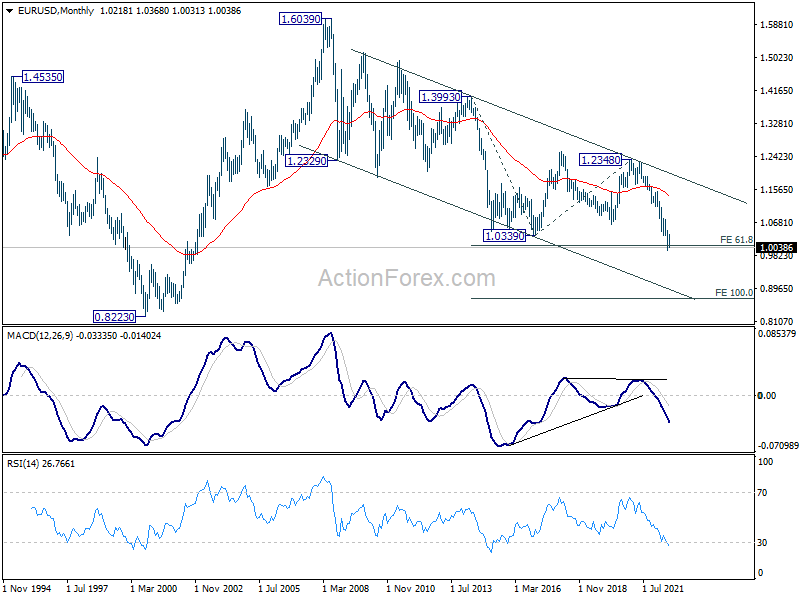
In the bigger picture, down trend from 1.6039 (2008 high) is still in progress. Next target is 100% projection of 1.3993 to 1.0339 from 1.2348 at 0.8694. In any case, outlook will stay bearish as long as 1.0773 resistance holds, in case of strong rebound.
In the long term picture, long term down trend from 1.6039 (2008 high) resuming. Sustained break of 61.8% projection of 1.3993 to 1.0339 from 1.2348 at 1.0090 will pave the way to 100% projection at 0.8694.
Summary 8/22 – 8/26
Monday, Aug 22, 2022
[php_everywhere instance="1"]
Tuesday, Aug 23, 2022
[php_everywhere instance="2"]
Wednesday, Aug 24, 2022
[php_everywhere instance="3"]
Thursday, Aug 25, 2022
[php_everywhere instance="4"]
Friday, Aug 26, 2022
[php_everywhere instance="5"]
The Weekly Bottom Line: How Quickly to Raise Rates? That Is the Question
U.S. Highlights
- Total retail sales were flat in July, marking a deceleration from June’s pace. However, sales in the control group, which exclude several volatile categories and are used in calculating GDP, rose a sturdy 0.8% m/m.
- Housing continued to cool in July. Existing home sales fell 5.9% and the median seasonally adjusted home price retreated for the second month in a row. Homebuilders also continued to ease off the accelerator, with starts down 9.6% in July.
- Minutes from last month’s FOMC meeting revealed that many participants acknowledged the risks that that the Committee could tighten the stance of policy by “more than necessary”.
Canadian Highlights
- Headline inflation cooled a bit to 7.6% y/y in July on lower fuel prices. However, inflation remains uncomfortably high, and is not hitting all households equally.
- Core inflation measures ticked higher last month, supporting the case for an aggressive September BoC hike.
- Growth indicators released this week generally confirmed that economic growth is cooling. The BoC faces an increasingly tough task of engineering a soft-landing.
U.S. - How Quickly to Raise Rates? That Is the Question
The third week of August was a busy data week for the U.S., with updates on housing and the consumer for July. The consumer spent a little more than expected at retailers (omitting auto dealers and gas stations), thanks to a successful Amazon Prime Day event, but housing is continuing to recalibrate to the higher rate environment.
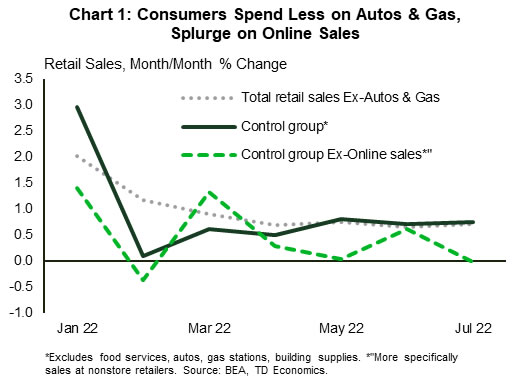
Headline retail sales were flat in July, marking a deceleration from June’s 0.8% month-over-month (m/m) gain. However, the headline measure was dragged down by sales auto & part dealers (-1.6%) and gasoline stations (-1.8%), the latter reflecting lower prices at the pump. Retail sales in all other categories rose a sturdy 0.7% m/m. Similarly, sales in the control group, which strip a couple of more categories from the total and are used in calculating personal consumption expenditures and GDP, were up 0.8% m/m thanks to a boost from sales at non-store retailers (Chart 1). Total CPI inflation was flat in July, so by these measures, real goods consumer spending appears to have had a decent start to the third quarter.
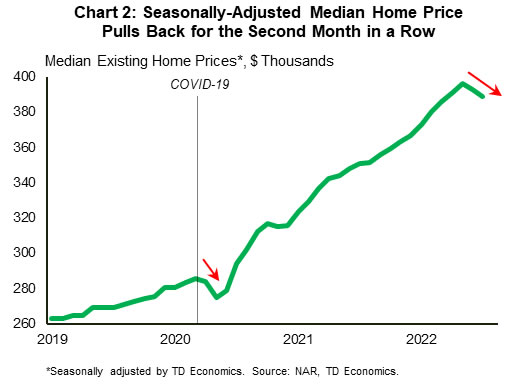
Consumers also spent handsomely at building material and supply dealers last month (+1.5% m/m), a move that went against the grain of the ongoing weakening in housing. Existing home sales fell by almost 6% in July, extending their downward slide from the start of the year to a staggering 26%. Home prices have also been feeling the impact of higher rates, with the median seasonally adjusted home price falling in each of the last two months (Chart 2). The fact that mortgage rates have eased a bit over the past several weeks could provide an opportunity for the housing rout to take a breather. However, the Fed is not done hiking rates, so affordability is likely to remain a meaningful constraint for the foreseeable future. As a result, we expect home sales to continue trending moderately lower through the first half of next year.
Homebuilders have continued to ease off the accelerator amidst this challenging market backdrop, with starts falling 9.6% in July. The weakness in homebuilding over the last several months has been concentrated in the single-family market. A recent sharp decline in homebuilder confidence in this sector suggests that the trend is poised to continue.
The fallout from the downturn in the housing market is only one factor the Fed must consider as it gears up to raise rates again next month. Minutes from last month’s FOMC meeting revealed that many members acknowledged the risks that the Committee could tighten the stance of policy by “more than necessary”. In addition, participants judged that as the policy rate is tightened further “it would become appropriate at some point to slow the pace of policy rate increases” to assess the impacts. Markets interpreted this as a signal that the pace of rate hikes would slow soon, but a few Fed officials (i.e., Bullard, voting member, backs a 75-basis point (bp) hike next) appeared to push back against that notion. For now, markets are pricing in a 50-bp hike at the next meeting. Chair Powell’s Jackson Hole speech next Friday will be closely watched to gauge the Fed’s latest thinking as to where rate hikes are headed.
Canada -Hot to the Core
Canadian financial markets had their eyes fixed squarely on this week's inflation report - the last ahead of the Bank of Canada's rate decision on September 7th. Bond markets reacted by taking short-term yields a bit higher on the week, as core inflation pressures intensified in July. We expect the Bank of Canada to hike their policy rate by 50 basis points (bps) at their September meeting, but the inflation data does tilt the risk to a 75 bp move.
Whether it's 50 or 75 bps, the move likely won't elicit the same sticker-shock as their surprise 100 bp hike in July. However, it would still represent an aggressive increase, and be consistent with messaging from Governor Macklem that it's better to front-load tightening now, rather than having to be more aggressive later. It will also probably not be their last hike. As detailed in our latest quarterly outlook piece they've communicated a need to move rates above their estimate of the neutral range (i.e., above 3%) to maintain credibility.
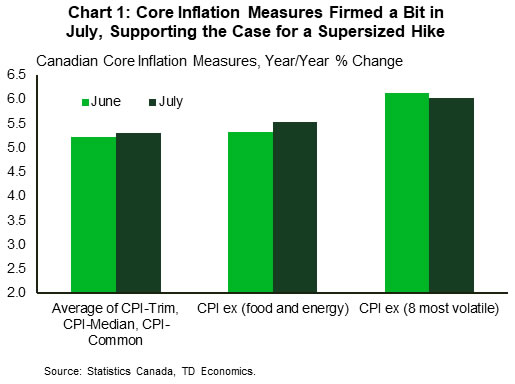
Looking at the details of July's CPI data, overall inflation cooled a bit to 7.6% year/year (y/y) on a big drop in fuel prices. However, the metric that policymakers tend to put more weight on is core inflation. Nearly all measures of core inflation perked up in July (Chart 1). Even the metrics that didn’t move higher, like CPI-trim, remained uncomfortably high, underscoring the case for an aggressive September salvo.
A 7.6% inflation rate is still much too elevated, and high inflation impacts everybody, albeit not to the same degree. Our research put out this week, notes that it's likely middle-income households that have been hit the hardest by inflation, given their relatively high share of spending on food and transportation.
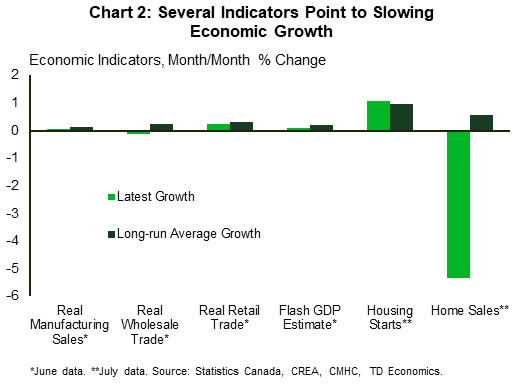
Ultimately inflation saps purchasing power and weighs on growth in real terms, and this week featured a series of releases offering clarity on how growth is faring. The main message from nearly all these indicators is that growth is slowing (Chart 2), consistent with the soft flash estimate for June's monthly GDP growth. On top of this, TD's high-frequency internal credit and debit card spending data is showing signs of easing as the summer rolls on.
The BoC did forecast slower growth in the third quarter in their July MPR, and some easing in economic activity is required to bring inflation down. Like the Fed, the BoC is trying to engineer a "soft-landing" scenario, where economic growth is below-trend for a time, but still positive, and inflation cools. That's an incredibly tough balance to strike, and with the persistent heat in core inflation, the chances of this outcome unfolding are likely diminishing.