Sample Category Title
GBP/USD Mid-Day Outlook
Daily Pivots: (S1) 1.1876; (P) 1.1978; (R1) 1.2033; More...
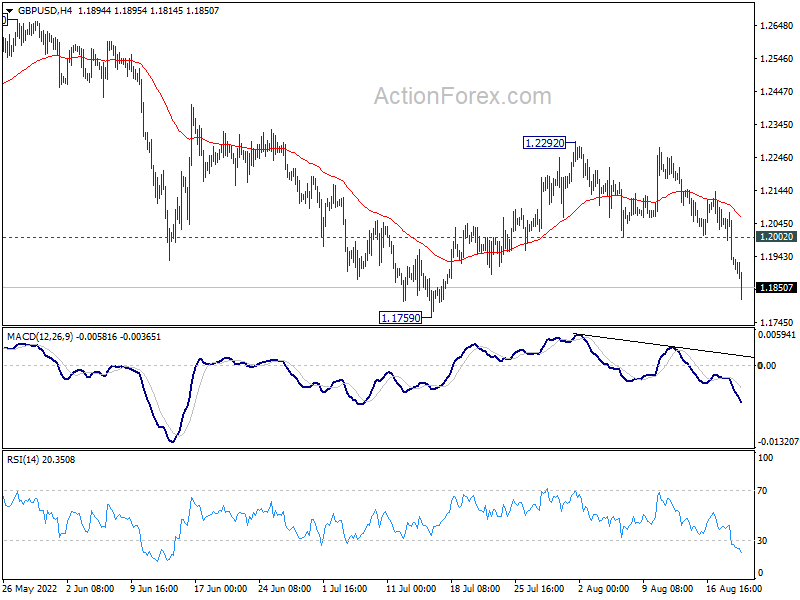
GBP/USD's fall accelerates to as low as 1.1814 so far and intraday bias stays on the downside for retesting 1.1759 support. Firm break there will resume larger down trend Next target is 1.1409 low. On the upside, above 1.2002 support turned resistance will turn intraday bias neutral first. But risk will stay on the downside as long as 1.2292 resistance holds.
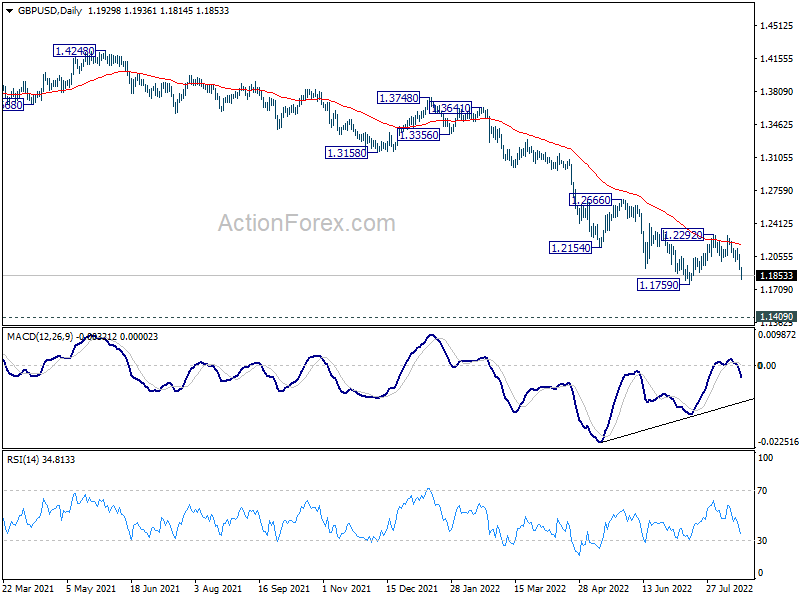
In the bigger picture, fall from 1.4248 (2018 high) could be a leg inside the pattern from 1.1409 (2020 low), or resuming the longer term down trend. Deeper decline is expected as long as 1.2666 resistance holds. Next target is 1.1409 low. However, firm break of 1.2666 will bring stronger rise back to 55 week EMA (now at 1.2897).
Dollar Continues Strong Rally, Swiss Franc Catching Up
Dollar rally continues today and it's set to end the week on a high note. Risk aversion and rising benchmark yield are both helping the greenback. Swiss Franc is also strengthening a lot. Selling focuses are mainly concentrated on Sterling, Euro, and Yen, even though commodity currencies are also soft.
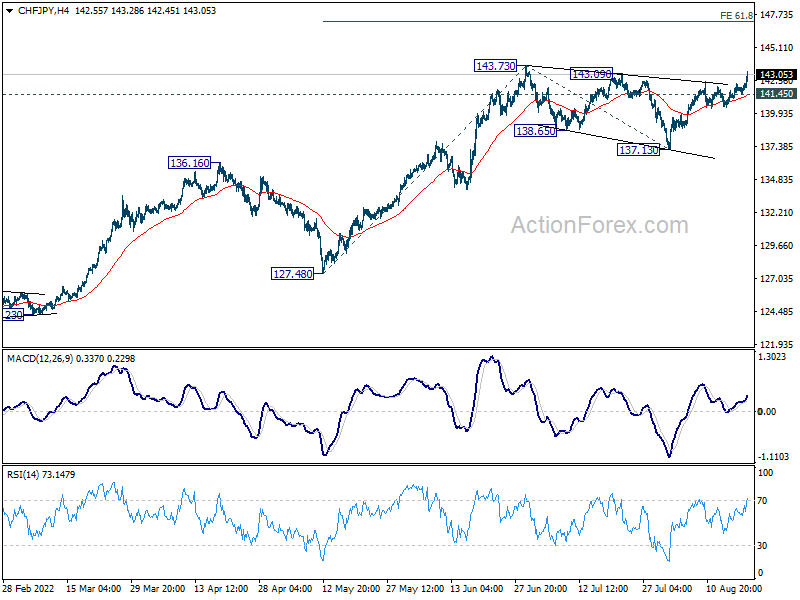
Technically, the rally in CHF/JPY is rather impressive, and it affirms the case that correction from 143.73 has completed with three waves down to 137.13. That is, larger up trend is ready to resume. For now, further rally is expected as long as 141.45 support holds. Firm break of 143.73 (probably next week) will pave the way to 61.8% projection of 127.48 to 143.73 from 137.13 at 147.17.
In Europe, at the time of writing, FTSE is up 0.17%. DAX is down -0.66%. CAC is down -0.55%. Germany 10-year yield is up 0.1122 at 1.214. Earlier in Asia, Nikkei dropped -0.04%. Hong Kong HSI rose 0.05%. China Shanghai SSE dropped -0.59%. Singapore Strait Times dropped -0.82%. Japan 10-year JGB yield rose 0.0011 to 0.201.
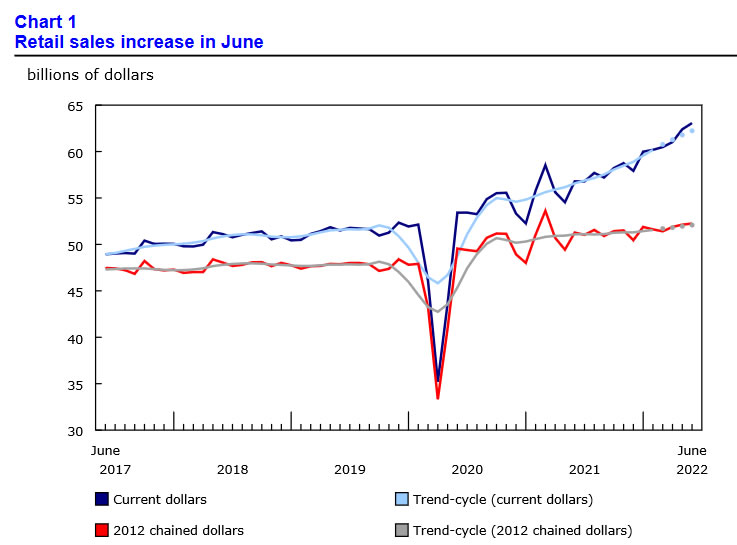
Canada retail sales rose 1.1% mom in Jun, core sales up 0.2% mom
Canada retail sales rose 1.1% mom to CAD 63.1B in June, above expectation of 0.4% mom. That's also the sixth consecutive monthly increase. Sales were up in 8 of 11 subsectors, representing 76.8% of retail trade. Core retail sales, excluding gasoline stations and motor vehicle and parts, rose 0.2% mom.
In the advance estimate, retail sales dropped -2.0% mom in July.
UK retail sales volume rose 0.3% mom in Jul
In volume term, UK retail sales rose 0.3% mom in July, better than expectation of -0.2% mom. Ex-auto sales rose 0.4% mom. Comparing to a year ago, retail sales dropped -3.4% yoy while ex-auto sales dropped -3.0% yoy.
In value term, retail sales rose 1.3% mom, 7.8% yoy. Ex-auto sales rose 1.4% mom, 5.7% yoy.
From Germany, PPI rose 5.3% mom, 37.2% yoy in July, above expectation of 0.5% mom, 31.5% yoy.
UK Gfk consumer confidence drooped to -44, another record low
UK Gfk consumer confidence dropped from -41 to -44 in August, hitting another record low. Personal financial situation over the next 12 months dropped from -26 to -31. General economic situation over the next 12 months dropped from -57 to -60, setting a new record low.
Joe Staton, Client Strategy Director, GfK says: "The Overall Index Score dropped three points in August to -44, the lowest since records began in 1974. All measures fell, reflecting acute concerns as the cost-of-living soars. A sense of exasperation about the UK's economy is the biggest driver of these findings."
Japan CPI core rose to 2.4% yoy, highest since 2014
Japan headline CPI rose from 2.4% yoy to 2.6% yoy in July, above expectation of 2.2% yoy. CPI core (all items ex-fresh food) rose from 2.2% yoy to 2.4% yoy, matched expectations. CPI core-core (all items ex-food, energy) rose from 1.0% yoy to 1.2% yoy, above expectations of 0.6% yoy.
Core inflation has now exceeded BoJ's 2% target for four straight months, and hit the highest level since December 2014. The core-core reading was also the fastest since December 2015, while the headline reading was the strongest since 2008.
Both Prime Minister Fumio Kishida and BoJ Governor Haruhiko Kuroda have called for robust wage gains to ensure that inflation is sustainable. But the markets are expecting some pressure on the BoJ for acting on monetary policy if CPI hits 3%.
New Zealand goods exports rose 16% yoy in Jul, imports rose 26% yoy
New Zealand goods exports rose 16% yoy to NZD 6.7B in July. Goods imports rose 26% yoy to NZD 7.8B. Trade deficit came in at NZD -1.1B, comparing expectation of NZD 105m surplus.
China led the monthly rise in exports, up 13%. Exports to Australia was down -1.1%, USA up 5.8%, EU up 7.5%, Japan up 18%. Imports from China was up 19%, EU up 3.0%, Australia up 16%, USA up 34%, and Japan up 54%.
GBP/USD Mid-Day Outlook
Daily Pivots: (S1) 1.1876; (P) 1.1978; (R1) 1.2033; More...
GBP/USD's fall accelerates to as low as 1.1814 so far and intraday bias stays on the downside for retesting 1.1759 support. Firm break there will resume larger down trend Next target is 1.1409 low. On the upside, above 1.2002 support turned resistance will turn intraday bias neutral first. But risk will stay on the downside as long as 1.2292 resistance holds.
In the bigger picture, fall from 1.4248 (2018 high) could be a leg inside the pattern from 1.1409 (2020 low), or resuming the longer term down trend. Deeper decline is expected as long as 1.2666 resistance holds. Next target is 1.1409 low. However, firm break of 1.2666 will bring stronger rise back to 55 week EMA (now at 1.2897).
Economic Indicators Update
| GMT | Ccy | Events | Actual | Forecast | Previous | Revised |
|---|---|---|---|---|---|---|
| 22:45 | NZD | Trade Balance (NZD) Jul | -1092M | 105M | -701M | -1102M |
| 23:01 | GBP | GfK Consumer Confidence Aug | -44 | -42 | -41 | |
| 23:30 | JPY | National CPI Core Y/Y Jul | 2.40% | 2.40% | 2.20% | |
| 06:00 | EUR | Germany PPI M/M Jul | 5.30% | 0.50% | 0.60% | |
| 06:00 | EUR | Germany PPI Y/Y Jul | 37.20% | 31.50% | 32.70% | |
| 06:00 | GBP | Retail Sales M/M Jul | 0.30% | -0.20% | -0.10% | -0.20% |
| 06:00 | GBP | Retail Sales Y/Y Jul | -3.40% | -3.30% | -5.80% | -6.10% |
| 06:00 | GBP | Retail Sales ex-Fuel M/M Jul | 0.40% | -0.20% | 0.40% | 0.20% |
| 06:00 | GBP | Retail Sales ex-Fuel Y/Y Jul | -3.00% | -2.80% | -5.90% | -6.20% |
| 06:00 | GBP | Public Sector Net Borrowing (GBP) Jul | 4.2B | 25.3B | 22.1B | 20.1B |
| 08:00 | EUR | Eurozone Current Account(EUR) Jun | 4.2B | -3.3B | -4.5B | -6.9B |
| 12:30 | CAD | Retail Sales M/M Jun | 1.10% | 0.40% | 2.20% | 2.30% |
| 12:30 | CAD | Retail Sales ex Autos M/M Jun | 0.80% | 0.90% | 1.90% |
Canada retail sales rose 1.1% mom in Jun, core sales up 0.2% mom
Canada retail sales rose 1.1% mom to CAD 63.1B in June, above expectation of 0.4% mom. That's also the sixth consecutive monthly increase. Sales were up in 8 of 11 subsectors, representing 76.8% of retail trade. Core retail sales, excluding gasoline stations and motor vehicle and parts, rose 0.2% mom.
In the advance estimate, retail sales dropped -2.0% mom in July.
EURAUD Hovers Near a Key Support Zone
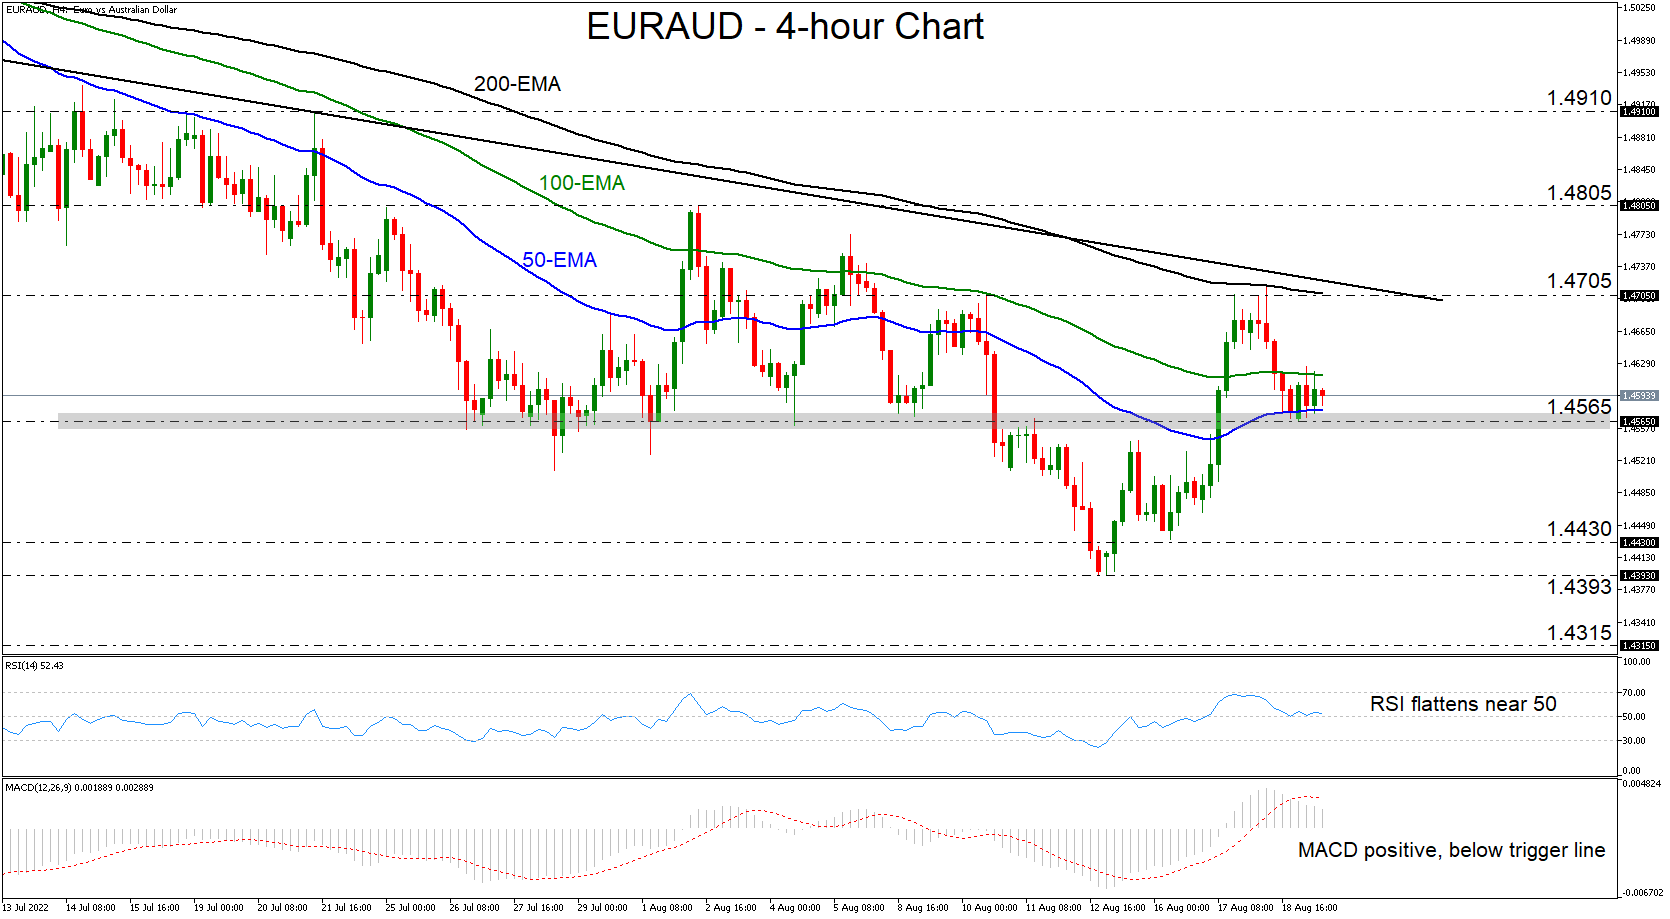
EURAUD came under selling interest yesterday, after hitting resistance at the 200 – period exponential moving average (EMA), fractionally above the 1.4705 barrier, and slightly below the downside line drawn from the July 11 high. Although this keeps the prevailing downtrend intact, in the current session, the pair consolidated near the important support zone of 1.4565.
The cautiously negative outlook is also supported by both our oscillators. The RSI moved lower but stopped and flattened near its equilibrium 50 line, while the MACD, even though it lies below its trigger line and points south, has yet to obtain a negative sign. These technical indications imply that the pair has not started to gather pure negative speed yet.
A break below 1.4565 would confirm a lower low on the 4-hour chart and may initially pave the way towards the 1.4430 barrier, which is the low of August 16, or the 1.4393 hurdle, marked by Monday’s low. If that zone is not able to withstand the pressure either, then the fall may get extended towards the 1.4315 territory, defined as a support by the low of April 5.
The outlook could brighten upon a strong recovery above the aforementioned downtrend line. In this case, EURAUD would already be above the 200-EMA and the 1.4705 barrier and thus, the bulls may get encouraged to climb to the peak of August 2 at 1.4805. Should they breach that resistance as well, they could shoot for the 1.4910 zone, which acted as a temporary ceiling between July 13 and 21.
To recap, EURAUD remains below a downtrend line taken from the high of July 11, but the bears are struggling to overcome the key support of 1.4565. A break below that zone may be the invitation sidelined bears are waiting for.
USD/CAD Eyes 130, Retail Sales Next
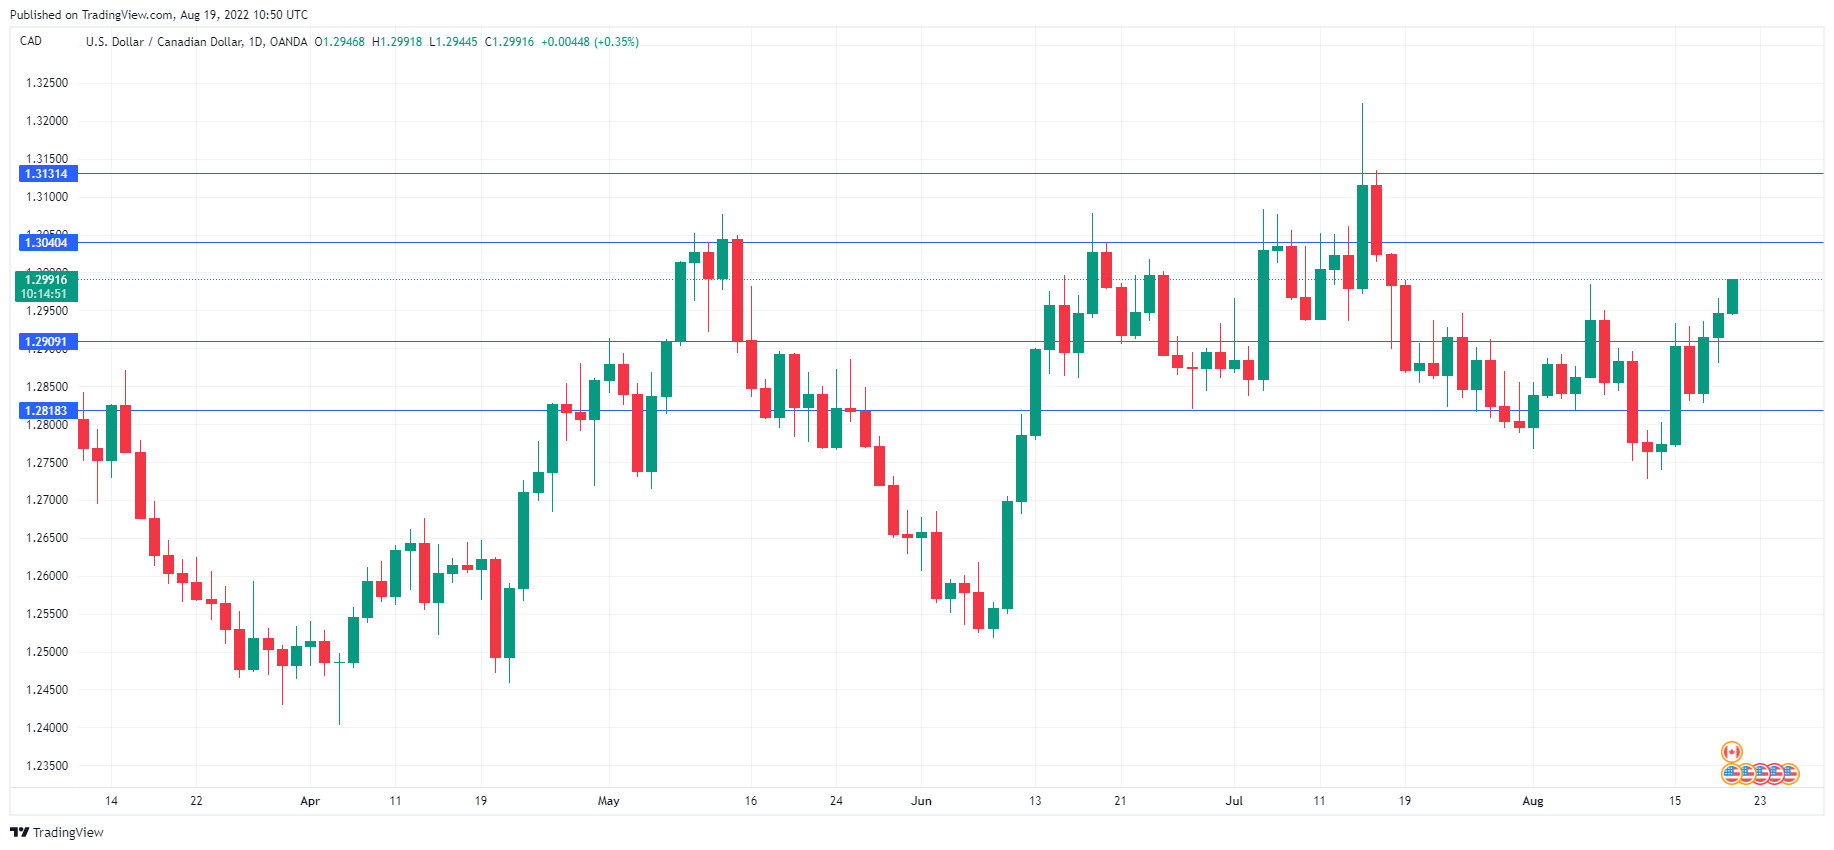
The Canadian dollar is lower for a third straight day. In the European session, USD/CAD is trading at 1.2984, up 0.29% on the day.
Markets brace for soft Canadian retail sales
The US dollar has rebounded this week against the majors, including the Canadian dollar. USD/CAD is on the verge of breaking above the 1.30 line, which has held firm since July 18th. A weak Canadian retail sales report later today could send the Canadian dollar into 130-territory. Retail sales for July is expected to slow to 0.3% MoM, down sharply from the 2.2% gain in June. Core retail sales is projected to drop to 0.9% MoM, down from 1.9%.
Canadian consumers have been hit hard by the cost-of-living crisis, and a natural response has been to cut down on spending. This could prove a major headache for the economy, as domestic demand is a key driver of growth. Canada’s inflation has been heading toward double-digits, but as in the US, inflation dropped in July. Canada’s CPI slowed to 7.6% YoY, down from 8.1% in June, which marked a 40-year high. However, CPI common, a core CPI indicator, rose to 5.5% YoY in July, up from 5.3% in June. This is the Bank of Canada’s preferred gauge and means that the BoC, like the Fed, is not planning any U-turns in policy. We’ll have to wait for additional data to determine if headline inflation has peaked or whether the July release was a one-time blip. Even if inflation is easing, it is expected to fall very slowly, which means that consumers will feel the economic pain for some time to come.
The BoC meets again next month, and the markets are expecting a 50 basis point increase, with a 25% of a 75bp hike. In July, the central bank surprised the markets with a super-size 100bp increase, the first G-7 country to deliver such a large rate hike in the post-Covid era.
USD/CAD Technical
- There is resistance at 1.3040 and 1.3131
- USD/CAD has support at 1.2909 and 1.2818
Research US – Higher for Longer
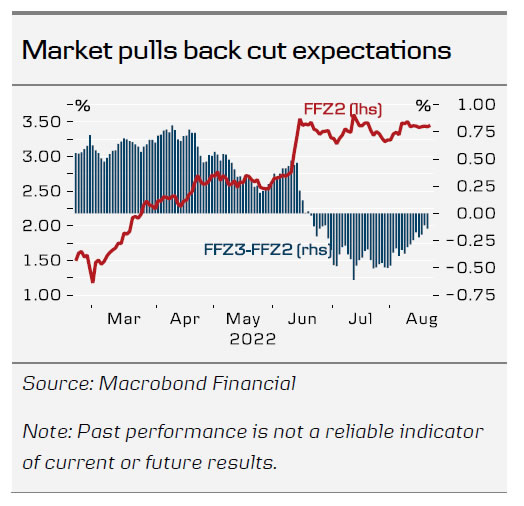
- A higher interest rate for longer looks to be the way forward for Federal Reserve. We expect it to hike Fed Funds rate at least another 125bp and keep it here.
- The market agrees and discounts another 121bp hikes this year and now only discounts 14bp of interest cuts next year from 50bp in July.
- In our view, the US output gap turned positive and the economy needs a period of restrictive monetary policy to return to equilibrium.
If the US economy is on the brink of recession, the front end of the US money market curve is not paying attention. The money market discounted 50bp interest cuts from Federal Reserve next year in July. It only discounts 14bp now. We find it reasonable for the market to pull back on expectations for interest rate cuts next year. Further, a couple of excerpts from the latest FOMC Minutes published on Wednesday backs our view.
"Even so, with inflation elevated and expected to remain so over the near term, some participants emphasized that the real federal funds rate would likely still be below shorter-run neutral levels after this meeting's policy rate hike."
The 1Y real interest rate based on consumer's inflation expectations (we use an average of surveys from University of Michigan, New York Federal Reserve and Conference Board) is about 1.5pp below the peak in 2018. In our view, Federal Reserve needs to increase the real interest rate to at least this level to combat inflation and possible even more. At least another 125bp of hikes over the coming months, as we expect, in combination with a moderation of inflation expectations would likely do the trick.
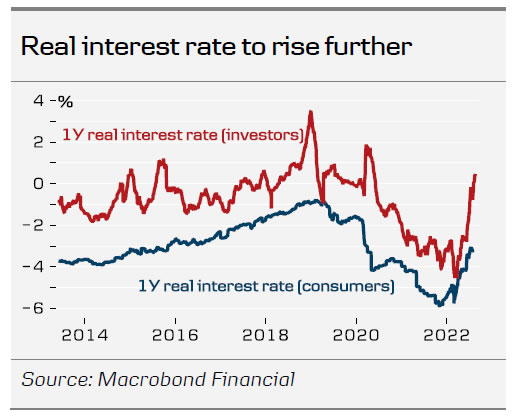
Financial conditions eased over the summer and some commodity prices started to recover - another signal that monetary policy is not restrictive enough yet. Thus, in order to avoid a resurgence in inflation, Federal Reserve needs to appreciate the USD, increase yields, weaken equities and/or widen credit spreads through tighter monetary policy.
"Some participants indicated that, once the policy rate had reached a sufficiently restrictive level, it likely would be appropriate to maintain that level for some time to ensure that inflation was firmly on a path back to 2 percent."
Real GDP recovered near the pre-pandemic trend, but labour force participation remains lower. We do not think the economy has reached a new equilibrium, but rather that the output gap turned positive. The imbalance is the most evident in labour markets, where despite the recent easing in labour demand, job openings per unemployed remain near record-levels.
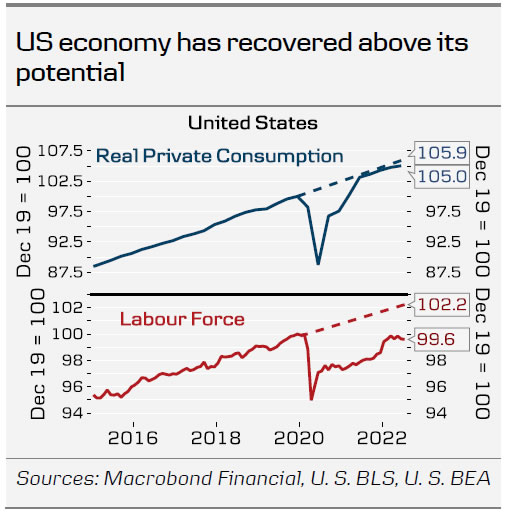
Unless demand is brought back to equilibrium, US economy could face an extended period of inflation exceeding the 2% target. Keeping interest rates at a mildly restrictive level for a period of time is one way to get rid of excess demand. Another would be to raise interest rates to a very restrictive level, e.g. by another 2-300bp. That would lead to a faster normalisation and open up for interest cuts next year. The money market, Federal Reserve and we lean towards the former scenario.
USDCHF Needs Boost from Buyers to Switch the Outlook to Bullish
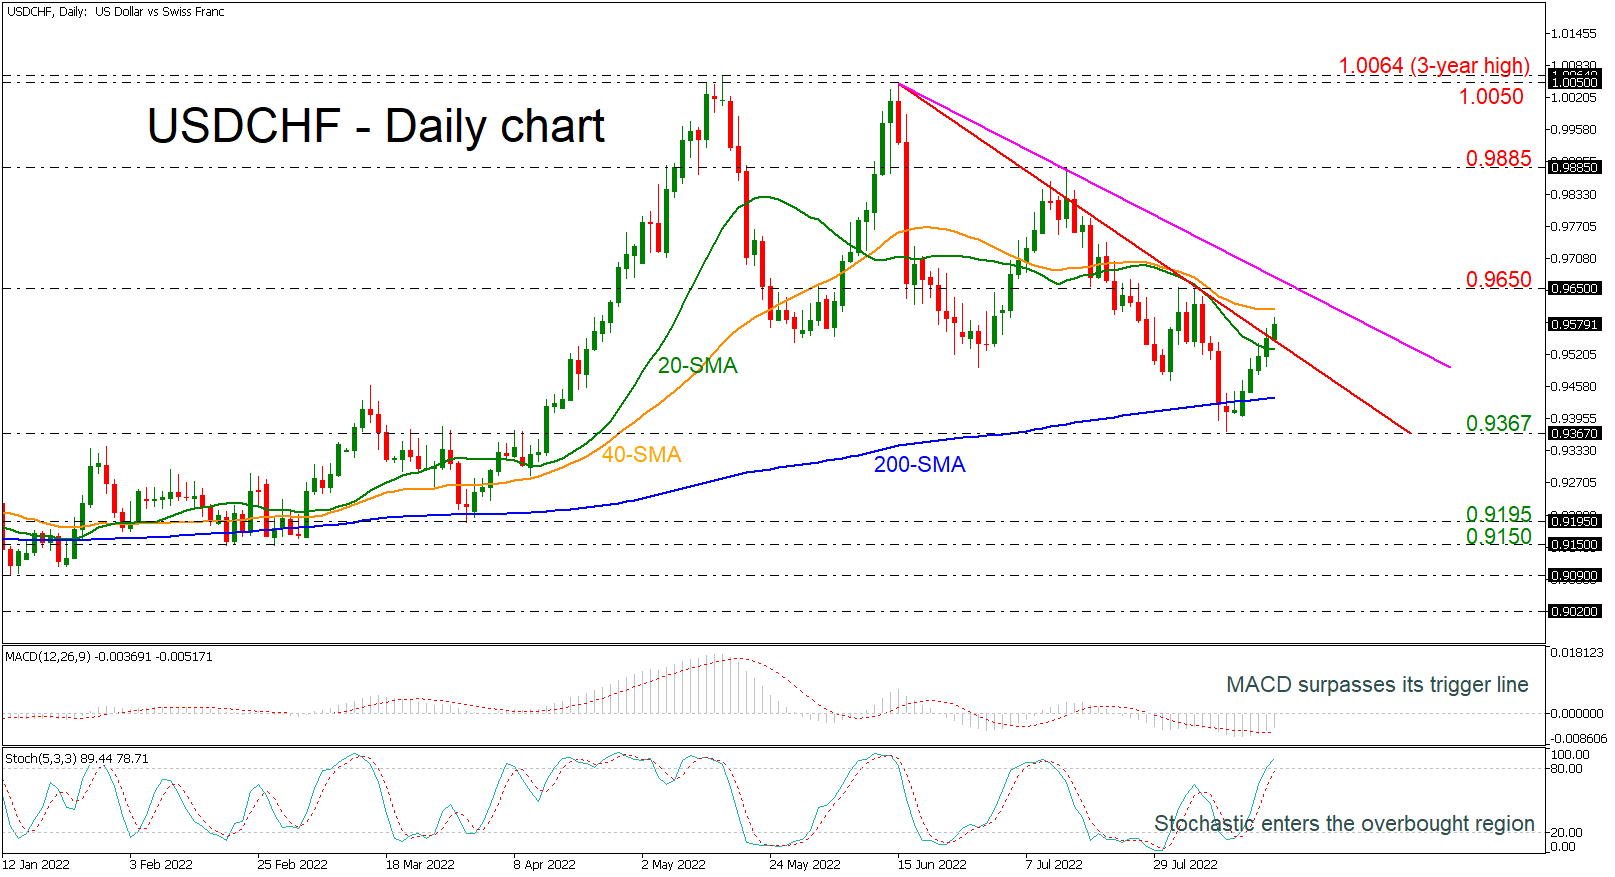
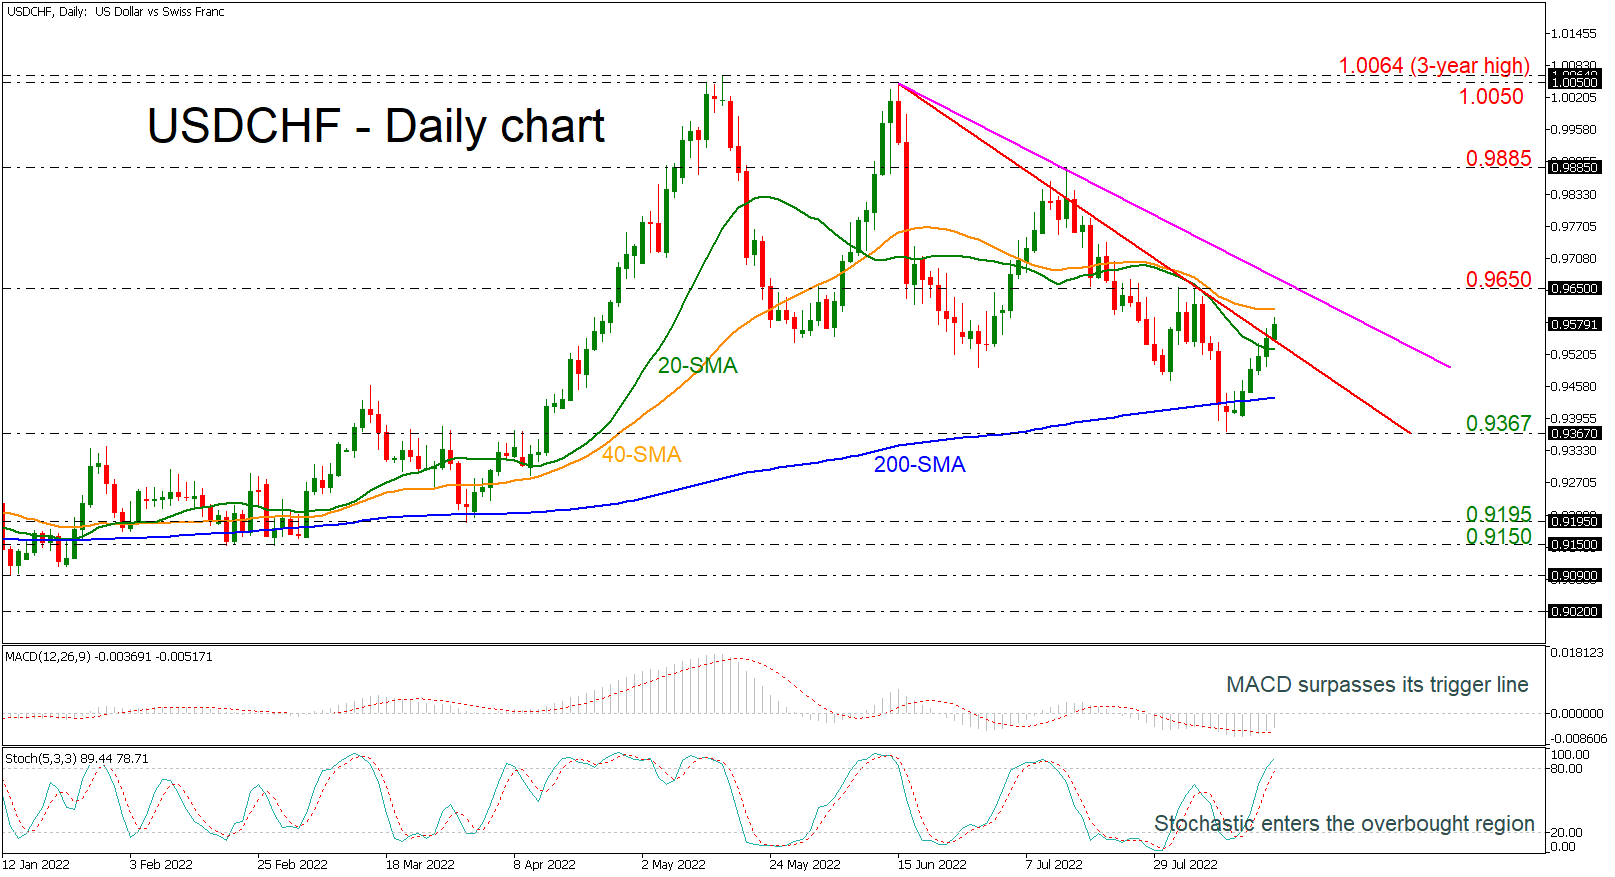
USDCHF is in the process to post the fifth straight day of gains, following the pullback off the 0.9367 support level. The pair jumped above the 200-day simple moving average (SMA) again and is trying to have a closing day beyond the short-term declining trend line from June 15. Moreover, there is another tentative line a bit higher, so a break above it should be a confirmation of a bullish correction move.
In trend indicators, the MACD oscillator is holding above its trigger line in the negative territory, while the stochastic is standing in the overbought region, both suggesting that the next move would be to the upside rather to the downside.
Should USDCHF make another run higher, it’s likely to meet resistance at the immediate 40-day SMA at 0.9610 as this level has strongly capped prices over the last month. A successful climb above this key resistance area would open the way for the 0.9650 barrier, which coincides with the next descending trend line. A penetration of this line too, would endorse the positive momentum, driving the market until the 0.9885 high.
If prices turn lower, the 20-day SMA at 0.9530 is the nearest support that could halt steeper declines. A potentially more important support, though, is the 200-day SMA at 0.9440. If breached, it would shift the focus to the downside and prices would slip towards 0.9367 before creating a lower low near 0.9195.
Overall, USDCHF would need to make a sustained climb above 0.9650 in order for the outlook to become convincingly bullish.
Bitcoin Failed to Hold, Testing Key Levels Again
Market picture
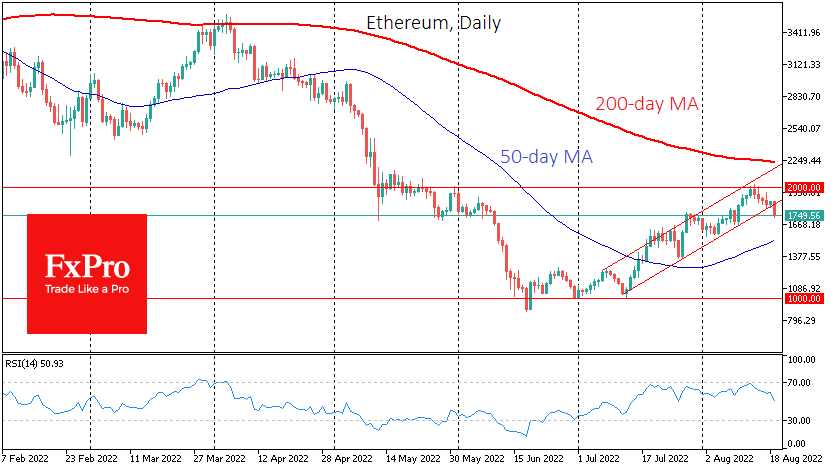
Bitcoin was almost flat on Thursday but started Friday with a 6% plunge, momentarily dropping to $21.5K. Ethereum is losing 4.5% overnight to $1760. Leading altcoins are down 7% (XRP) to 12% (Solana).
Total crypto market capitalisation is down 4.2% to $1.07 trillion, according to CoinMarketCap.
Bitcoin’s fall below $22.5K is a formal break of the upward corridor of the past two months, as a sequence of increasingly higher local lows is broken. Currently, BTCUSD is testing the 50-day moving average, which could act as an uptrend indicator.
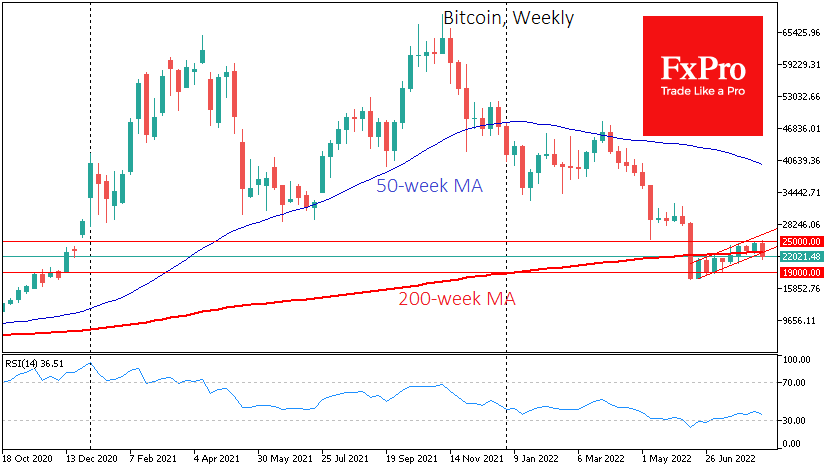
The current dip has made the fight for the 200-week average, which is now near $23K, relevant again. Closing the week below this level risks triggering another round of liquidation.
Altcoins are losing even more significantly, reflecting a dramatic shift in enthusiast sentiment from cautious buying to simultaneously locking in quick profits across a wide range of coins.
Additionally, the weakening of global equity indices and the deteriorating macroeconomic backdrop is worrying factor. At the same time, the crypto market is no longer oversold but not yet attractive to long-term investors.
We believe we will see similar sharp market movements again in the coming months.
News background
Arthur Hayes, former head of crypto exchange BitMEX, talked about two scenarios after Ethereum moves to the Proof-of-Stake (PoS) mining algorithm. If the fork is unsuccessful, ETH could fall sharply but hold above $800. If the merger is successful, an ETH rally should be expected, although it may be delayed, as in the case of bitcoin halving.
Korean authorities are investigating 16 crypto exchanges accused of breaking local laws and providing digital asset trading services to Korean citizens.
Tether, the issuer of the largest USDT stablecoin by capitalisation, has announced a partnership with accounting firm BDO Italia. Tether plans to move from reporting quarterly financial results to monthly reporting.
USDCHF Needs Boost from Buyers to Switch the Outlook to Bullish
USDCHF is in the process to post the fifth straight day of gains, following the pullback off the 0.9367 support level. The pair jumped above the 200-day simple moving average (SMA) again and is trying to have a closing day beyond the short-term declining trend line from June 15. Moreover, there is another tentative line a bit higher, so a break above it should be a confirmation of a bullish correction move.
In trend indicators, the MACD oscillator is holding above its trigger line in the negative territory, while the stochastic is standing in the overbought region, both suggesting that the next move would be to the upside rather to the downside.
Should USDCHF make another run higher, it’s likely to meet resistance at the immediate 40-day SMA at 0.9610 as this level has strongly capped prices over the last month. A successful climb above this key resistance area would open the way for the 0.9650 barrier, which coincides with the next descending trend line. A penetration of this line too, would endorse the positive momentum, driving the market until the 0.9885 high.
If prices turn lower, the 20-day SMA at 0.9530 is the nearest support that could halt steeper declines. A potentially more important support, though, is the 200-day SMA at 0.9440. If breached, it would shift the focus to the downside and prices would slip towards 0.9367 before creating a lower low near 0.9195.
Overall, USDCHF would need to make a sustained climb above 0.9650 in order for the outlook to become convincingly bullish.
XAU/USD: Impulse Structure Hints at Higher Levels
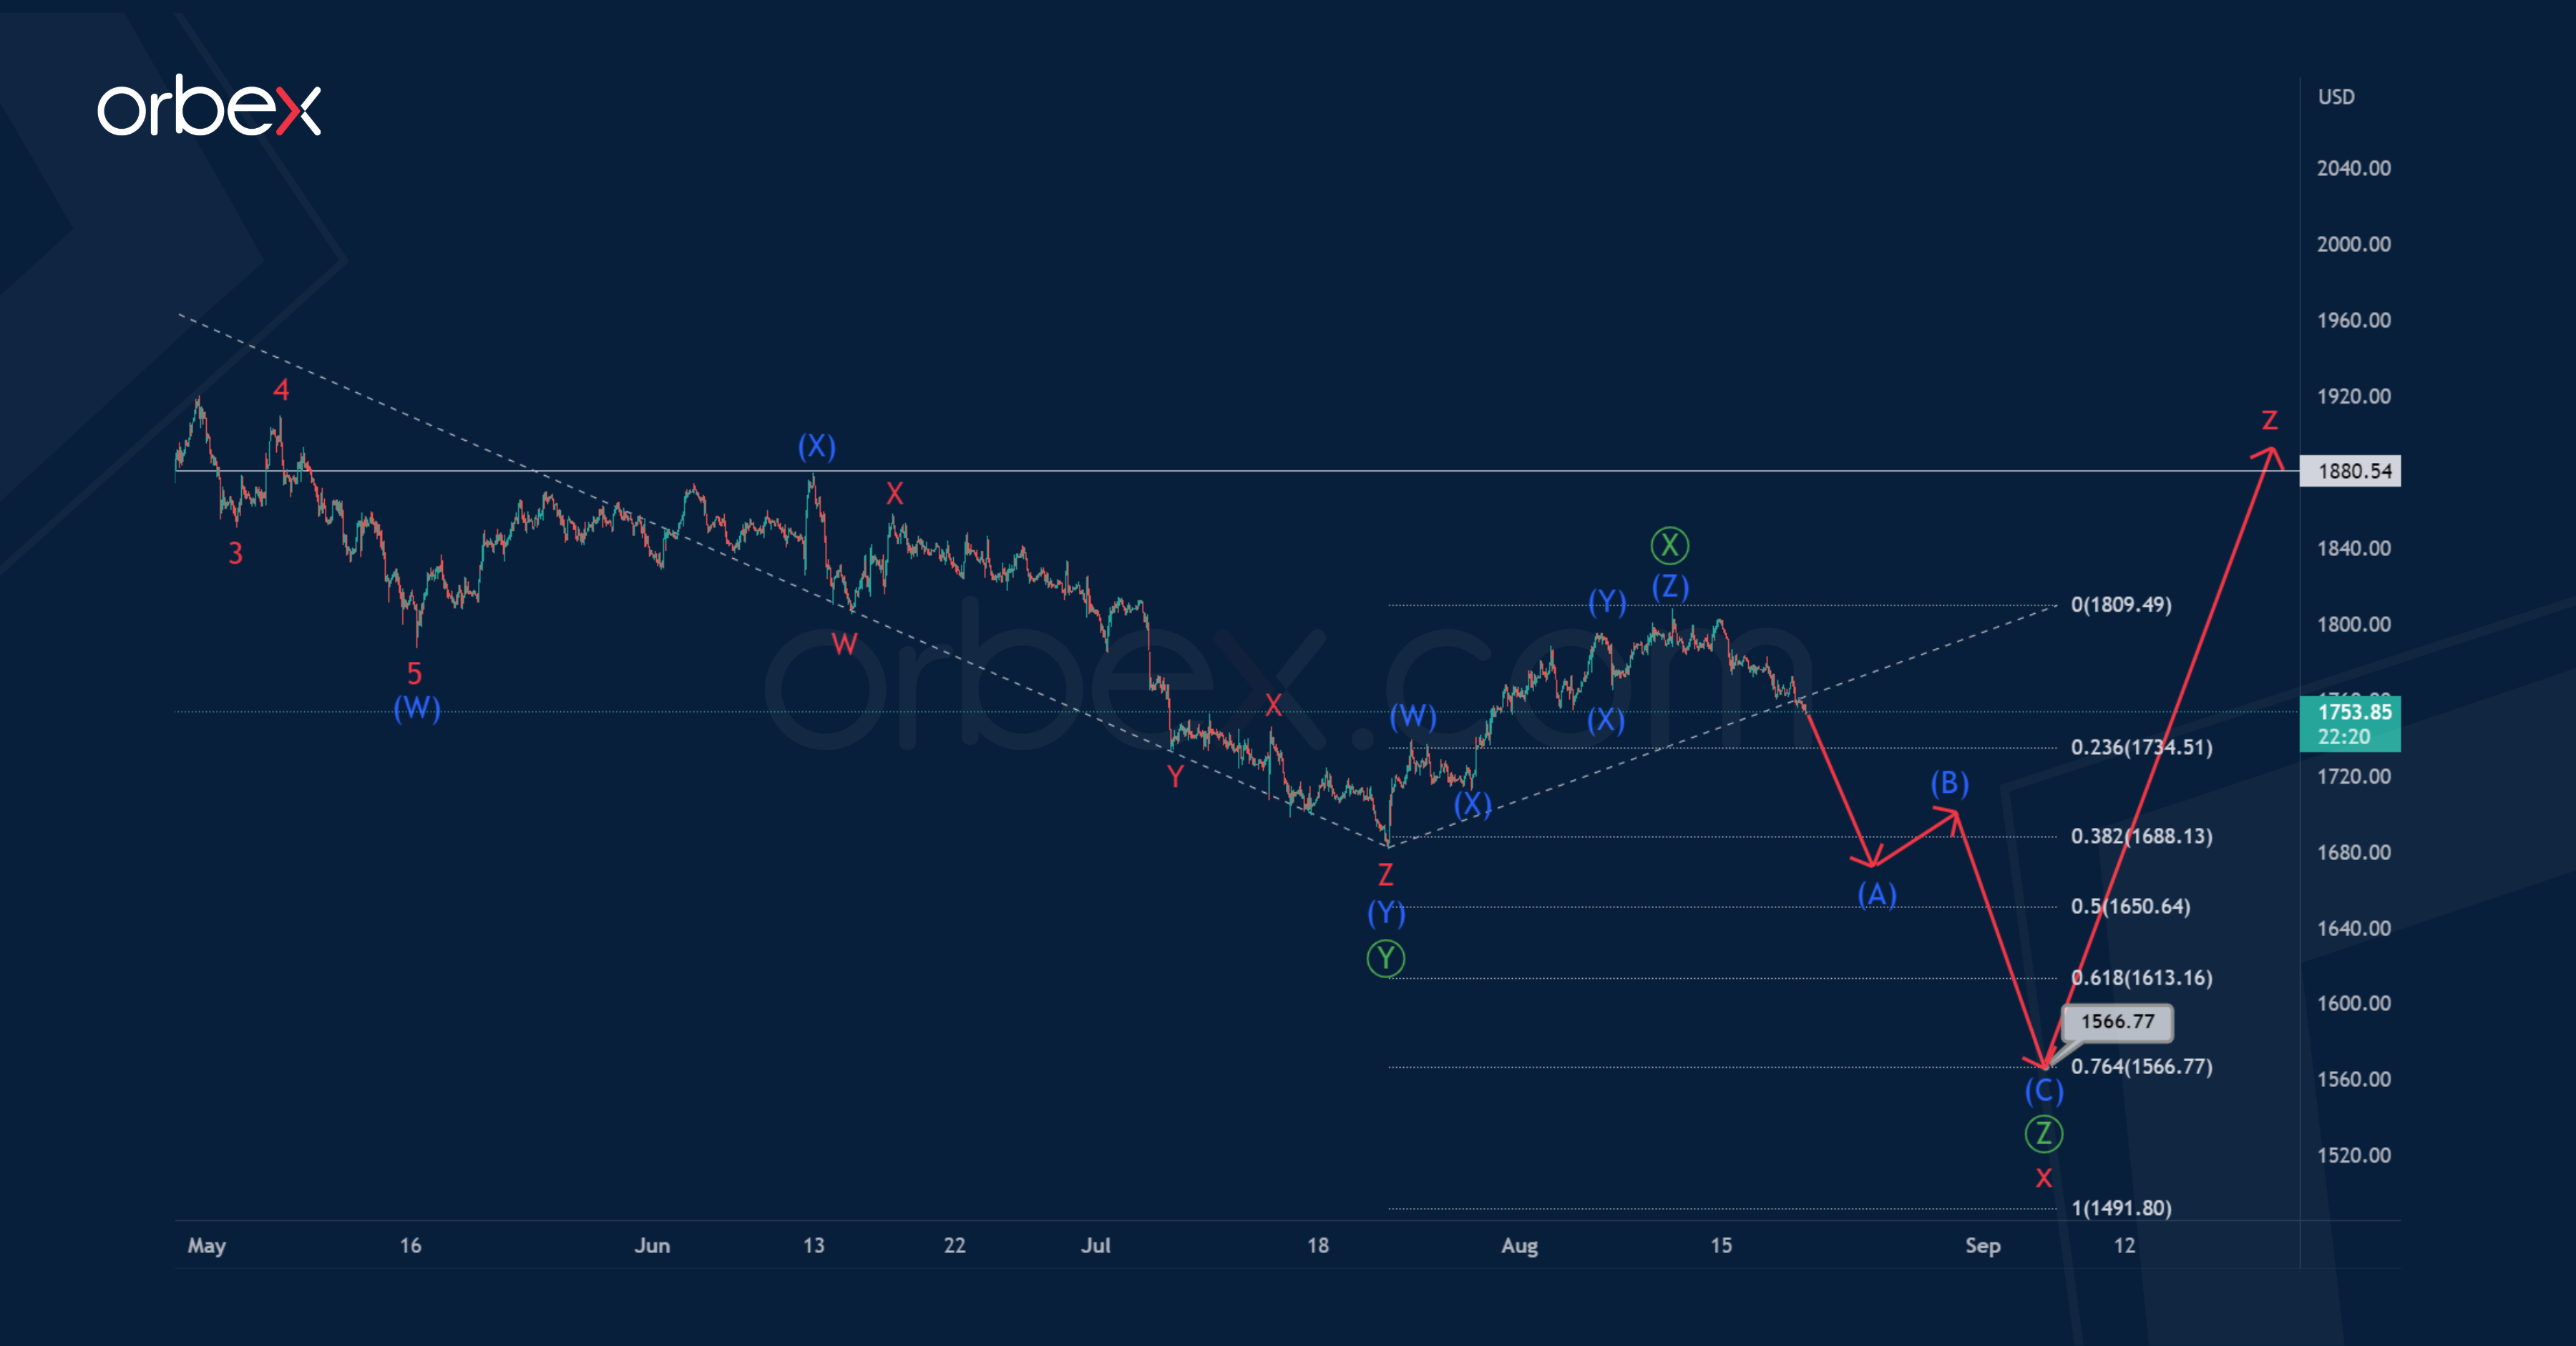
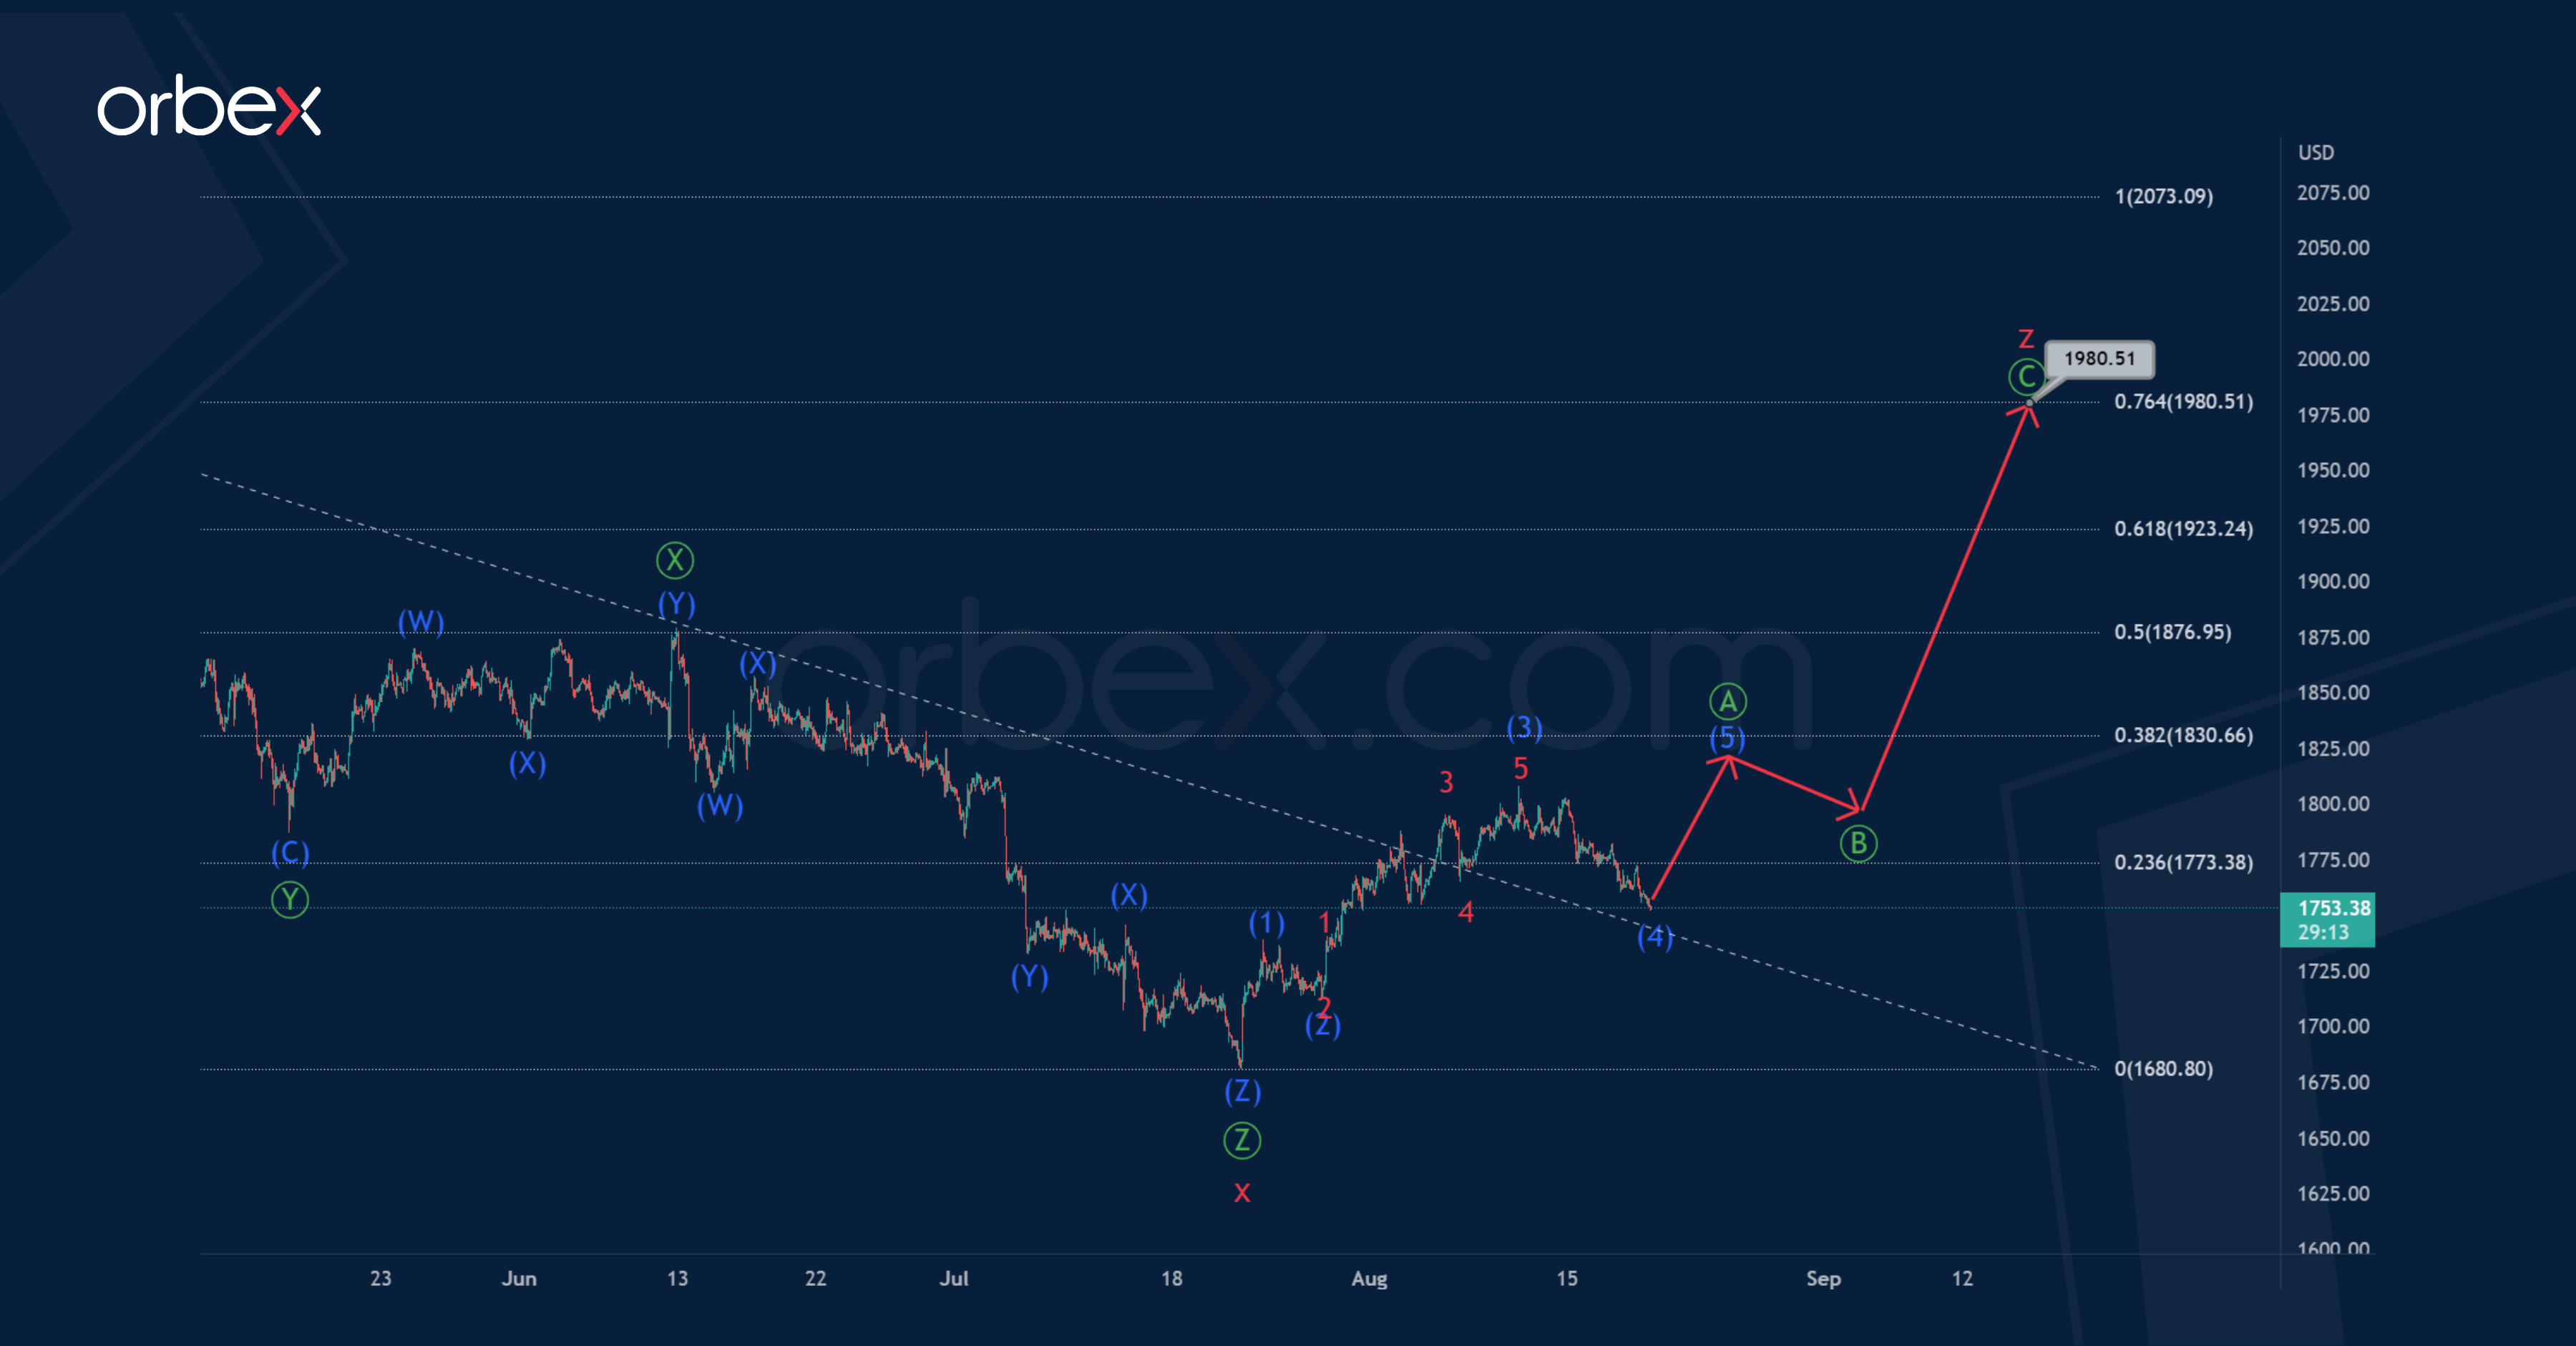
The internal XAUUSD structure suggests a global correction pattern, which takes the form of a cycle triple zigzag.
On the current chart, we see the structure of the bearish cycle intervening wave x, which looks completed in the form of a primary triple zigzag Ⓦ-Ⓧ-Ⓨ-Ⓧ-Ⓩ.
Perhaps, after the completion of the cycle wave x, the market turned around and began to move up. That is, the initial part of the cycle wave z is being built now. It can take the form of a primary standard zigzag Ⓐ-Ⓑ-Ⓒ, as shown in the chart.
The price of gold in the wave z may rise to the price mark of 1980.51. At that level, it will be at 76.4% of previous actionary wave y of the cycle degree.
In an alternative scenario, a continuation of the downward price movement in the cycle wave x is expected. Wave x is also a triple zigzag Ⓦ-Ⓧ-Ⓨ-Ⓧ-Ⓩ, but the final primary wave is still under development.
A downward movement of XAUUSD is expected in the near future. The primary wave Ⓩ may take the form of an intermediate zigzag (A)-(B)-(C).
The final of the correction pattern zigzag (A)-(B)-(C) is possible near 1566.77. At that level, it will be at 76.4% of primary wave Ⓨ.
After reaching this level, we can expect a market reversal and the beginning of a cycle wave z.