Sample Category Title
Dollar Returns to Growth after a Summer Respite
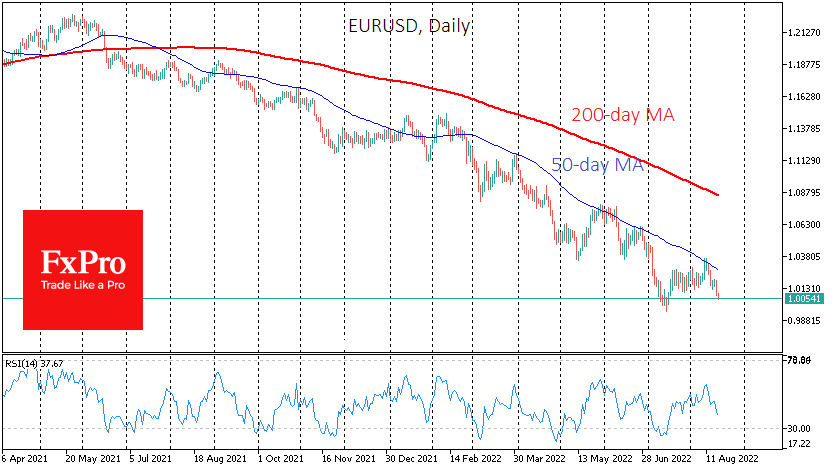
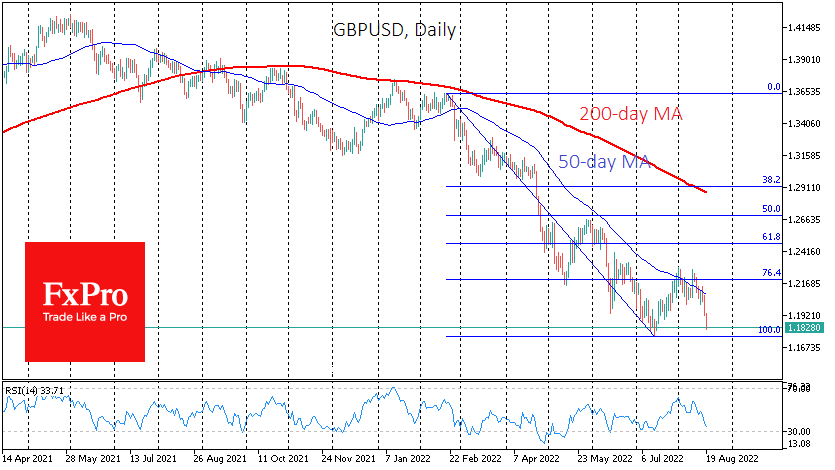
The US dollar has quite expectedly accelerated its rise. EURUSD is trading less than 50 pips from parity, which it managed to defend in mid-July, having retreated from 20-year lows. GBPUSD has also quickly returned to July lows, losing more than 2.5% since the beginning of the week.
A similar dollar march can be seen in the other most popular currency pairs this week. The dollar bulls didn’t let the retracement pull back after the yearlong rally to new levels. Both macro data and verbal interventions by Fed officials helped this to a large extent.
A report of half-million new jobs in July was combined with a slowdown in inflation in recent days. Such a mix took away some of the fear of an immediate economic deterioration. Still, it also somewhat bolstered faith in the dollar’s purchasing power, which is no longer being eaten up by inflation as much.
That said, FOMC members have not stopped assuring markets that they should and (even more importantly) are willing to do more to curb inflation. It is also worth taking seriously the assurances that the Fed should avoid a surge in inflation expectations, which should be taken as an attitude not to cut rates for quite some time.
During the summer, the dollar bulls had time to refill their guns but did not allow the technical pattern of the dollar growth to be broken.
So EURUSD and GBPUSD got bogged down in the resistance of the 50-day moving average. Separately, EURUSD lost corrective momentum on the approach to 1.0370, where the lows of May and June 2022, December 2016 and January 2017 are concentrated.
Similarly, in GBPUSD, the former support became resistance, and the recovery has lost momentum at 76.4% of the February-July decline amplitude. A similar Fibonacci retracement works in USDJPY.
The USDCHF and AUDUSD were proving their commitment to their multi-month dollar trends by pulling back from their 200-day averages.
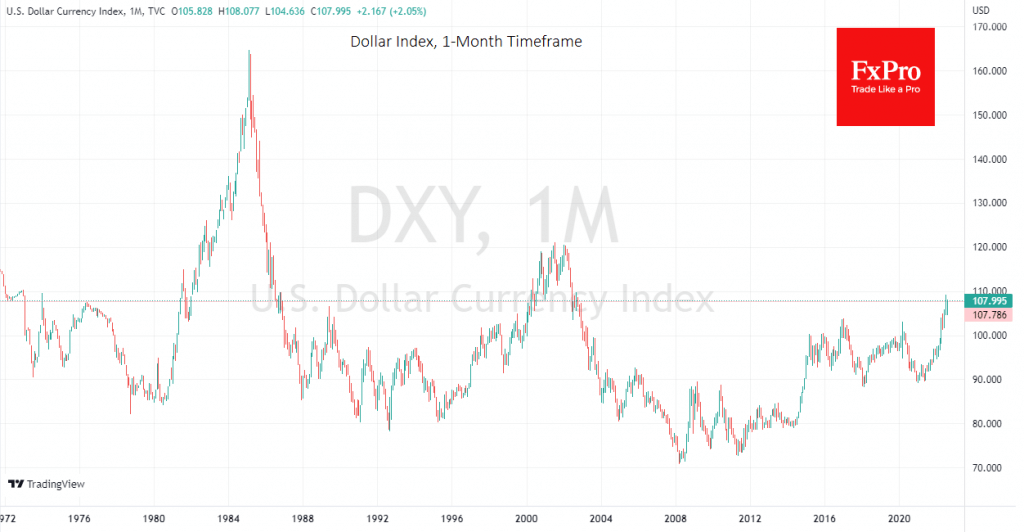
Cautious bulls might wait for the USD index to update the highs near 108.50. But we believe that it is a matter of the next few days. As capitals return from the summer holidays in the last few days, we see a clear upward trend forming for the USD. The rebound in the markets during the summer months now looks not like buying while everyone is afraid but a temporary rebalancing of portfolios and an opportunity for the big players to gain liquidity before a new wave of declines.
If the currency market maintains its momentum, EURUSD will enter September below parity, which could cause even more emotional sell-offs and pull the pair further down. The same is expected from GBPUSD, where a consolidation below 1.18 looks to be in the next few days.
In previous years, a 20% rise in the dollar for 12 months would draw the attention of the US Treasury or the Fed and try to stop the unilateral appreciation of the currency. But a rising dollar is now suppressing commodity prices and imports, bringing the return of inflation closer to normal, doing some of the work instead of the Fed.
Potentially, a path opens up for the dollar in the 2000-2002 highs area, near 120 on the DXY, which is about 10% more from current levels. A wilder scenario with a repeat of the 1980-1985 mega-rally is rejected for the time being because the authorities will try to prevent what they fought against then: the destruction of the US economy and massive defaults by emerging markets due to the excessive strength of the USD.
Dollar is Getting its Momentum Back
Markets:
A new day, a new sell-off on core bond markets. This week showed that the Summer lull is definitely over. Four Fed members dotted the i’s and crossed the t’s yesterday. Current market positioning goes against Fed guidance. Don’t fight the Fed, they said… The US central bank will push forward with its aggressive tightening cycle and doesn’t intend to blink on first economic strains. Rate cuts in 2023 are definitely not on the table.
We’ve witnessed a similar hawkish stance, stressing the need to frontload tightening in order not having to step it up later, in this week’s central bank meetings in New Zealand and Norway. Meanwhile, UK inflation hit double digits and hasn’t reached its peak yet.
Even Japanese core inflation this morning showed an acceleration away from the 2% inflation target (2.4% Y/Y) to the highest level since end 2015. Who’d figured that even BoJ Kuroda would one day face difficulties defending his ultra-easy monetary policy?
In any case, the Fed is talking and the market is listening again. Especially with Fed Chair Powell yesterday being confirmed as key speaker at next week’s Jackson Hole Symposium. “Reassessing constraints on the economy and policy” is this year’s general topic, but Powell will just zoom in on the economic (and probably monetary) outlook.
US yields today rise by 5.7 bps (2-yr) to 7.5 bps (30-yr). The US 10-yr yield is close to touching the 3% mark for the first time since mid-July. European bonds continue their underperformance, having outperformed in the mid-June, end-July recovery. The ECB has quite some catching-up to do with German ECB member Schnabel yesterday suggesting willingness and readiness to do so.
This morning’s German July producer prices also showed a record jump: 5.3% M/M and 37.2% Y/Y (from 32.7% Y/Y), suggesting that price pressure will remain elevated over the next months. German yields rise by 8.3 bps (2-yr) to 11.3 bps (10-yr). The EU 10y swap rate sits back above 2% for the first time since July 21 (inaugural ECB rate hike). Greek and Italian 10-yr yield spreads widen by 6 bps. UK yields add 9.2 bps (2-yr) to 12.8 bps (30-yr).
It’s the first time this week that the longer end of the curve underperforms the front end. Details show both inflation expectations, but especially real yields being responsible for the move.
Stock markets as a consequence suffer a second beating this week. Their Summer rally is over as core bonds turn back in sell-off mode. Main European indices lose around 0.75% with US gauges opening up to 1% softer (Nasdaq).
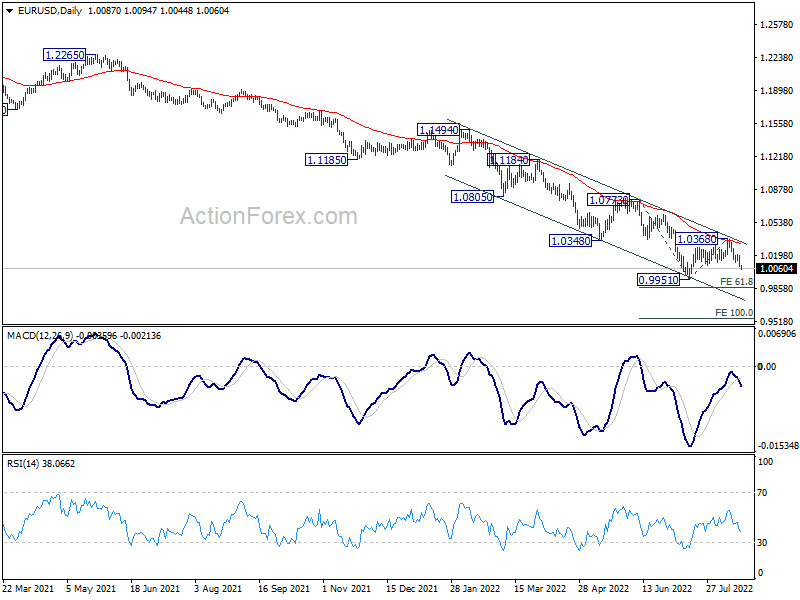
The dollar is getting its momentum back. EUR/USD yesterday lost 1.01 and changes hands near 1.0050 today. A new attack of parity is in the making. The July YTD low stands at 0.9952.
A hawkish Fed, a more difficult risk climate and potentially weak EMU PMI’s all point in the direction of a lower EUR/USD rate. The trade-weighted dollar reaches 108 with the YTD high at 109.29. Higher core bond yields weigh on the yen as well. USD/JPY is also marching forward to the 139.39 YTD high.
The euro ranks second amongst majors with a technical break in EUR/GBP accelerating the increase in the pair. EUR/GBP breaks out of the corrective downward trend channel in place since mid-June, taking out 0.85.
This morning’s Gfk consumer confidence (weakest since start of the series in 1974) painted an extremely grim picture for UK households. Cable (GBP/USD) is a whisker away from the 1.176 YTD low. News Headlines:Average Polish wage growth exceeded CPI in July. Wages rose by 3.4% M/M and by 15.8% Y/Y, compared to an inflation reading of 15.6% Y/Y. Details showed that especially state-owned mines and power utilities granted heft salary boosts to their employees. The mining industry for example wanted to mitigate the risks of strikes with a monthly wage increase of 26%! The National Bank of Poland slowed its tightening cycle early July (+50 bps to 6.5%), suggesting limited additional scope to extend the normalization cycle. Money markets currently discount a 7.25% cycle peak around the turn of the year.
US Dollar Recovers as Fed Sticks to its Hike Plan
EUR/USD under pressure as recession looms
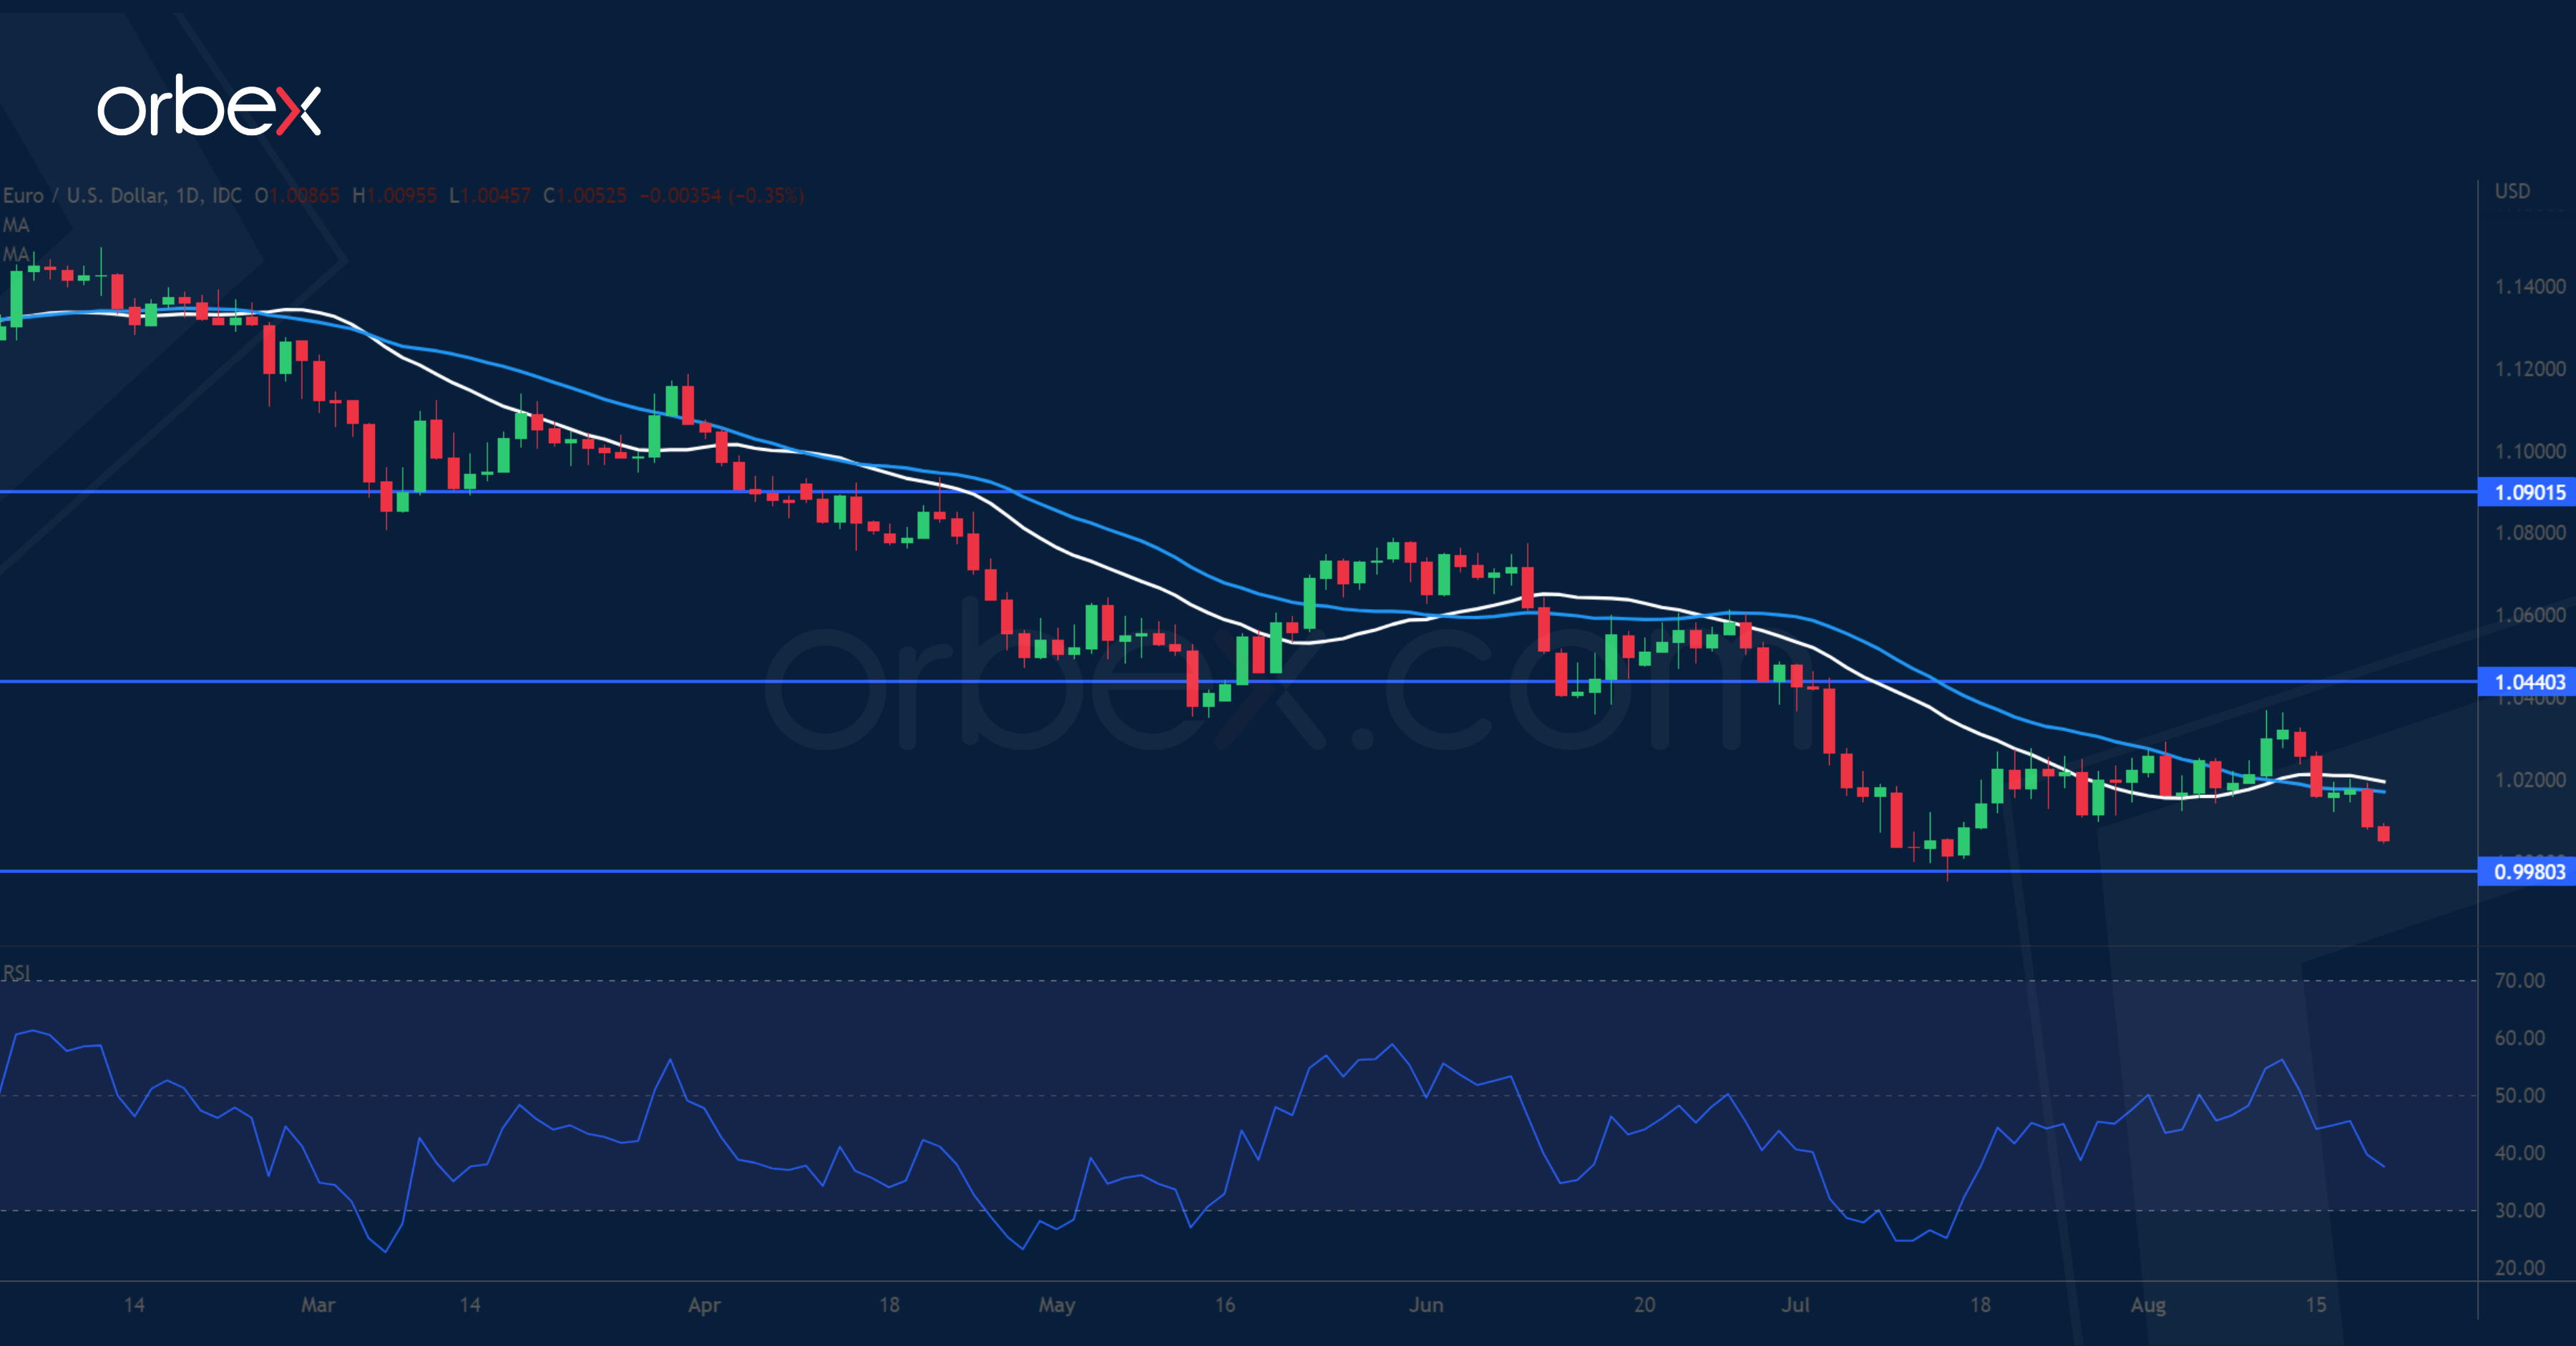
The euro struggles over dimming growth outlooks. The recession risk is not negligible given the energy crisis in Europe, and growth data have pointed to a slowdown. However, a solid labour market in the euro-zone would suggest a mild downturn, alleviating fears of a ‘hard landing’. With inflation over four times the ECB's 2% target, another rate hike in September seems to be a done deal and the market is leaning towards an additional 50 basis points. The single currency may find some respite but will have a hard time against the US dollar which benefits from an uptrend inertia. 0.9980 is the last support and 1.0440 the hurdle ahead.
GBP/USD capped by stubborn inflation
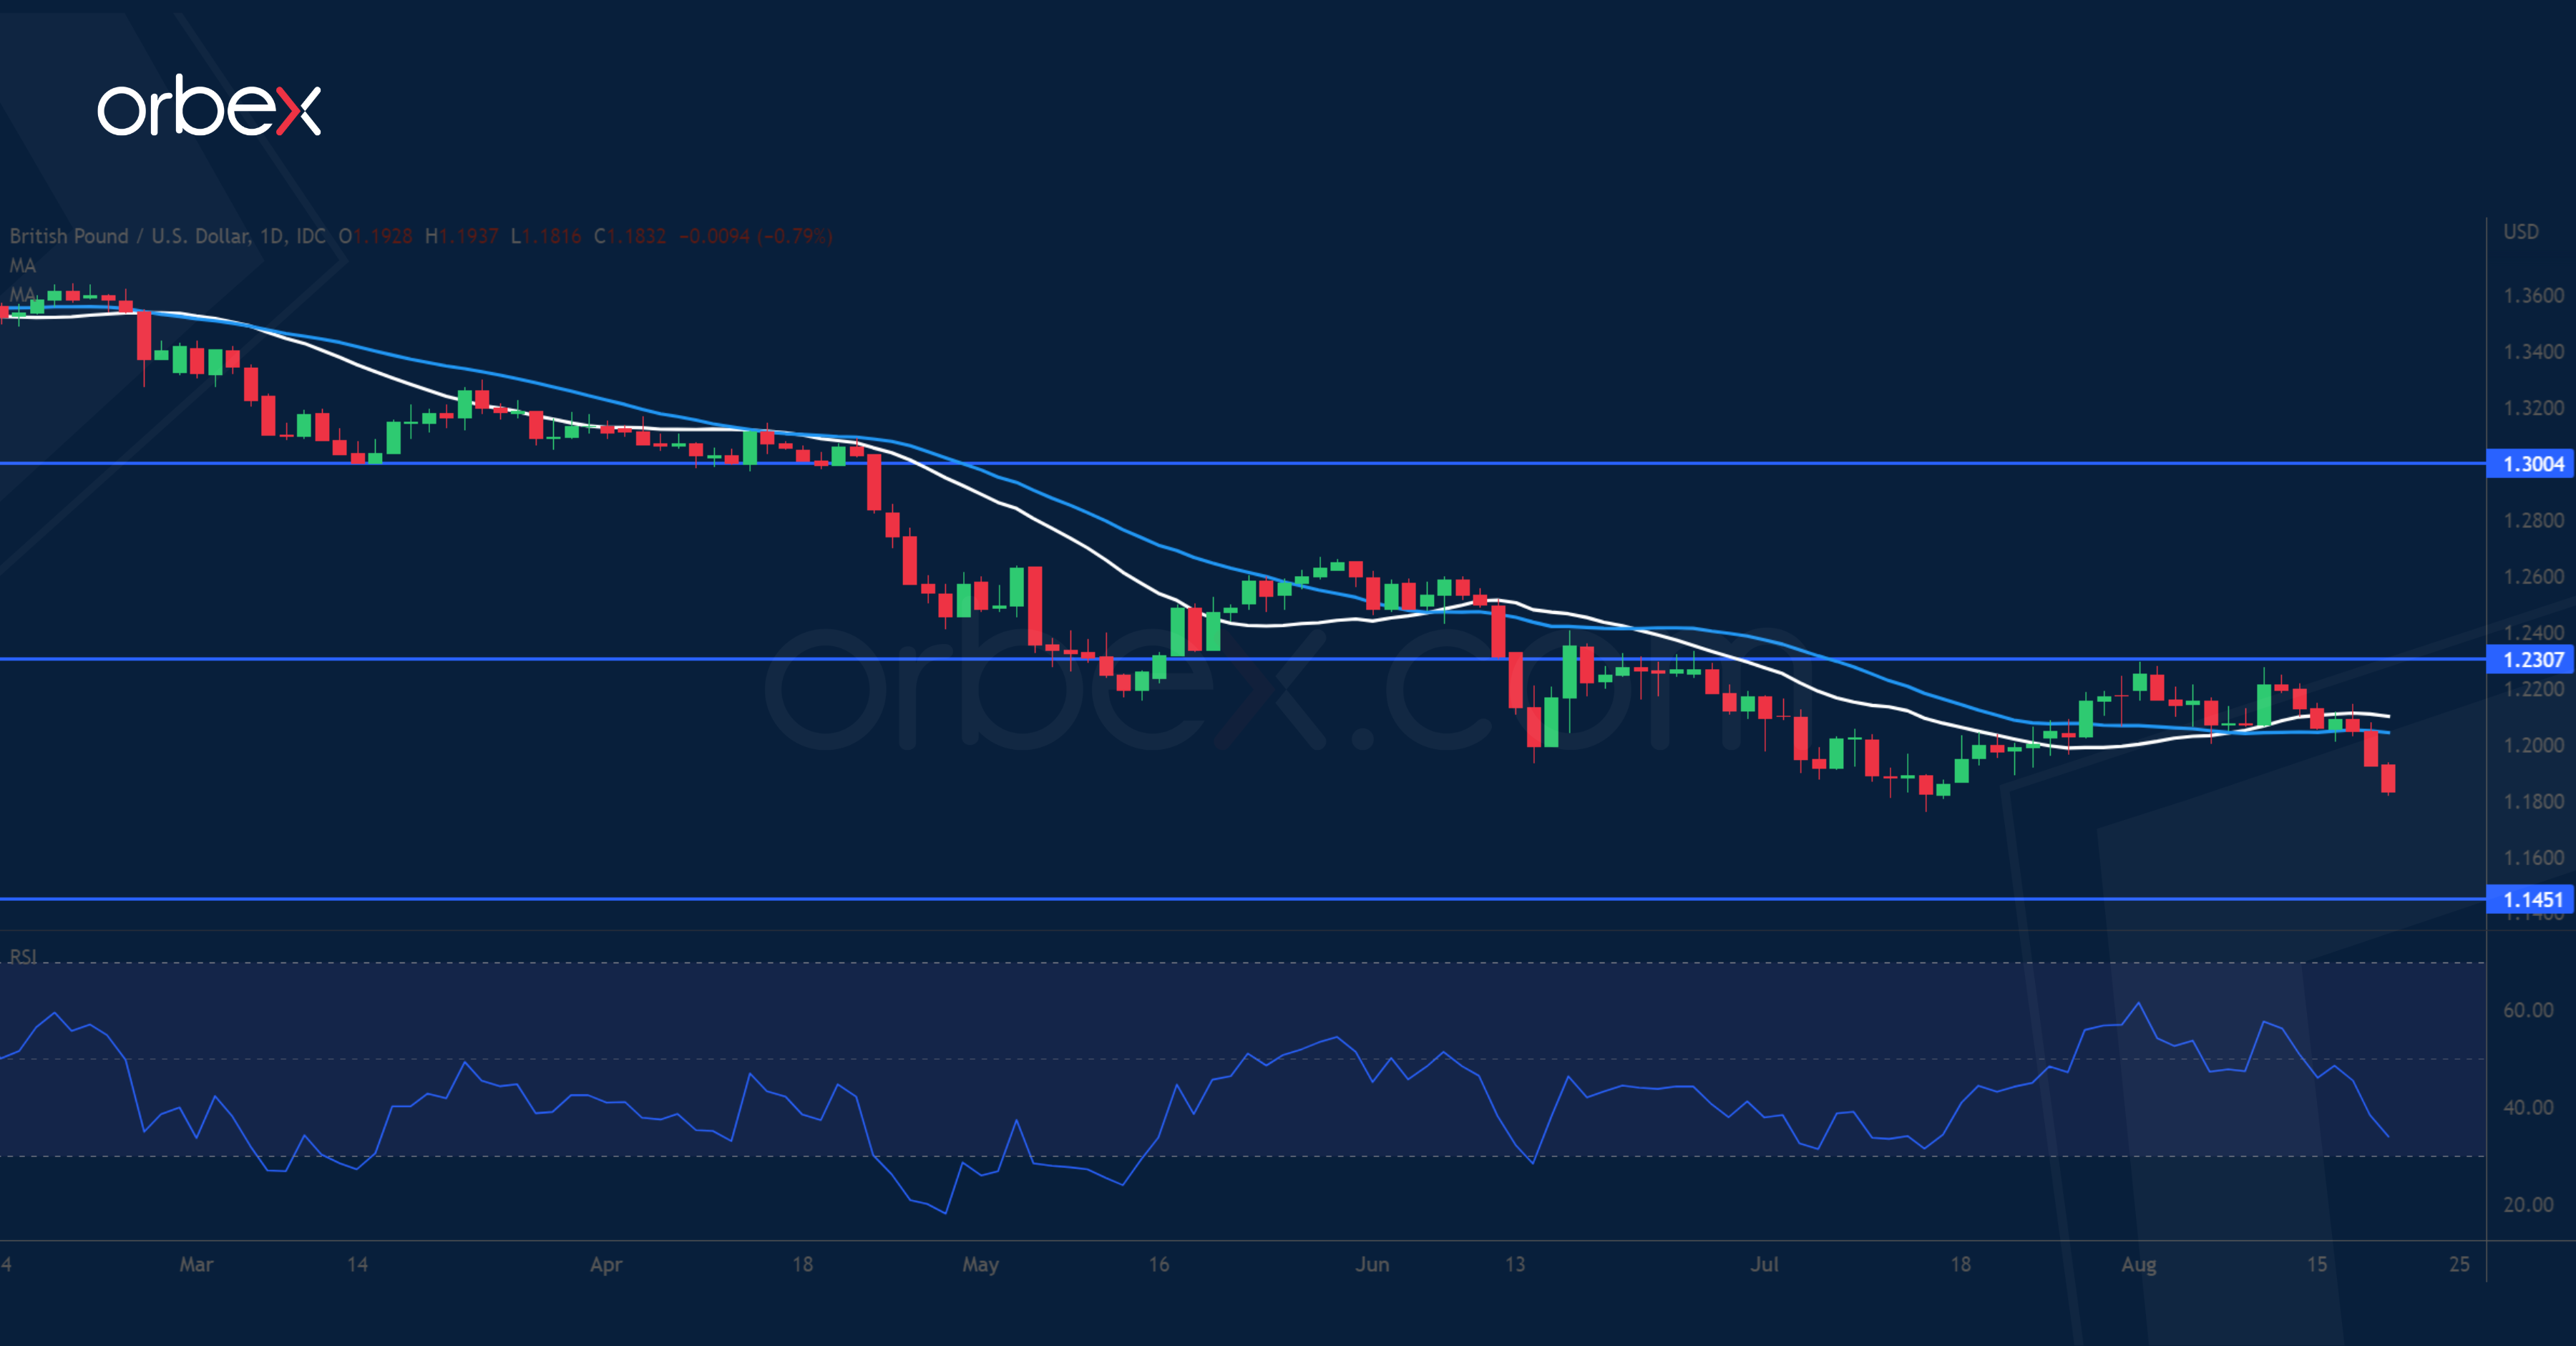
The pound struggles over fragile economic fundamentals. The UK’s inflation accelerated to a double digit in July, hitting its highest level since four decades. The BoE is facing the thorny problem of price pressure and recessionary headwinds. There is growing belief that the US inflation may peak soon, leading to a slower tightening pace by the Fed. As the BoE catches up in terms of the rate differential, Sterling could meet some buying interest. The major downside risk is worries that Britain could be more vulnerable to a recession than other countries. 1.2300 is the closest resistance and March 2020’s low at 1.1450 is the target.
UK oil falls as supply rises
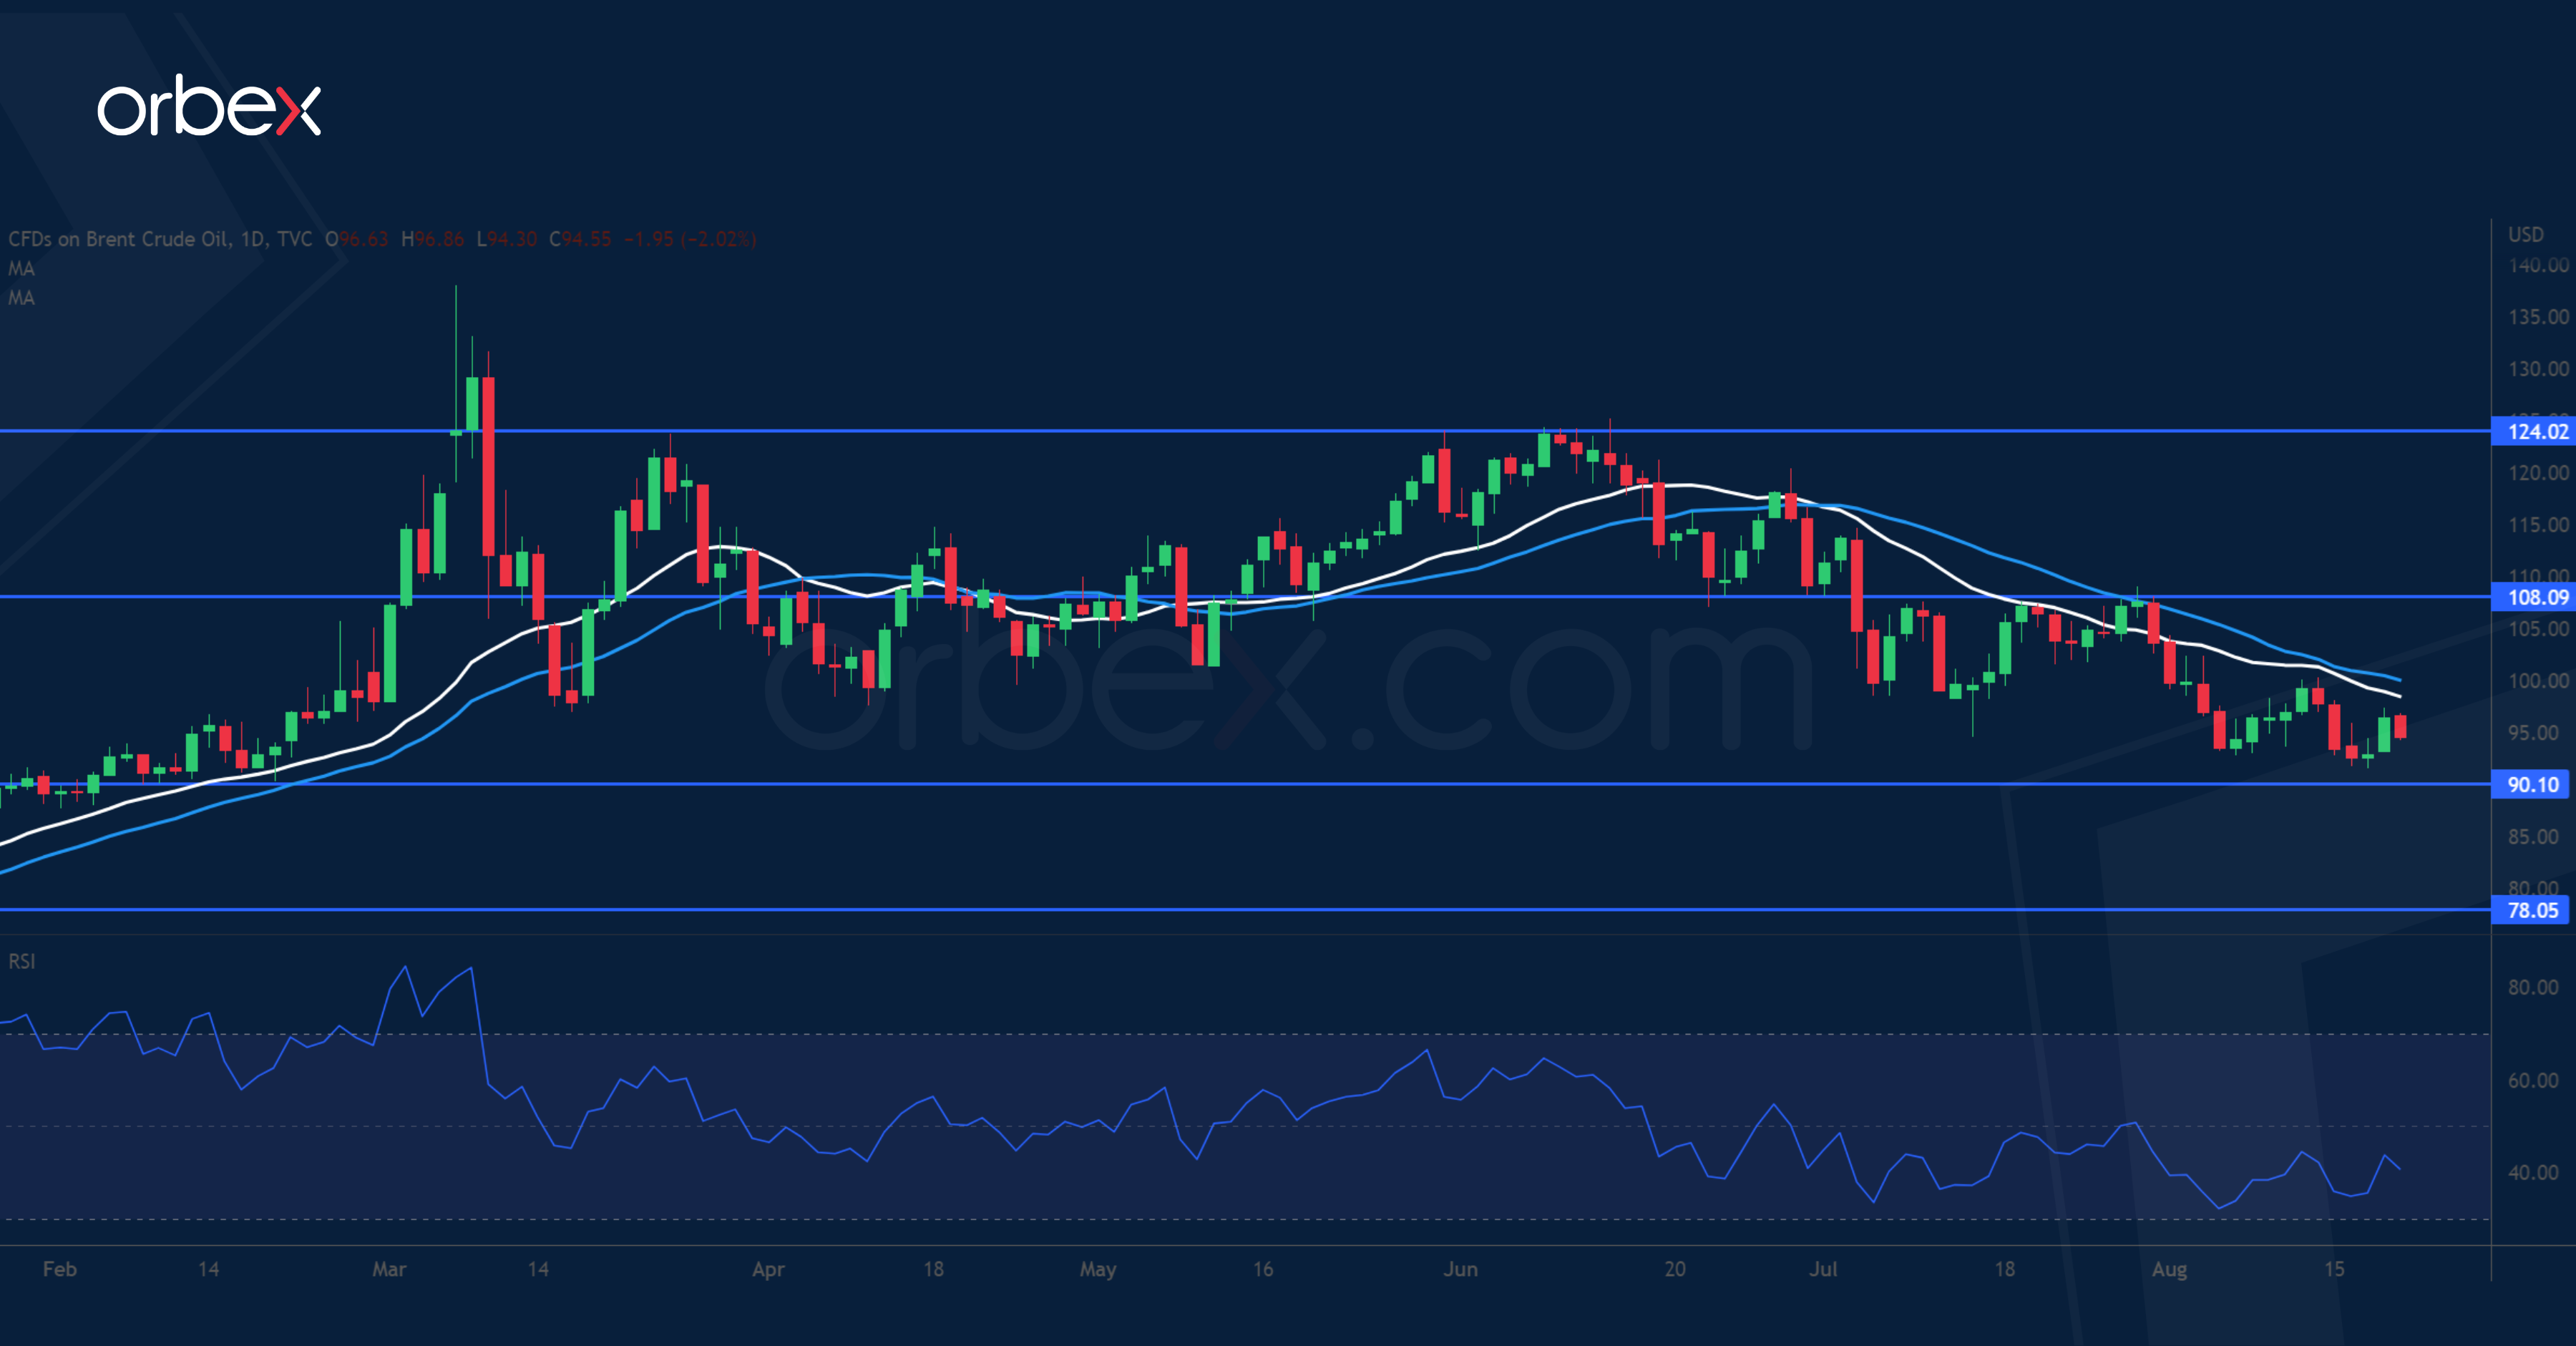
Oil prices retreats as rising output may outweigh global demand. Steady consumption eases concern of slowing economic growth. Rising imports from Europe to replace Russian fuel have triggered a sharp drop in US crude inventories and refineries are set to keep running at near full capacity to meet both domestic and international demand. Planned increase in production from OPEC+ members would further loosen supply constraints. This shift in supply and demand balance is likely to keep the commodity under pressure. Brent spot contracts are exchanging near the psychological level of 90.00 and 108.00 is the first resistance.
SPX 500 retreats as more tightening to come
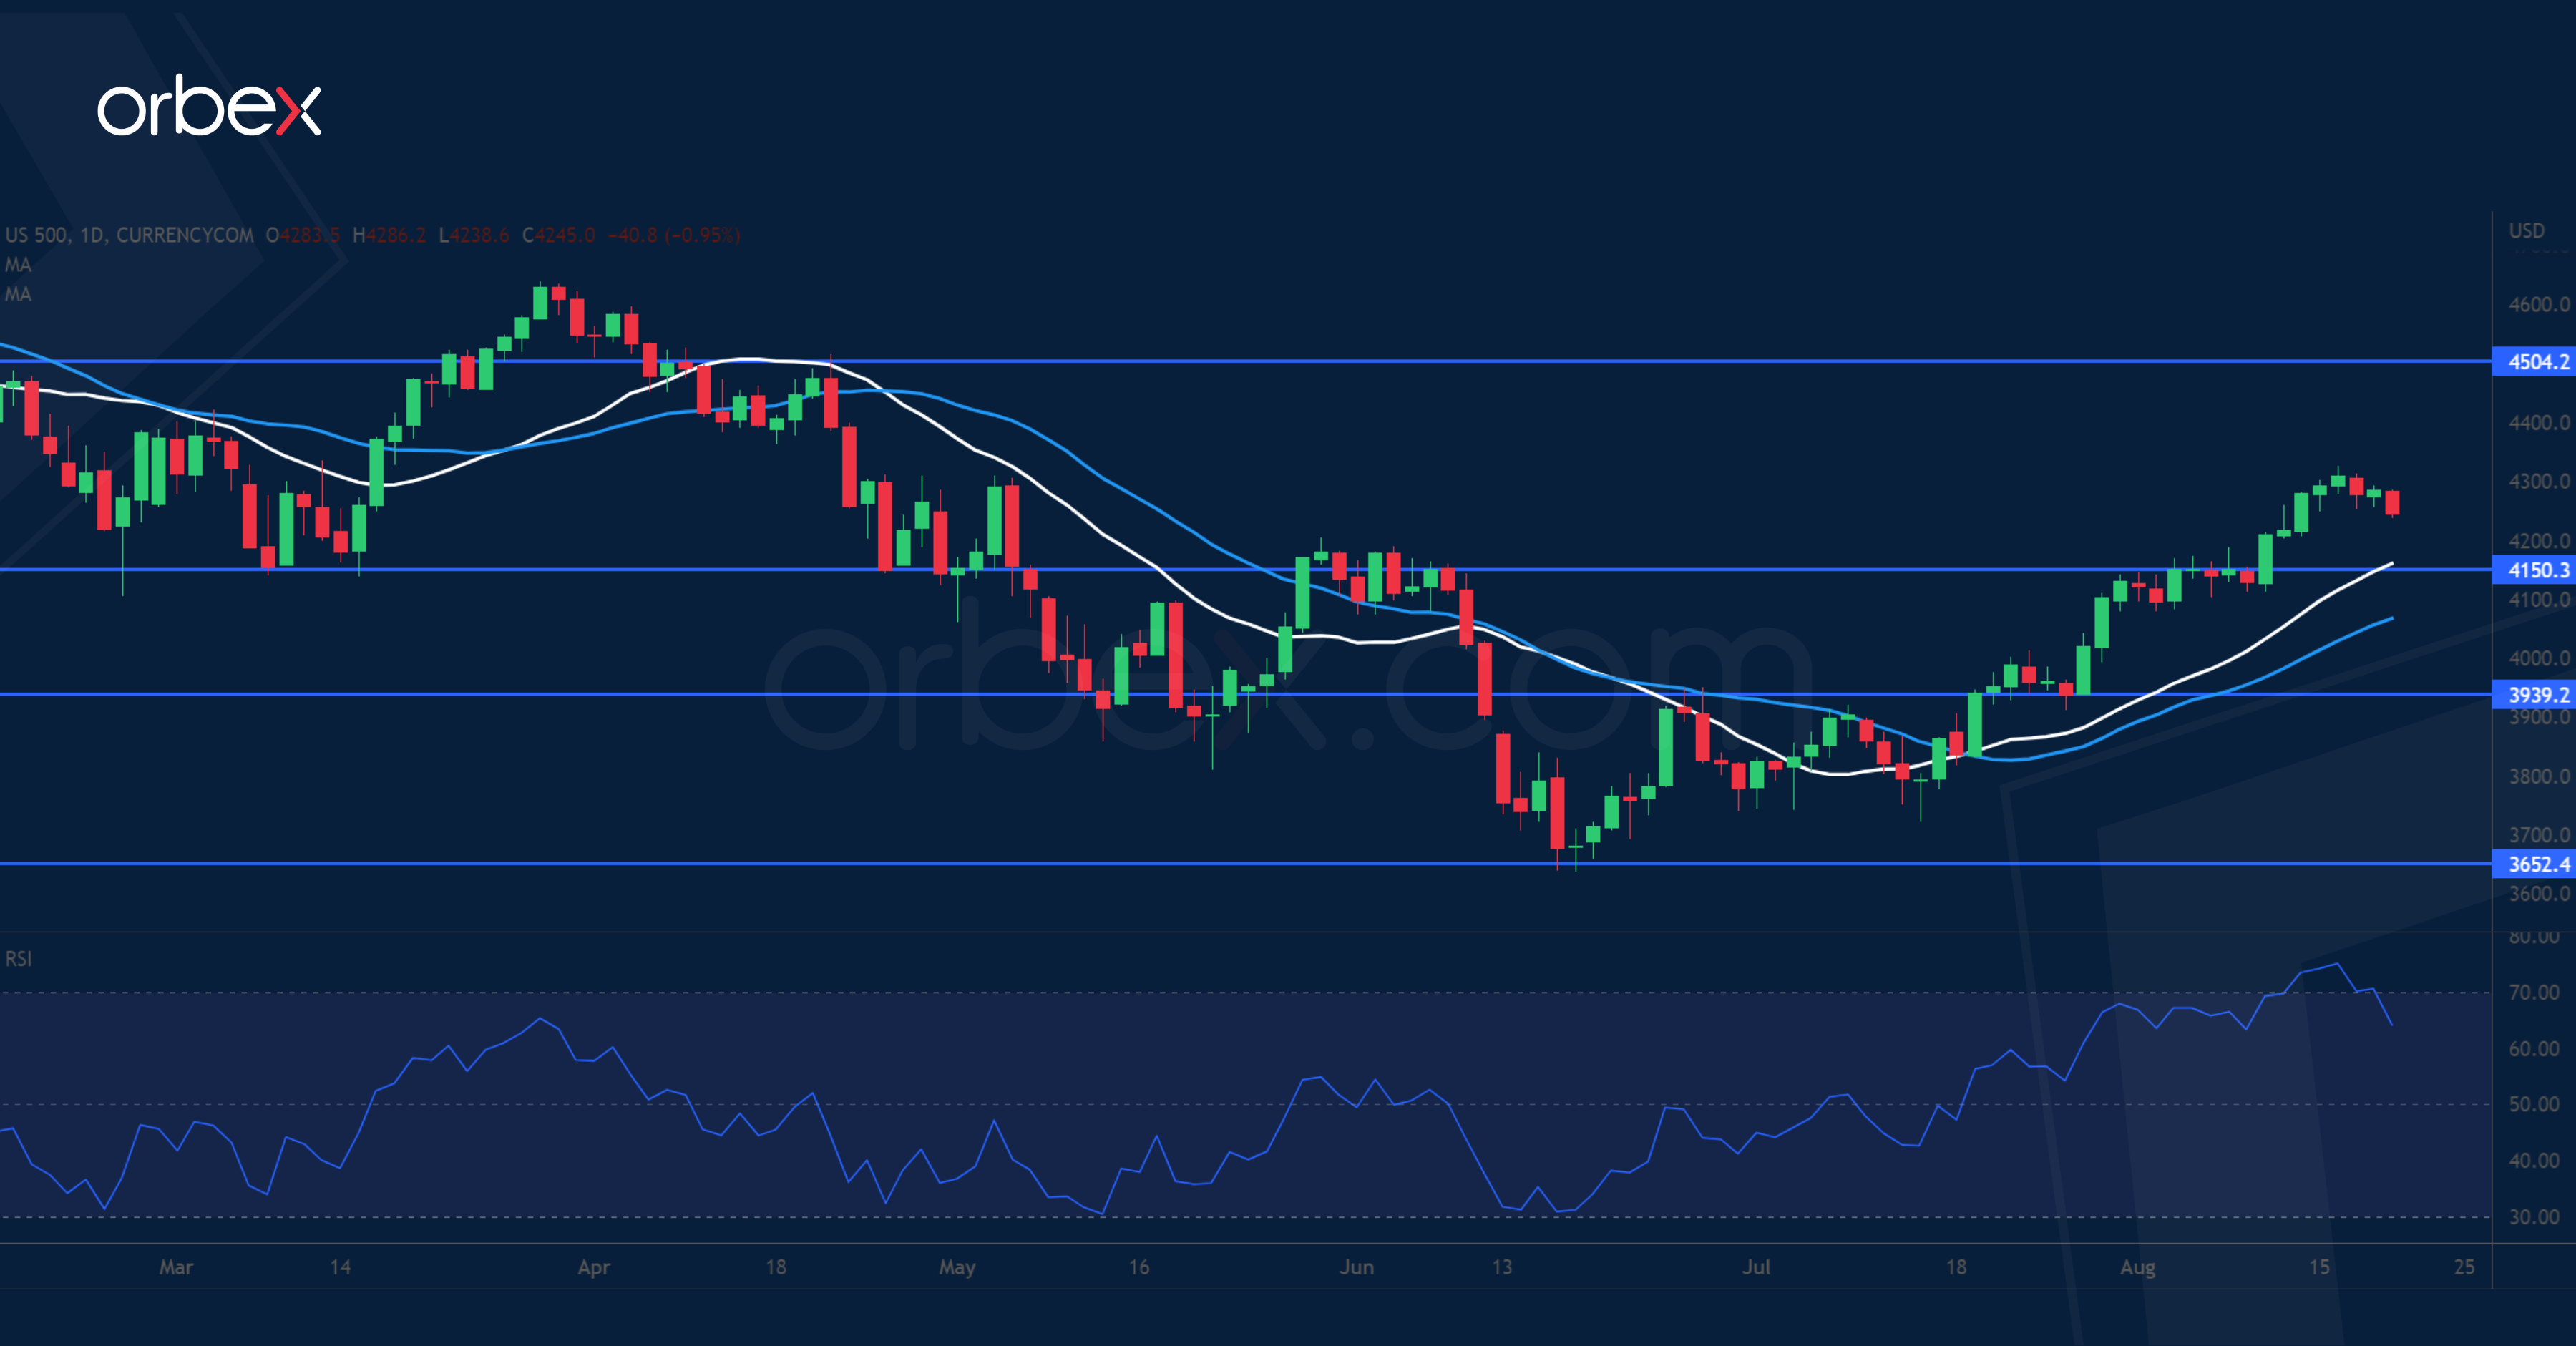
The S&P 500 rallies over the prospect of a moderation in tightening. As the Fed pushes rates to the fine line between a ‘soft landing’ and a recession, the pace and the size of rate hikes would eventually go down hill. The question is whether the peak is in sight. Traders are split between a 50 or 75bp hike in the next meeting as the central bank is yet to acknowledge a turning point in price pressures. But as officials are committed to tame inflation for as long as needed, the downside risk is that a lengthy hike journey would lift interest rates to a prohibitive level. The index is heading towards 4500 and 4150 has turned into a support.
Canada: Higher Prices Lift Retail Sales in June
Retail sales rose modestly in June, up 1.1% from a month ago. This is well above Statistics Canada's preliminary estimate for a 0.3% gain. However, growth was considerably softer in inflation-adjusted terms, with the monthly volume of sales up just 0.2%.
Statistics Canada's flash estimate for July points to a 2.0% decline.
The headline in June was boosted by higher sales at gasoline stations and motor vehicle and parts dealers. Receipts at gasoline stations were up 3.9% m/m on the back another leg up in gas prices. Adjusted for the price effect, gasoline satiations' sales actually fell by 1.3% in volume terms – the second consecutive monthly drop. Sales at motor vehicle and parts dealers were up 1.8% on the month.
Core sales, which exclude autos and gasoline, edged up just (+0.2% m/m). This is the smallest increase since the start of the year. Core sales were flat in inflation-adjusted terms.
- Sales rose at general merchandise stores (+1.1%), health & personal care stores (+1.0%), and clothing & accessories stores (+1.8%). Sales were also higher at miscellaneous store retailers (+1.8%), following a steep decline in the month prior.
- However, sale pulled back at electronics and appliance stores (-2.4%) and were flat at the building material and garden equipment dealers. Sales were also lower at food and beverage stores (-1.1%), reversing the increase in the prior month, and sporting goods, hobby and book stores (-0.8%).
- E-commerce sales rose by 4.5% in June– a forth consecutive monthly increase – as consumers looked for better deals online amid rising prices.
Key Implications
The headline growth for retail sales surprised to the upside in June, however, looking under the hood reveals that much of the gain was due to higher prices. Adjusting for inflation, total sales were up just 0.2% on the month while core sales were flat. With inflation running at a multi-decade high, higher prices have been giving a lift to nominal retail sales figures, but inflation-adjusted numbers tell a different story. Sales at gas stations are a prime example. While in dollar terms gasoline sales were up in both June and July, in volume terms sales declined in both of these months, as Canadians cut back on driving to mitigate some of the impact of sky-high prices at the pump.
As we noted in today's report, consumer spending on goods and services appears to have eased in July after strong gains during the initial reopening months. While some of the moderation is to be expected after strong gains during the initial reopening months, higher prices are also weighing on consumers' purchasing power. There is still appetite among consumers for experiences like dining-out, but it is only a matter of time before pent-up demand gets satiated and intensified financial headwinds – red-hot inflation, higher interest rates and an erosion of household wealth – prompt consumers to tighten their purse stings, particularly when it comes to discretionary items.
Fortunately, gasoline prices eased in July, which should give consumers some reprieve. They are going to need those savings given that price growth continued to accelerate for many other key items, such as food. With the inflation genie still out of the bottle, the Bank of Canada is expected to take rates higher again at its next meeting in less than three weeks.
Oil Prices Might Cause Another Inflation Wave
US oil exports reached a record last week at five million barrels a day, according to Energy Information Administration data. Moreover, EIA reported the US oil inventory shortage by 7 million barrels last week, combined with the decline in the US oil production of 12.1 million BPD versus 12.2 million BPD earlier.
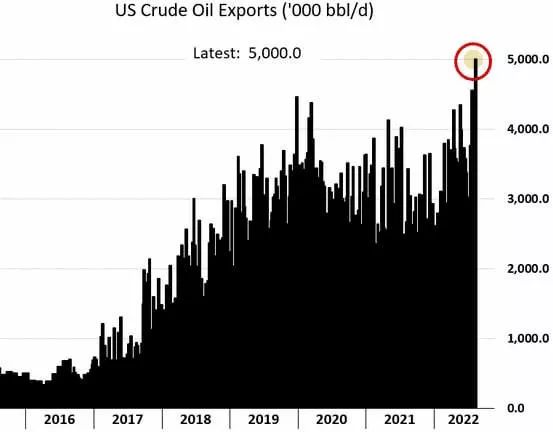
The fact that the United States spends more oil from its reserves while the production stays the same explains why the global oil inventories have decreased in the United States since 2019.
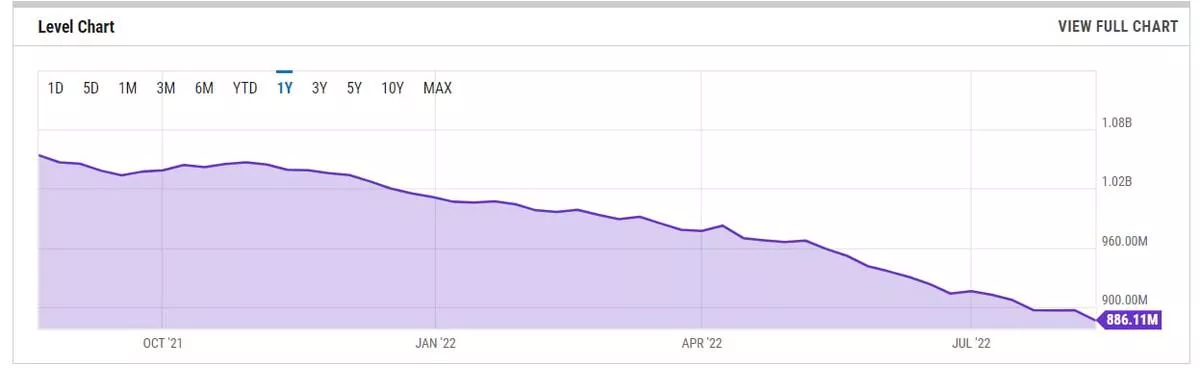
In the current conjunction, it’s too early to expect a cooling of oil prices soon. Moreover, more factors make the situation even worse:
1) Sanctions versus Russia due to the conflict in Eastern Europe.
Sanctions include:
- European Union ban on all imports of oil brought in by sea from Russia by the end of 2022.
- The US ban on all Russian oil and gas imports.
- The UK ban on all oil imports by the end of 2022.
Russia has always been one of the biggest oil exporters in the world and the largest one for the European continent. Nowadays, the USA has replaced Russia in the European market, but how long can the USA supply the European continent with its reserves? The question is rhetorical.
2) The United States and Asian countries replace Russian oil in Europe, but it’s too expensive.
Giant supertankers hauling crude oil across the globe have made the most money in more than two years, thanks to swelling shipments from the US and the Middle East. Benchmark earnings for huge crude carriers neared $40 000 a day on Wednesday to hit the highest level since June 2020. Assessments in the industry standard Worldscale system have jumped almost 40% over a week. Transporting oil by sea is not only expensive, but it takes much more time. Moreover, natural disasters such as droughts and storms can affect supply chains.
The industry is underinvested.
Earlier, we have already highlighted the fact that the oil industry is underinvested. New OPEC Secretary-General Haitham Al Ghais confirmed it. "There are other factors beyond OPEC that are really behind the spike we have seen in gas [and] in oil. And again, I think in a nutshell, for me, it is underinvestment — chronic underinvestment," he added.
For example, the main global oil supplier, Saudi Arabia, might raise its production capacity to 13 million barrels per day by 2027 from a capacity of 12 million now, and "after that, the Kingdom will not have any more capacity to increase production."
3) Chinese economy is going through hard times. But how long will it last?
According to the latest data, Chinese industrial production was up 3.8% year-on-year in July, but down from 3.9% in June and well below analysts' forecasts. To answer that, the People's Bank of China increased key interest rates in a surprise move. If the Chinese central bank keeps supporting the economy, the recession might be avoided.China is the first oil exporter in the world. Thus, potential economic stabilization will significantly increase the oil supply, pushing prices higher.
The bottom line
The exclusion of Russian oil for the European countries and the US, supply chain risks, sector underinvestment, the inability to increase production, the decrease in US inventories, and potential Chinese economic recovery - factors that lead to the energy market crisis and keep oil prices on the high level. In turn, high oil prices cause rising inflation in the US and European countries.
However, the US dollar wins in times of rising inflation, while other currencies stay under heavy pressure.
Technical analysis
XBRUSD, daily chart
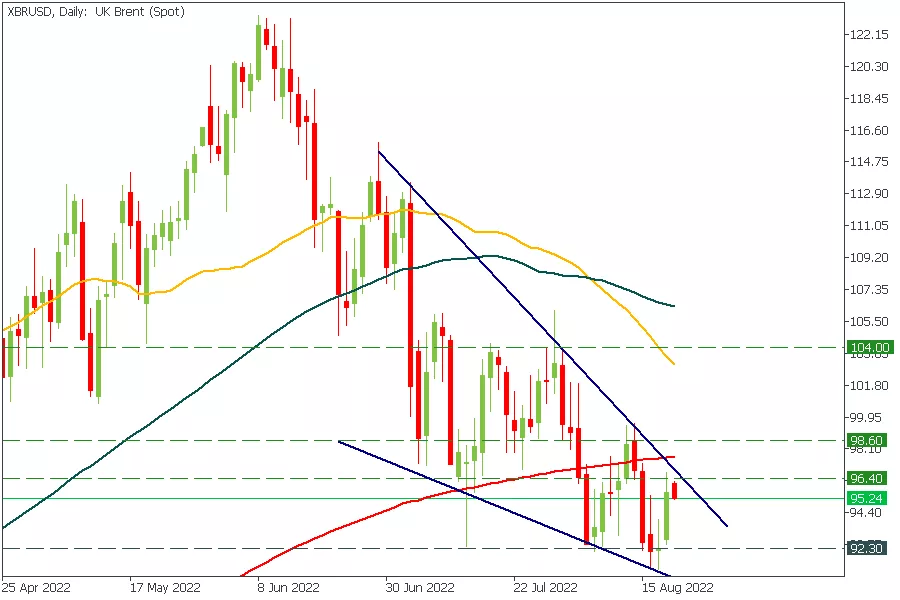
The price is consolidating in the bullish wedge ahead of some key news. After the breakout of the upper wedge’s border, XBRUSD will head towards 98.60. The text target will be 104.00.
XBRUSD, weekly
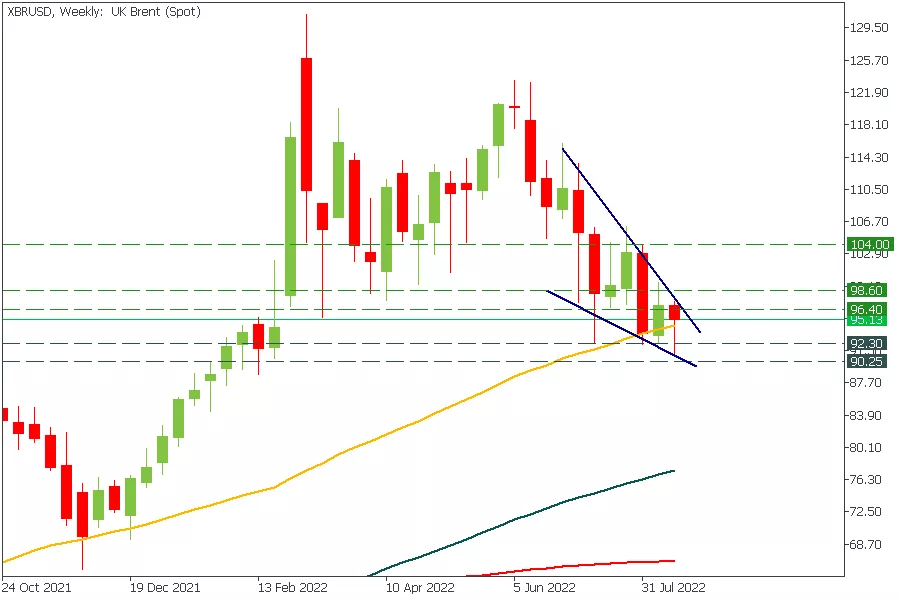
Another important fact is that buyers still manage to hold prices above the 50-week moving average. If this weekly candle closes above this support, it will be a sign of an upcoming bull run during the upcoming week.
US dollar index, weekly
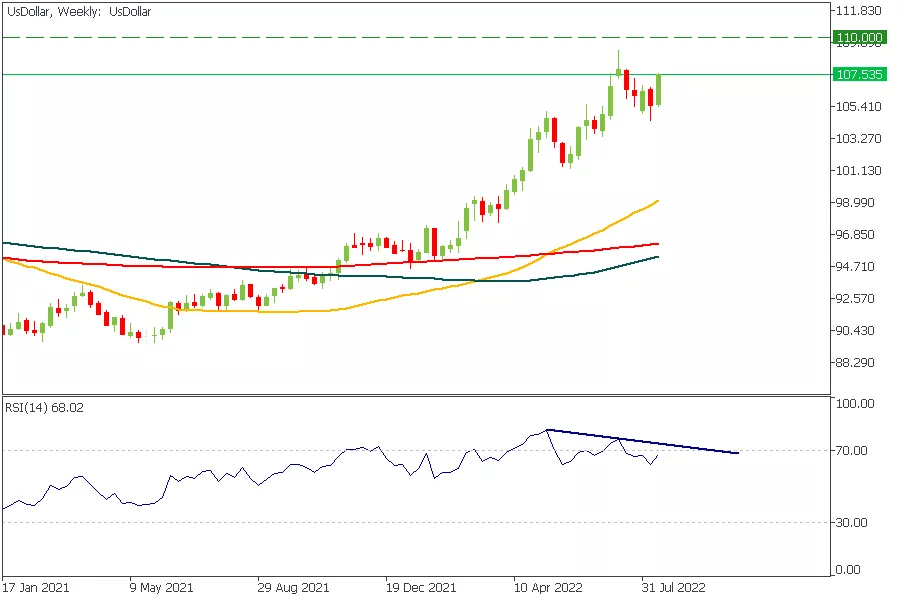
US dollar index is heading towards the 110.00 resistance, the potential point of the global reversal for the USD. Recent pump highlights the probability of rising inflation in the United States, which might be provoked by the upcoming oil prices jump.
If you want to find the highest point for the US dollar index, draw a “divergence” line on the weekly RSI chart. Technically, if the RSI touches this trendline and bounces off from it, the USD will finally reverse.
The End of the Summer Rally?
Back in late June, we talked about spotting a bear market rally, and how the market tends to rise though summer. Since then, most stock markets around the world have risen, and the Nasdaq even managed to technically get back into a bull market after gaining 20%. Now, the question is whether the gains will keep going (and potentially the dollar could weaken), or is it all about to end?
During the summer, trading volume is typically lower as a lot of the big market makers go on vacation. August is the time when most central banks take a break, as well. This lower volume gives space for smaller traders who tend to be more optimistic, to help push the market higher. More sunshine, improving production, and a host of other factors come into play that usually means markets close higher during the summer.
Now what?
In the United States, Labor Day is the informal transition from summer to autumn for the markets. It's not exact, but by then the big traders are back from their holidays, earnings season is over, and focus switches to how things will play out for the rest of the year. Through the course of the third quarter, major corporations adjust their guidance, and given the economic conditions, that probably means cuts. Generally, optimism takes a step back.
Timing market moves is always difficult; if there was a sure-fire way of knowing when the market would turn around, then there would be no need for traders. So, anything approximating a date for the market to turn around must be approached with extreme caution.
Trying to make an educated guess
All general moves in the market lead to some kind of correction along the way. After nearly two months of the market trending higher, it would be a surprise that at least a correction would be on the way. Which means it's quite useful to keep track of the dynamics that have supported the current move, and then see if they are shifting as a potential precursor to a change in direction.
The end of a summer rally typically coincides with a shift in risk sentiment, which means currency markets are likely to be affected as well. In fact, currency markets might even be a precursor to the shift, as traders move away from higher risk assets and bond yields rise. Most recently in the US, bond yields were trending higher but the FOMC minutes took the wind out of their sails. That might mean there is a bit of a reprieve when risk sentiment turns around, and it could be a little later than normal for when the markets turn around. On the other hand, the downbeat tone from the Fed might accelerate the turnaround.
Lining up opportunities
The main issue for when markets do turn around is trying to figure out if it's a resumption of the downward trend, or a correction. As we mentioned back in June, it's impossible to know for sure until it's already happened.
But a long-term rally in the midst of poor economic data and the Fed promising to keep tightening isn't normal. In fact, that hasn't happened before. Optimism might push the market higher for short periods of time, but it can't fight fundamentals forever. As volumes start ramping up in early September, a keen eye on the data might help figure out whether a shift in market sentiment is temporary, or the start of another leg lower.
EUR/USD Started a Fresh Decline from $1.0180
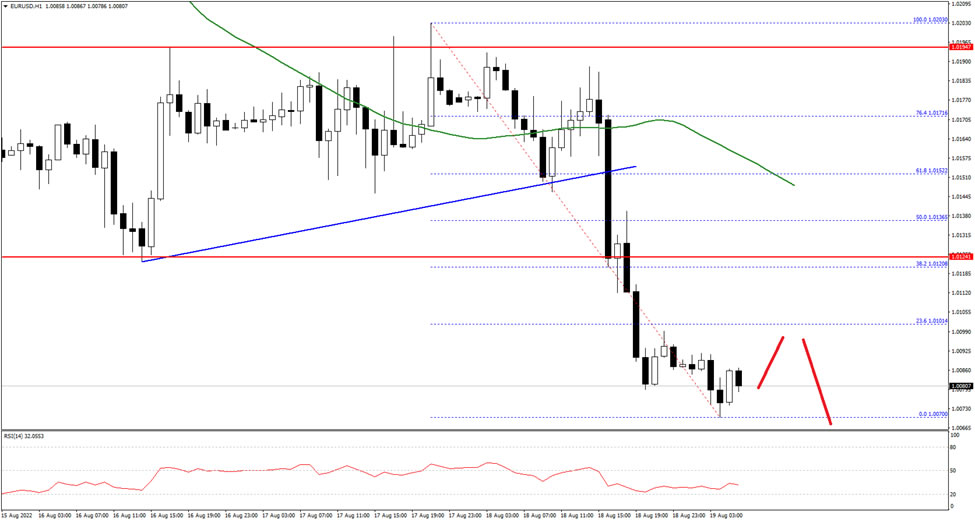
The Euro started a fresh decline from well above the 1.0180 level against the US Dollar. The EUR/USD pair traded below the 1.0150 support zone to move into a bearish zone.
There was a move below a connecting bullish trend line at 1.0152 on the hourly chart. The pair even settled below the 1.0130 level and settled above the 50 hourly simple moving average. A low is formed near 1.0070 and the pair is now consolidating. An immediate resistance on the upside is near 1.0100.
The first major resistance is near the 1.0120 level. A break above the 1.0120 resistance level could start a decent upward move. In the stated case, it could even surpass 1.0150.
If not, the pair might drop below 1.0070 on FXOpen. The next key support is near 1.0050, below the pair could decline towards the 1.0020 level in the near term. Any more losses might send the pair towards the 1.0000 level.
USD/JPY Mid-Day Outlook
Daily Pivots: (S1) 135.06; (P) 135.48; (R1) 136.31; More...
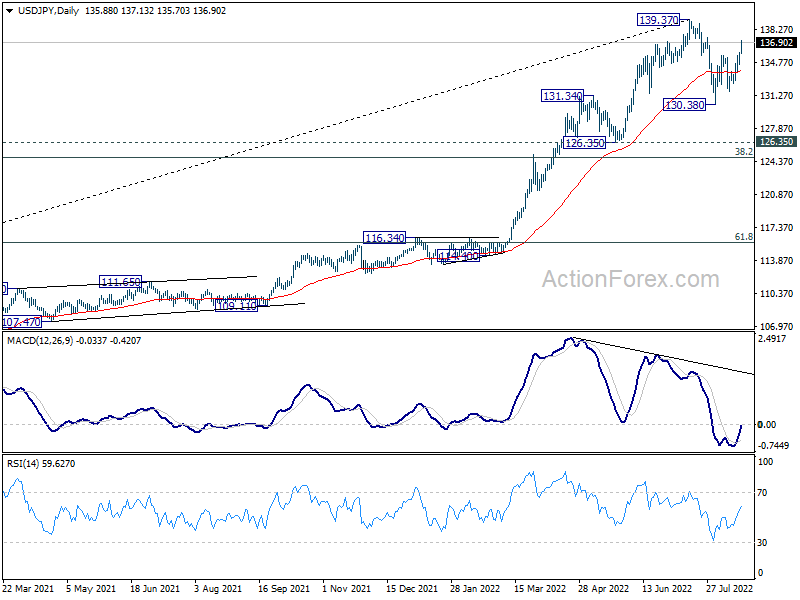
Intraday bias in USD/JPY stays on the upside at this point. Further rally would be seen to retest 139.37 high. Strong resistance could be seen there to bring another fall to extend the corrective pattern from 139.37. On the downside below 134.61 minor support will turn intraday bias neutral first.
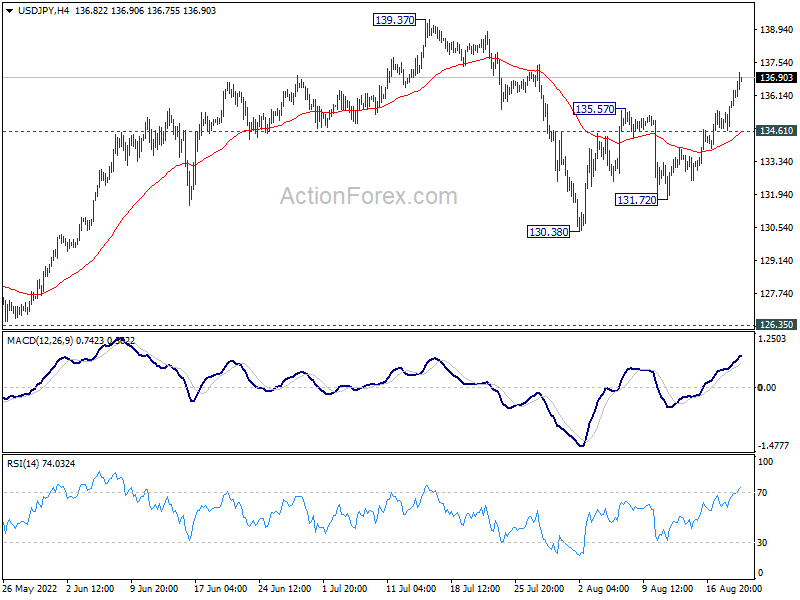
In the bigger picture, fall from 139.37 medium term top is seen as correcting whole up trend from 101.18 (2020 low). While deeper decline cannot be ruled out, outlook will stays bullish as long as 55 week EMA (now at 122.70) holds. Long term up trend is expected to resume through 139.37 at a later stage, after the correction finishes.
USD/CHF Mid-Day Outlook
Daily Pivots: (S1) 0.9521; (P) 0.9546; (R1) 0.9595; More...
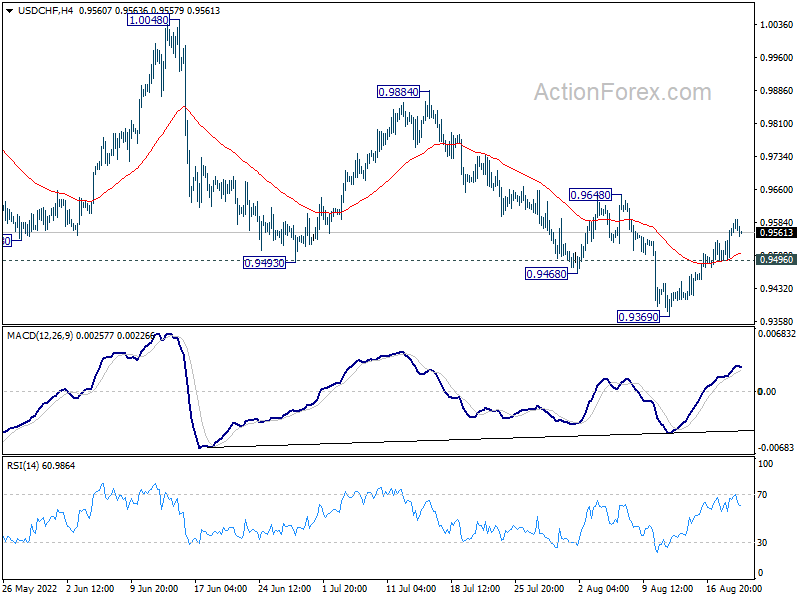
Intraday bias in USD/CHF remains mildly on the upside for 0.9648 resistance first Firm break there will bring stronger rally back to 0.9884 resistance next. On the downside, below 0.9496 minor support will revive near term bearishness and bring retest of 0.9369 low.
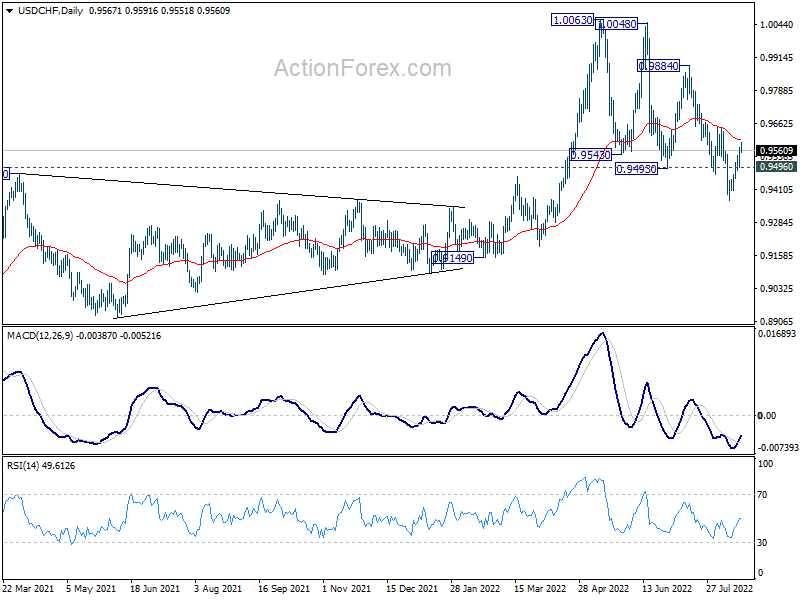
In the bigger picture, break of 0.9471 support turned resistance argues that medium term up trend from 0.8756 has completed with three waves up to 1.0063. Long term sideway pattern might have started another falling leg. Deeper decline would now be in favor as long as 0.9648 resistance holds, to 0.9149 structural support. Sustained break there could pave the way back to 0.8756. However, firm break of 0.648 will revive the case that price actions from 1.0063 are just a corrective pattern, and the larger up trend is no over yet.
EUR/USD Mid-Day Outlook
Daily Pivots: (S1) 1.0047; (P) 1.0120; (R1) 1.0160; More...
Intraday bias in EUR/USD stays on the downside for retesting 0.9951 low first. Firm break there will resume larger down trend trend. Next near term targets are 61.8% projection of 1.0773 to 0.9951 from 1.0368 at 0.9860, and then 100% projection at 0.9546. On the upside, above 1.0203 minor resistance will turn intraday bias neutral. But risk will stay on the downside as long as 1.0368 resistance holds.
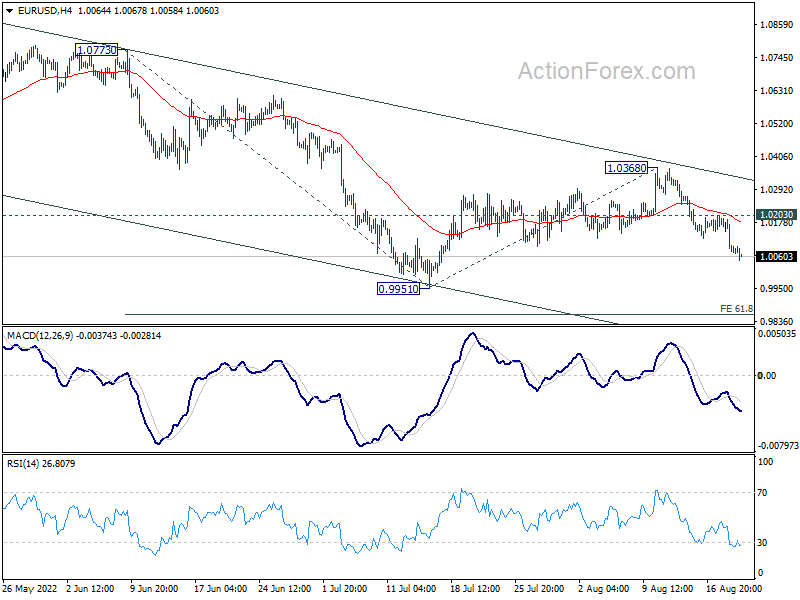
In the bigger picture, down trend from 1.6039 (2008 high) is still in progress. Next target is 100% projection of 1.3993 to 1.0339 from 1.2348 at 0.8694. In any case, outlook will stay bearish as long as 1.0773 resistance holds, in case of strong rebound.