Sample Category Title
Dollar Hits New Two-Decade High
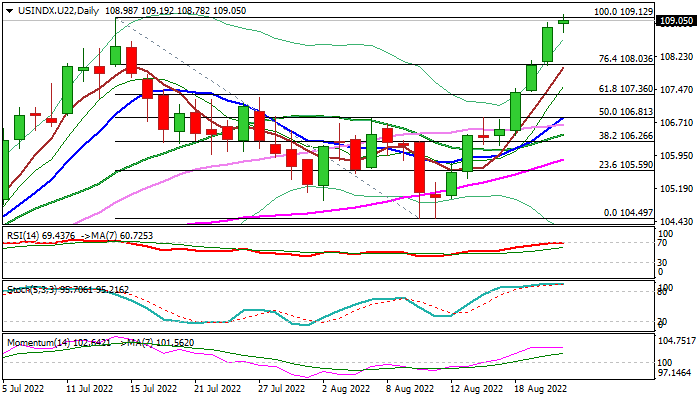
The dollar index extends steep ascend from Aug 10/11 double-bottom (104.49) to probe through previous top at 109.12 (July 14) and hit new highest since Sep 2002.
The greenback remains well supported by safe-haven flows on concerns about global growth and hawkish Fed, with completion of corrective phase (109.12/104.49) signaling continuation of larger uptrend from 2021 double-bottom at 89.15/90.42.
Weekly studies in full bullish setup and last week’s completion of bullish engulfing pattern (following 2.3% weekly advance, the biggest weekly rally since mid-March 2020) underpin the action, along with last week’s large bullish candle.
On the other side, overbought daily techs suggest bulls may take a breather for consolidation before resuming.
Shallow dips are likely scenario, ideally to be contained at 108 zone, though deeper pullback towards supports at 107.36/00 (broken Fibo 61.8% / daily cloud top) cannot be ruled out, but still expected to offer better buying opportunities.
Break of 109.12 pivot to expose initial targets at 110.00/22 (round-figure / Fibo 123.6% projection) with stronger acceleration to focus 111 zone.
Res: 110.00; 110.22; 110.90; 111.44
Sup: 108.78; 108.03; 107.36; 107.00
Daily Technical Analysis
EUR/USD
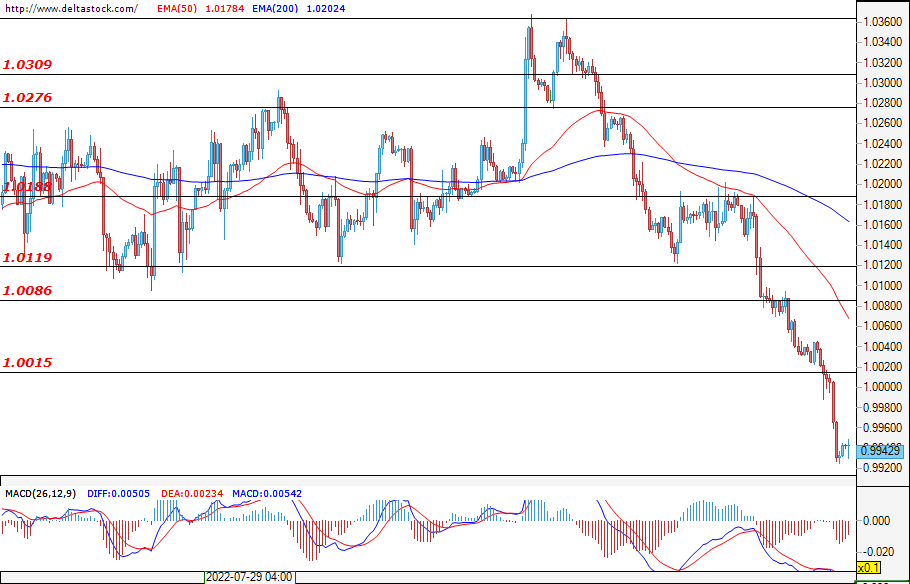
In less than a quarter, the U.S. dollar managed to reach parity with the euro for the second time. Unlike the previous time, where one euro traded for one dollar, the pair managed to confirm the breakthrough. This sell-off means that the bets for a more hawkish FED after the Jackson Hole symposium are on the rise. If the bears continue to dominate the market, then the pair will most likely target the support at 0.975 coming from the higher time frames. . The bulls, on the other hand, will have the difficult task to overcoming the resistance at 1.000 and then the next one at 1.011, if they are to have any chance of reversing the sell-off.
USD/JPY
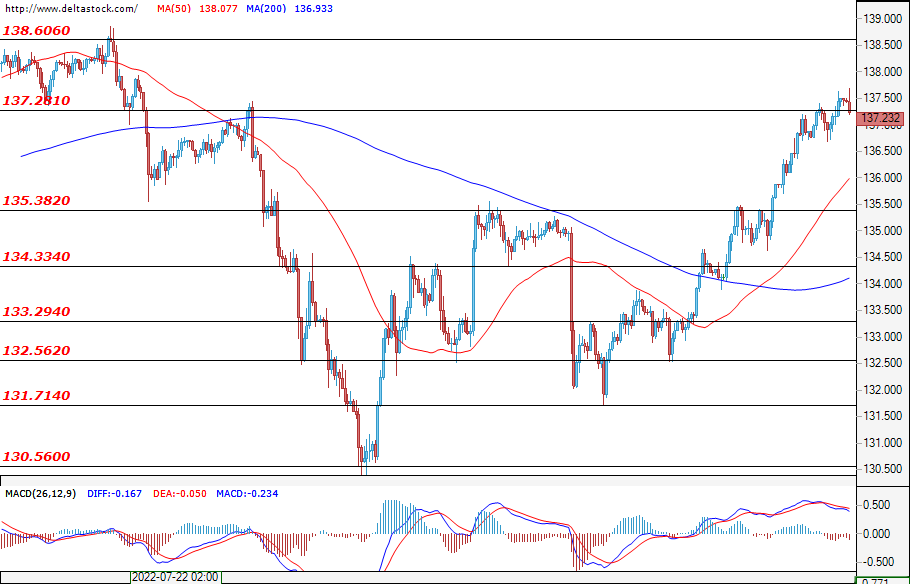
In the past trading session for the Ninja, the bulls made two attempts to breach the resistance at 137.28. The second breakout was solidified and investors took their first steps towards the next resistance at 138.60. If, however, the bears manage to reject the breakout, then they would try to reach the key support at 135.38. No important macroeconomic news is expected from Japan today.
GBP/USD
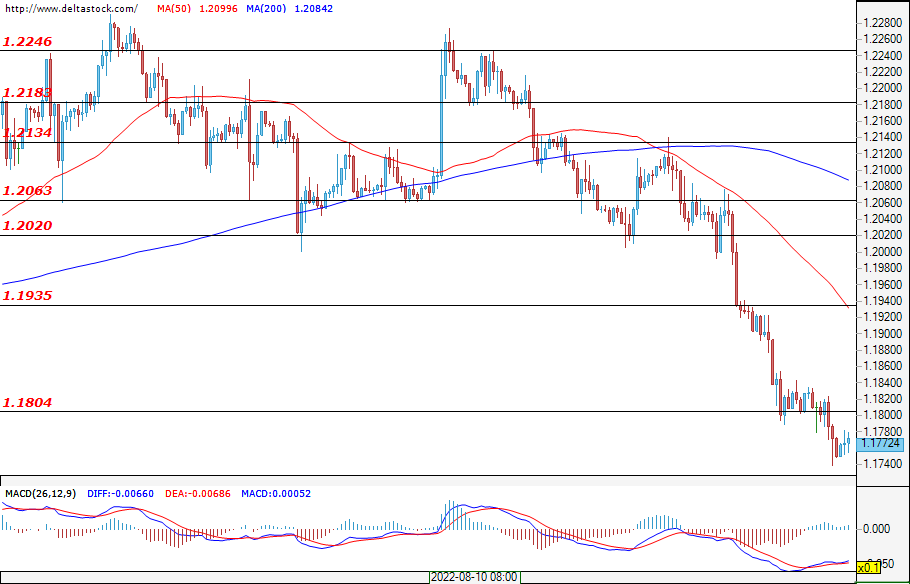
In the past week, Great Britain announced its highest inflation rate since 1982. This news encouraged the bears as they headed for the support at 1.1760. If, however, the bulls manage to turn the market around in their favour, then they will have to first breach the closest resistance at 1.1804, and only then consider the more distant one at 1.1935.
EUGERMANY40
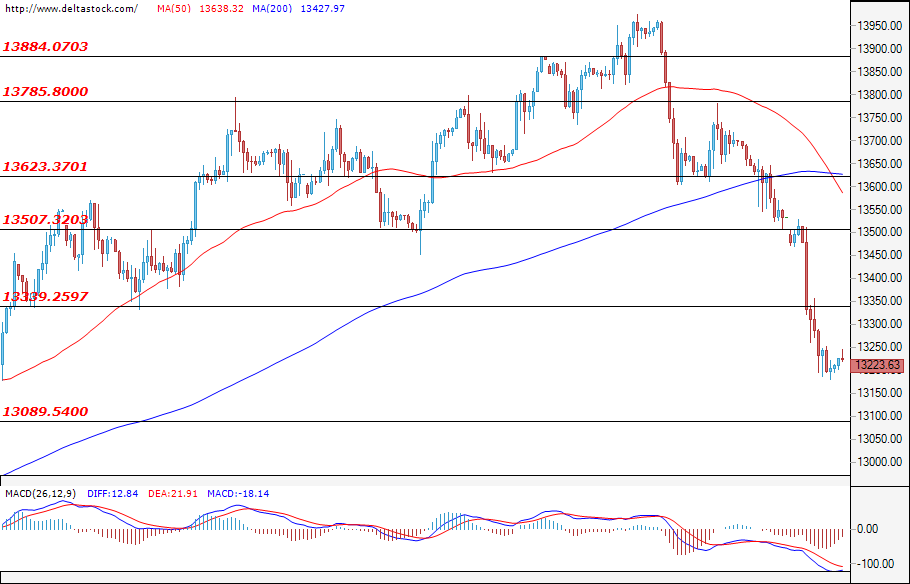
It took only yesterday's trading session for the bulls to overcome the two key supports at 13507 and at 13340. Today's session started with a slight success for the bulls and they managed to recover some of their lost positions, but not enough to breach the nearby resistance. Volatility is expected to remain elevated throughout the day, with the leading factor being the limited supply of Russian natural gas and the odds of a total shutdown of the pipeline rapidly rising as winter approaches. If this scenario materialises, then a recession scenario for Europe will be virtually inevitable.
US30
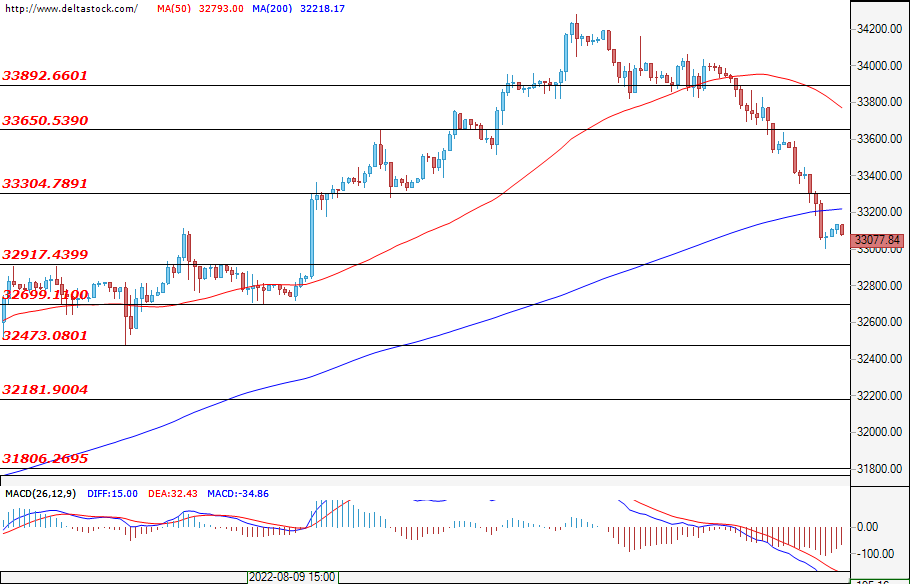
Looking at the U.S. blue-chip index, yesterday's trading session was marked by strong bearish success. The rising dollar aided the sell-off and the index fell below the support of 33300. Today's trading session started calmly – with a slight advantage for the bulls who are trying to recover their big losses from the past days. This calm state of the market is unlikely to continue throughout the session, but if it does, it could be disturbed at 14:00 GMT, when the U.S. new home sales numbers will be released. If the news negatively affects the index, then we may witness an attempt by the bears to breach the other important resistance at 32920.
US Oil: The Final Bullish Leg of Global Impulse is at the Start
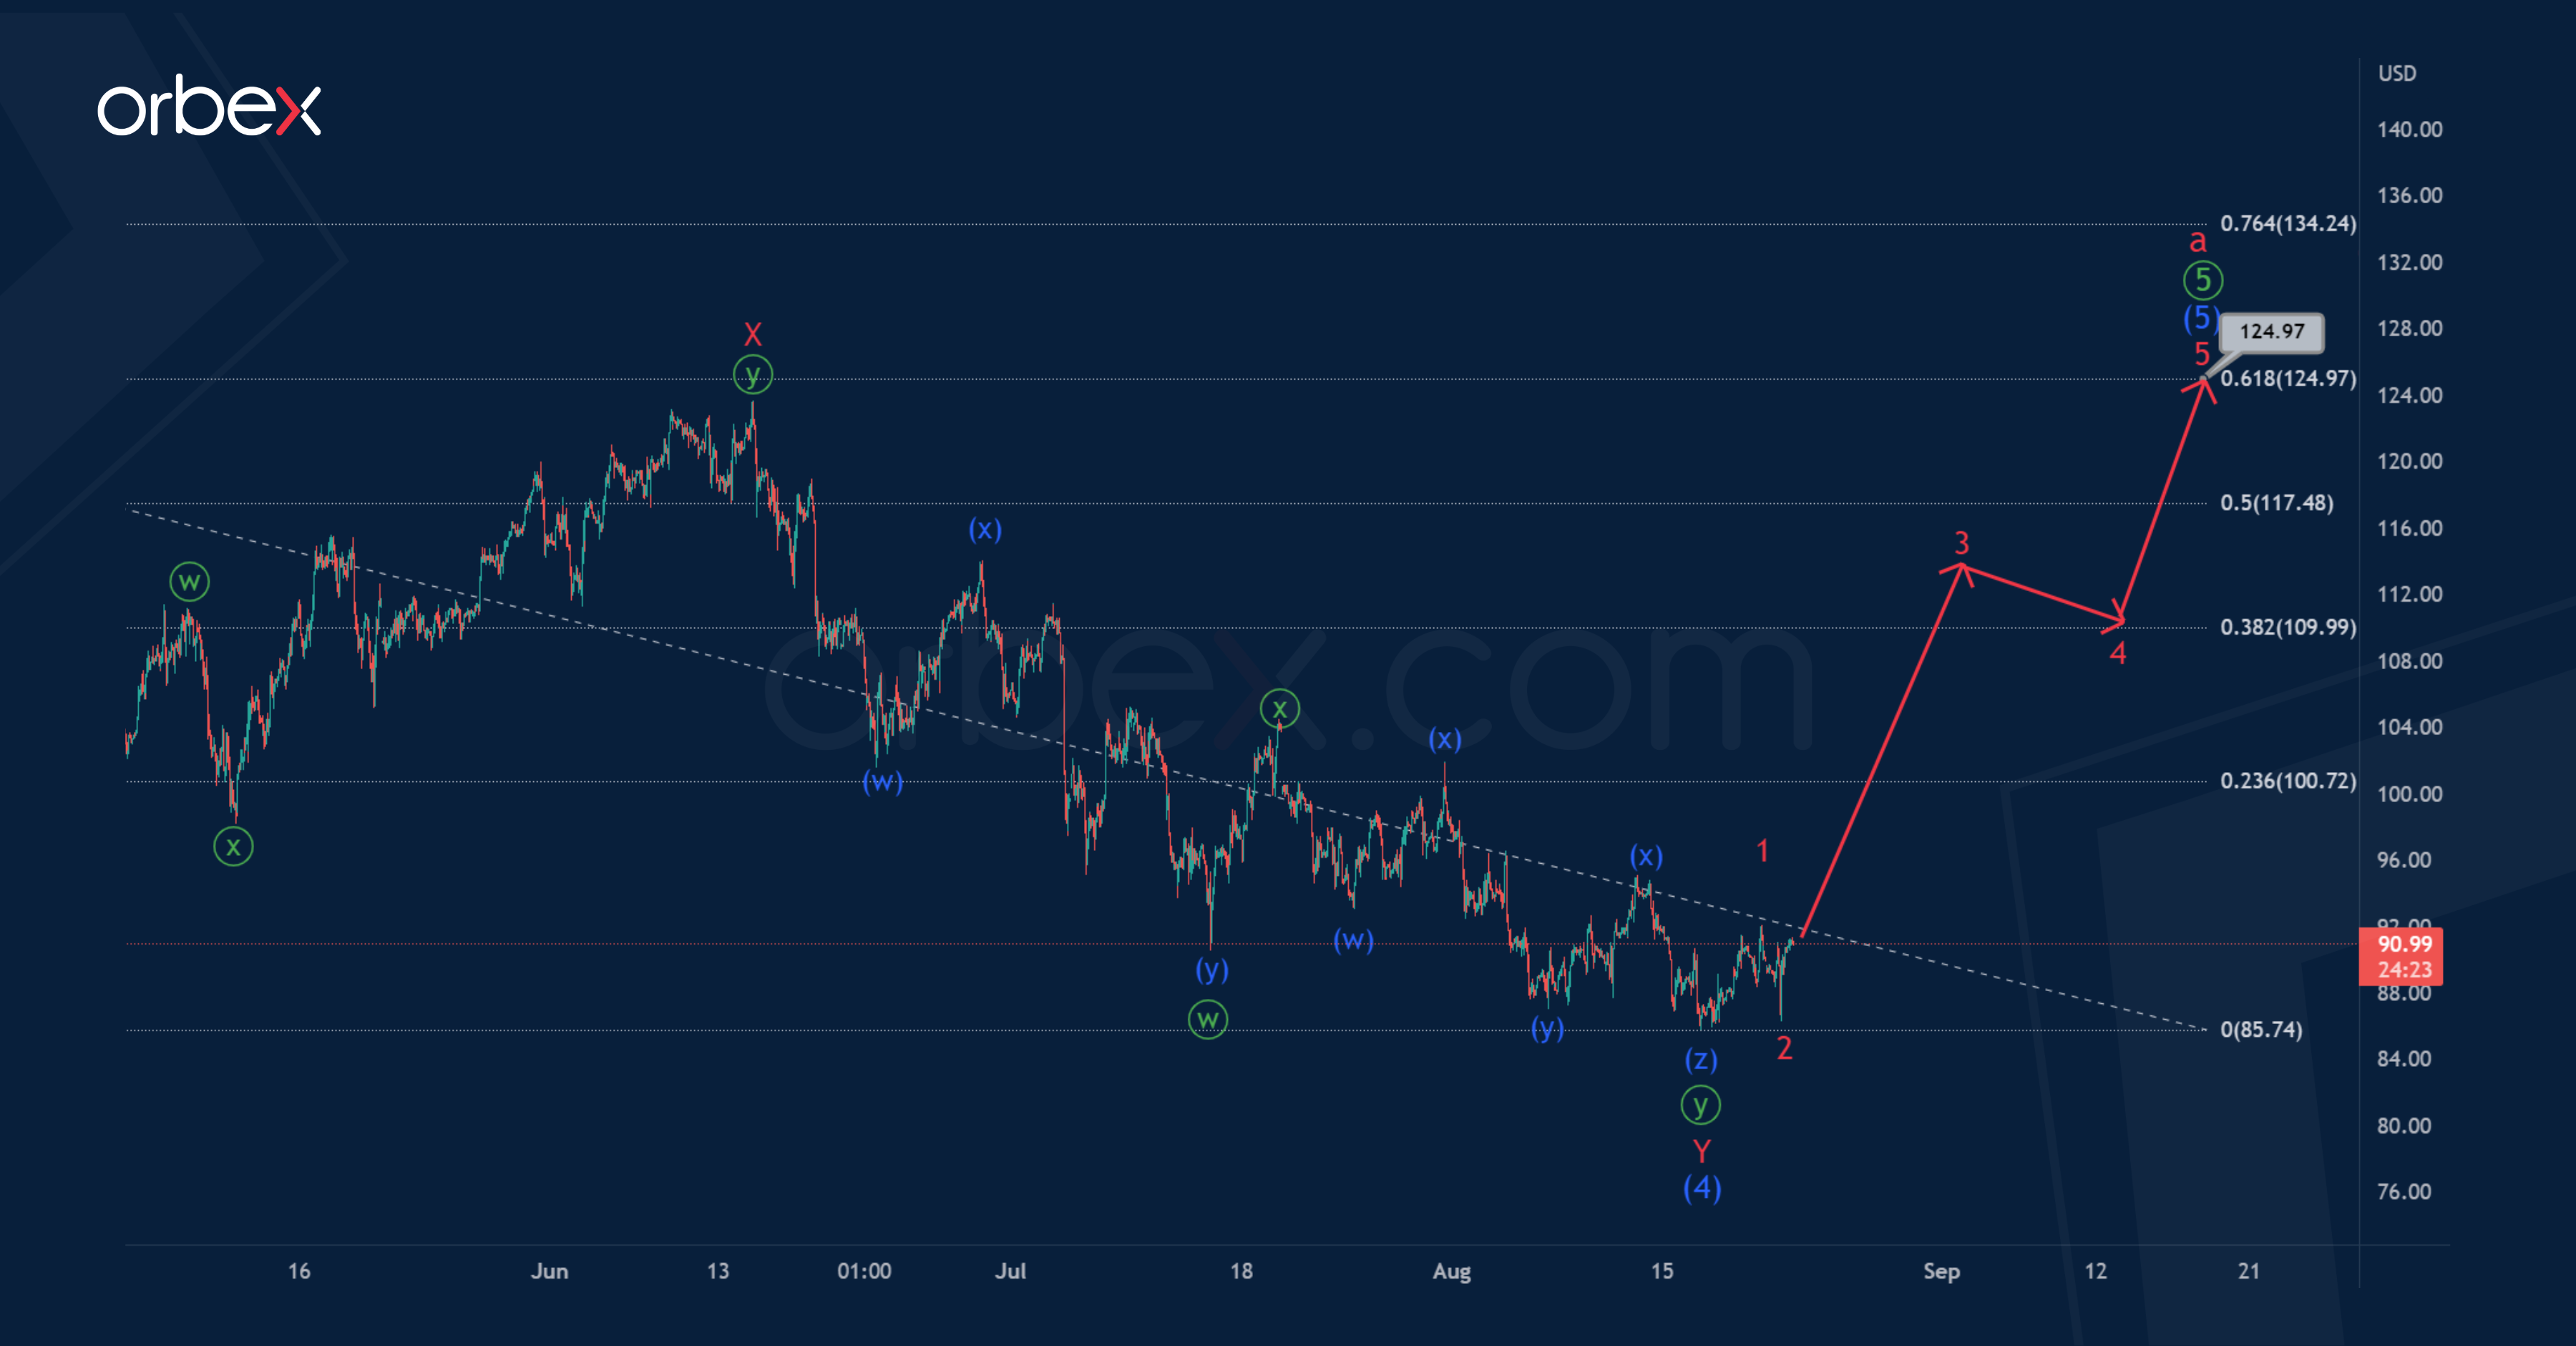
USOIL suggests the development of the final part of the global impulse wave a of the cycle degree.
The 1H timeframe shows the markup of the final primary wave ⑤, which takes the form of an intermediate impulse.
It is possible that an intermediate correction (4) in the form of a minor double zigzag was recently completed, then the price began to rise in the intermediate wave (5). It is assumed that the intermediate wave (5) will take the form of a standard minor impulse 1-2-3-4-5, as shown on the chart.
The end of the specified pattern is possible near 124.97. At that level, wave (5) will be at the 61.8% Fibonacci extension of impulse (3).
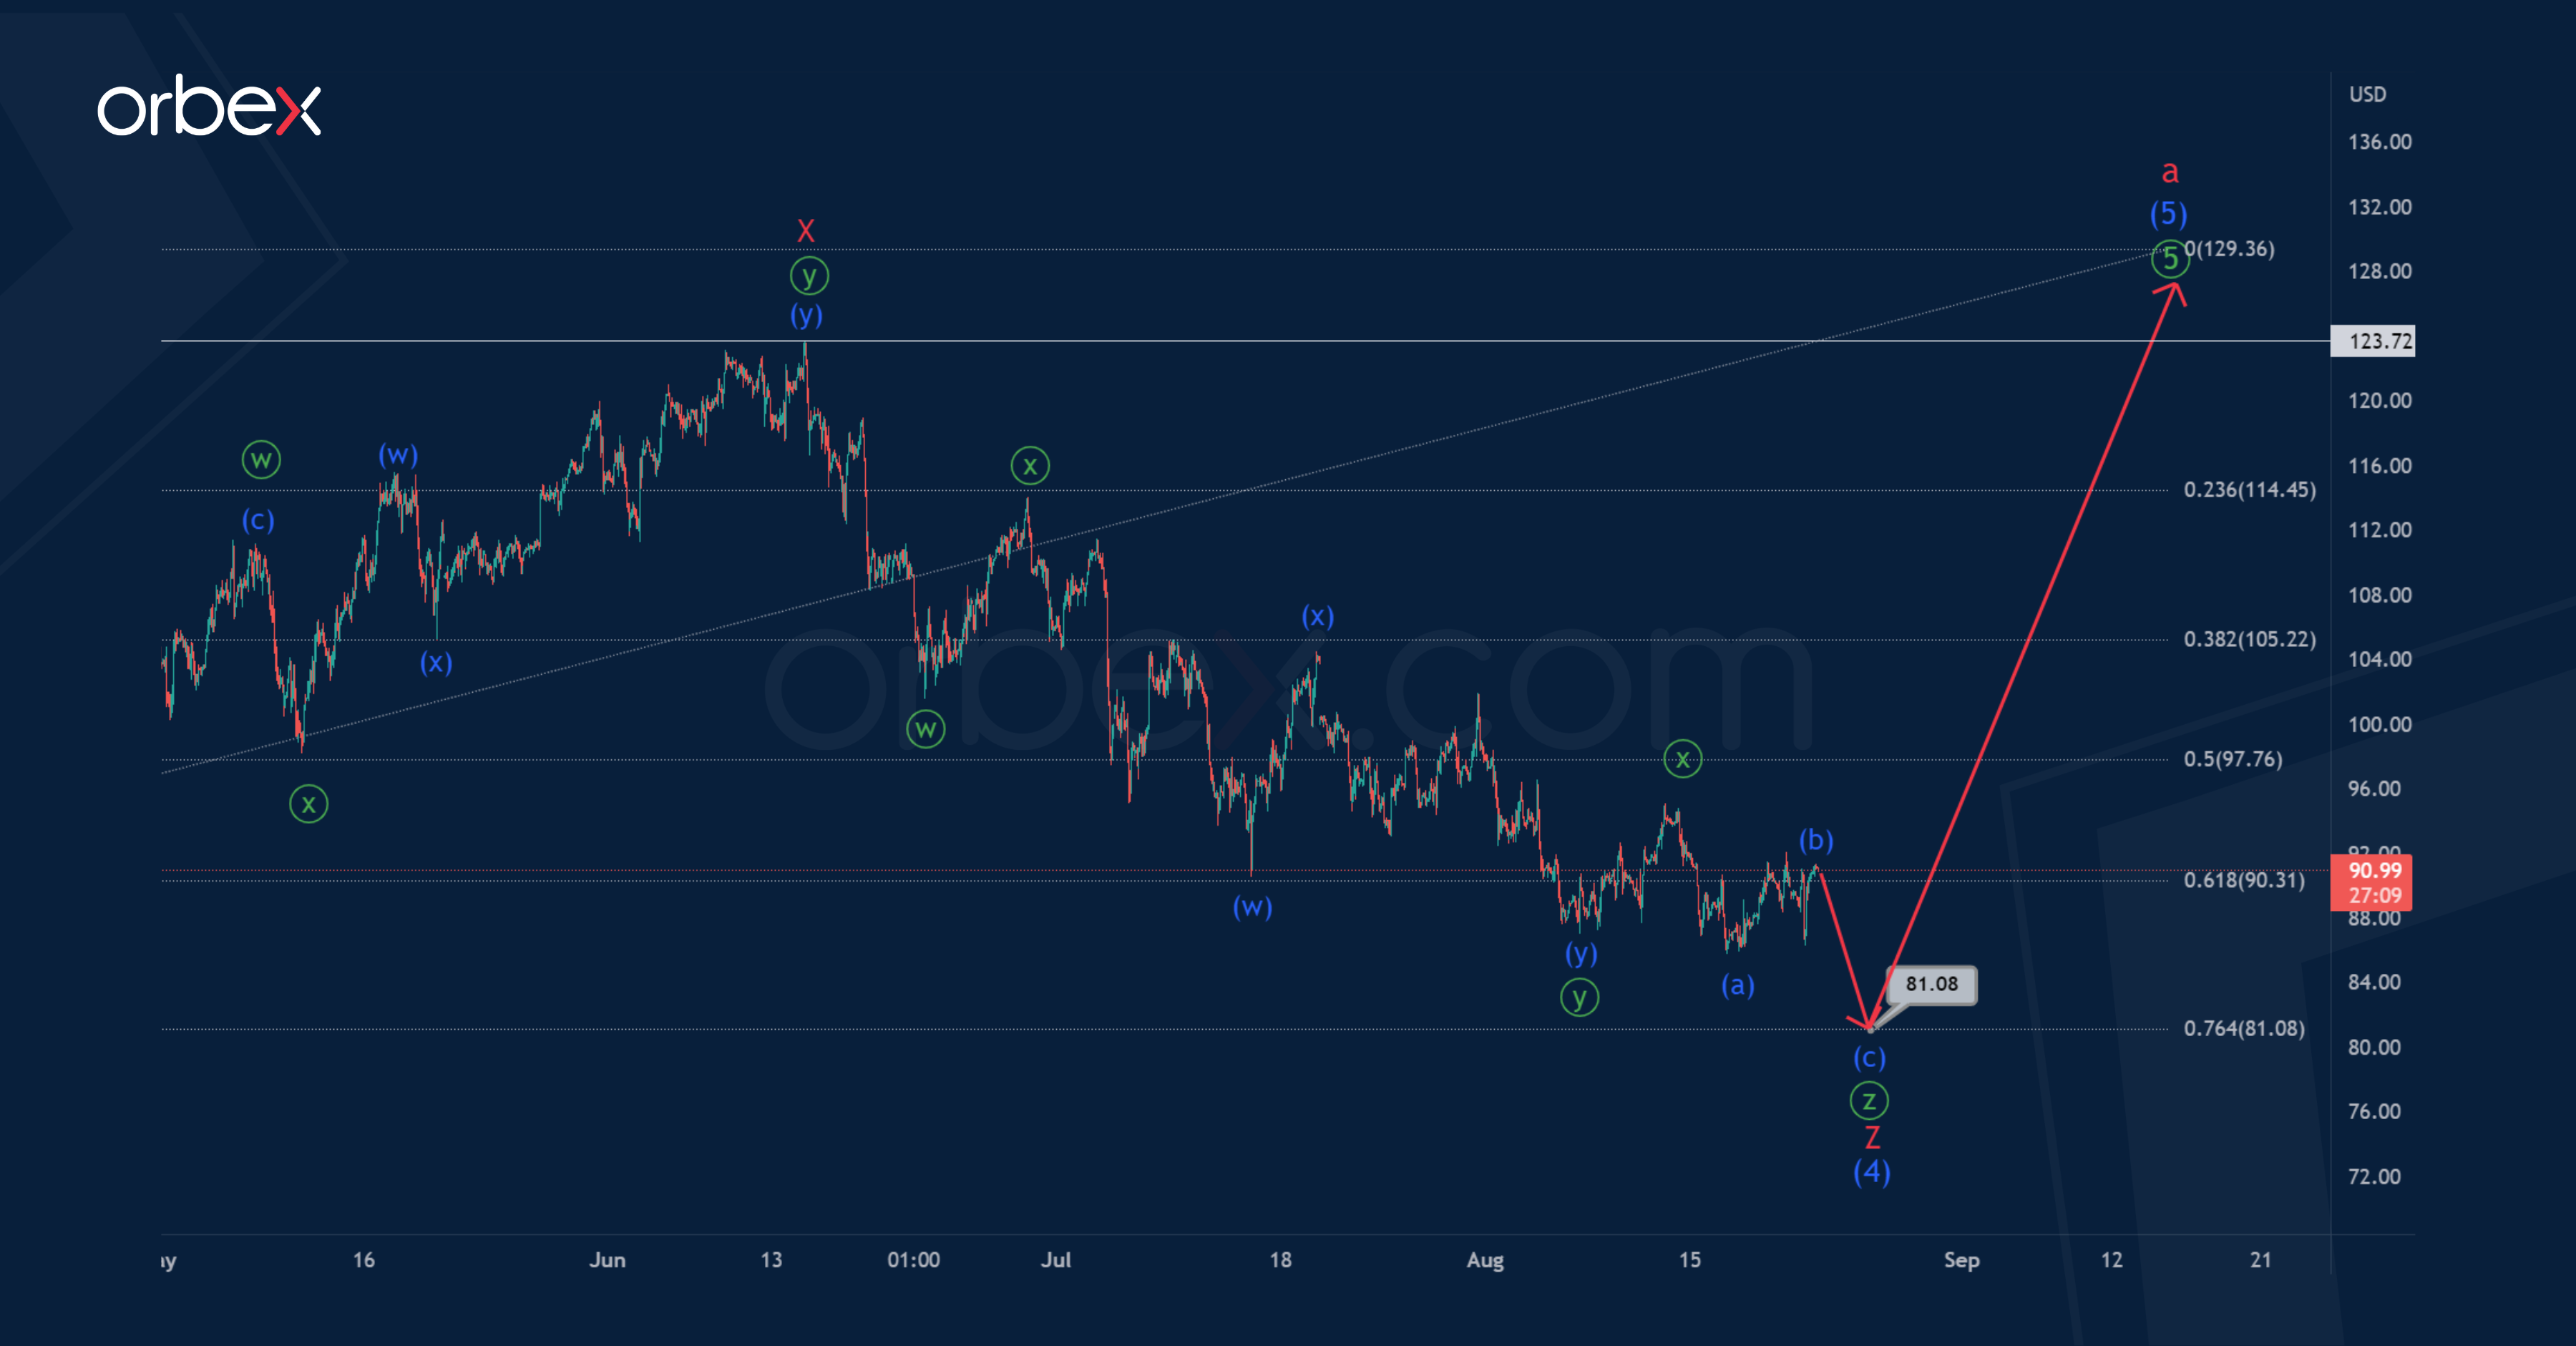
Let's consider the second option, where the construction of an intermediate correction (4) can be continued. Perhaps it will have the form of a triple zigzag W-X-Y-X-Z.
The minor sub-waves W-X-Y-X look finished. Thus, in the near future, the downward movement is expected to continue in the actionary wave Z, which can be completed in the form of a minute triple zigzag ⓦ-ⓧ-ⓨ-ⓧ-ⓩ.
The oil price may fall to 81.08. At that level, intermediate correction (4) will be at 76.4% of impulse (3).
After reaching this level, the market is expected to grow above the maximum – 123.72.
DAX 40 Struggles for Support
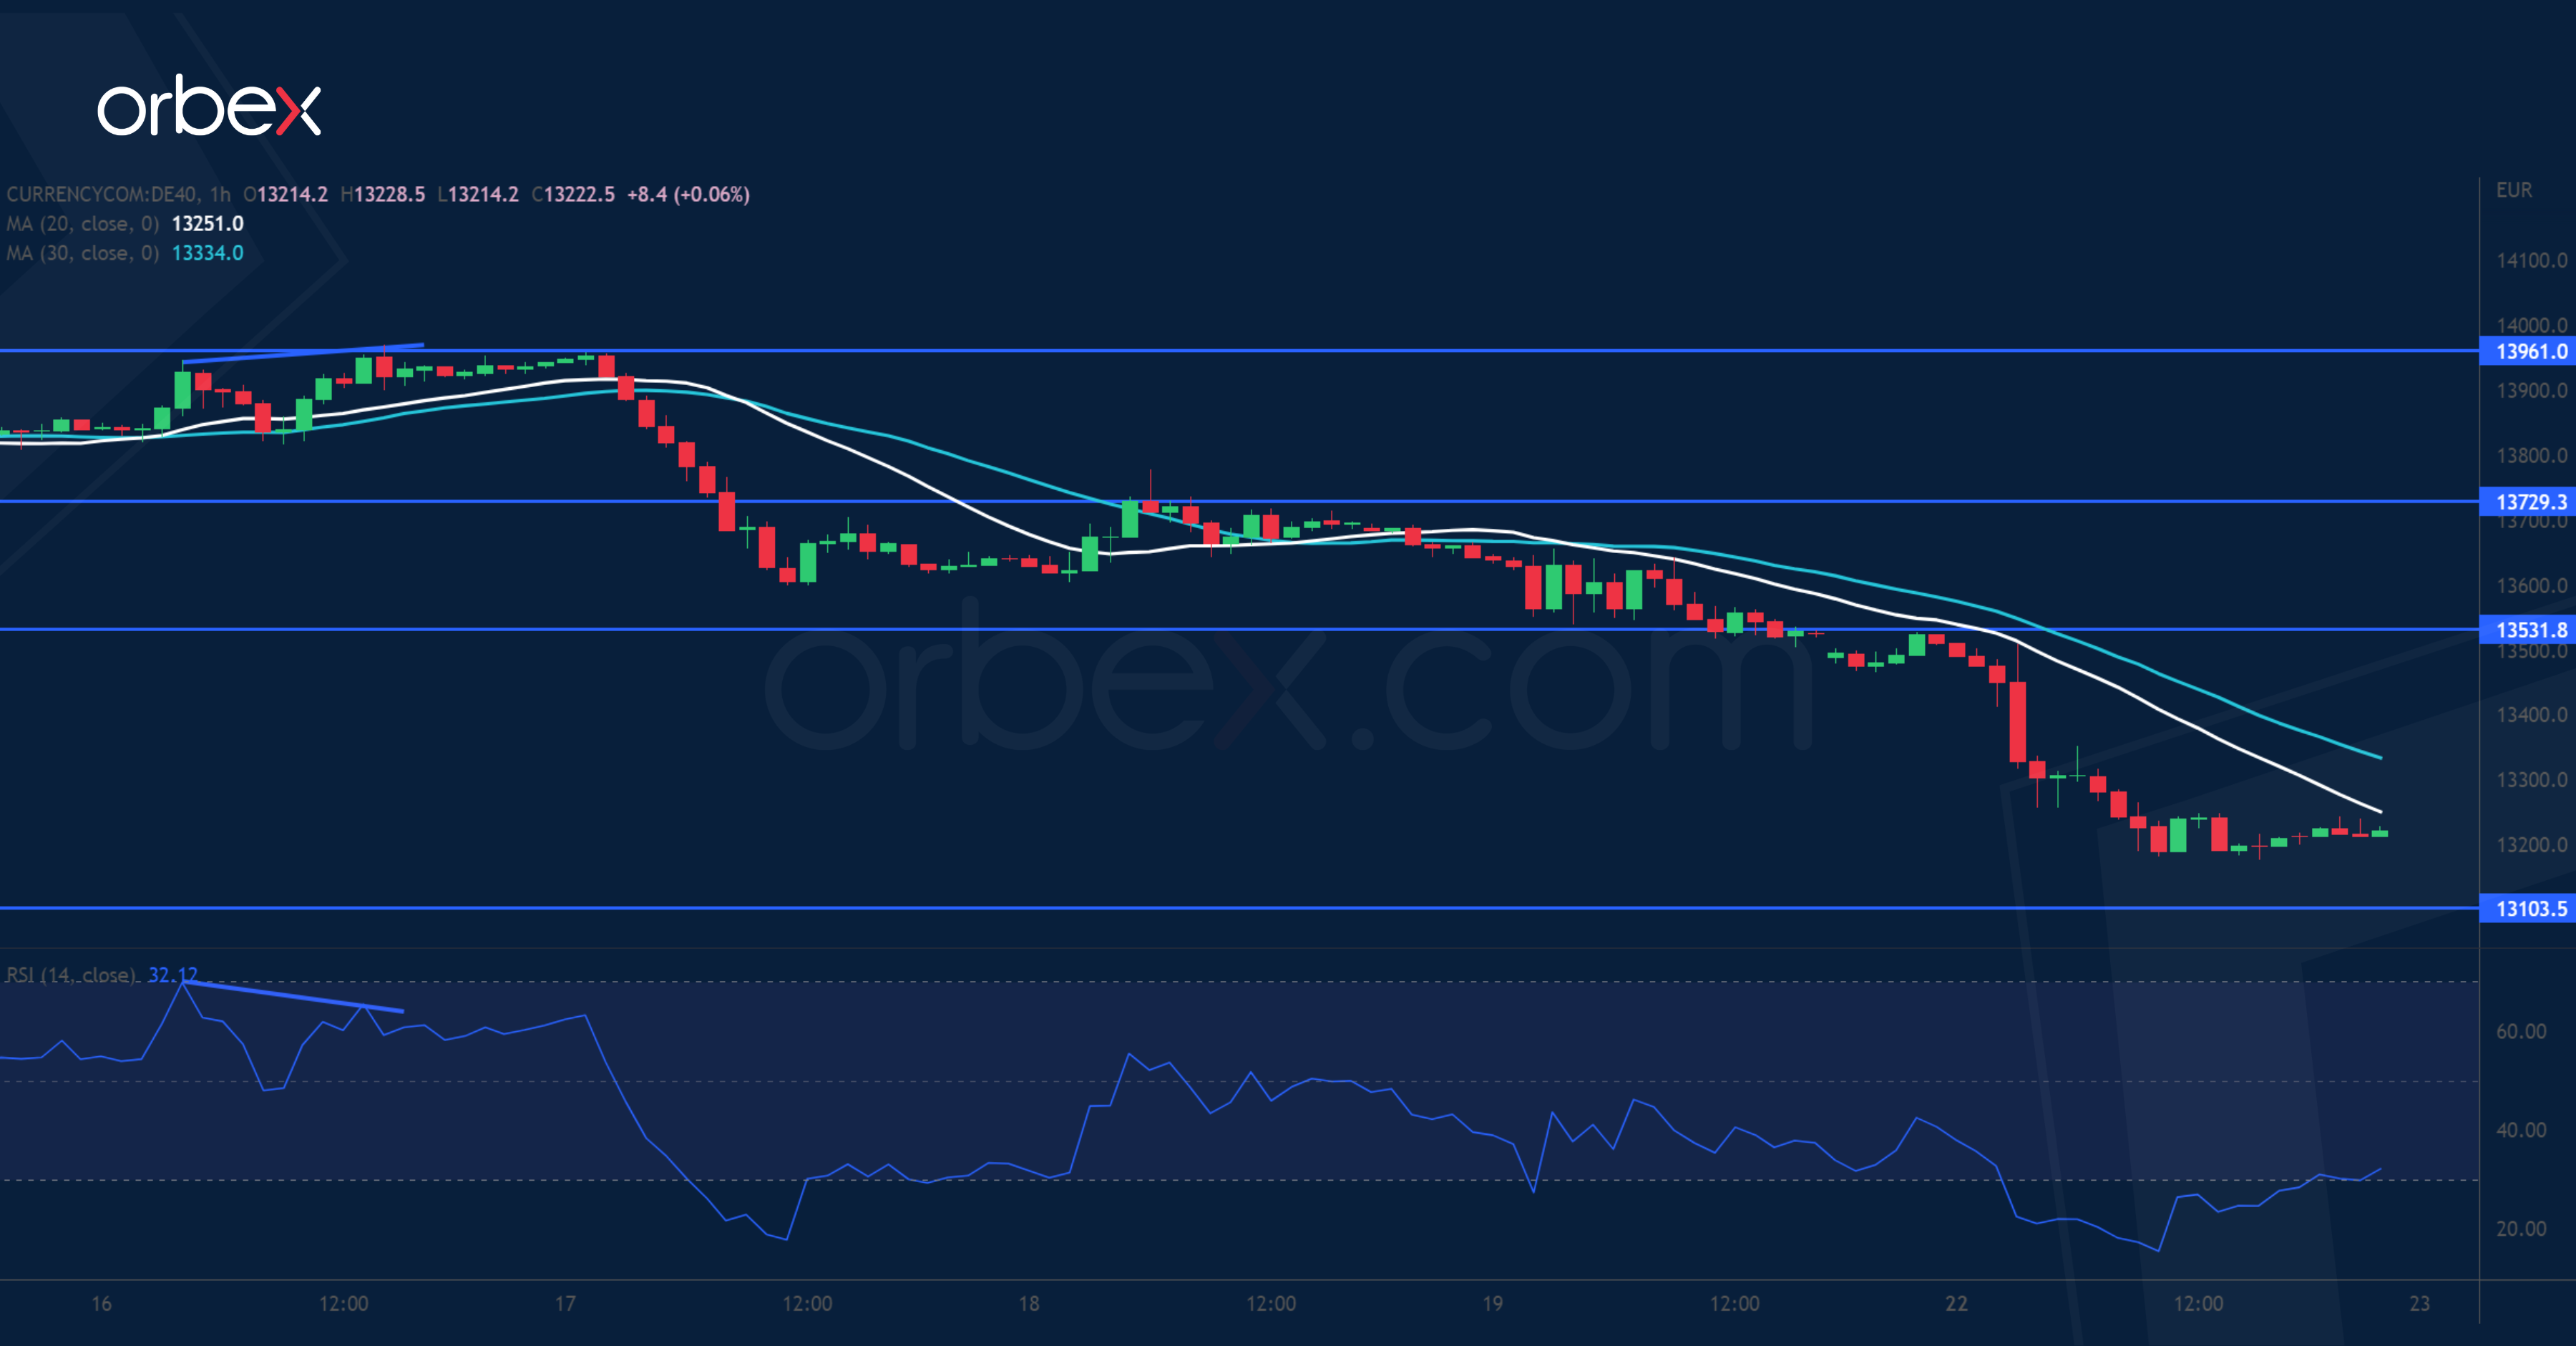
Equities plunge as investors fear that central banks could double down on their fight against inflation. The Dax 40 turned south at the start of a deep correction back in June (13960). As a sign of overextension, a bearish RSI divergence compounded the indicator’s repeated overbought conditions. An initial fall below 13730 forced out short-term positions. Then a dive below 13460 was a liquidation as more buyers bailed out. 13100 is a daily support and its breach could drive bids to 12700. 13530 has turned into a supply area.
AUD/USD Breaks Support
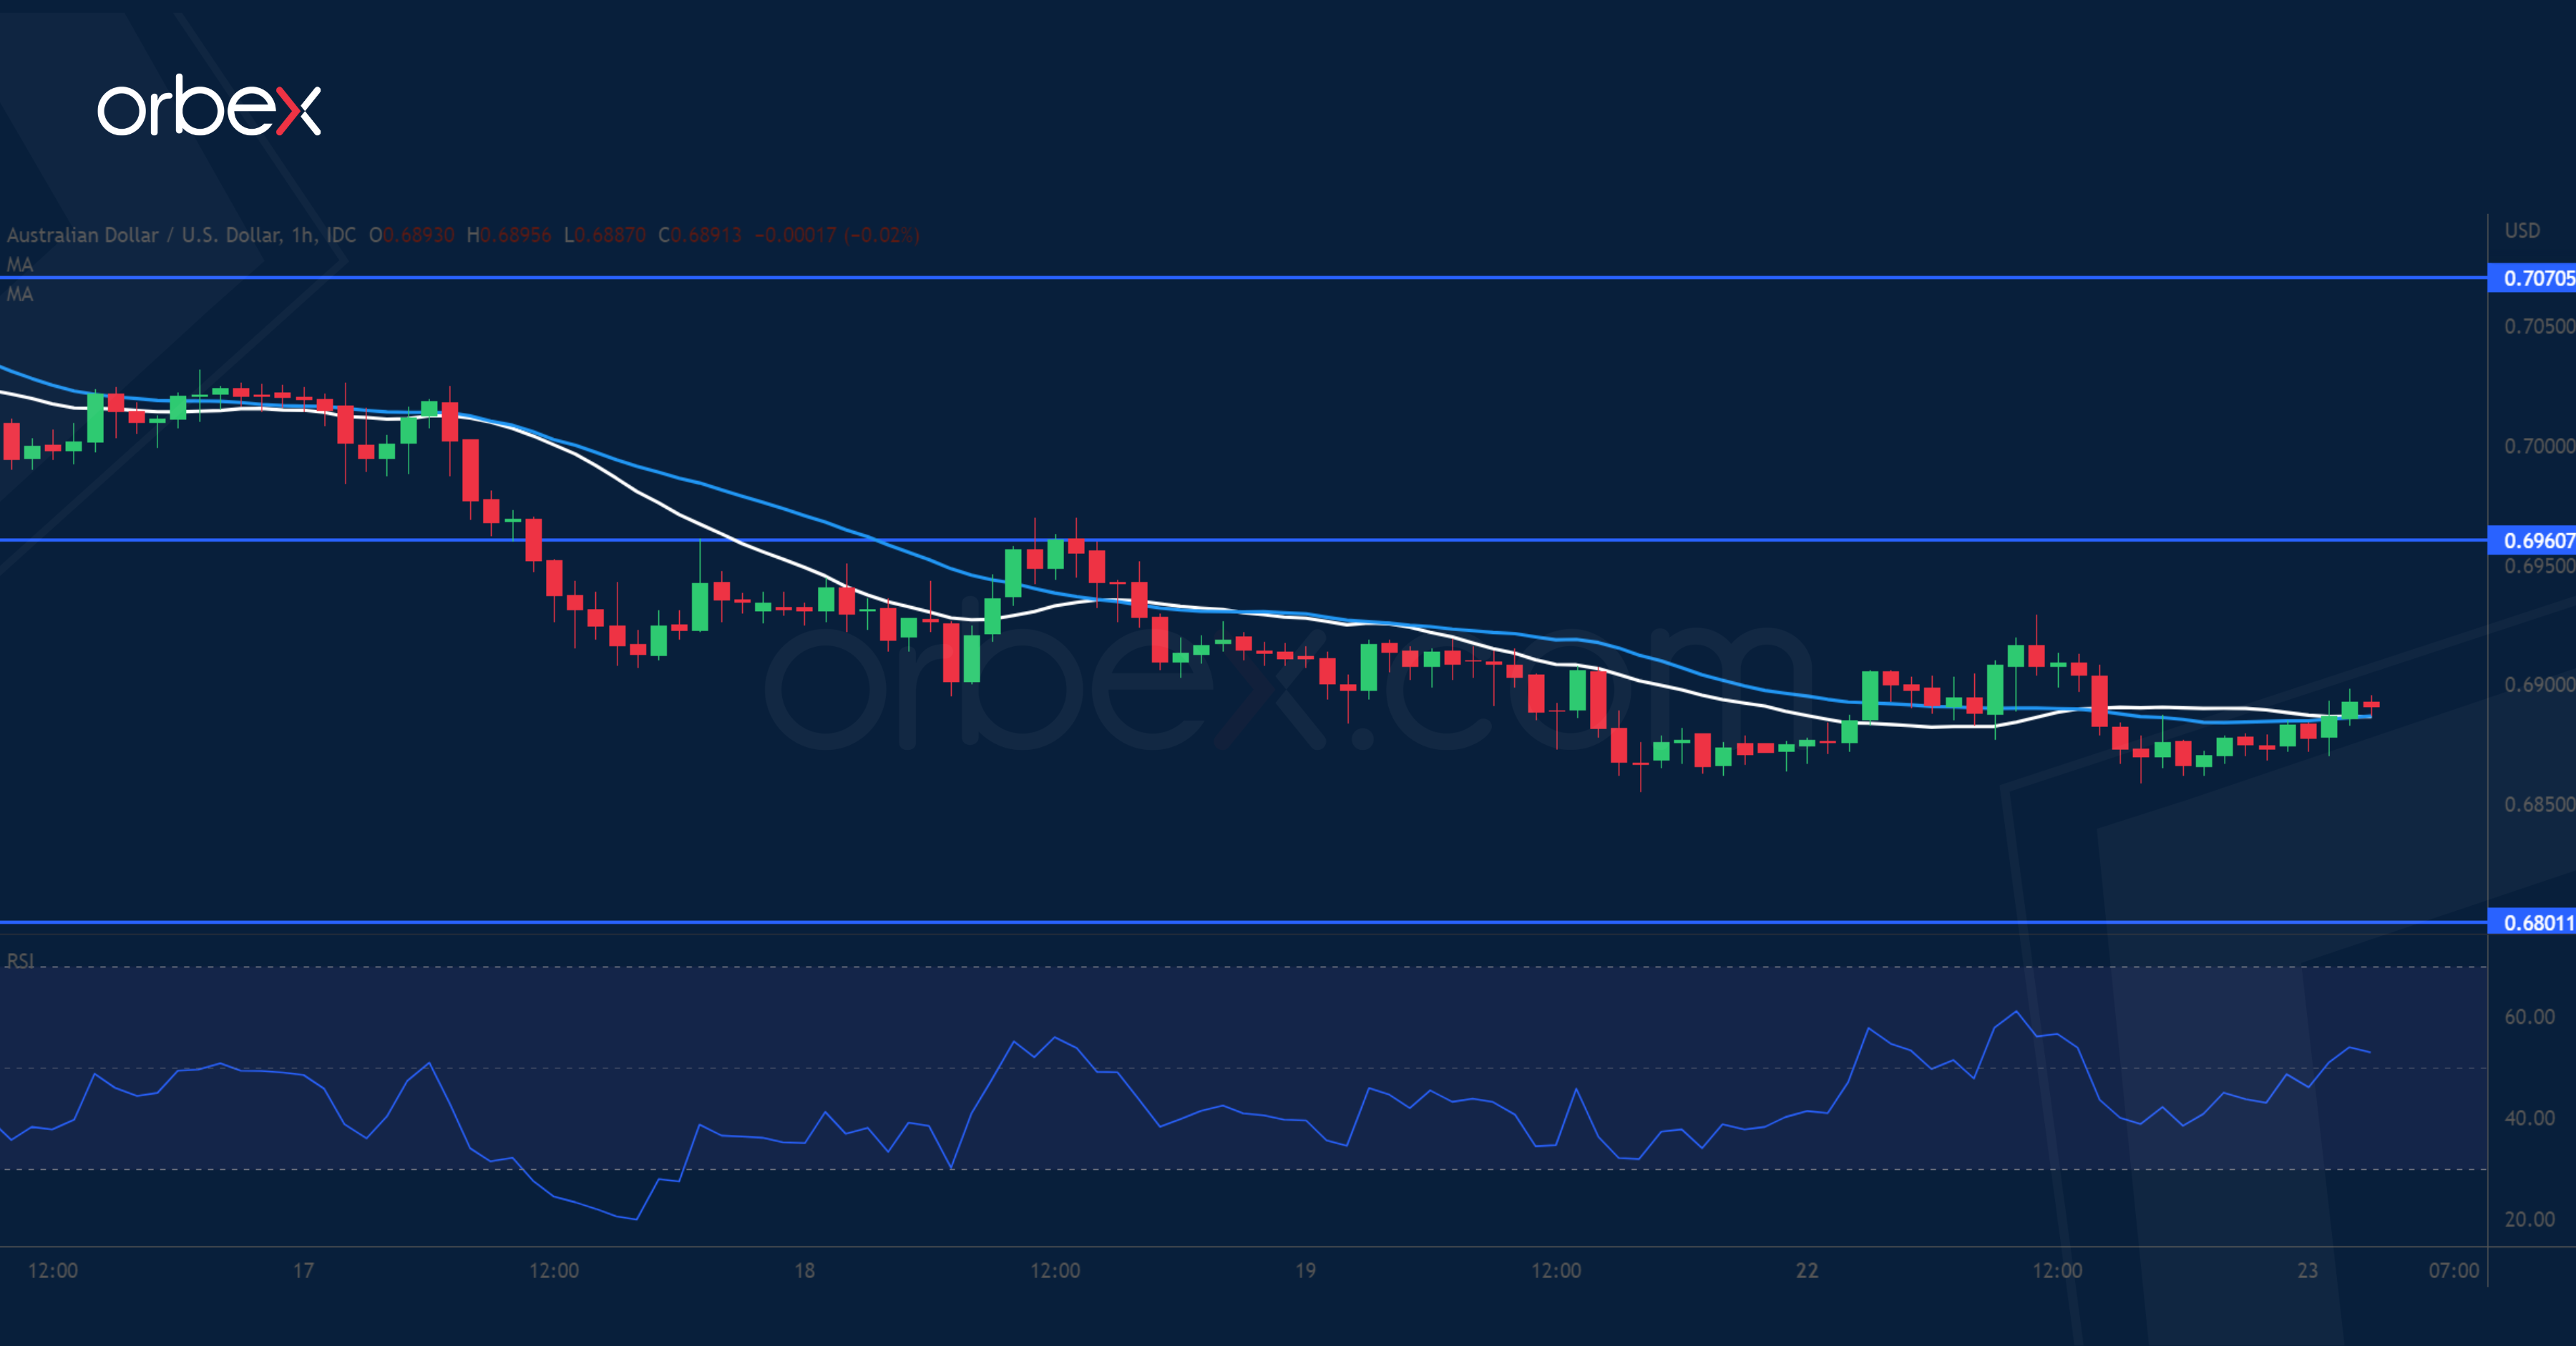
The Australian dollar slipped as risk appetite subsided across the board. The pair met stiff selling pressure at the start of the liquidation in June (0.7130). A fall below 0.6950 has put the bulls on the defensive and invalidated this month’s recovery in the process. Then a follow-up dip below 0.6870 could further weigh on sentiment. 0.6800 at the origin of a previous bullish breakout is the next level to gauge buying interest. 0.6960 has become a key resistance where the bears could be expected to sell into strength.
USD/CHF Pops Resistance
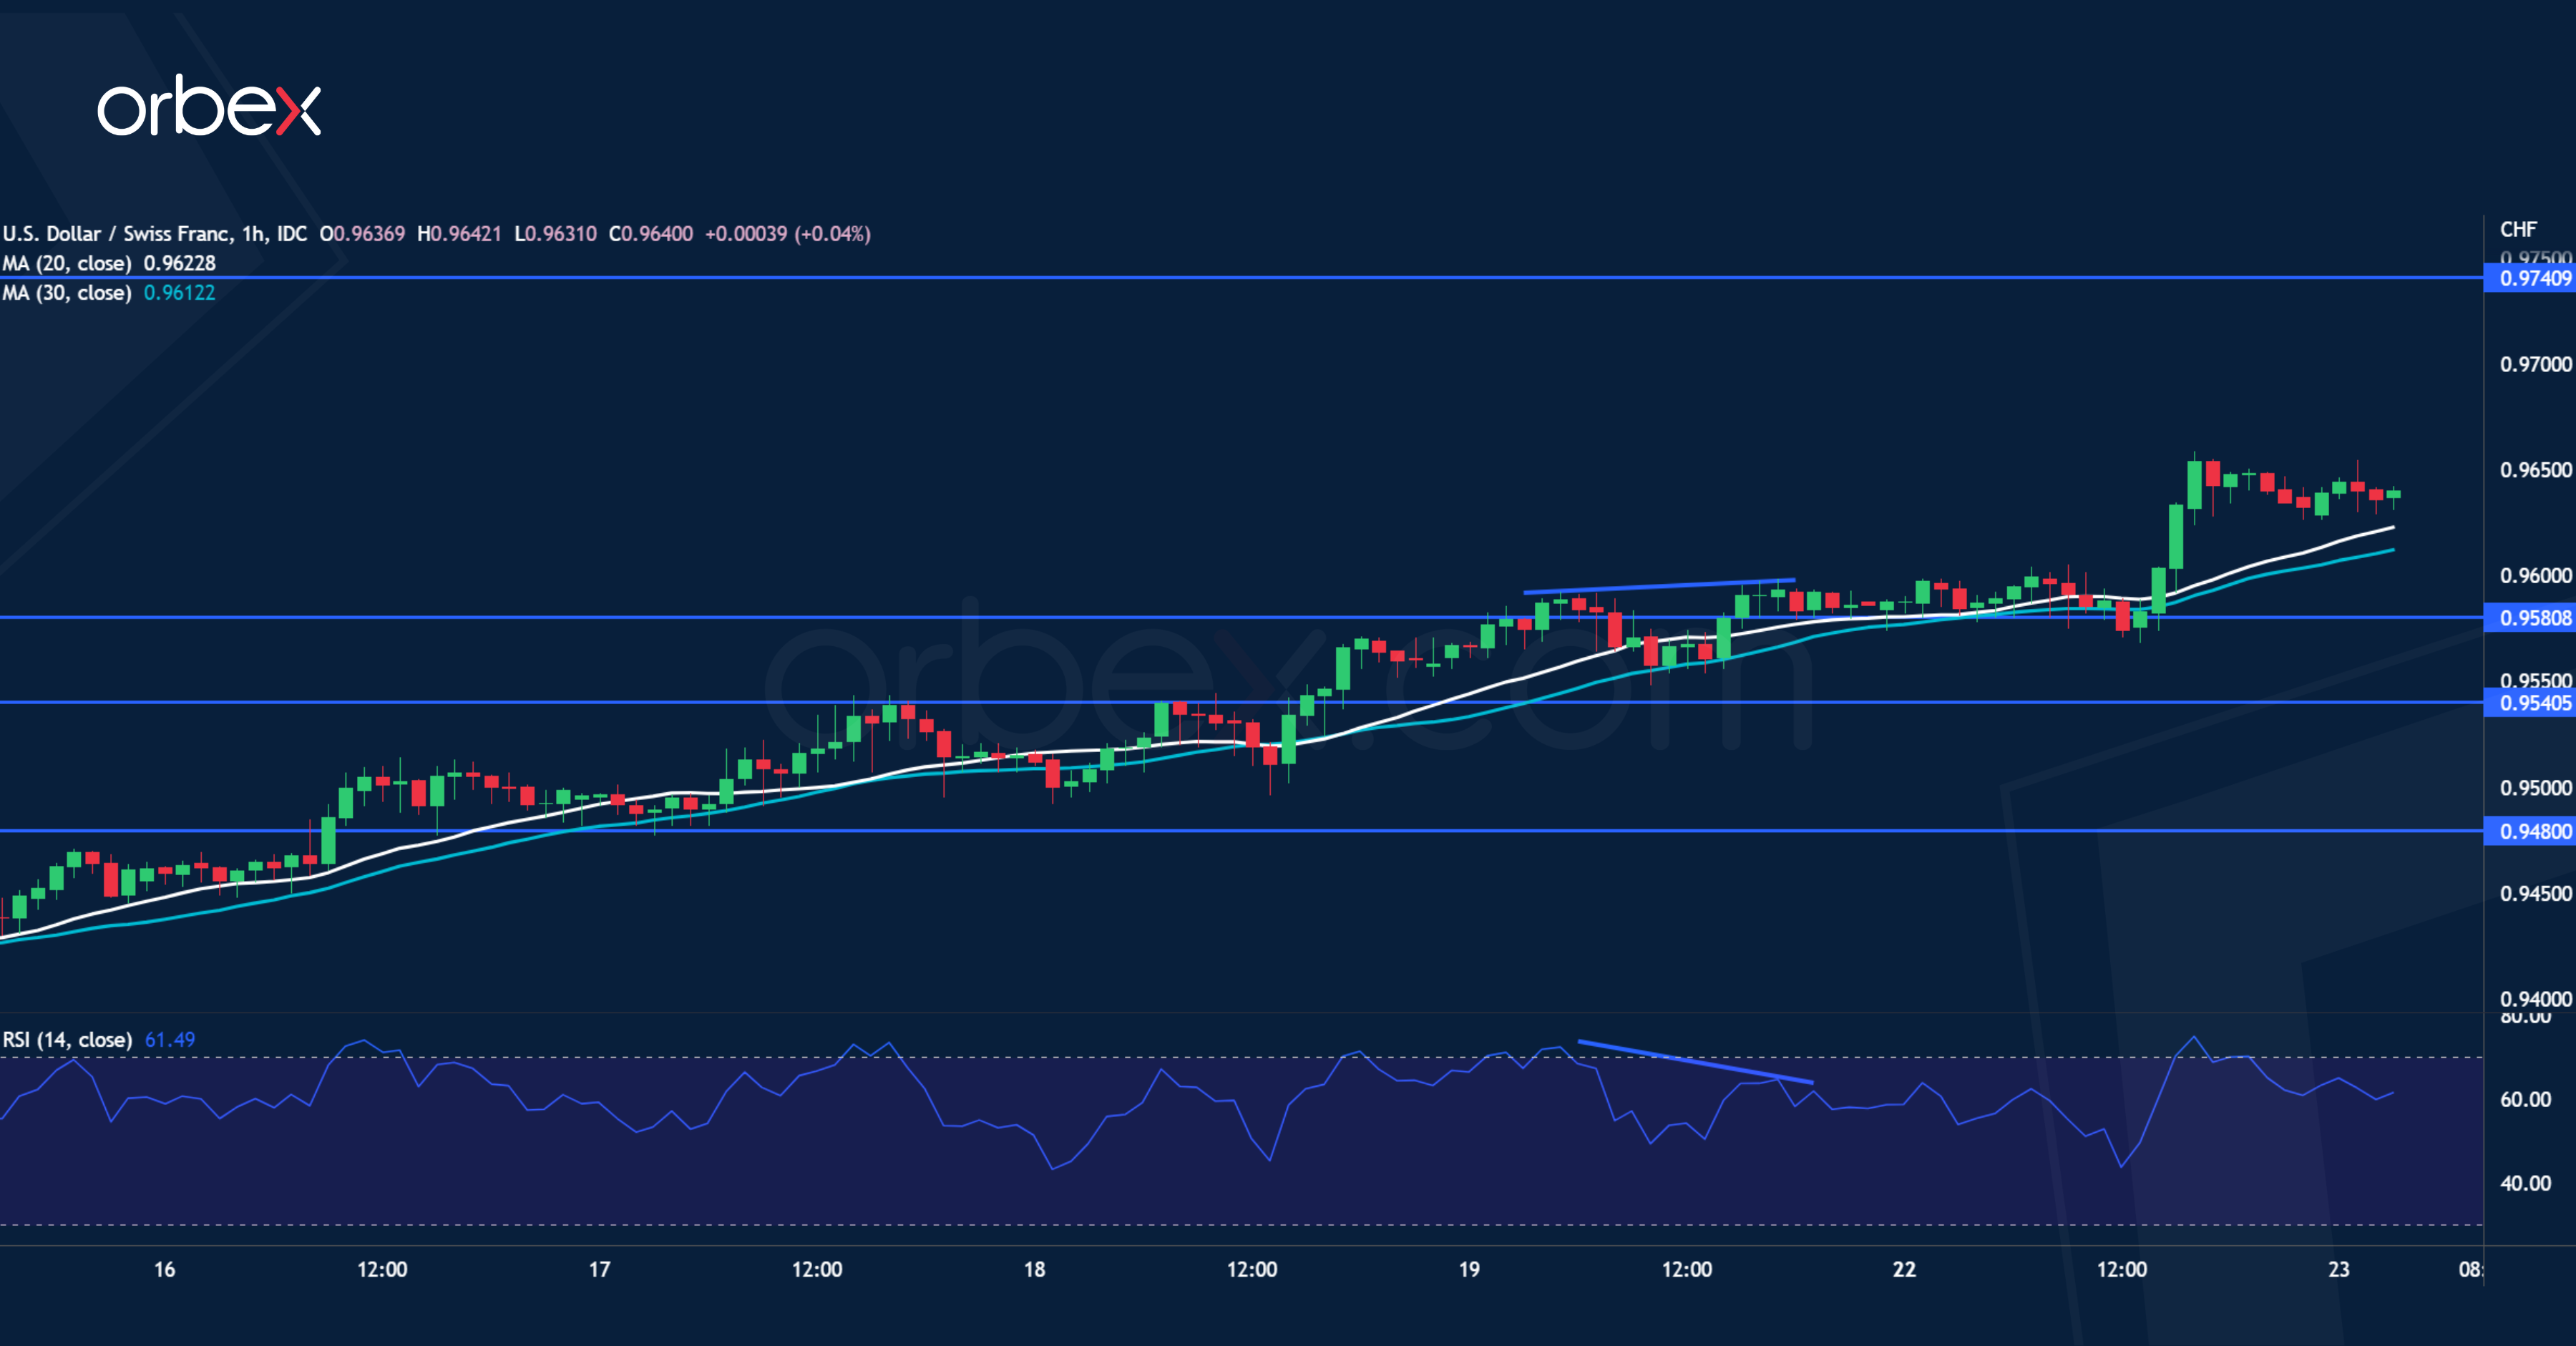
The US dollar rallies as Fed officials reiterate an aggressive tightening stance. A bearish RSI divergence as the pair grinded the supply zone at August’s high (0.9650) turned out to be a false alert for lack of confirmation. Instead, a bullish breakout has prompted sellers to cover their positions and might trigger an extended rally towards 0.9740. An overbought RSI could drive the greenback lower temporarily as intraday traders take profit. 0.9580 at the base of the latest momentum is the closest support and 0.9540 a second layer.
Markets Whacked by Hawkish Fed Worries
Asian shares were painted red on Tuesday, tracking a heavy sell-off on Wall Street overnight as concerns over upcoming aggressive Fed hikes sapped risk sentiment. European shares took a beating in the previous session amid fears around the region’s energy crisis. Stocks are expected to open lower again this morning thanks to the negative sentiment and recession fears.
In the currency space, king dollar flexed its safe-haven muscles while EURUSD cut through parity like a hot knife through butter, touching levels not seen since 2002. Oil bulls regained hope overnight thanks to comments from Saudi Arabia regarding potential production cuts. And despite the risk-off mood, gold was hammered by a stronger dollar and rising Treasury yields.
There is a strong sense of unease across financial markets as investors grapple with inflation concerns, jitters over tightening US monetary policy, and recession fears. This will be a big week for markets thanks to the annual Jackson Hole Economic Symposium where central bankers and financial heavyweights congregate to discuss major economic issues. Investors hope to use this major event to gain fresh insight into the Fed’s thoughts on inflation, economic growth, and monetary policy. All eyes will be on Federal Reserve Chair Jerome Powell’s speech on Friday which is the main risk event and potential market shaker. What Powell reveals during the speech or chooses to hold back could set the tone for global markets in the weeks ahead.
On the data front, investors will be keeping an eye on the August S&P global flash PMIs for the eurozone due to be published this morning. Further declines are forecast as the energy crisis takes its toll on demand in manufacturing and services.
Will Fed’s Powell support dollar bulls?
The dollar continues to draw ample strength from risk aversion and fears over the Fed reasserting its hawkish message this week. Investors are looking for fresh clarity over how big future rate hikes will be and the strength of the US economy in the face of high inflation. If Powell fortifies expectations around the Fed moving ahead with another jumbo rate hike in September and more tightening ahead, this could boost the dollar. Alternatively, a cautious- sounding Powell that expresses concerns over the US economic outlook may reduce the odds of big rate moves, weakening the dollar.
Currency spotlight – EURUSD
After sinking back below parity, how much lower can the EURUSD trade? An appreciating dollar made easy work of the 1.000 level yesterday as prices tumbled to levels not seen since late 2002. The downside momentum is potent with the first level of interest at 0.9900.
A solid breakdown and daily close under this point could open the doors towards 0.9650 which acted as strong support back in the autumn of 2002. Should 0.9900 prove to be reliable support, prices could experience a bounce back to parity before resuming the downtrend.
Commodity spotlight – Gold
It has not been a great start to the week for gold. The precious metal was smothered by a stronger dollar, rising Treasury yields, and Fed rate hike jitters.
Prices are trading at $1736 as of writing with the next key level of support found at $1724. The potential for volatility in the precious metal is high this week, thanks to Jackson Hole and Powell’s remarks potentially acting as a fresh fundamental spark for gold. If prices are able to breach $1724, a selloff towards $1700 is on the cards. Alternatively, a move back above $1752 may open a path back towards $1770 and $1800, respectively.
USD/CAD Daily Outlook
Daily Pivots: (S1) 1.2996; (P) 1.3029; (R1) 1.3085; More...
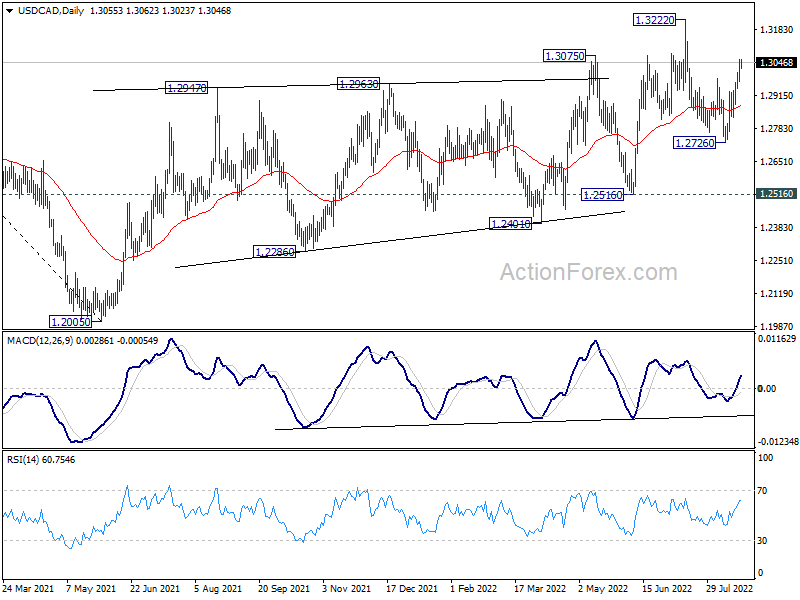
USD/CAD's rise from 1.2726 is still in progress. Corrective decline from 1.3222 should have completed with three waves down to 1.2726. Further rally would be seen back to retest 1.3222 high. On the downside, break of 1.2933 minor support will mix up the outlook and turn intraday bias neutral again.
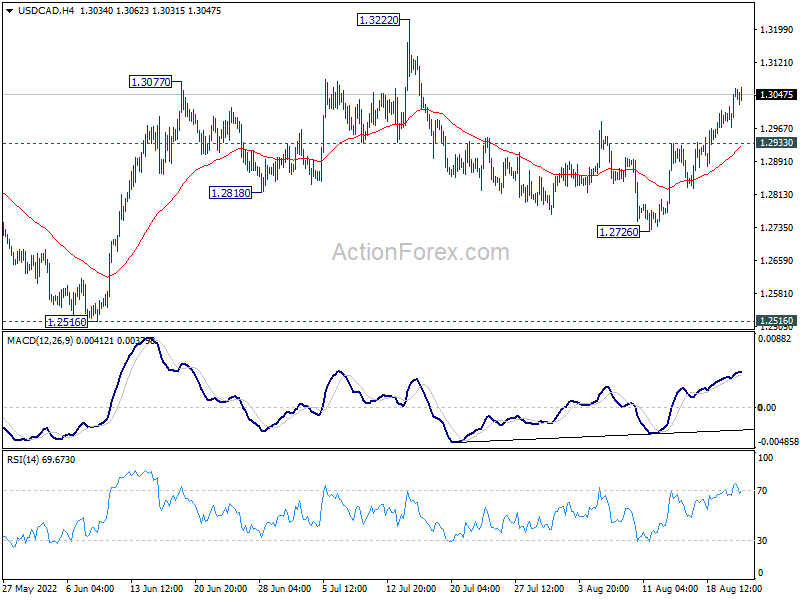
In the bigger picture, down trend from 1.4667 (2020 high) should have completed at 1.2005, after defending 1.2061 long term cluster support. Rise from there should target 61.8% retracement of 1.4667 to 1.2005 (2021 low) at 1.3650. This will remain the favored case now as long as 1.2516 support holds.
AUD/USD Daily Report
Daily Pivots: (S1) 0.6850; (P) 0.6889; (R1) 0.6917; More...
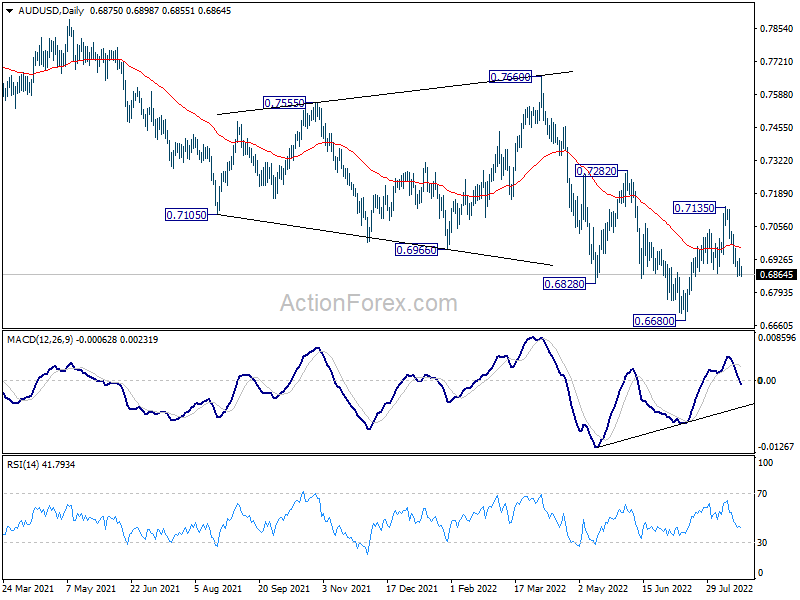
Despite some loss of downside momentum, intraday bias in AUD/USD stays on the downside. Corrective rebound from 0.6680 should have completed with three waves up to 0.7135. Deeper decline should be seen for retesting 0.6680 low next. On the upside, above 0.6969 minor resistance will mix up the outlook and turn intraday bias neutral first.
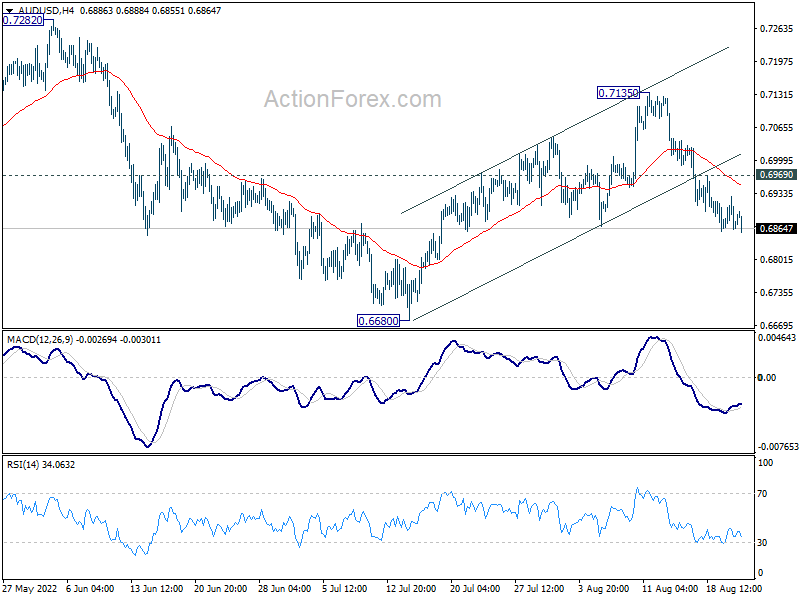
In the bigger picture, price actions from 0.8006 (2021 high) is seen more as a corrective pattern to rise from 0.5506 (2020 low). Or it could also be a bearish impulsive move. In either case, outlook will remain bearish as long as 0.7282 resistance holds. Next target is 61.8% retracement of 0.5506 to 0.8006 at 0.6461.
USD/JPY Daily Outlook
Daily Pivots: (S1) 136.89; (P) 137.27; (R1) 137.84; More...
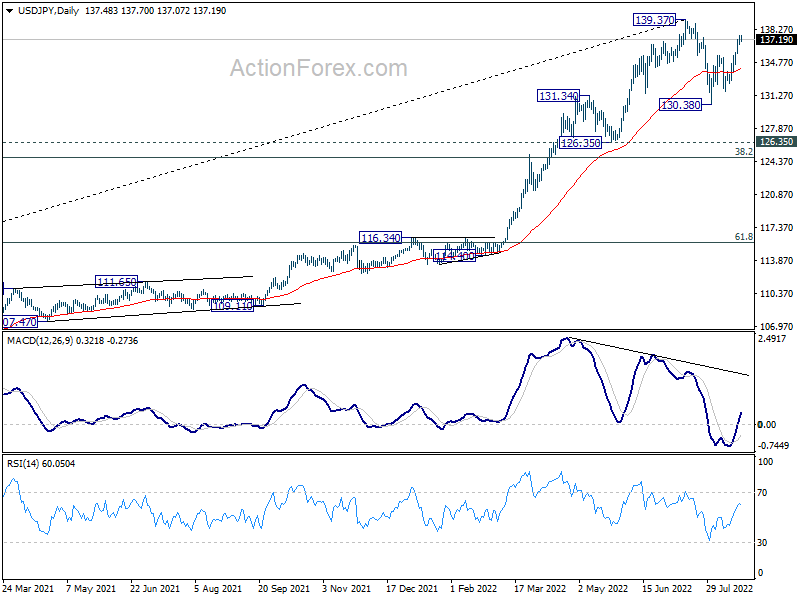
Despite some loss of upside momentum, intraday bias in USD/JPY stays on the upside for retesting 138.37 high. Strong resistance could be seen from 139.37 high to bring another fall from to extend the corrective pattern from there. On the downside below 134.61 minor support will turn intraday bias back to the downside for 131.72 support.
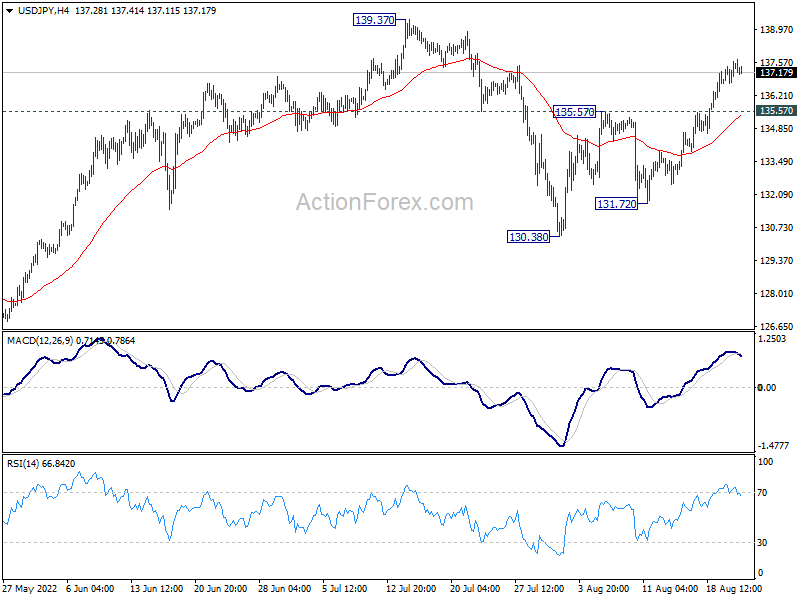
In the bigger picture, price actions from 139.37 medium term top are seen as a corrective pattern to up trend from 101.18 (2020 low). While deeper decline cannot be ruled out, outlook will stays bullish as long as 55 week EMA (now at 123.21) holds. Long term up trend is expected to resume through 139.37 at a later stage, after the correction finishes.