Sample Category Title
Technical Outlook and Review
USD/JPY:
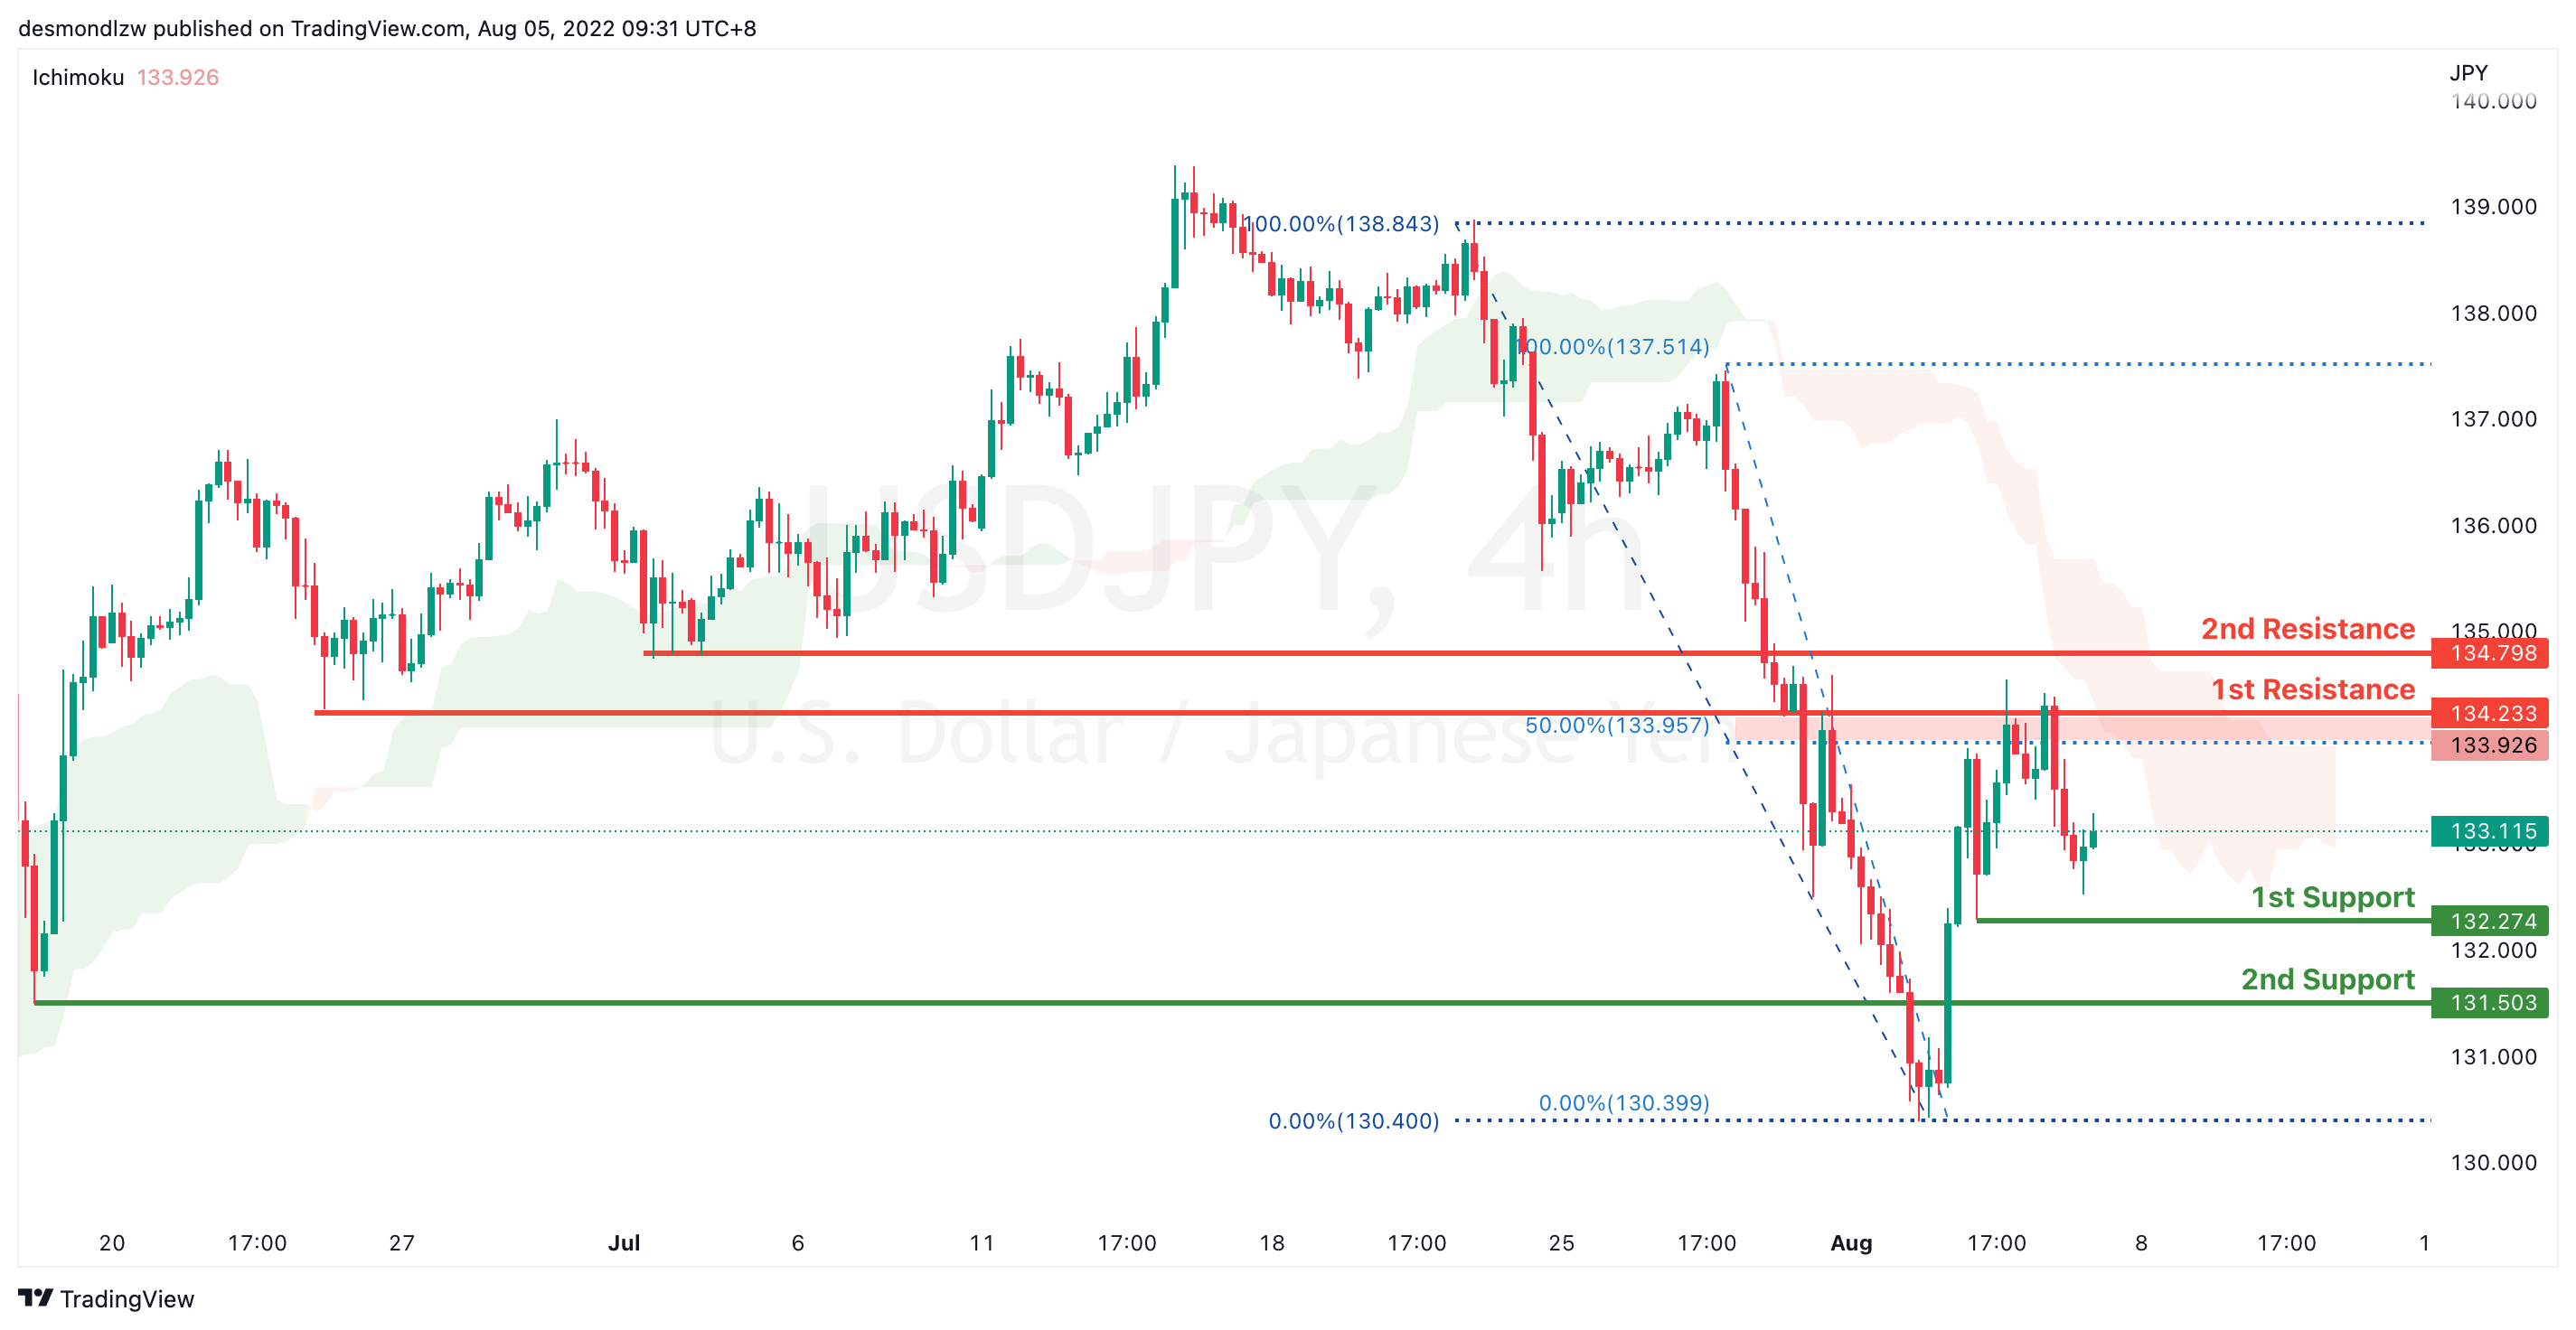
On the H4, price is slightly bullish biased as it fails to break the first support. It is now going to test at the first support at the first resistance where the 50% retracement sits at 134.233. If prices were to break the first resistance it will go to the second resistance at the previous swing low 134.798. Alternatively, price could pull back to test at the first support 132.274
Areas of consideration:
- H4 time frame, 1st resistance at 134.233
- H4 time frame, 1st support at 132.274
DXY:
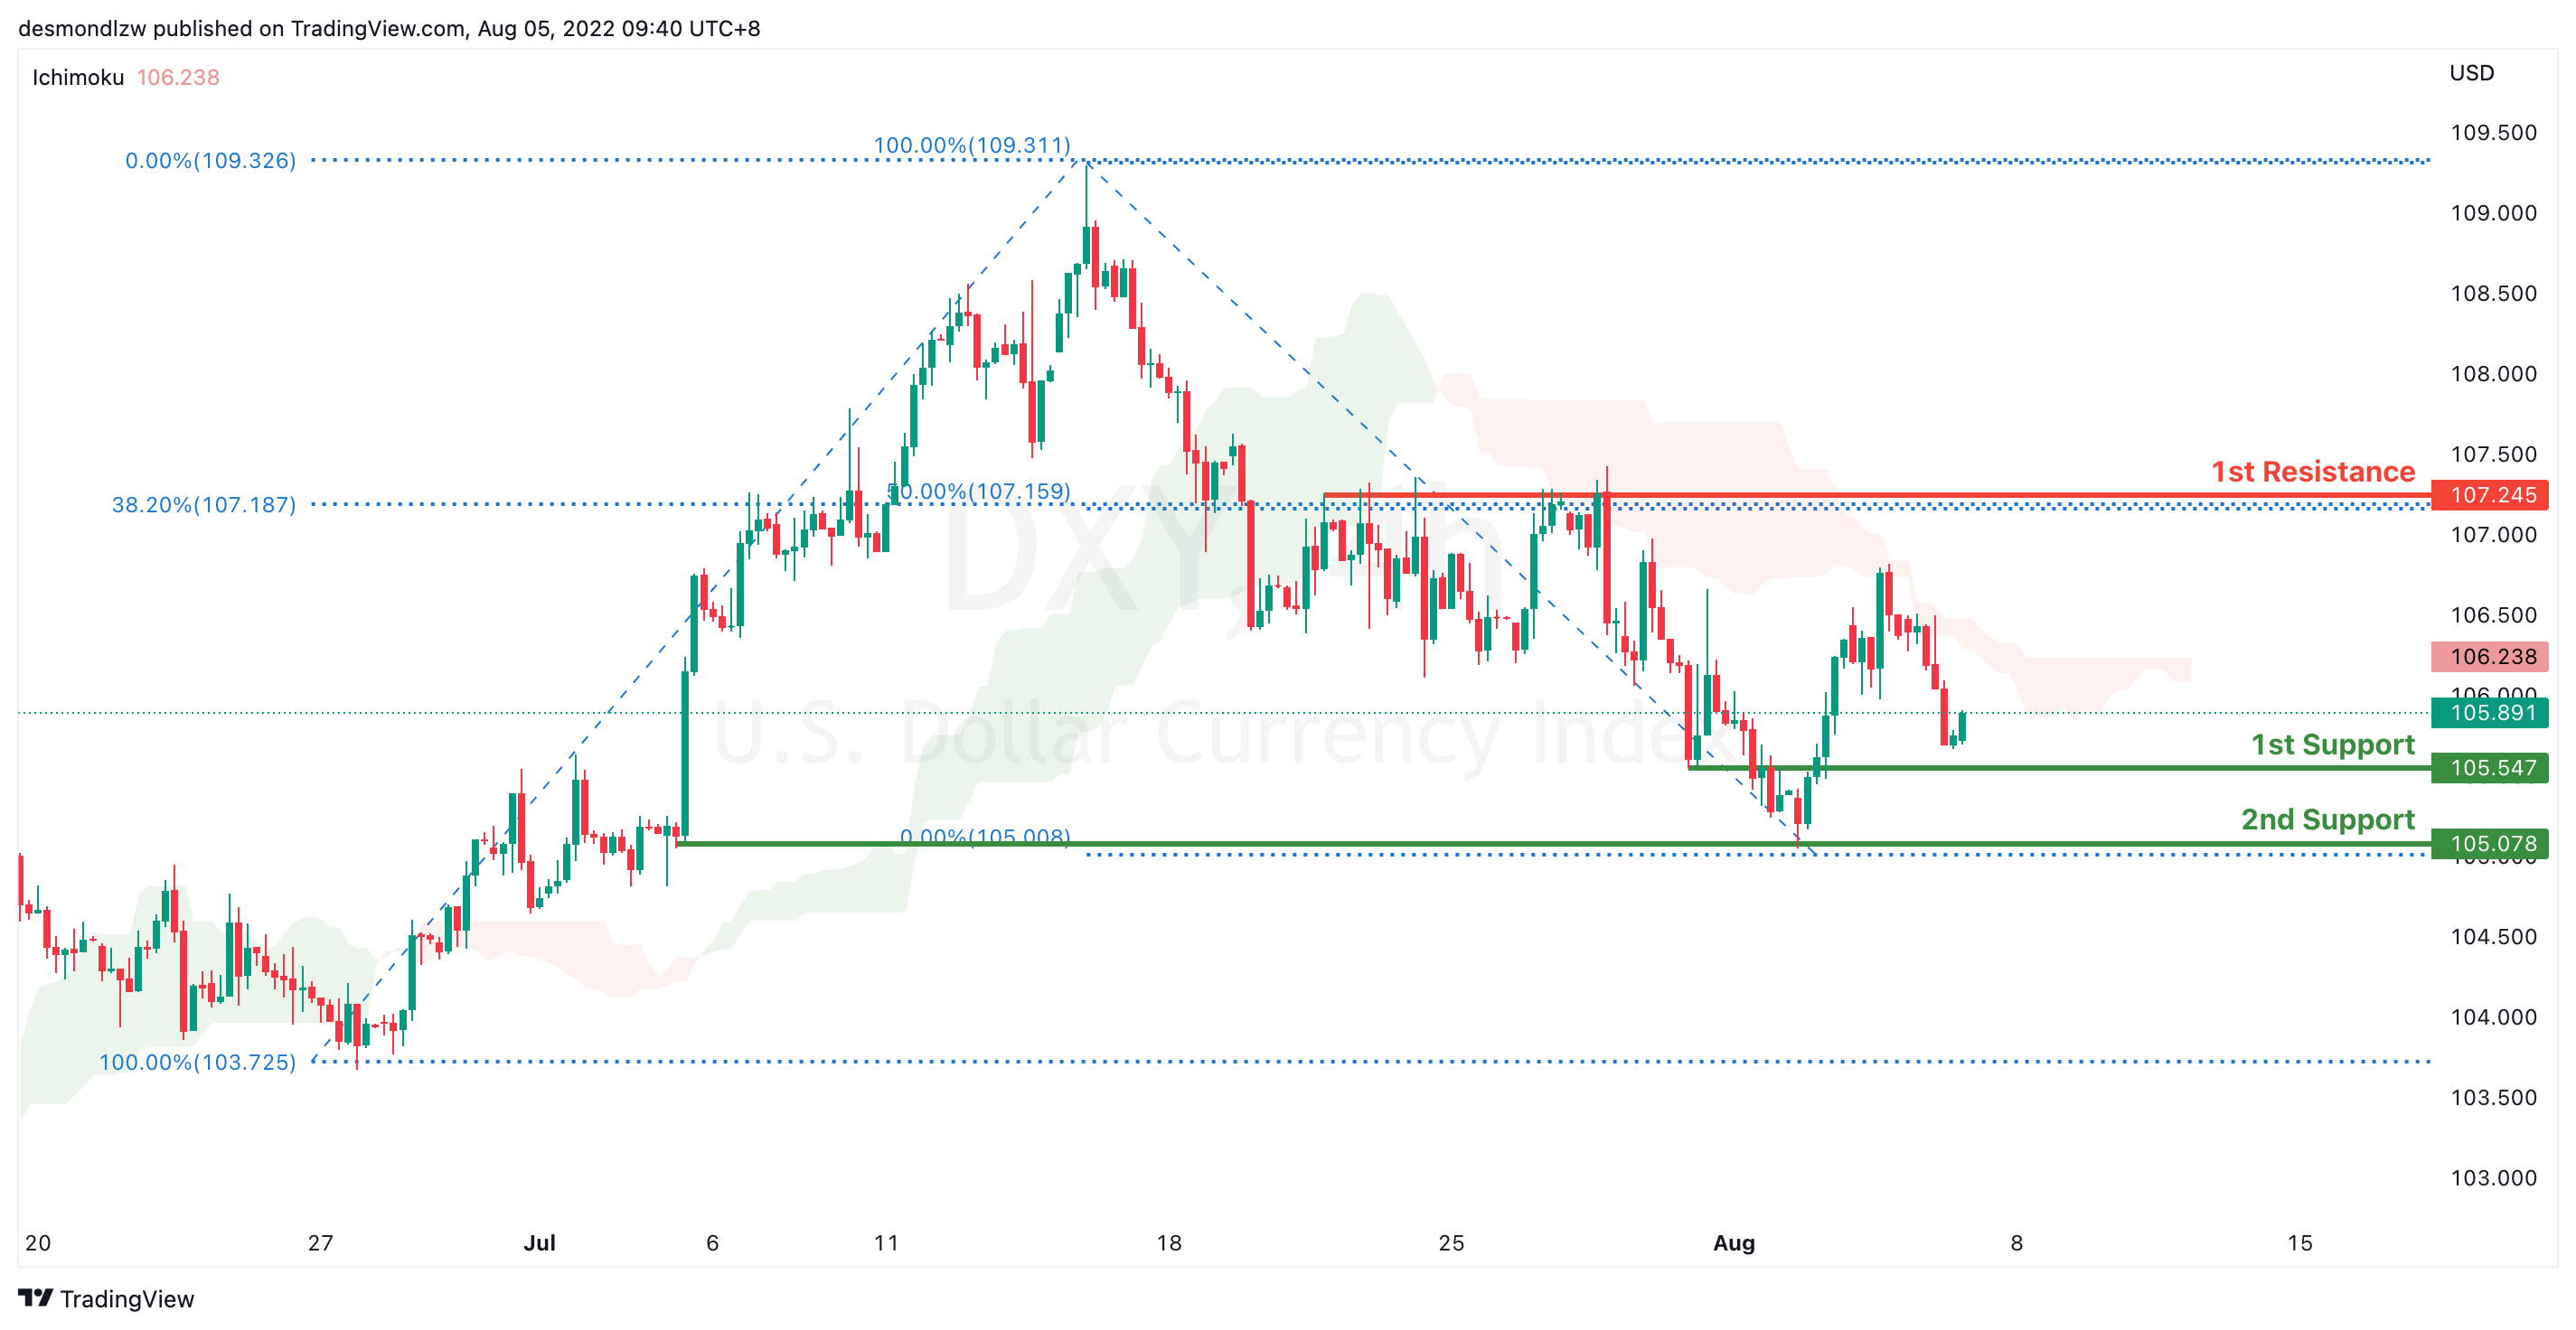
On the H4, prices have broken the ascending trend into an overall bearish biased trend. Prices has confirmed descending momentum, still respecting the Ichimoku cloud. It is now pulling back to test first support at 105.547 which is the previous swing low. If price were to break this key level, it will pull back further to test at second support 105.078. Alternatively, price could bounce back and test at 107.245 which coincides with 38.2% Fibonacci retracement
Areas of consideration:
- H4 time frame, 1st resistance at 107.245
- H4 time frame, 1st support at 105.547
EUR/USD :
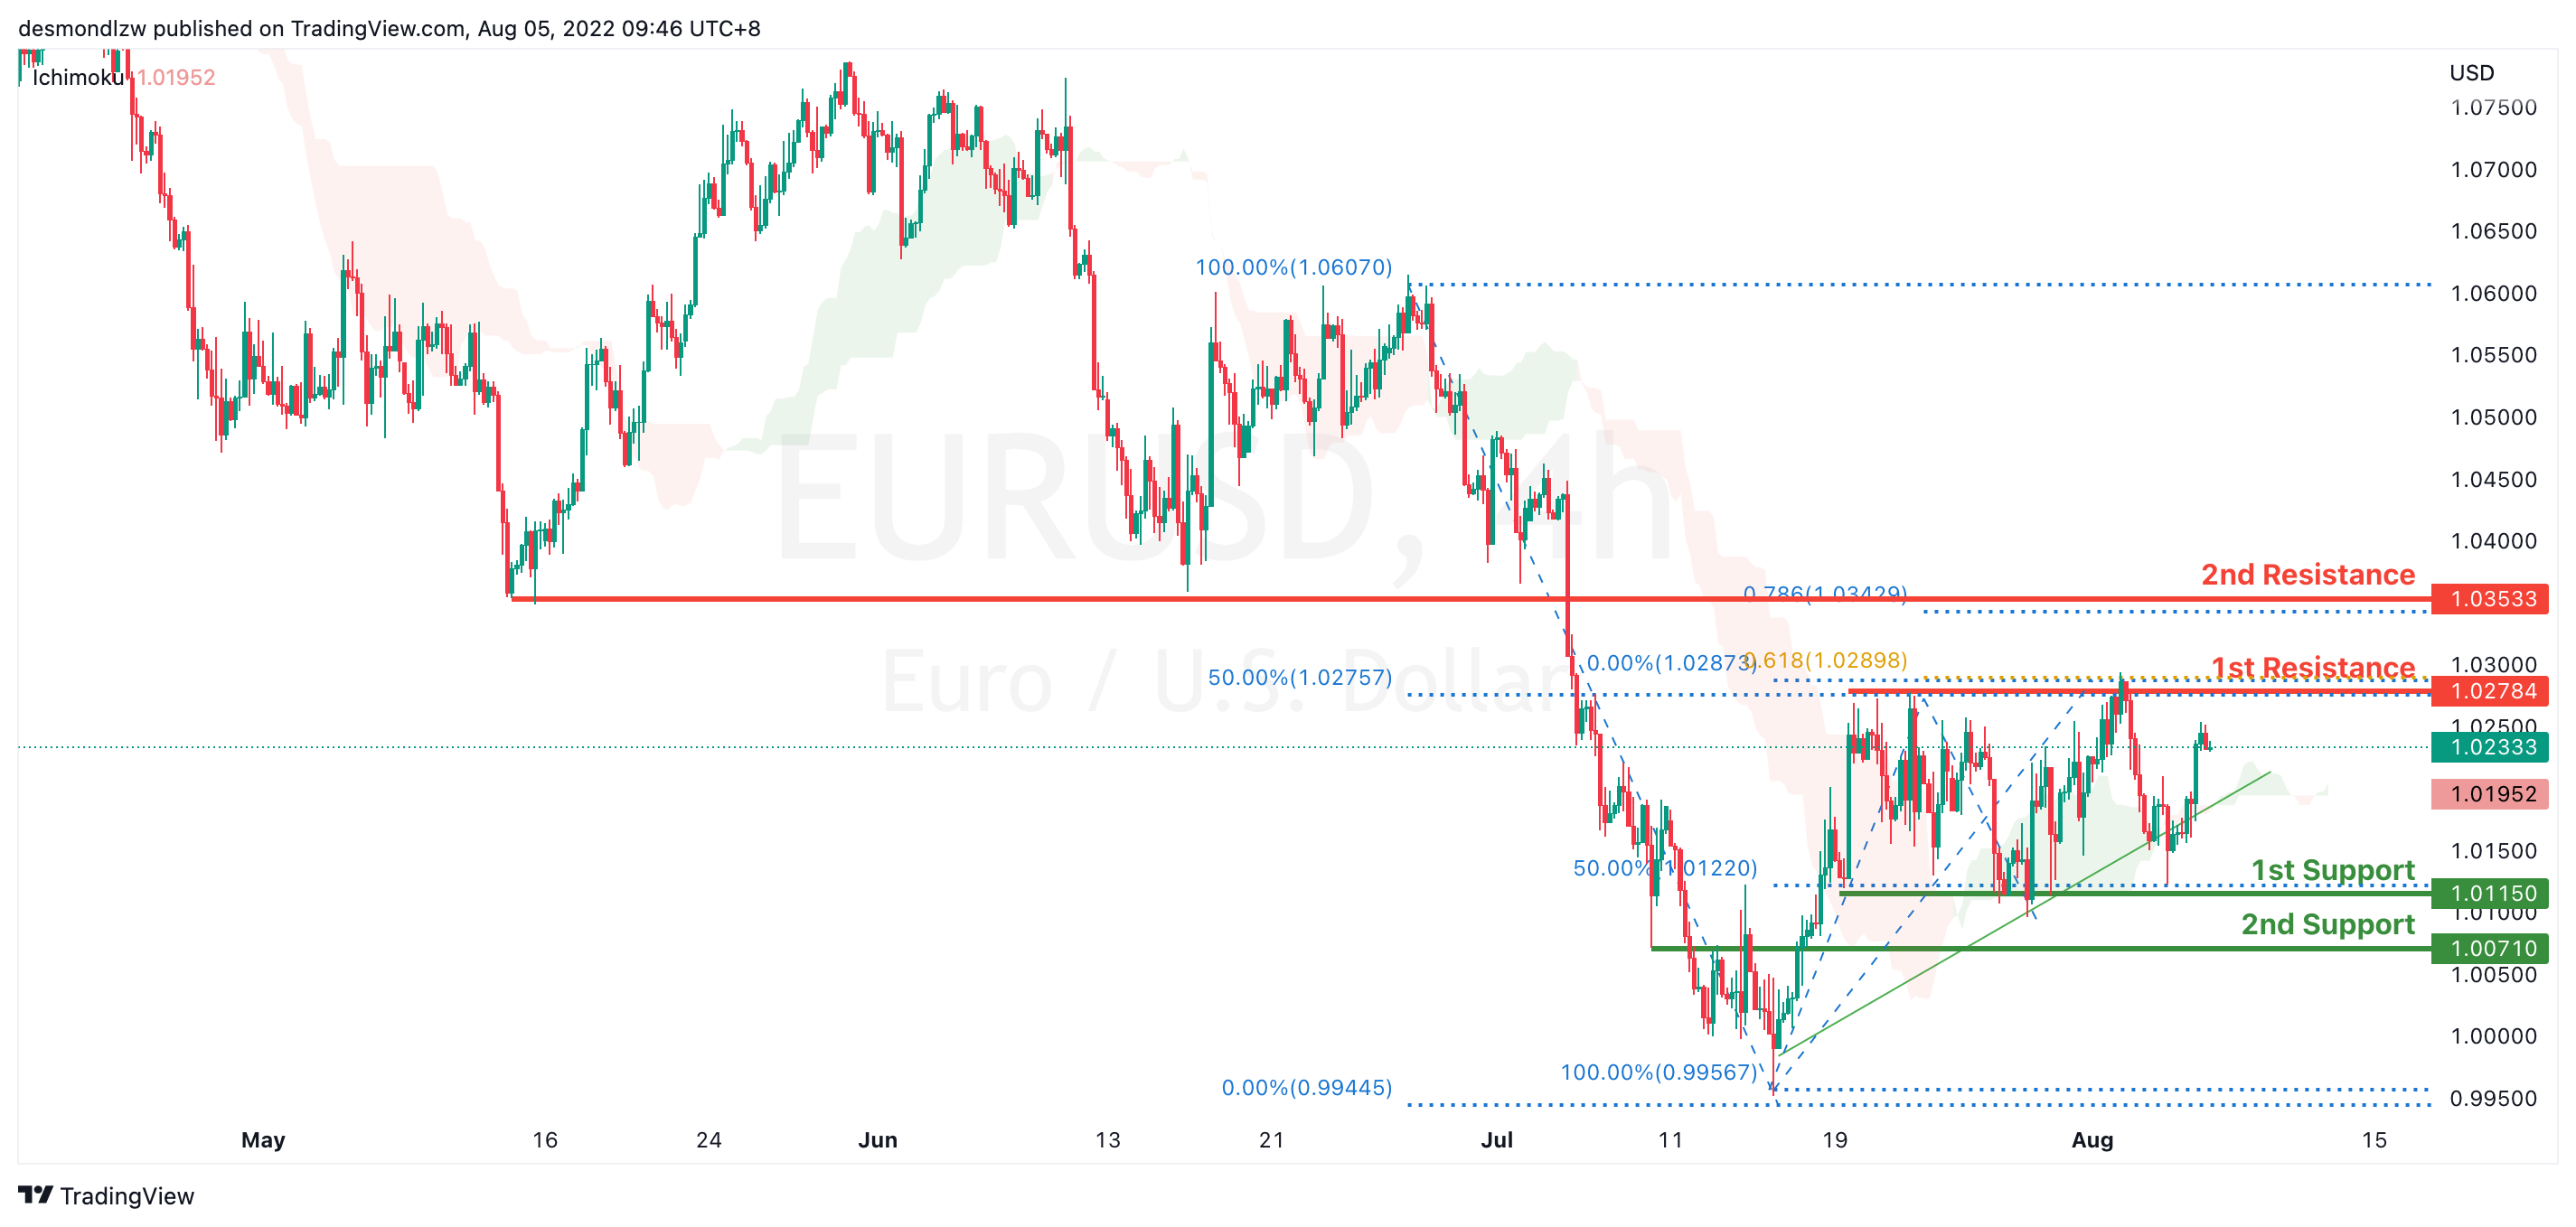
On the H4, prices have broken the bearish trend moving into a bullish biased trend. Price is pulling back to test the first resistance 1.027, which coincides with 61.8% Fibonacci projection and 50% retracement. If prices break 1st resistance, it will test the 2nd resistance at 1.03533. Alternatively, If price fails to break the first resistance it might test the first support at 1.011 level
Areas of consideration :
- H4 1st resistance at 1.027
- H4 1st support at 1.011
GBP/USD:
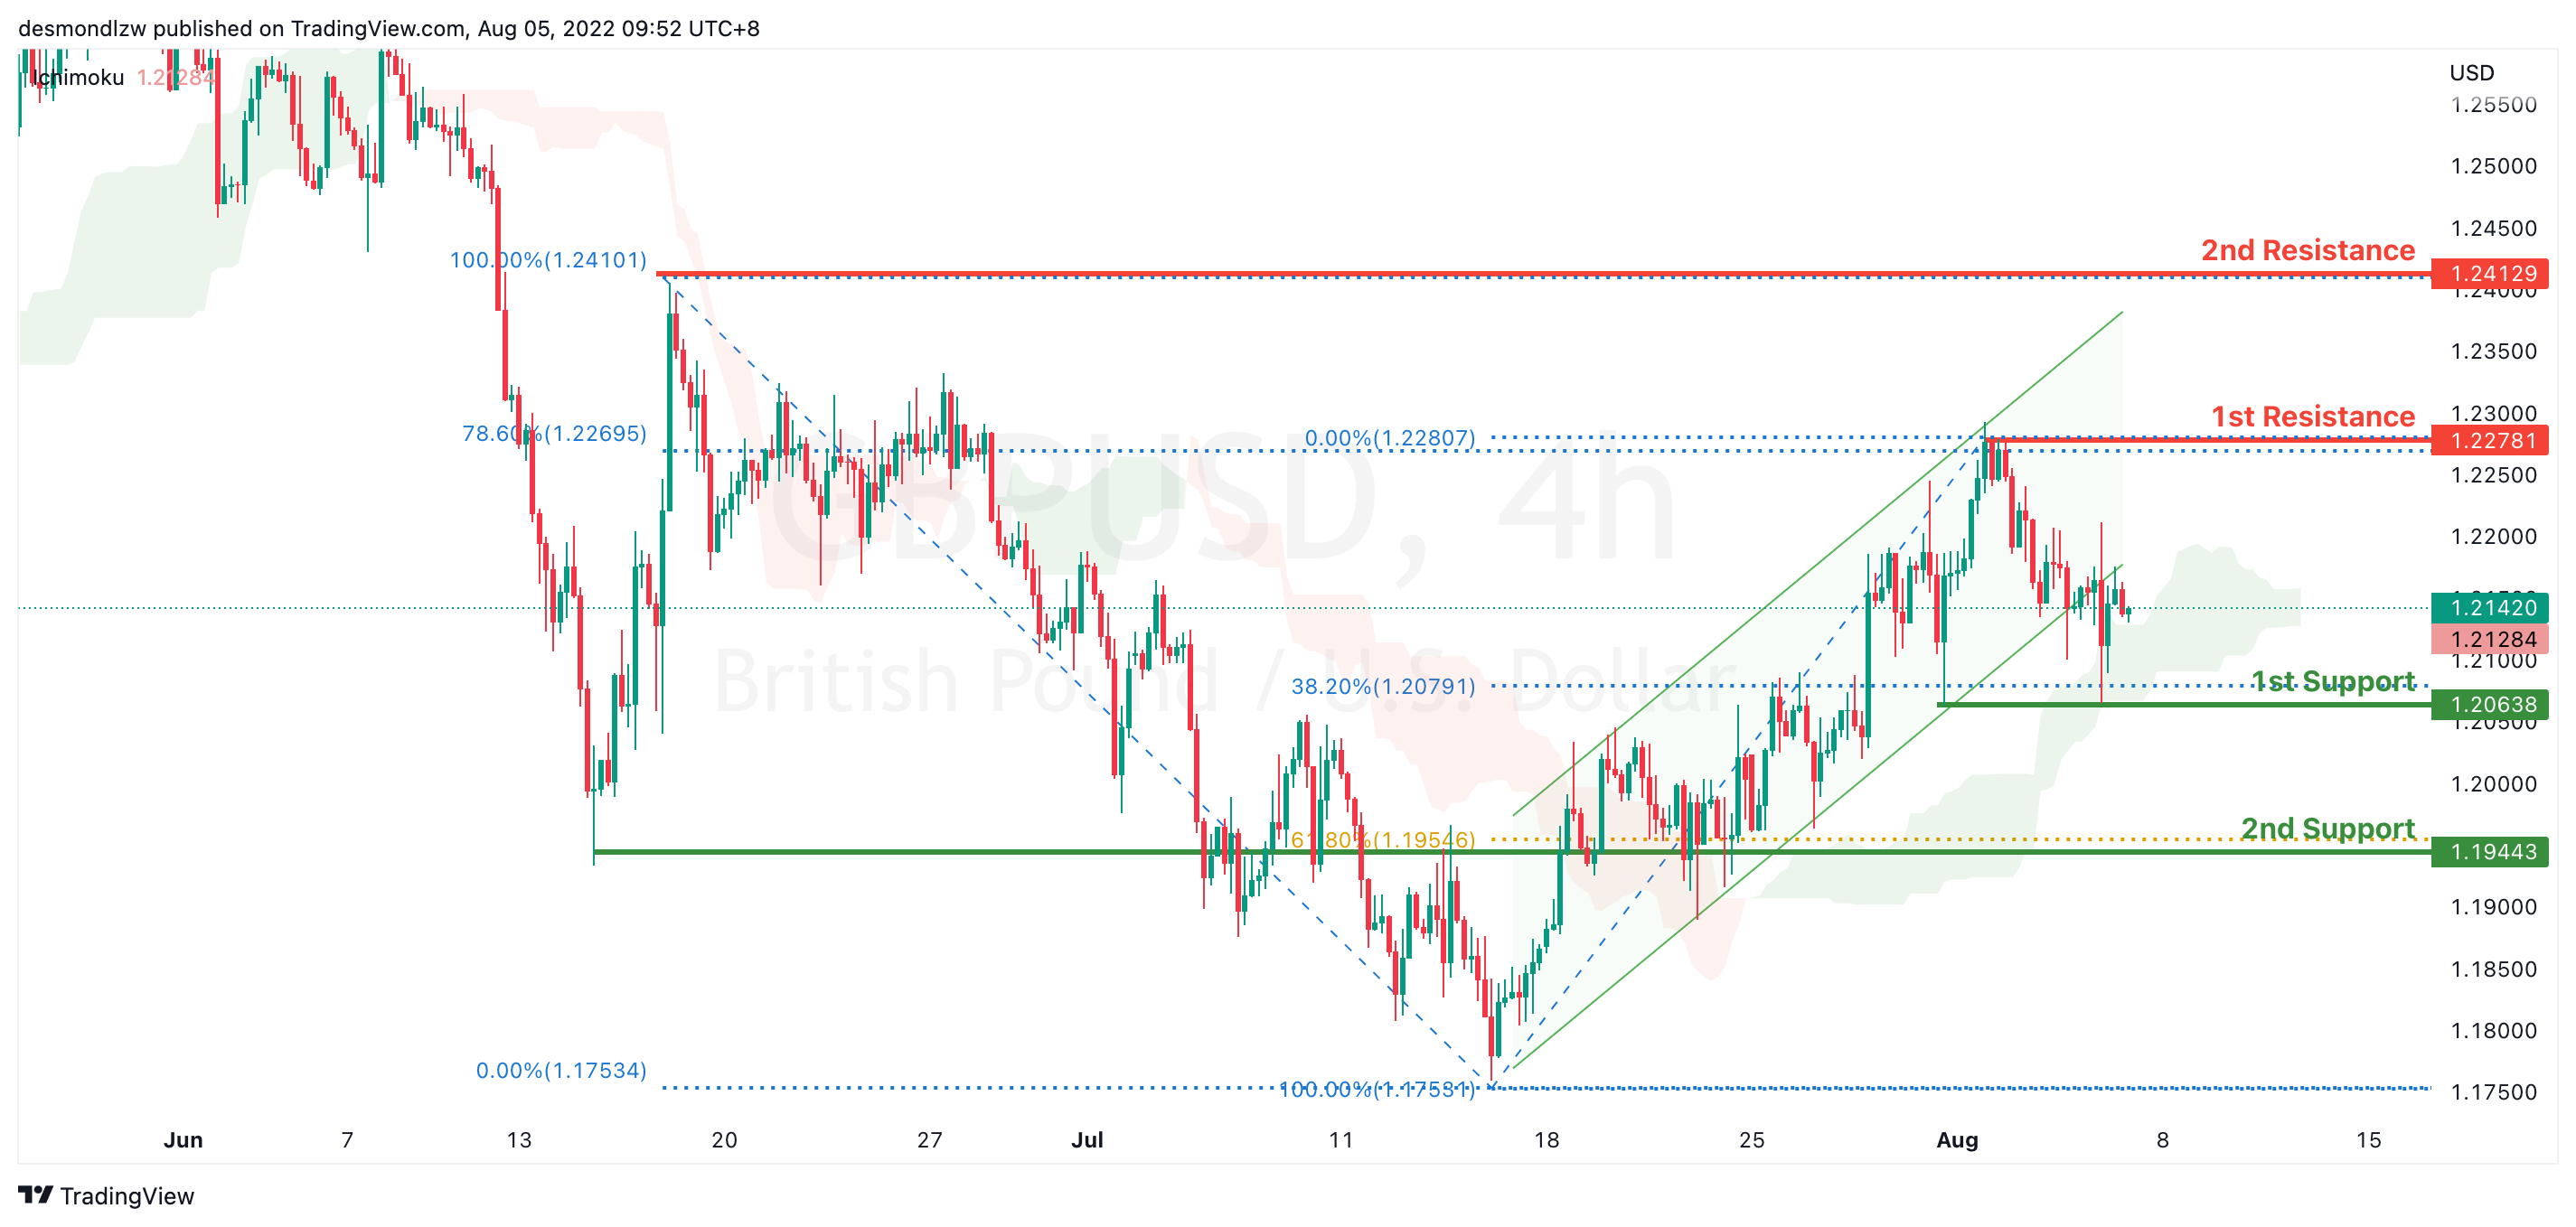
On the H4, with prices breaking the ascending channel we are now slightly bearish biased. Price is now testing the first support at 1.208 which coincides with 38.2% Fibonacci retracement. If price break supports and confirms downside trend, we would expect downside momentum to carry price to 2nd support at 1.194 61.8% Fibonacci retracement. Alternatively, price could bounce back to test at 78.6% Fibonacci retracement at 1.227
Areas of consideration:
- H4 1st resistance at 1.227
- H4 1st support at 1.2106
USD/CHF:
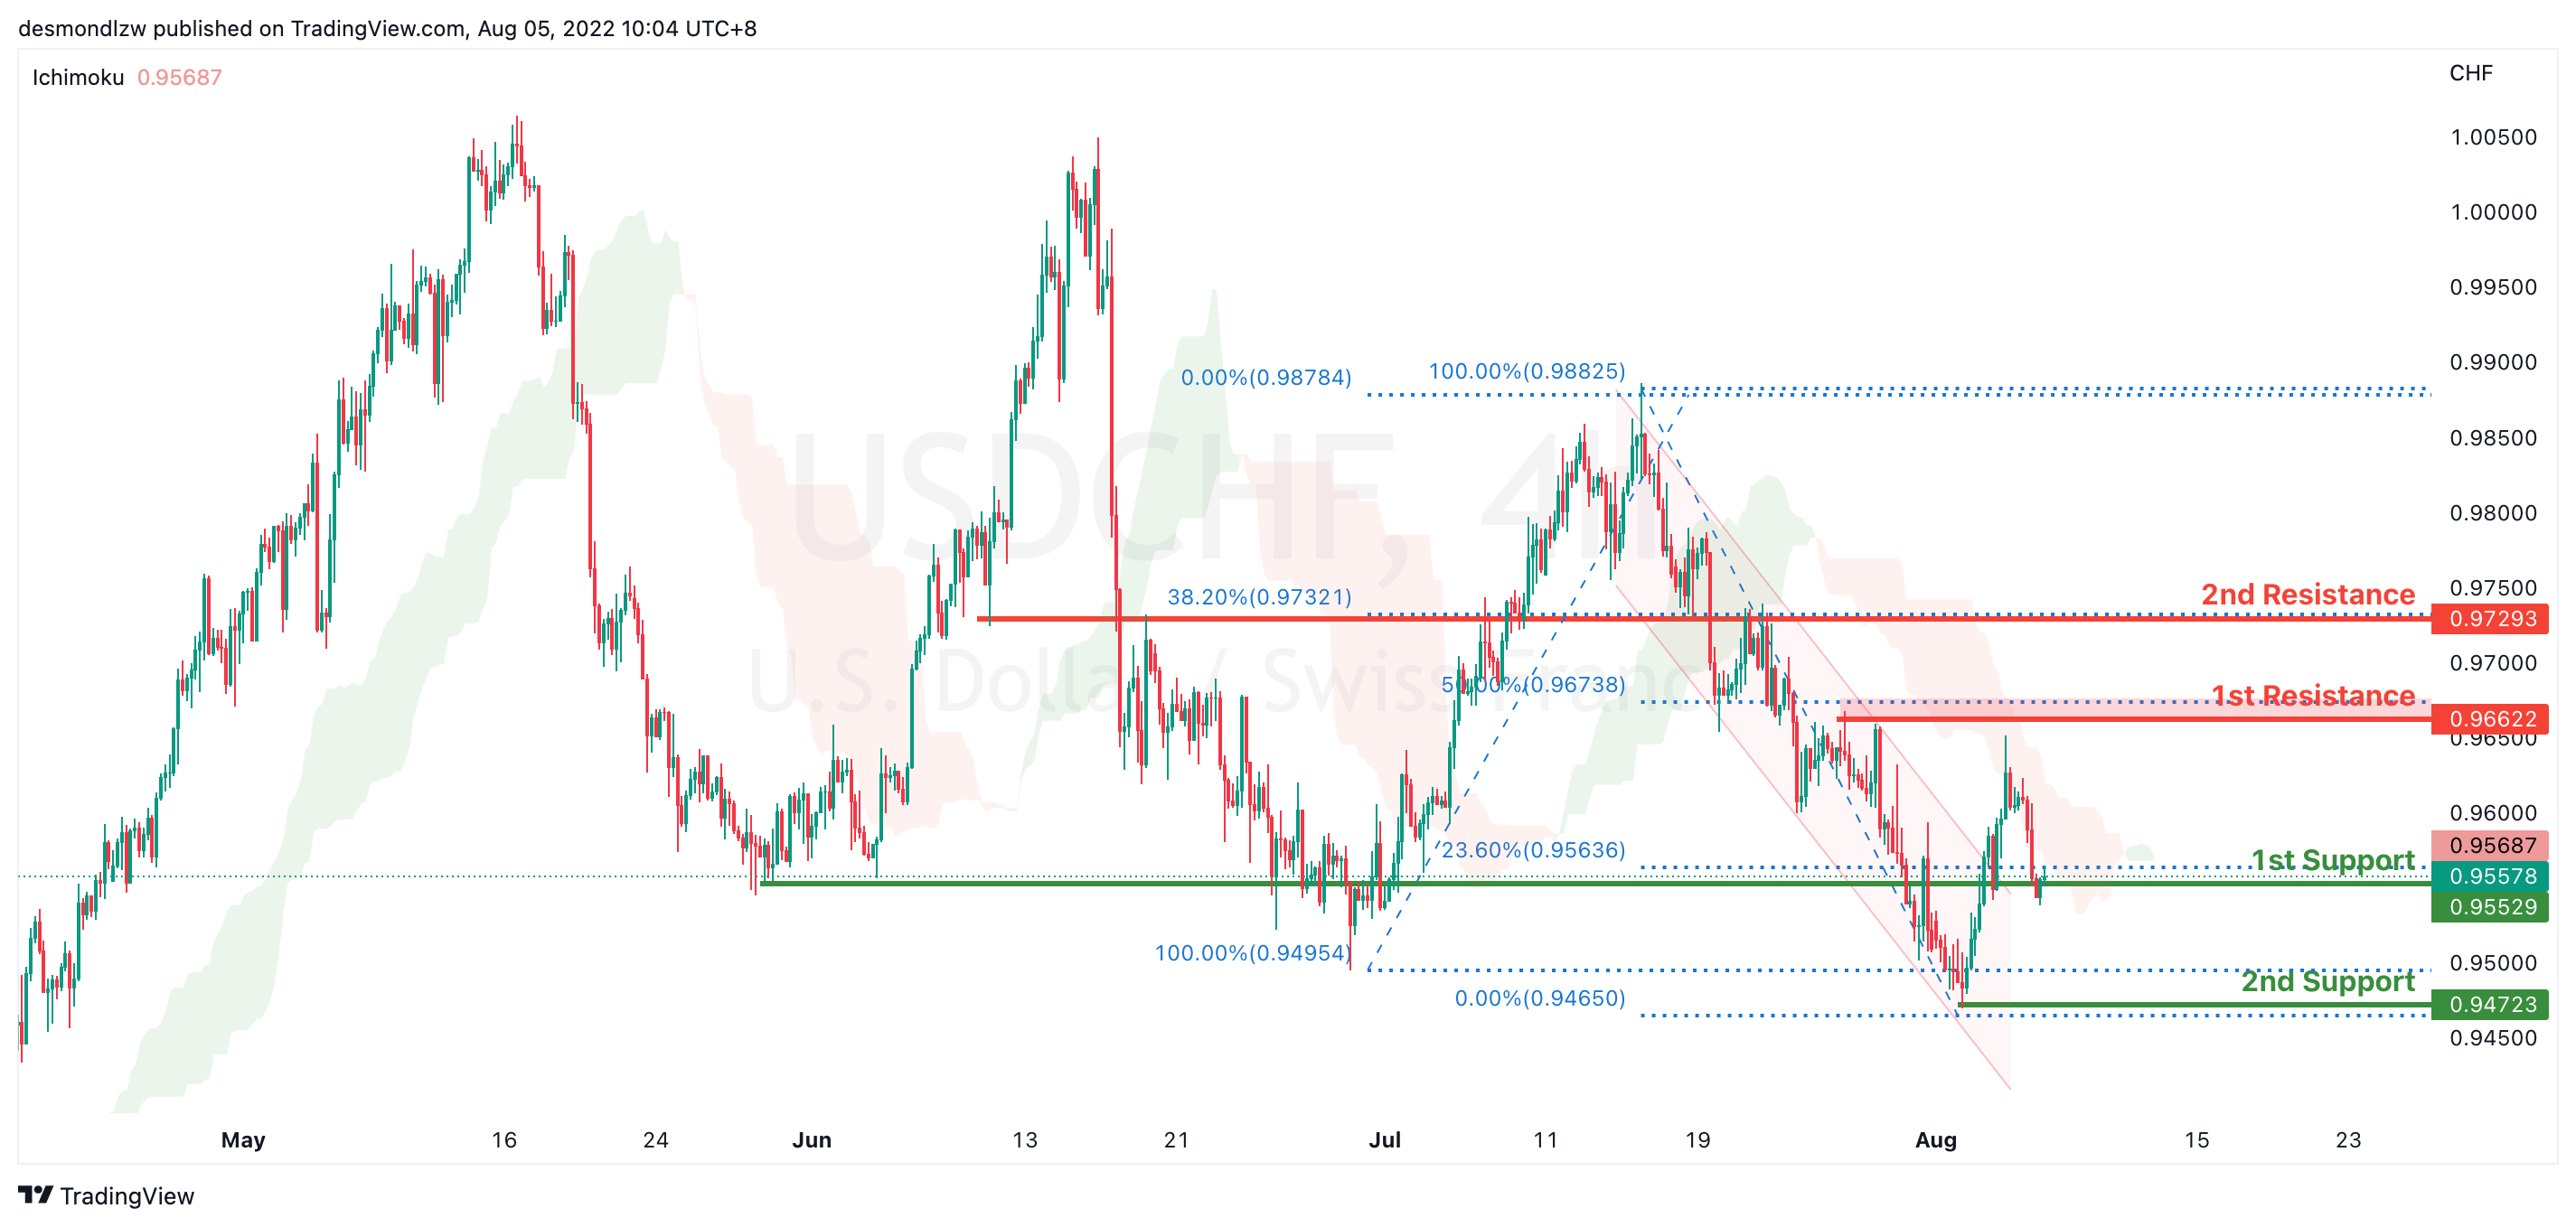
On the H4, prices have signalled a slightly bearish momentum. It has rejected the 1st resistance at 0.966 which is also the 50% Fibonacci retracement to test at the 1st support 0.955 23.6% fibonacci retracement. If prices break this key level, it will pull back further to test at the second support at 0.947. Alternatively price could bounce back to test at 1st resistance 0.966
Areas of consideration
- H4 1st resistance at 0.966
- H4 1st support at 0.955
XAU/USD (GOLD):
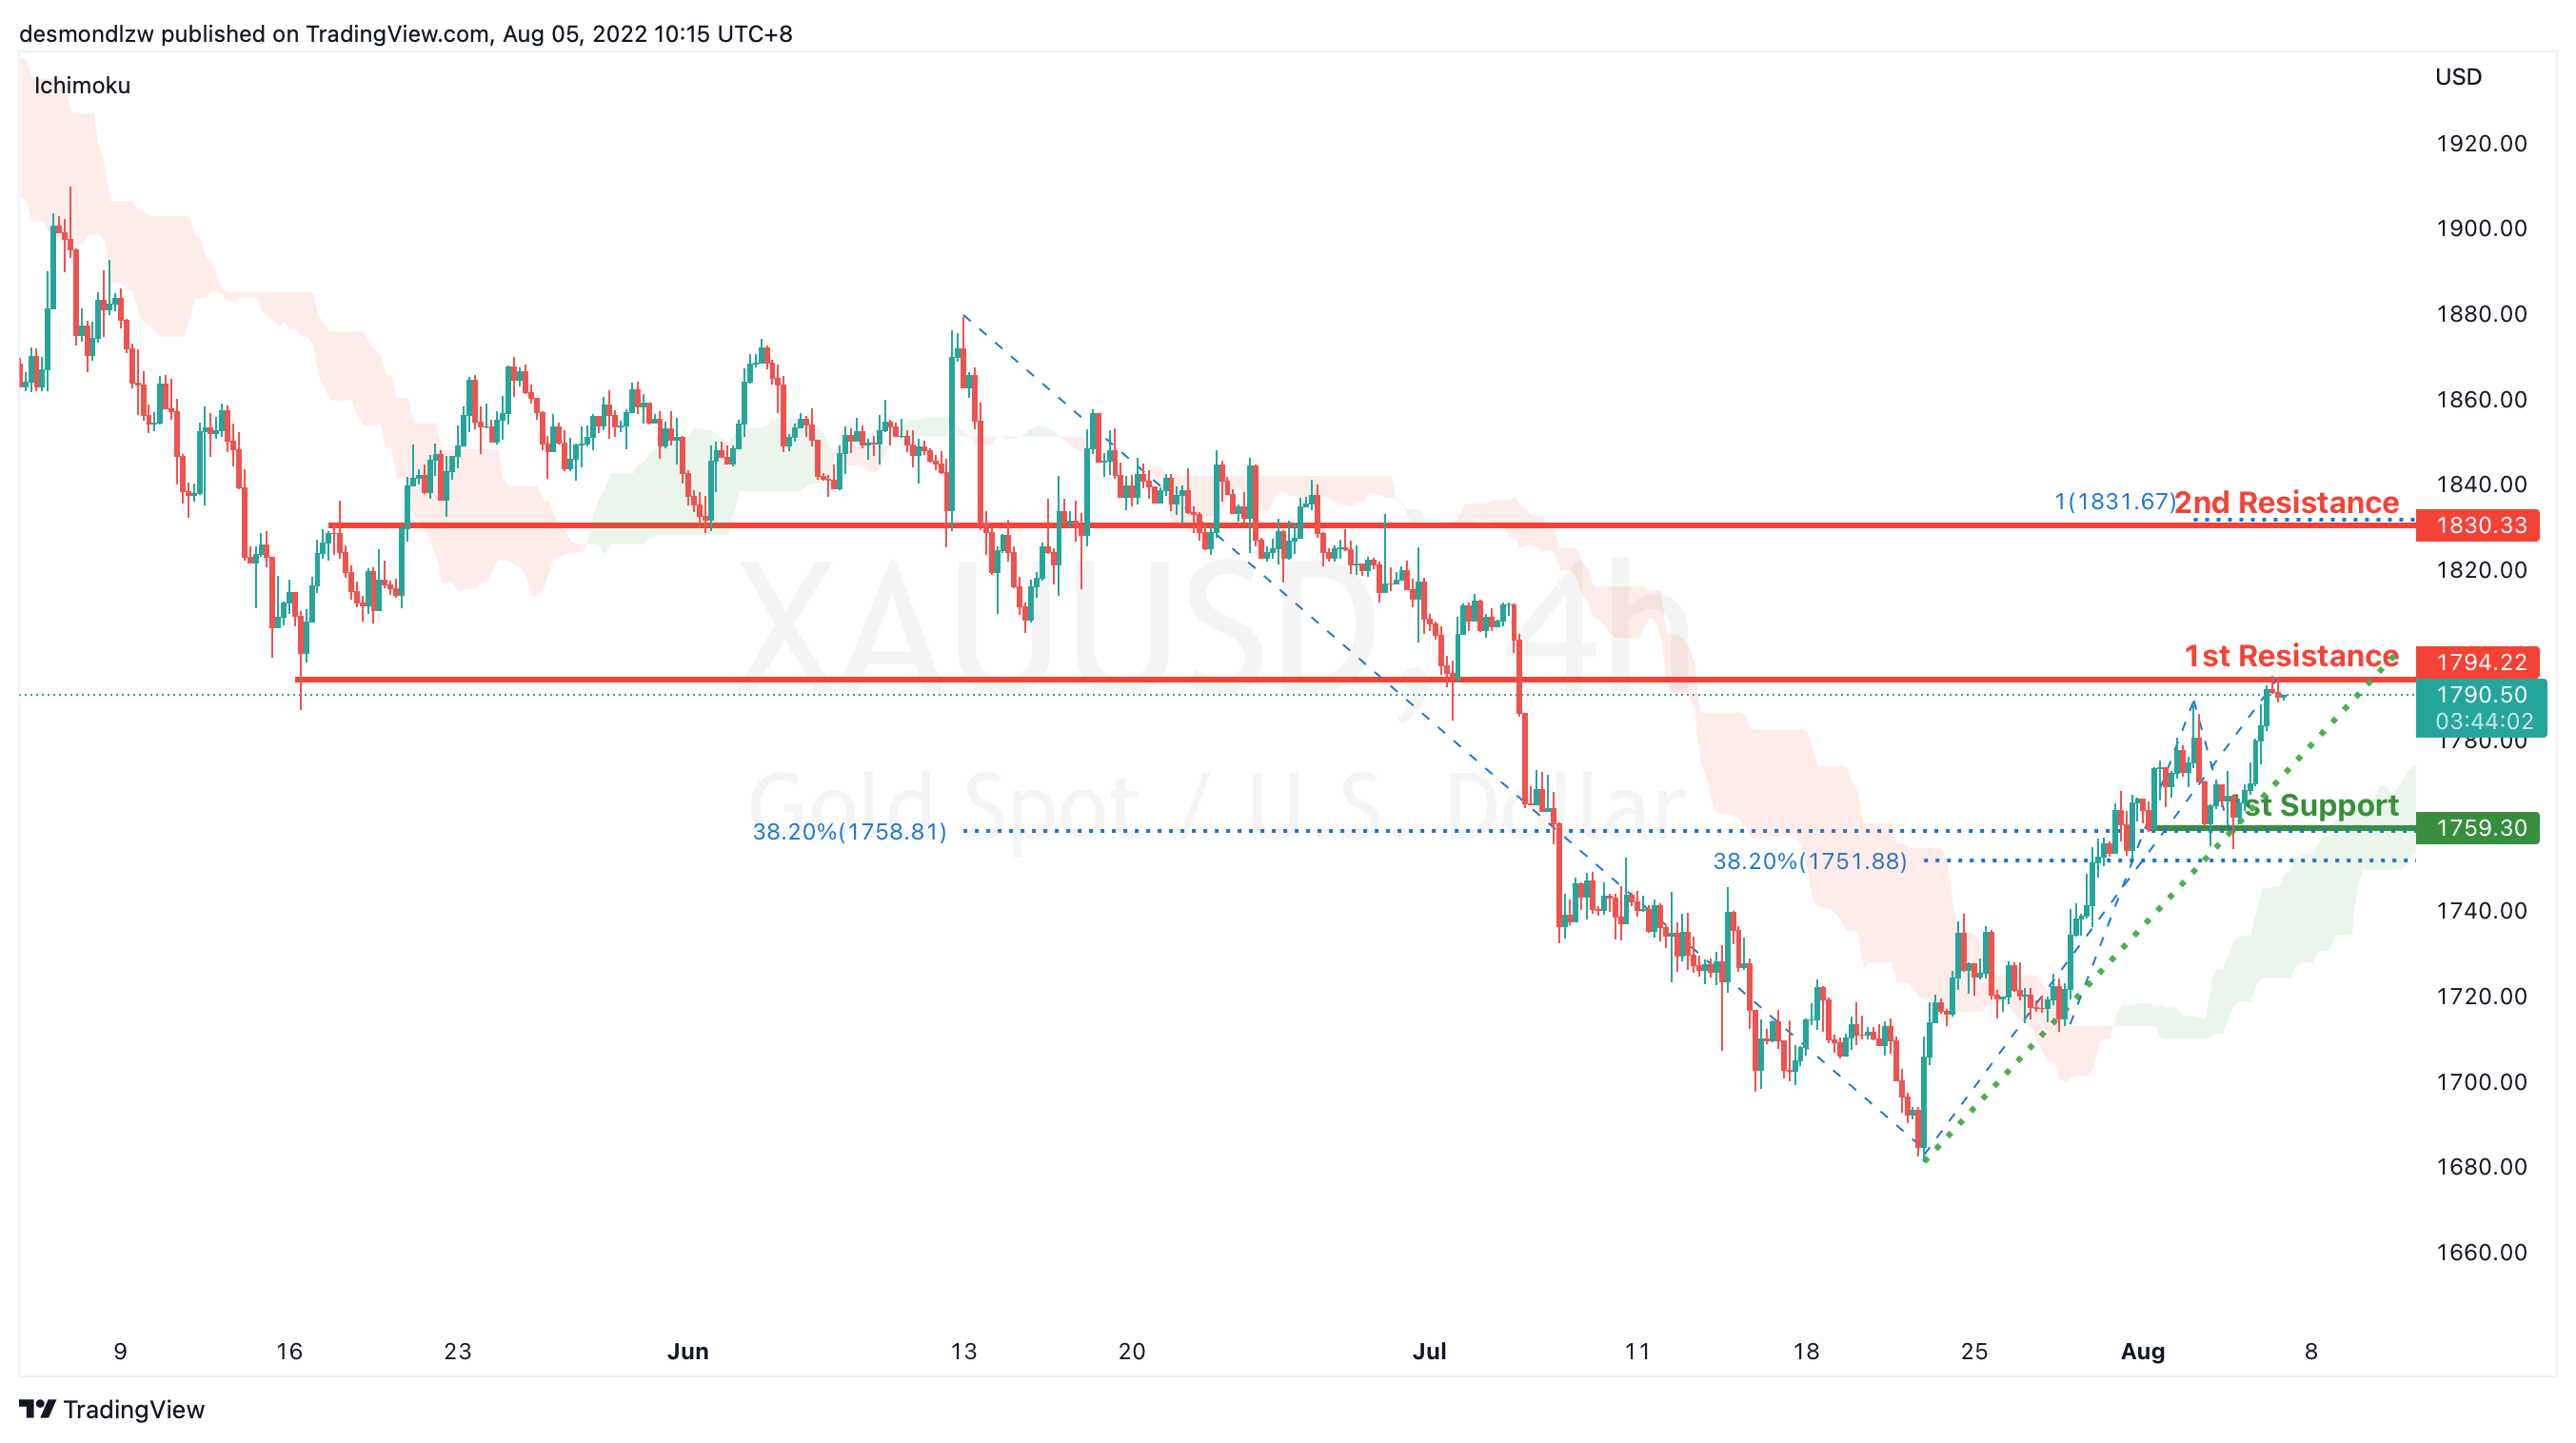
On the H4, with prices going along the ascending trendline and moving above ichimoku cloud, we have a bullish bias that price may rise from the 1st resistance at 1794.22, which is in line with the overlap support to 2nd resistance at 1830.33 where the 100% fibonacci projection is. Alternatively, prices may drop to 1st support at 1759.30,which is in line with 38.2% fibonacci retracement.
Areas of consideration:
- H4 time frame, 1st resistance at 1794.22
- H4 time frame, 2nd resistance at 1830.33
AUD/USD:
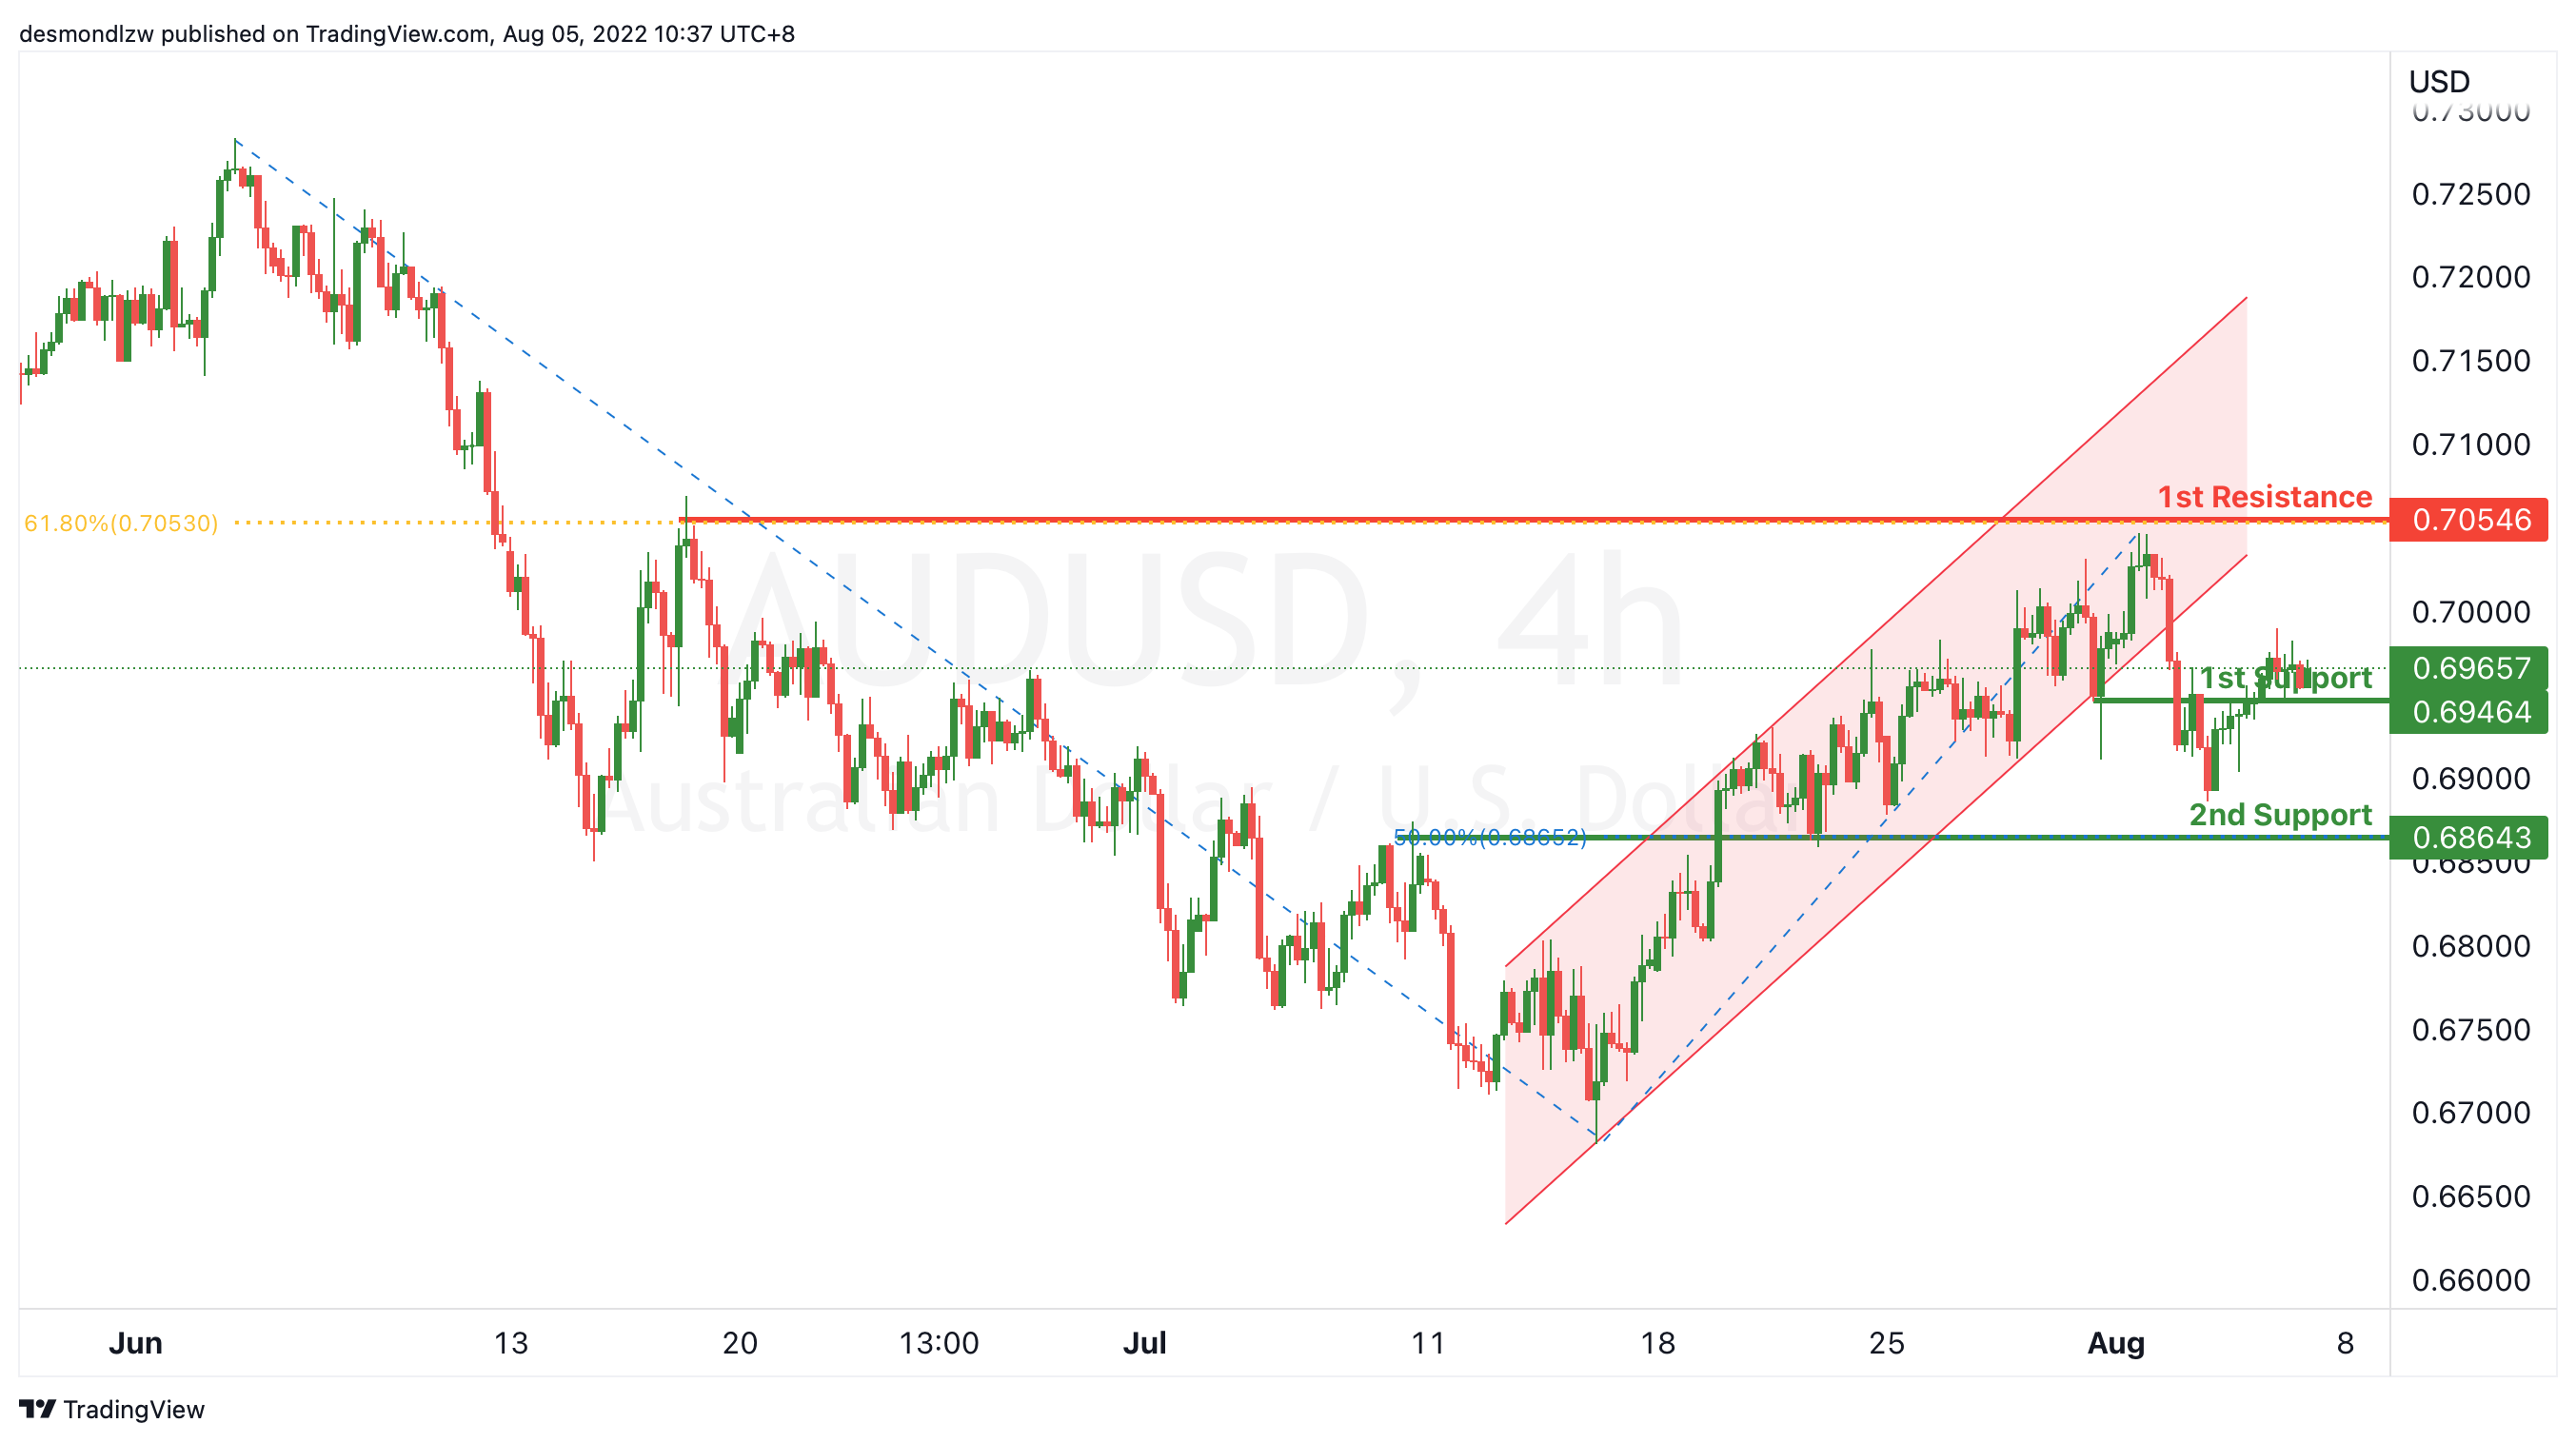
On the H4, with price breaking the ascending trend channel, we have a bearish bias that price will drop from the 1st support at 0.69657, where the pullback resistance is to the 2nd support at 0.68643 where the 50% fibonacci retracement is. Alternatively, price may rise to the 1st resistance at 0.70546 which is in line with 61.8% fibonacci retracement.
Areas of consideration
- H4 1st support at 0.69657
- H4 2nd support at 0.68643
NZD/USD:
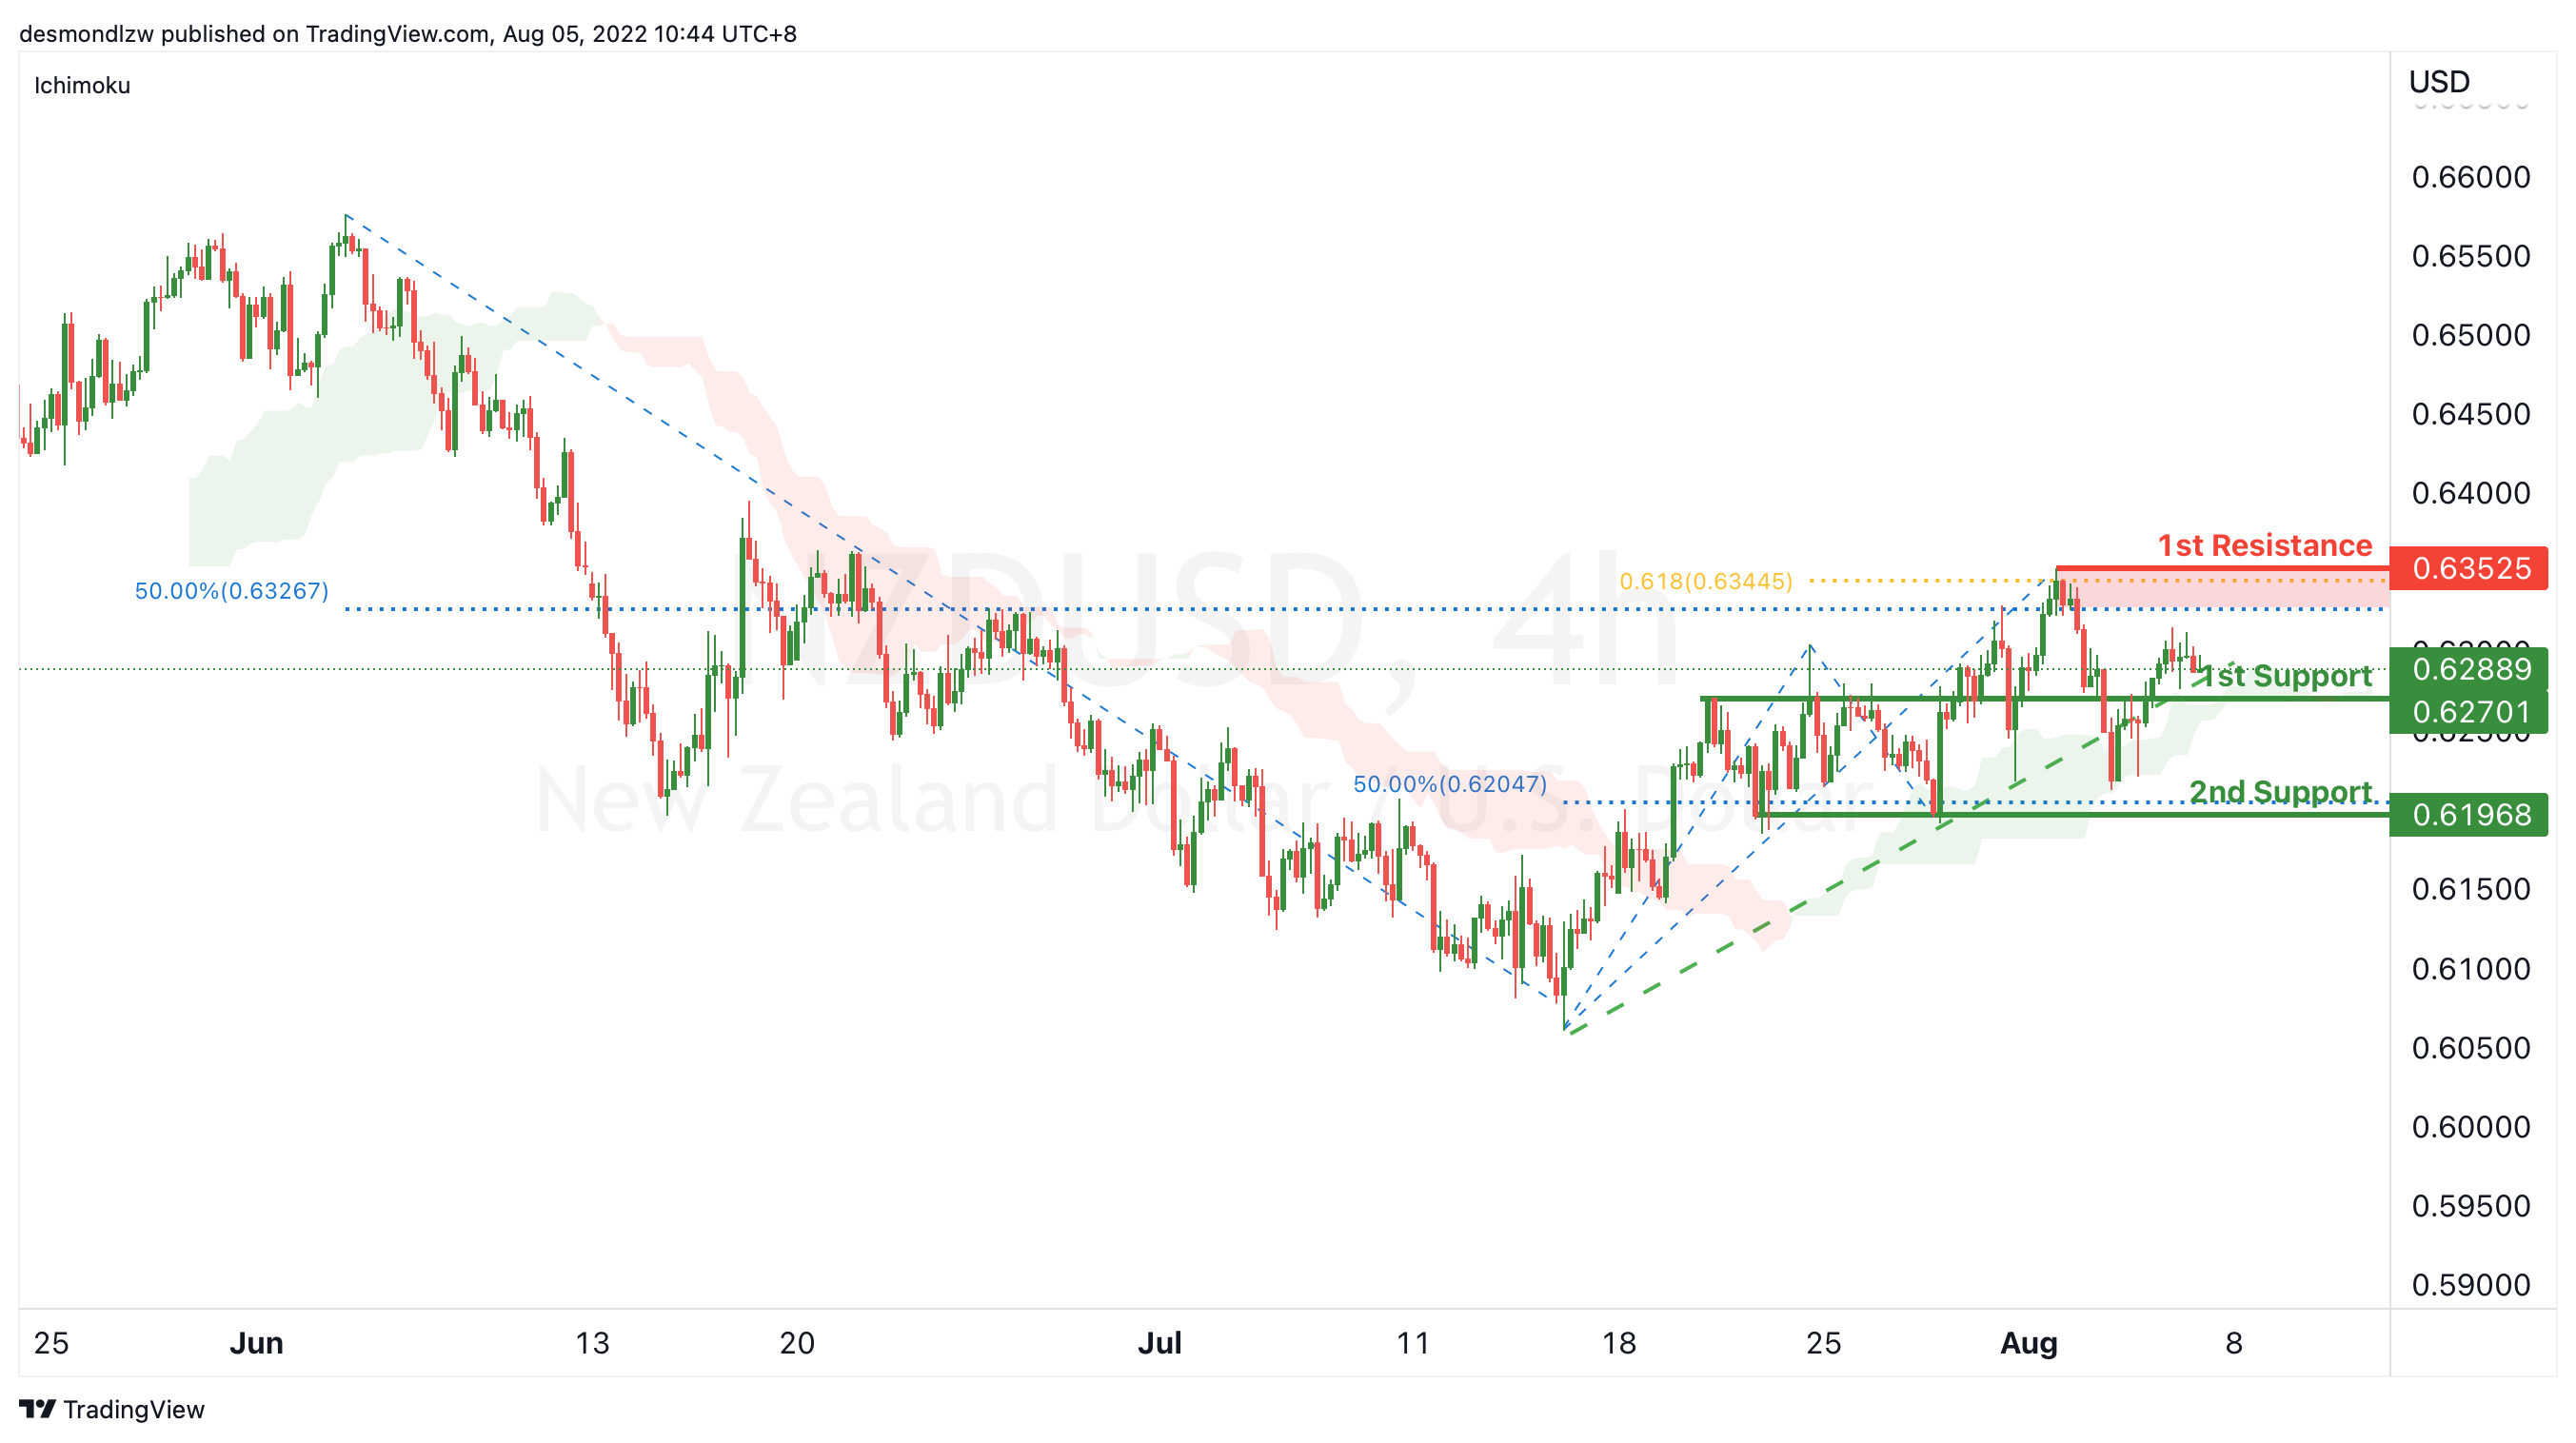
On the H4, with price moving along the ascending trendline, we have a bullish bias that price may rise from the 1st support at 0.62701 where overlap resistance is to the 1st resistance at 0.63525 at the swing high, 61.8% fibonacci projection and 50% fibonacci retracement. Alternatively, price may reverse off the 1st support and drop to 2nd support at 0.61968 where the swing low support and 50% fibonacci retracement are.
Areas of consideration:
- H4 time frame, 1st support at 0.62701
- H4 time frame, 1st resistance at 0.63525
USD/CAD:
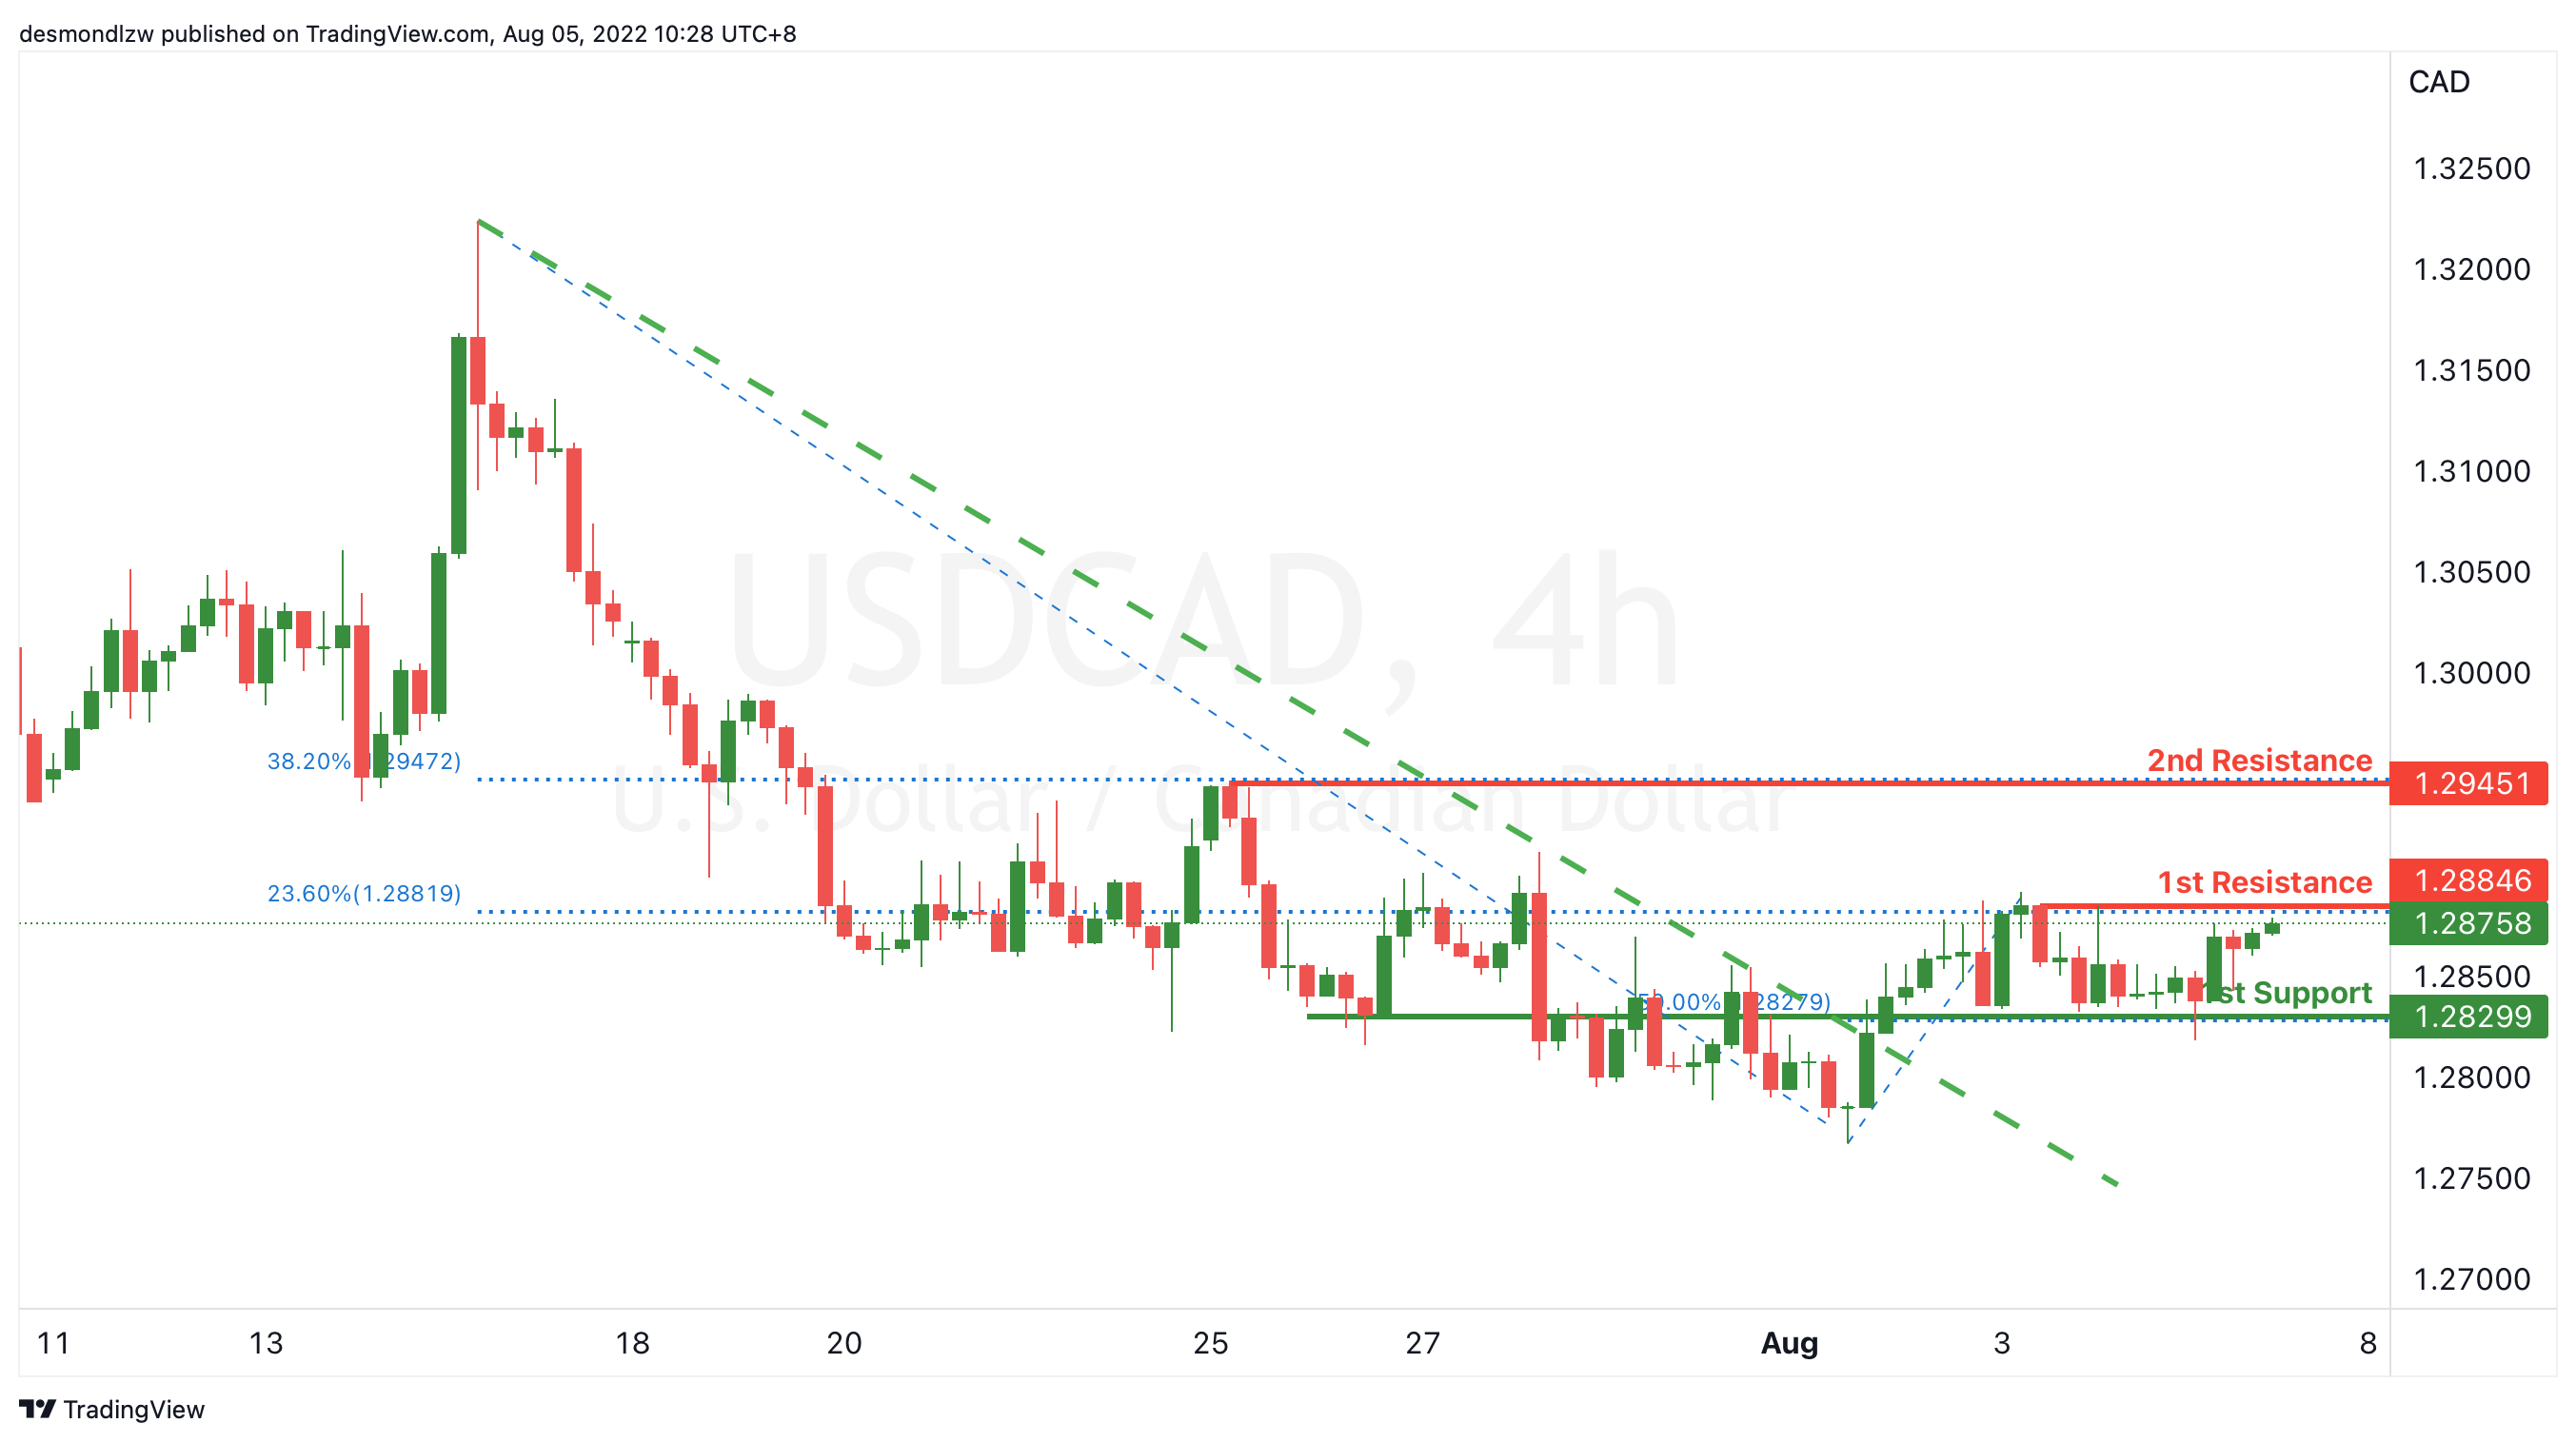
On the H4, with the price breaking the descending trendline and below ichimoku cloud, we have a bullish bias that the price may rise from our 1st resistance at 1.28846, which is in line with 23.6% fibonacci retracement to our 2nd resistance at 1.29451, which is in line with the 38.2% fibonacci retracement. Alternatively, the price may drop to the 1st support at 1.28299, which is in line with 50% fibonacci retracement.
Areas of consideration:
- H4 time frame, 1st resistance at 1.28846
- H4 time frame, 2nd resistance at 1.29451
OIL:
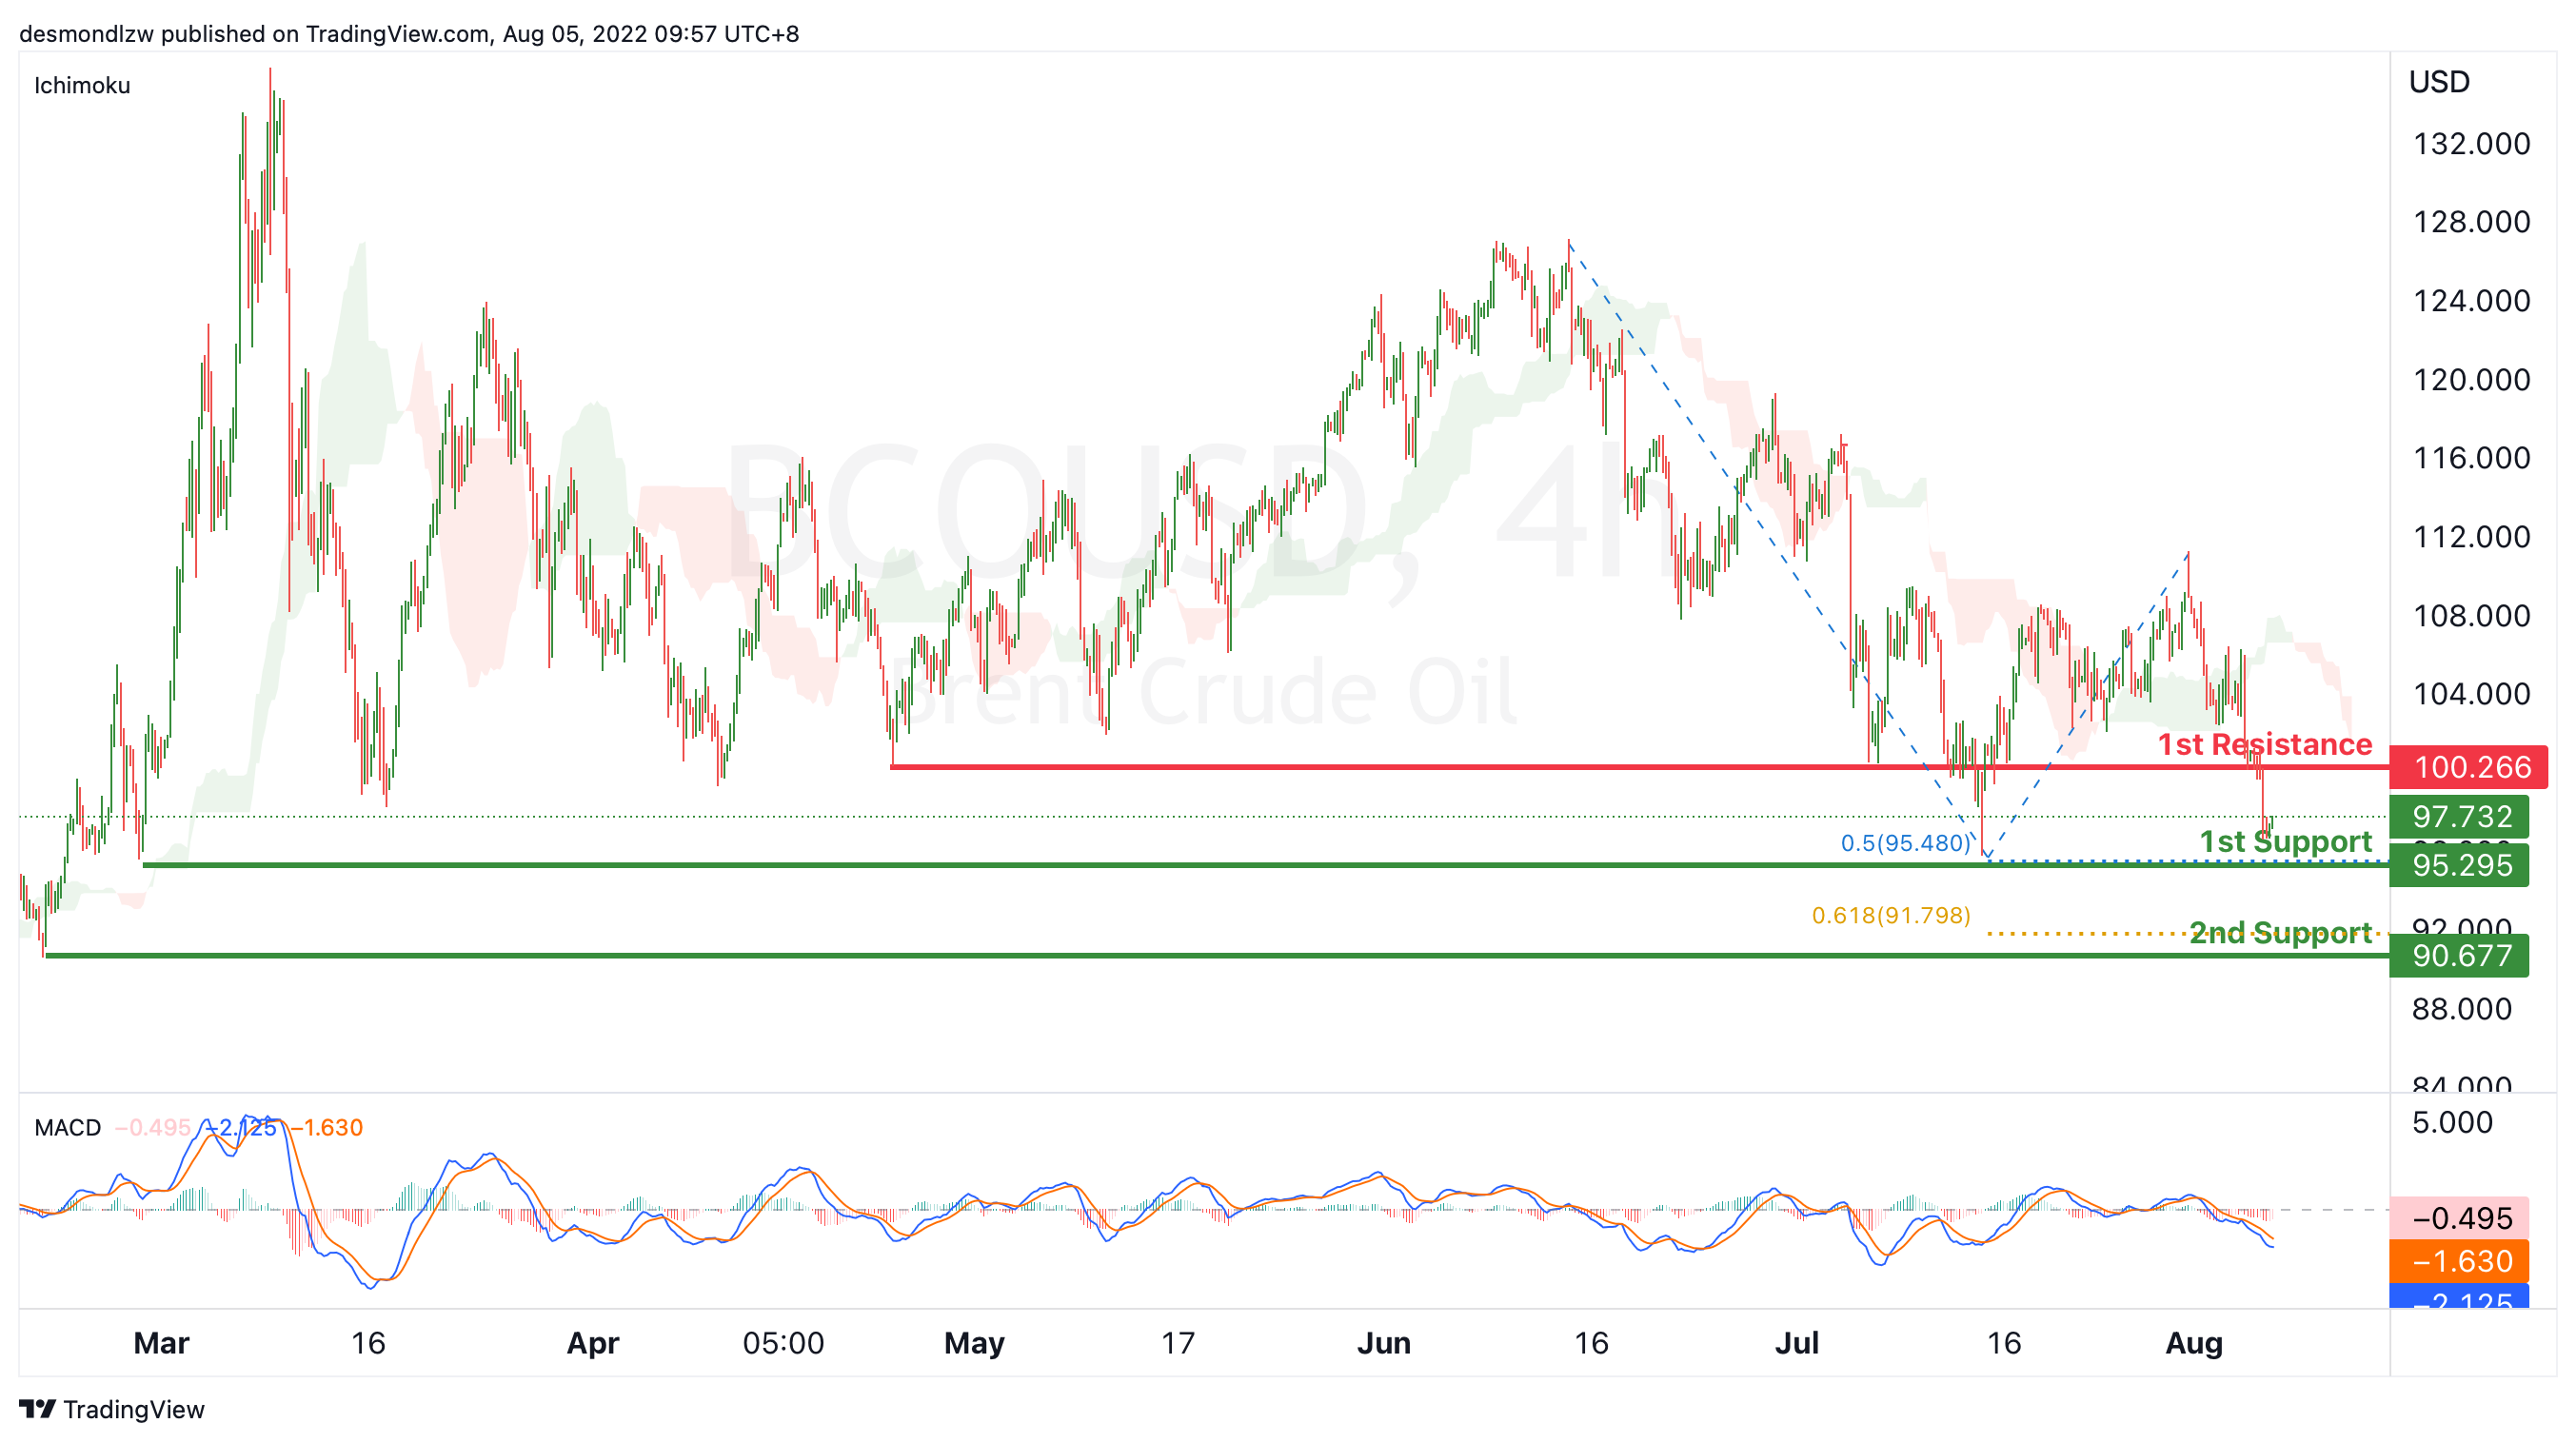
On the H4, with price going below the ichimoku cloud and the momentum of MACD histogram is decreasing under zero axis, we have a bearish bias that price might drop from the 1st support at 95.295, where the swing low support and 50% fibonacci projection are to 2nd support at 90.677, where the pullback support and 61.8% fibonacci projection are. Otherwise, the price may rise to our 1st resistance at 100.266, where the swing low support is.
Areas of consideration:
- H4 time frame, 1st support of 95.295
- H4 time frame, 2nd support of 90.677
Dow Jones Industrial Average:
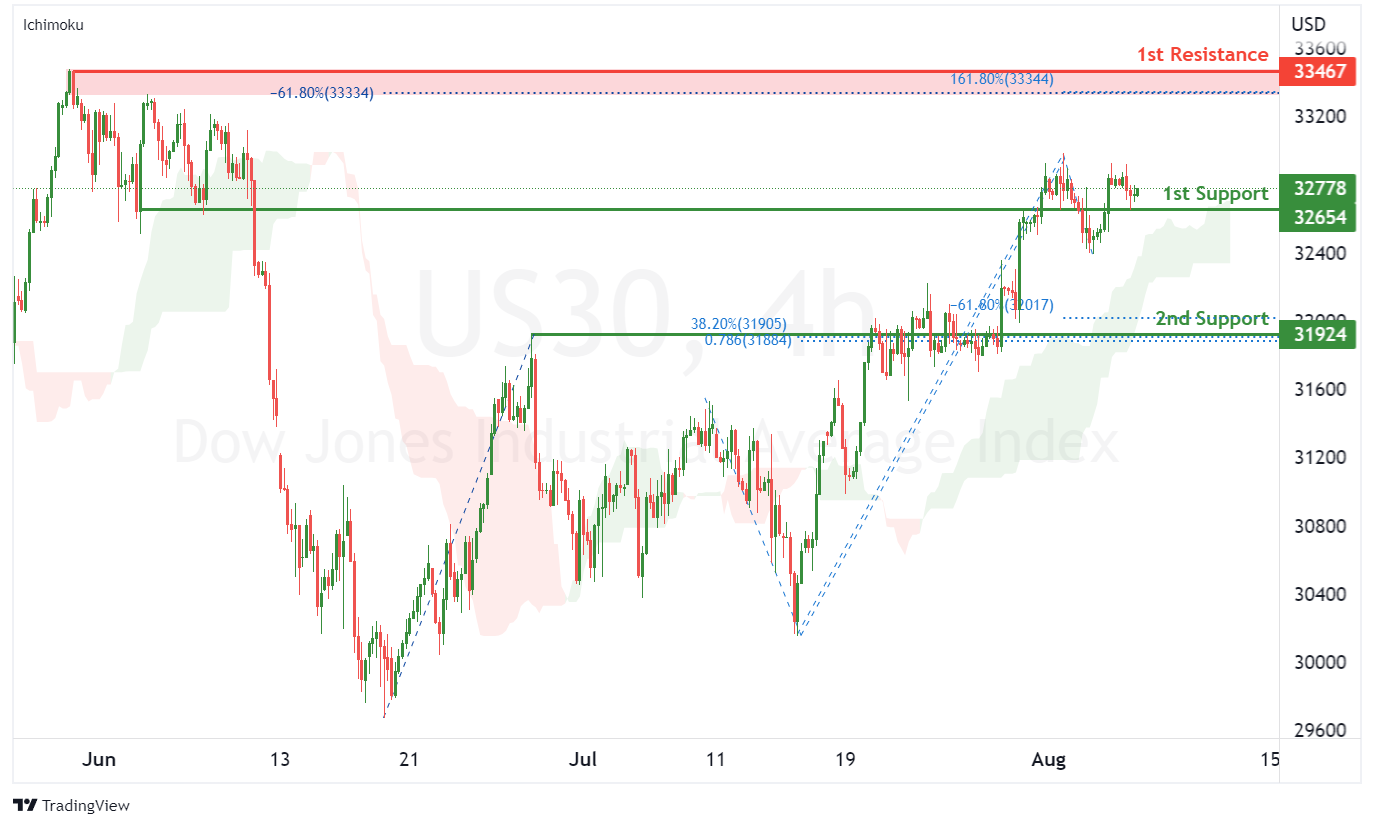
On the H4, with price moving above the ichimoku indicator, we have a bullish bias that price will rise from the 1st support at 32654 where the pullback support is to the 1st resistance at 33467 where the swing high resistance, 161.8% fibonacci extension and -61.8% fibonacci expansion are. Alternatively, price could break 1st support structure and drop to 2nd support at 31924 where the pullback support, -61.8% fibonacci expansion, 38.2% fibonacci retracement and 78.6% fibonacci projection are.
Areas of consideration:
- H4 time frame, 1st resistance of 33467
- H4 time frame, 1st support at 32654
DAX:
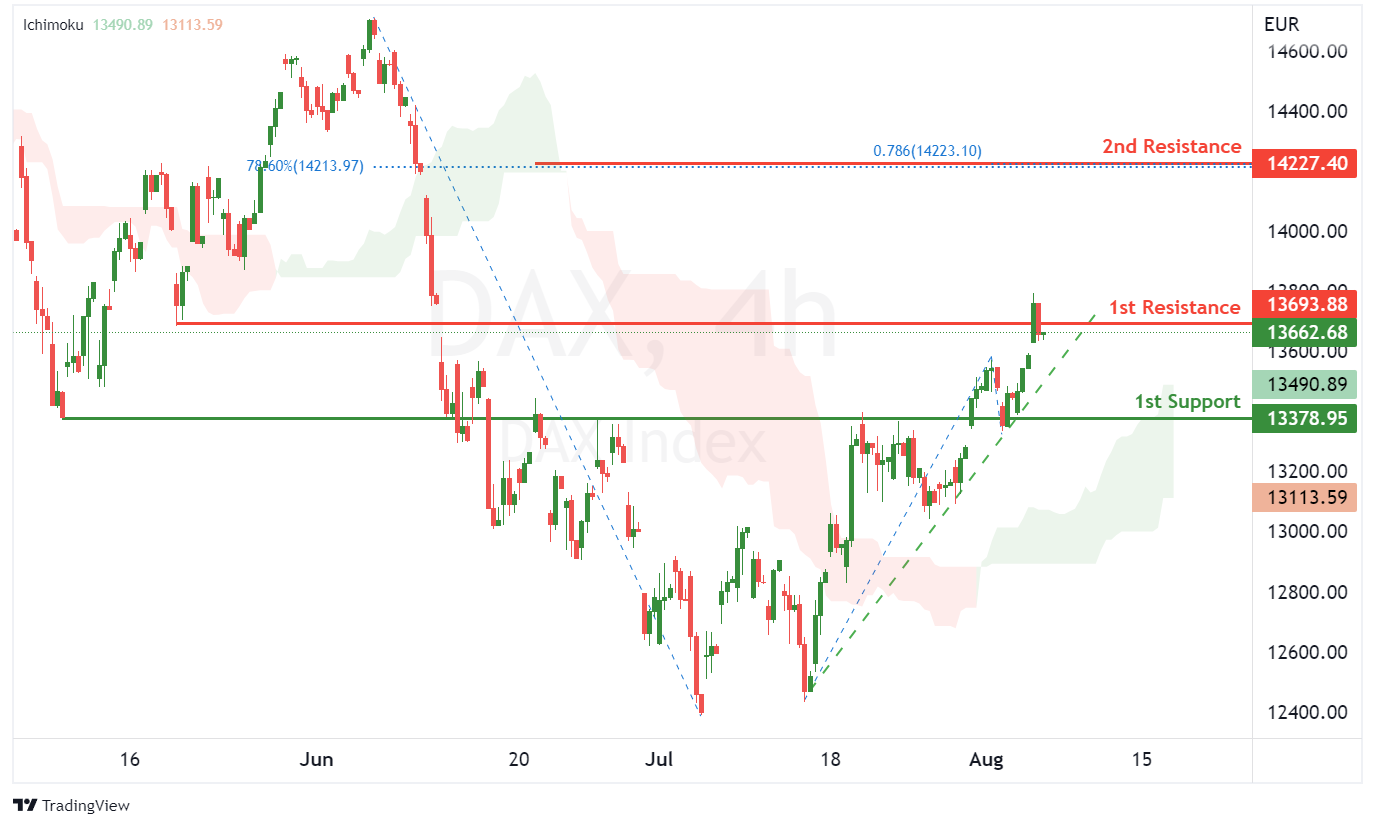
On the H4, with price moving above the ichimoku indicator and along the ascending trendline, we have a bullish bias that price will rise to 1st resistance at 13693.88 where the pullback resistance is. Once there is upside confirmation of price breaking 1st resistance structure, we would expect bullish momentum to carry price to 2nd resistance at 14227.40 in line with 78.6% fibonacci projection and 78.6% fibonacci retracement. Alternatively, price could drop to 1st support at 13378.95 where the overlap support is.
Areas of consideration:
- H4 time frame, 1st resistance of 13693.88
- H4 time frame, 1st support at 13378.95
ETHUSD:
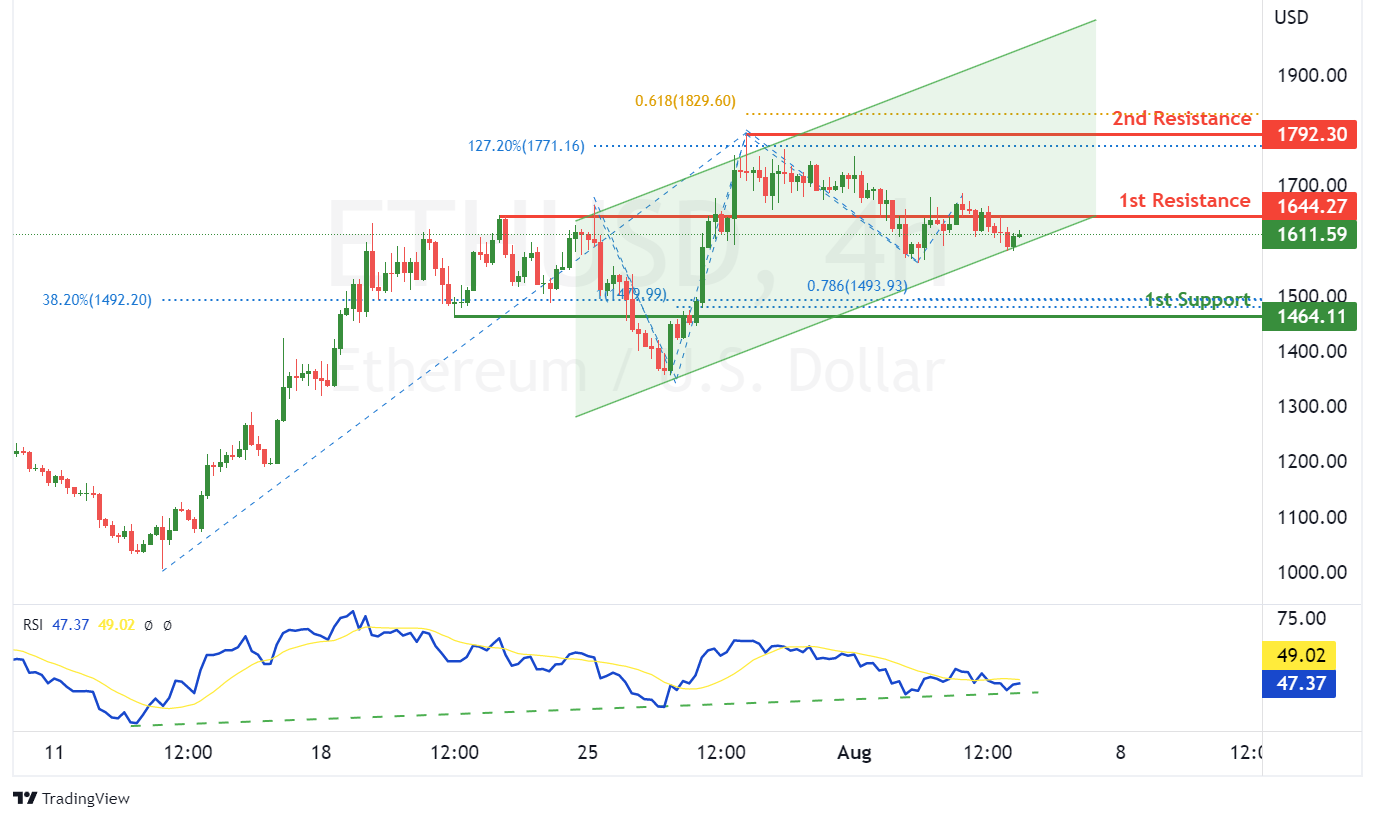
On the H4, with RSI moving along an ascending trendline and price moving within an ascending channel, we have a bullish bias that price will rise to 1st resistance at 1644.27 where the overlap support is. Once there is upside confirmation that price has broken 1st resistance structure, we would expect bullish momentum to carry price to 2nd resistance at 1792.30 where the swing high resistance, 127.2% fibonacci extension and 61.8% fibonacci projection are. Alternatively, price could drop to 1st support at 1464.11 where the pullback support, 78.6% fibonacci projection, 100% fibonacci projection and 38.2% fibonacci retracement are.
Areas of consideration:
- H4 time frame, 1st resistance of 1644.27
- H4 time frame, 1st support at 1464.11
BTCUSD:
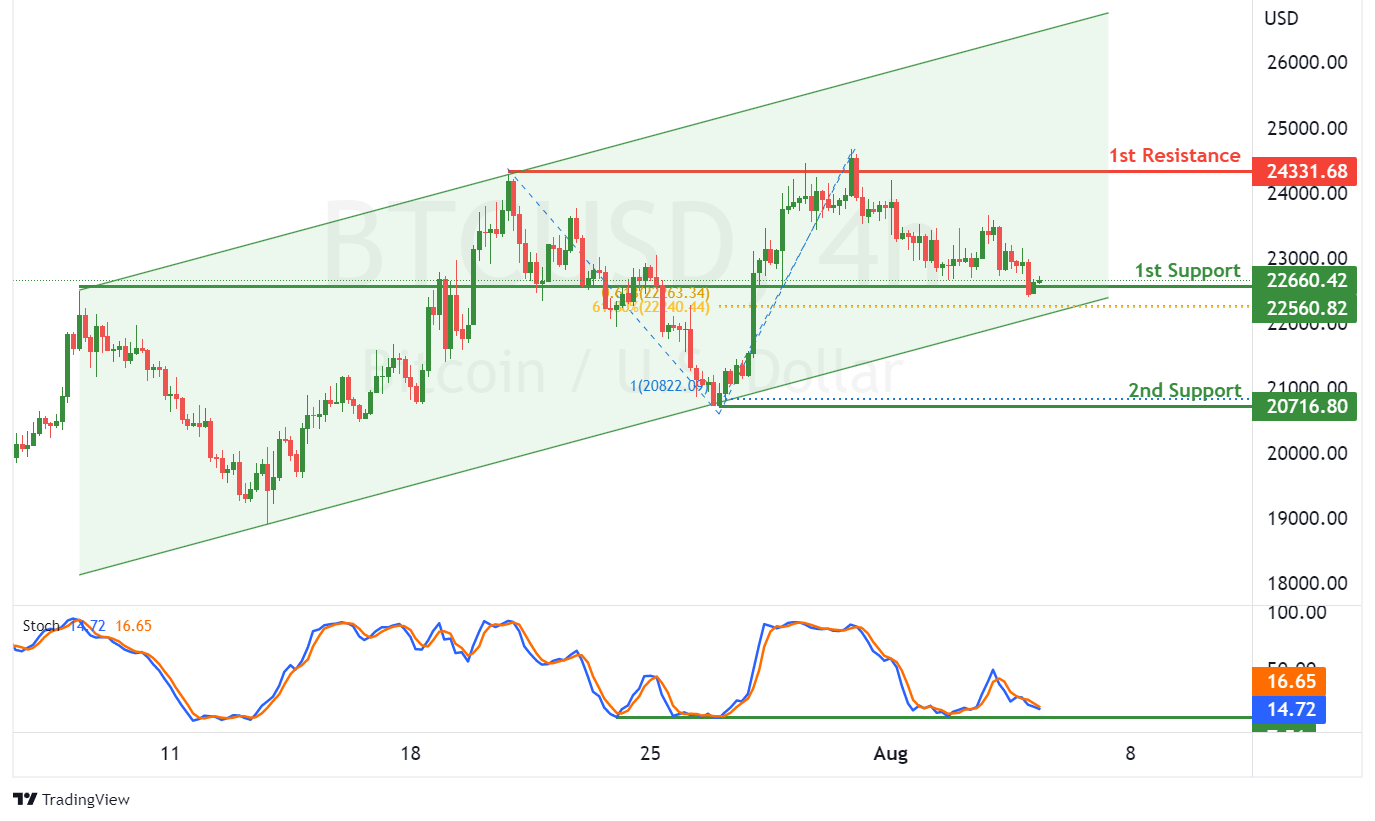
On the H4, with price moving within a bullish channel and expected to bounce from the stochastic support, we have a bullish bias that price will rise from our 1st support at 22560.82 where the pullback support, 61.8% fibonacci retracement and 61.8% fibonacci projection are to the 1st resistance at 24331.68 where the pullback resistance is. Alternatively, price could break 1st support structure and drop to 2nd support at 20716.80 where the swing low support and 100% fibonacci projection are.
Areas of consideration:
- H4 time frame, 1st resistance of 24331.68
- H4 time frame, 1st support at 22560.82
S&P 500:
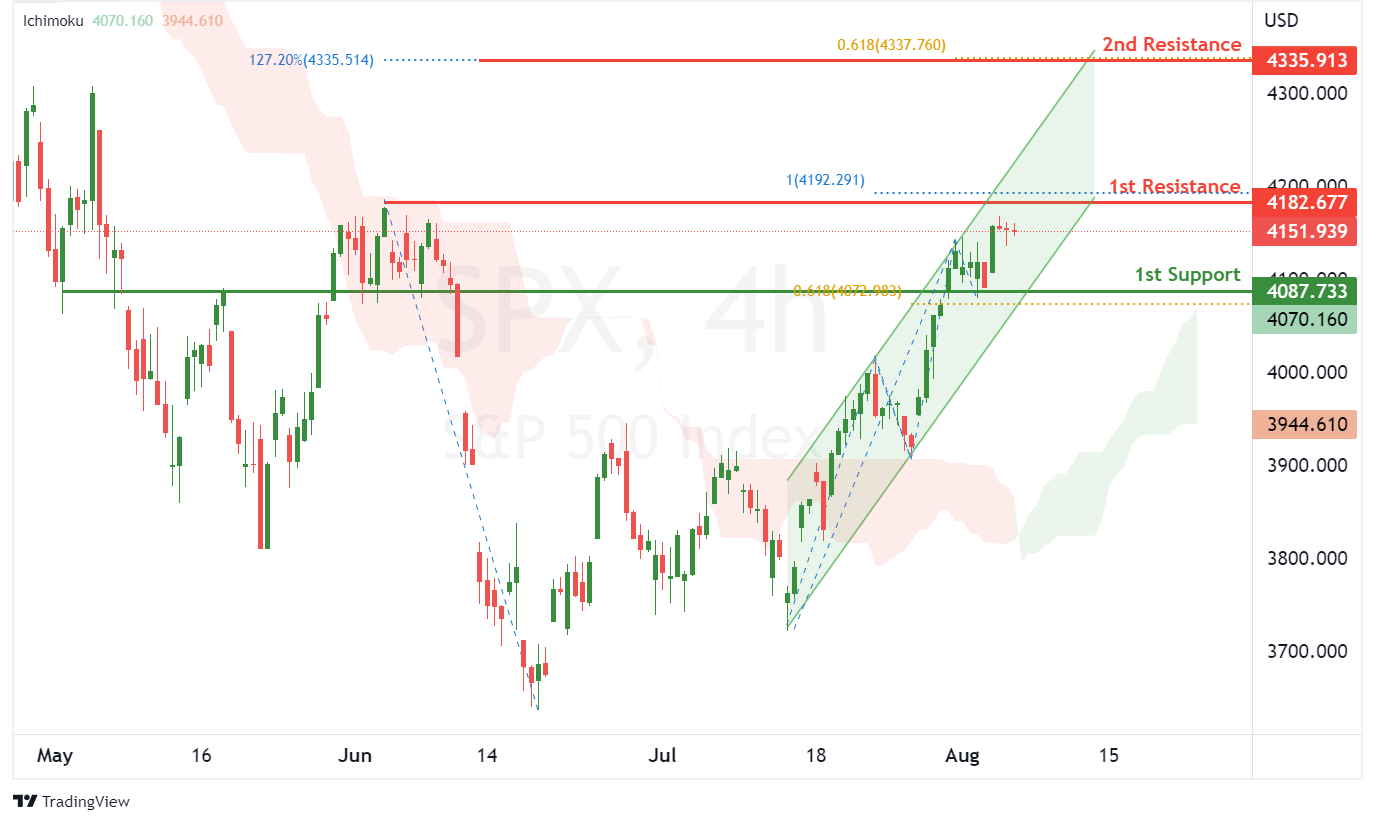
On the H4, with price moving above the ichimoku indicator and within an ascending channel, we have a bullish bias that price will rise to our 1st resistance at 4182.677 where the swing high resistance and 100% fibonacci projection are. Once there is upside confirmation that price has broken the 1st resistance structure, we would expect bullish momentum to carry price to 2nd resistance at 4335.913 where the 127.2% fibonacci extension and 61.8% fibonacci projection are. Alternatively, price could drop to 1st support at 4087.733 where the overlap support and 61.8% fibonacci projection are.
Areas of consideration:
- H4 time frame, 1st resistance of 4182.677
- H4 time frame, 1st support at 4087.733
USD/JPY Recovery Faces Hurdle, Oil Price Dives
Key Highlights
- USD/JPY started a recovery wave from the 130.40 zone.
- It is facing a major hurdle near 134.00 and 134.20 on the 4-hours chart.
- Crude oil price is gaining bearish momentum below the $92.50 support.
- The US nonfarm payrolls could increase 250K in July 2022, down from 372K.
USD/JPY Technical Analysis
The US Dollar declined heavily below the 135.00 support against the Japanese Yen. USD/JPY traded as low as 130.42 before there was an upside correction.
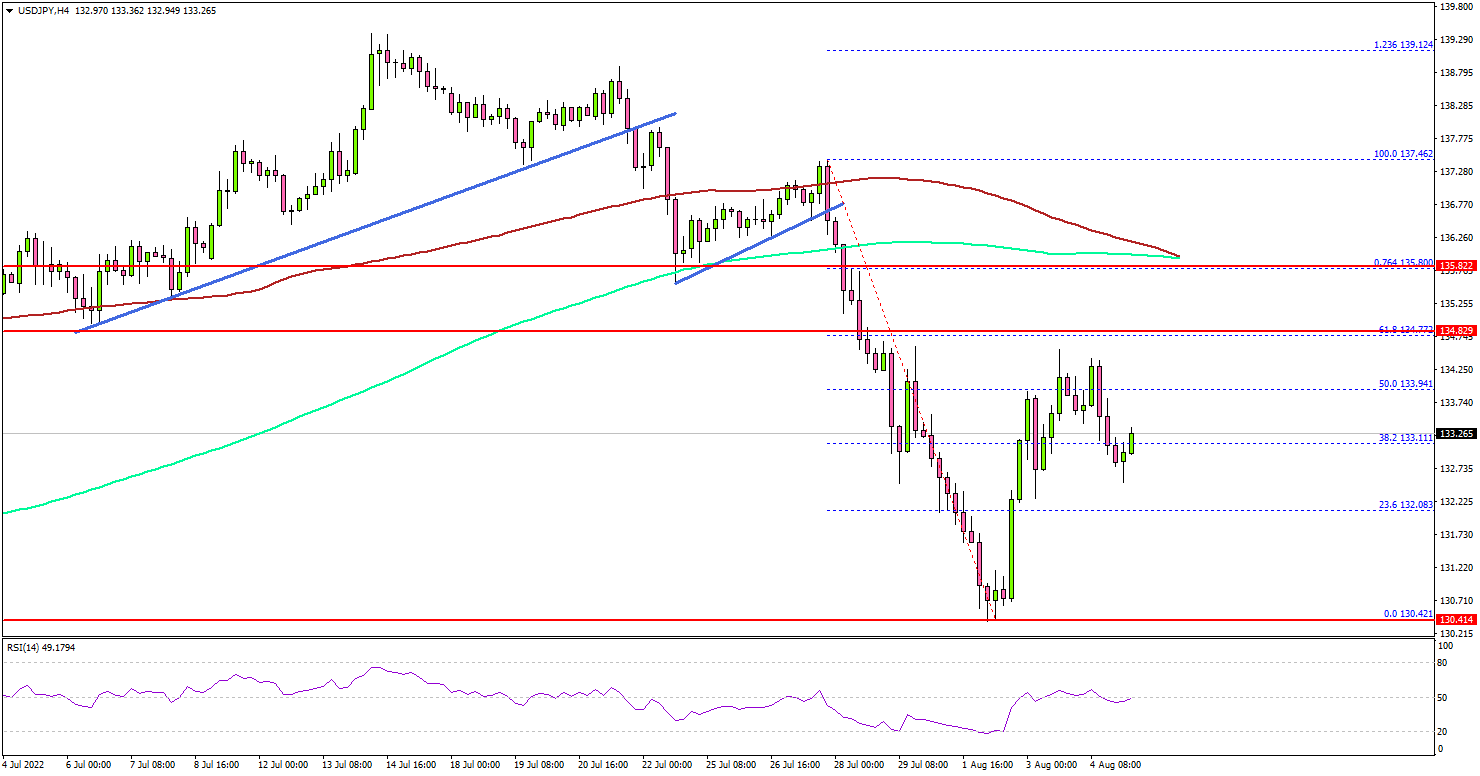
Looking at the 4-hours chart, the pair settled well below the 135.00 level, the 100 simple moving average (red, 4-hours), and the 200 simple moving average (green, 4-hours).
The pair started a recovery wave from the 130.42 low and climbed above the 132.50 resistance zone. The pair broke the 38.2% Fib retracement level of the downward move from the 137.46 swing high to 130.42 low.
USD/JPY is now struggling to clear the 50% Fib retracement level of the downward move from the 137.46 swing high to 130.42 low.
The next major resistance is near the 134.50 level, above which the pair could accelerate higher. In the stated case, the pair could rise towards the 136.00 resistance zone in the near term.
Conversely, USD/JPY pair might start a fresh decline below the 132.50 support zone. The first major support is near the 132.20 level. Any more losses might send the pair towards the 131.20 zone.
Looking at crude oil price, there was a sharp decline below the $95.00 and $92.50 support levels. The price even traded below the $90.00 level and it seems like the price might accelerate lower towards $85.00.
Economic Releases
- US nonfarm payrolls for July 2022 – Forecast 250K, versus 372K previous.
- US Unemployment Rate for July 2022 - Forecast 3.6%, versus 3.6% previous.
- Canada’s employment Change payrolls for July 2022 – Forecast 20K, versus -43.2K previous.
- Canada’s Unemployment Rate for July 2022 - Forecast 5%, versus 4.9% previous.
Will Canada’s July Jobs Report be Important for the Loonie?
Canadian employment likely returned to growth in July, Statistics Canada will show on Friday at 12:30 GMT, but the rebound may not be anything to celebrate. If that turns out to be the case, the figures could do little to alter investors’ rate hike expectations, leaving the loonie under the US dollar’s influence.
Soft employment growth expected
After a contraction of 43.2k in June, employment in Canada is expected to have increased by 20k in July. Although a return to growth is always welcomed, such an addition could still be among the smallest this year, and not enough to press the unemployment rate further lower. Instead, analysts see the unemployment rate ticking up to 5.0% from 4.9% previously but remaining close to record lows.
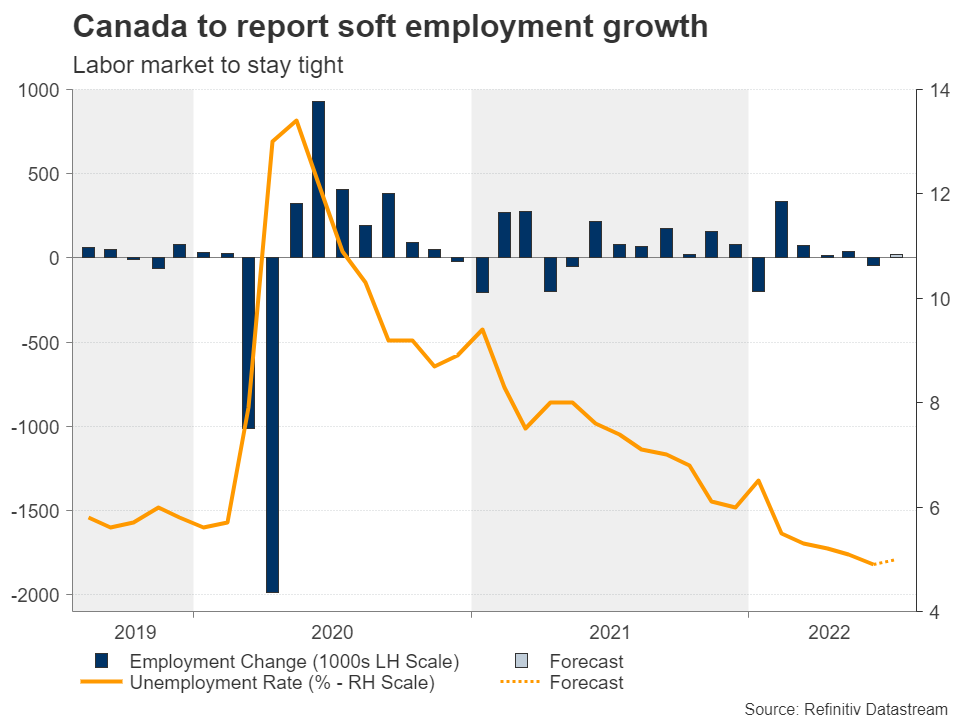
In a nutshell, the labor market is still quite tight and that might explain the marginal growth in job additions. The latest S&P Global manufacturing PMI survey has also witnessed the softest employment expansion in more than a year, citing restructuring proceedings, which led some companies to cut some workforce.
How could the BoC react?
The question that comes to mind now is how the data will affect the central bank’s rate outlook. Following a surprisingly extraordinary 100 basis point rate increase in July, investors are now debating whether September’s policy meeting will result in a reduced but still robust 75 bps or 50 bps rate hike.
If June’s employment downfall unexpectedly extends for another month, sending preliminary warnings that boiling inflation has started to weigh on hiring, even if wages are still rising at a slower pace than prices, more investors could place their rate expectations on the less hawkish scenario. In this case, the loonie could decelerate, bringing the 20-day simple moving average (SMA) at 1.2910 per US dollar under examination, while not far above, the 1.2950 resistance will be closely watched as well. A bigger miss in the data could see the greenback rallying towards the key resistance area of 1.3036 – 1.3083, especially if the US nonfarm payrolls data due on the same day and time appear relatively more impressive.
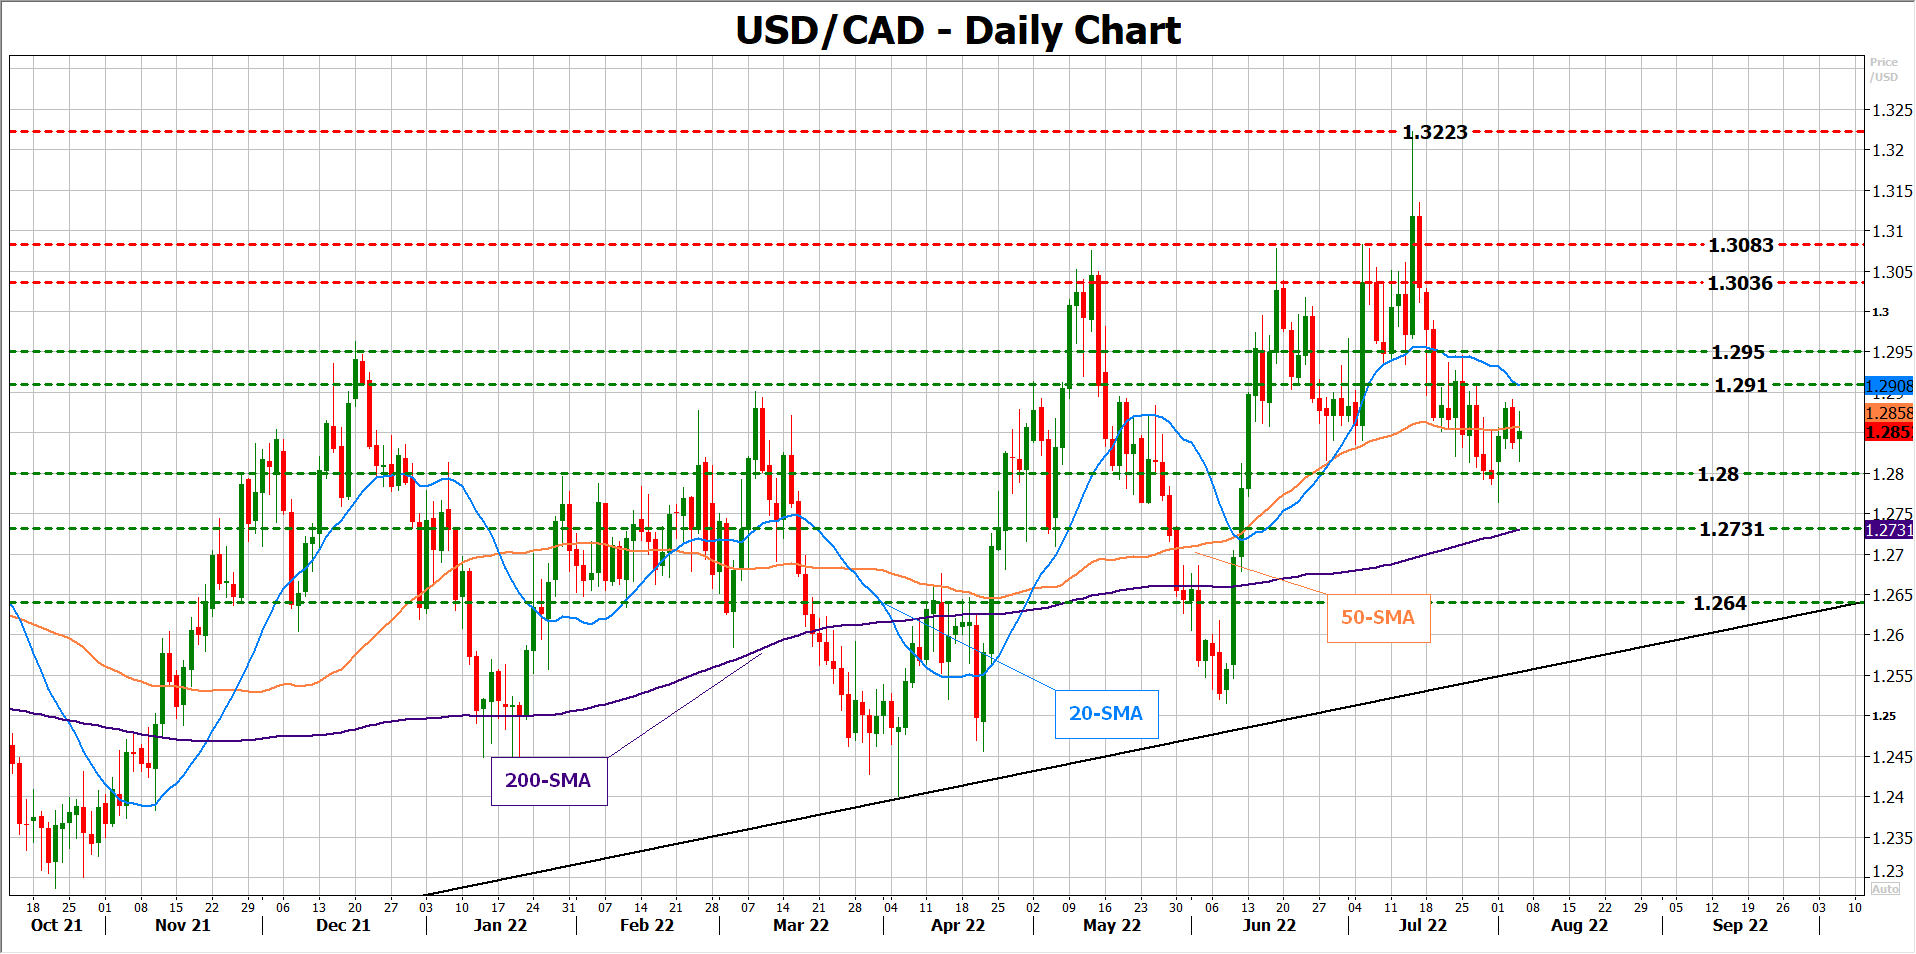
In the positive scenario, where the economy creates more jobs than analysts forecast, the central bank could feel more confident to front-load its tightening cycle as inflation seems to be transforming into a more persistent phenomenon.
Housing market eyed
Of course, monetary tightening seems to be already draining the heat of the booming housing market, with home prices tumbling the most in at least 17 years in June. Though, the housing price index is still among the highest in more than a decade, while household debt still represents more than 100% of households' income.
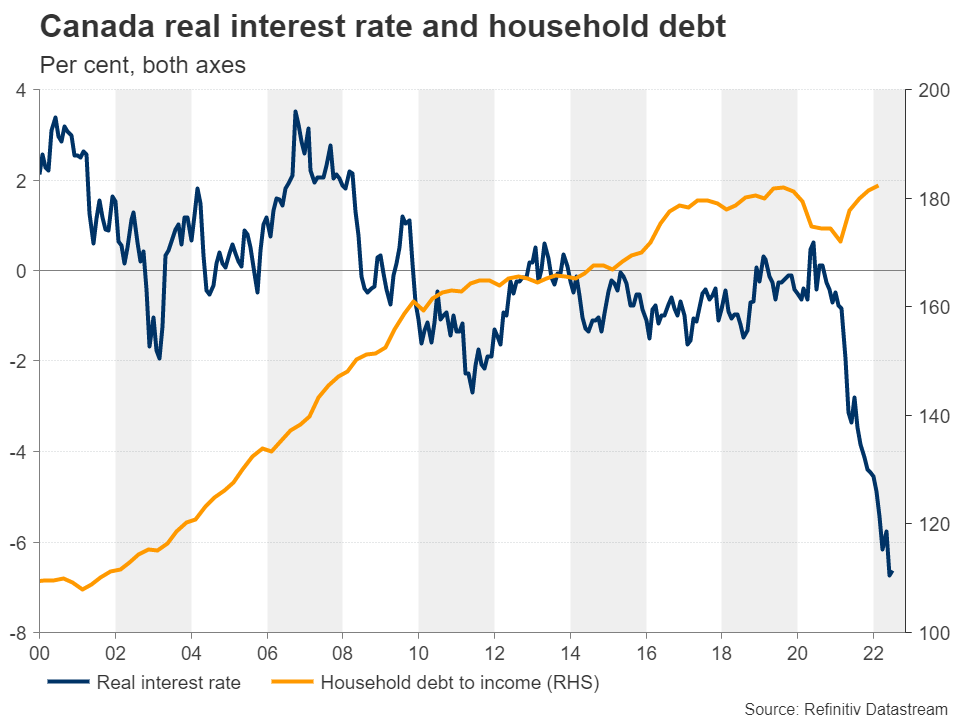
Therefore, although the falling housing market brings flashbacks from the 2007-2009 financial crisis, policymakers will probably prioritize their inflation mission if the labor market stands firm in the year ahead. Besides, given Canada’s commodity rich economy, rising energy prices could create more revenues for businesses. That said, traders may remain patient and wait for August’s employment report before they make up their minds about either a 50- or 75-bps rate hike in early September.
As regards the market reaction, the Canadian employment report will have to decisively beat market expectations and come in brighter than the US nonfarm payrolls to squeeze dollar/loonie below 1.2800. In this case, the door will open for the 200-day SMA at 1.2731, while even lower, the 1.2640 constraining zone could come under examination ahead of the long term descending trendline.
Elliott Wave View: 5 Waves Rally in Gold
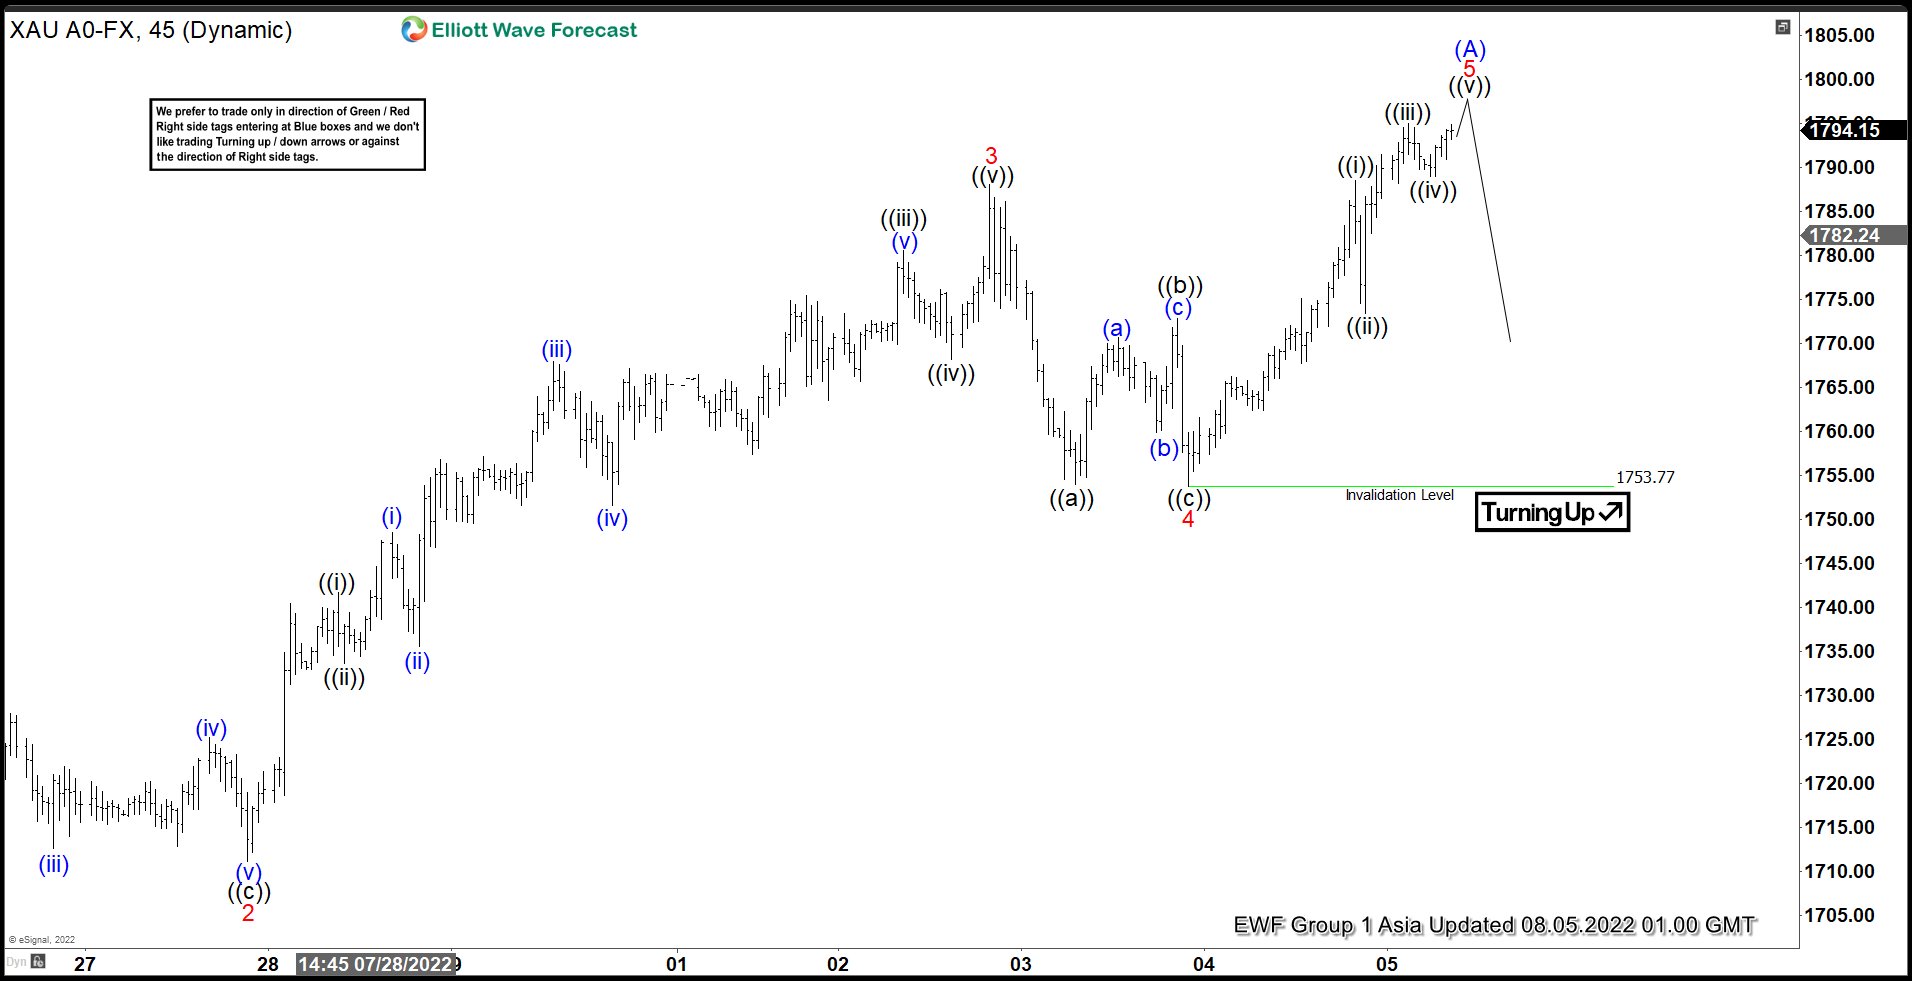
Short Term Elliott Wave View in Gold suggests rally from 7.21.2022 low is in progress as a 5 waves impulse Elliott Wave structure. Up from 7.21.2022 low, wave 1 ended at 1739.27 and pullback in wave 2 ended at 1711.10. The metal then extends higher in wave 3 towards 1788.03. Internal subdivision of wave 3 is in another impulse in lesser degree as the 45 minutes chart below shows. Up from wave 2, wave ((i)) ended at 1741.69 and pullback in wave ((ii)) ended at 1733.60.
The metal extends higher again in wave ((iii)) towards 1780.52. Dips in wave ((iv)) ended at 1768.10. Final leg higher wave ((v)) of 3 ended at 1788.03. Pullback in wave 4 ended at 1753.77 with internal subdivision as a zigzag. Down from wave 3, wave ((a)) ended at 1753.90. Rally in wave ((b)) ended at 1772.77, and wave ((c)) lower ended at 1753.77. This completed wave 4 in higher degree. Index has resumed higher in wave 5. Up from wave 4, wave ((i)) ended at 1788.47, and wave ((ii)) pullback ended at 1773.40. Wave ((iii)) ended at 1794.93, and pullback in wave ((iv)) ended at 1787.70.
Expect 1 more push higher in wave ((v)) to end the 5 waves rally from 7.21.2022 low and complete wave (A). Afterwards, it should pullback in wave (B) to correct that cycle in larger degree 3, 7, or 11 swing before the next leg higher. Near term, expect Gold to end wave (A) soon and see 3 waves pullback, but as far as the pullback stays above 7.21.2022 low at 1680.20, it should resume higher again.
XAUUSD 45 Minutes Elliott Wave Chart
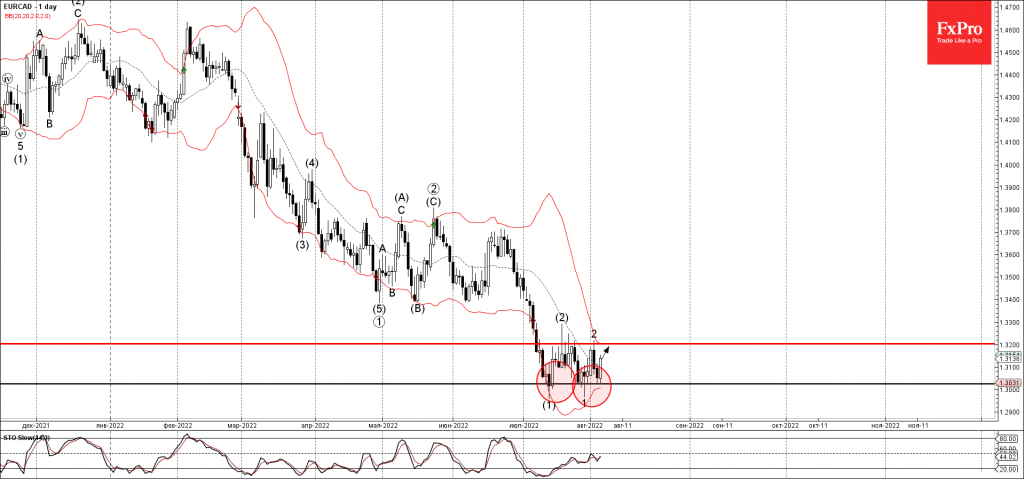
EURCAD Wave Analysis
- EURCAD reversed from support level 1.3025
- Likely to rise to resistance level 1.3200
EURCAD currency pair recently reversed up from the pivotal support level 1.3025 (which has been reversing the pair from the middle of July) – intersecting with the lower daily Bollinger Band.
The upward reversal from the support level 1.3025 is likely to form the daily candlesticks pattern Bullish Engulfing.
EURCAD currency pair can be expected to rise toward the next resistance level 1.3200 (which stopped the earlier corrections (2) and 2).
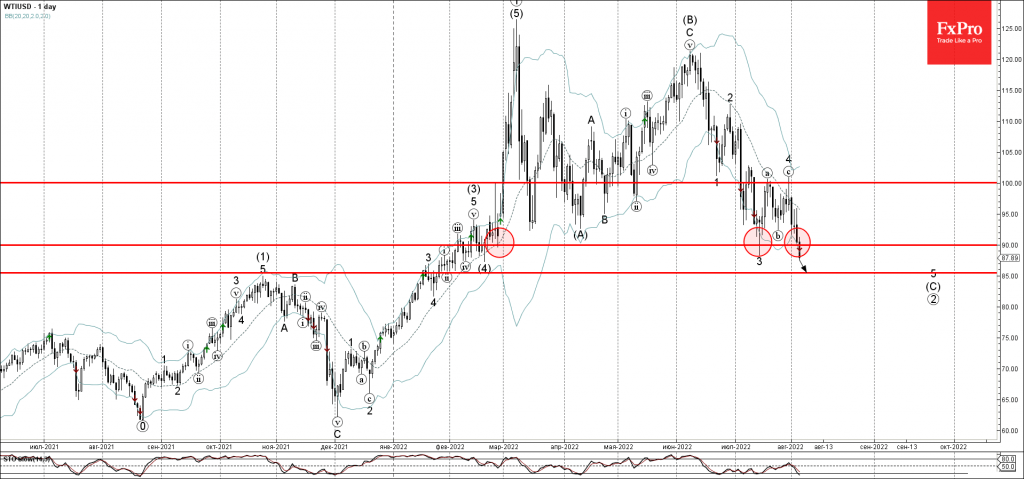
WTI Wave Analysis
- WTI broke round support level 90.00
- Likely to fall to support level 85.00
WTI crude oil today broke below the key round support level 90.00 (which has been reversing the pair from the end of February).
The breakout of the support level 90.00 accelerated the active impulse wave 5 of the intermediate impulse sequence (C) from the start of June.
WTI crude oil can be expected to fall toward the next support level 85.00 (target for the completion of the active impulse wave 5).
GBP/USD Falls After 50 bps Hike
- BoE hikes bank rate by 50 bps to 1.75%
- GBP/USD falls in reaction to weak UK growth forecasts
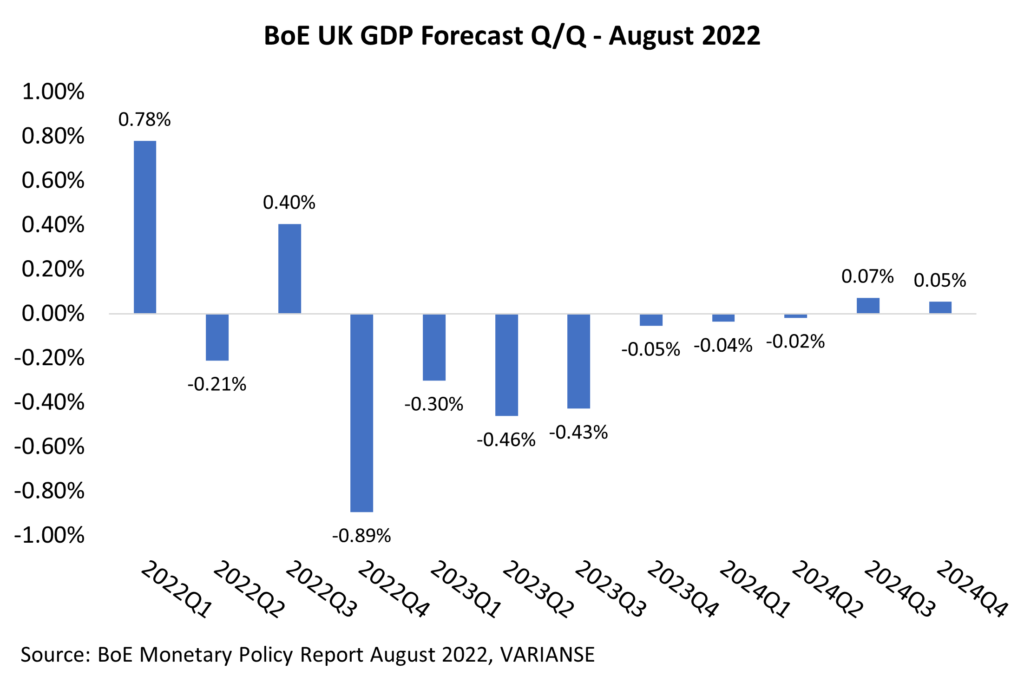
BoE GDP Forecasts Shock
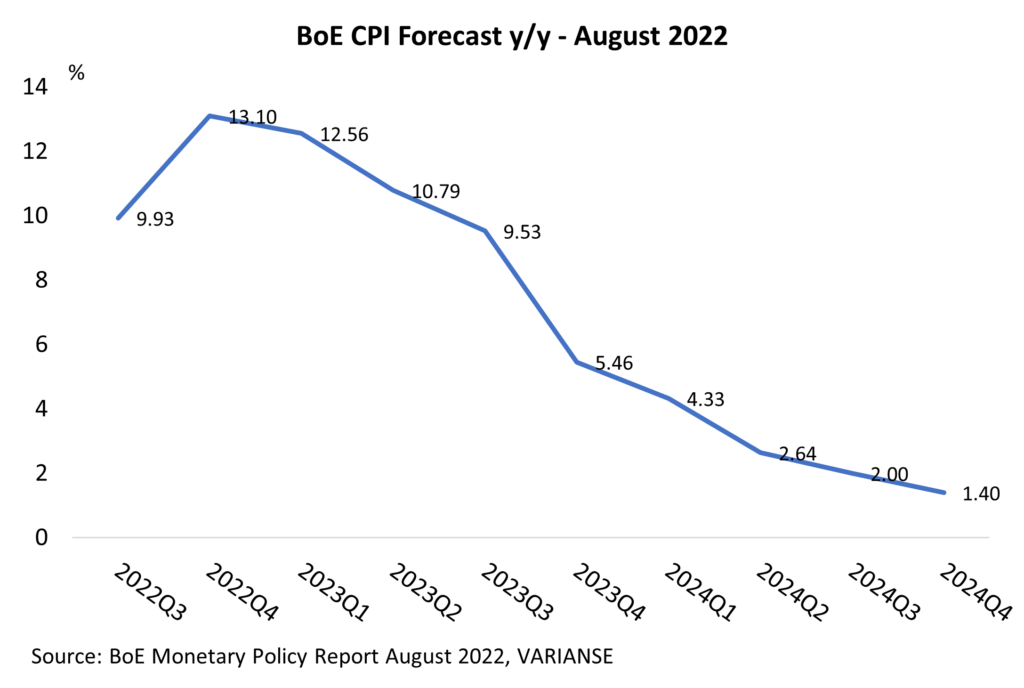
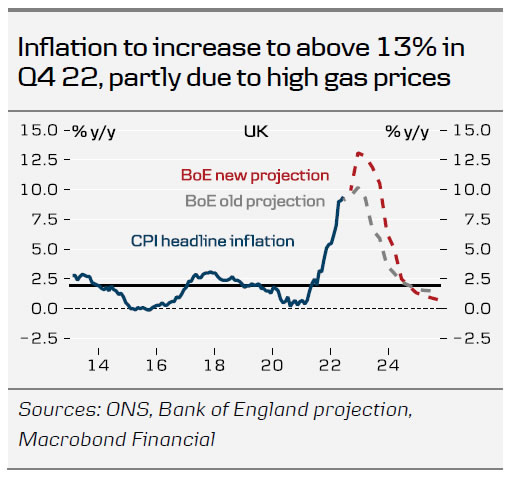
“Expect the unexpected”, said Oscar Wilde, the famous Irish poet and playwright. That certainly has proven true in relation to Bank of England policy as of late. Thursday’s monetary policy decision was certainly no exception in that regard. This time around, however, it wasn’t the 50 bps hike that has taken the bank rate to 1.75% that proved surprising. Both interest rate markets and the majority of economists had anticipated the move. Less expected, however, was downward revisions to the Bank of England’s UK GDP forecasts, which now point to a technical recession starting in Q4 2022 and persisting throughout 2023. Meanwhile, fresh inflation forecasts point toward CPI inflation topping out at 13.1% in Q4 2022, and remaining persistently high, before dropping sharply from Q3 2023.
GBP/USD Reacts Badly
Unsurprisingly, GBP/USD fell sharply on the news. At the time of writing, the pair was down by nearly 0.23% on the day to trade at 1.2115. Slower expected growth and persistently high inflation clearly highlight the challenges the Bank of England faces in getting inflation under control. Weaker expected growth, in particular, raises serious questions about the central bank’s capacity to raise interest rates as aggressively going forward. As a result, UK 2-year yields ticked lower, down by 10 bps at one point during the day. Thursday’s 50 bps hike appears to be an attempt by the BoE to front load interest rate hikes now to avoid the chance of more aggressive hikes in the future. In turn, this suggests the BoE will struggle to keep pace with the Fed in terms of policy tightening.
Charts Look Pessimistic
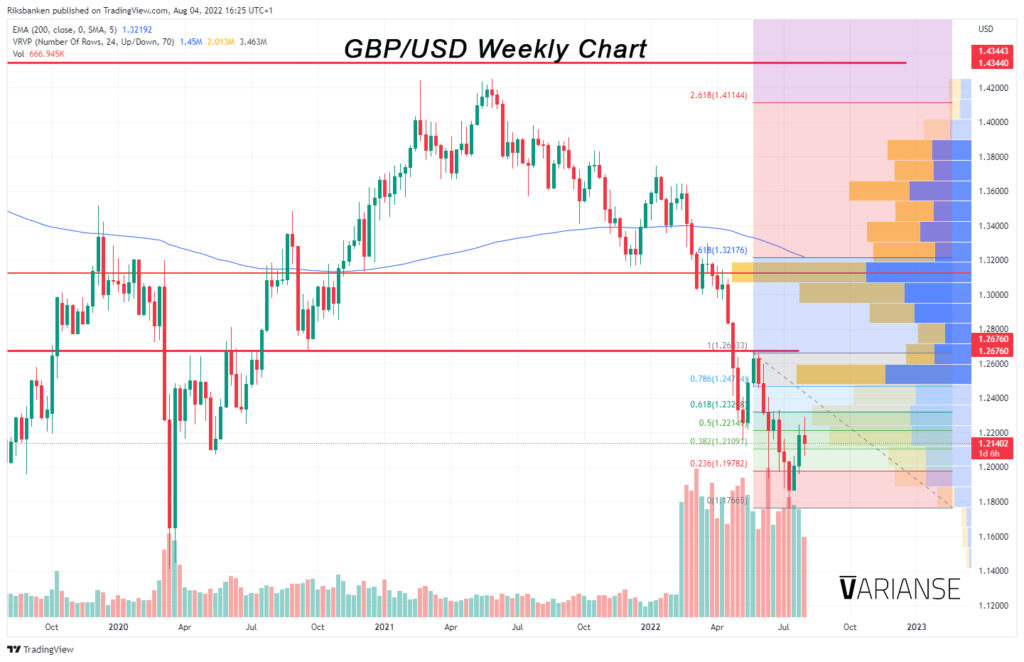
It’s not just the fundamentals that appear pessimistic GBP/USD. Be it on the higher weekly or the lower daily timeframe, GBPUSD is trading well below its 200-day exponential moving average. Furthermore, from a market structure perspective, GBP/USD is clearly still also pointing to a clear downtrend since the start of 2022. Price is now sitting close to the halfway mark between the prior May corrective swing high of 1.22670 and July swing low of 1.17603, leaving the pair primed for further losses after Thursday’s decline. Were price to break above the 1.26760 level, which has proven to be a strong pivot level, that might restore more confidence in the pair. Alas, at the moment, the market is far away from that level.
Eco Data 8/5/22
[php_everywhere instance="1"]
Bank of England Update Review: Dovish 50bp Rate Hike
BoE: high inflation but rising recession risk
In line with expectations, the Bank of England (BoE) hiked the Bank Rate by 50bp to 1.75% (the largest hike in 27 years) with only member voting for a 25bp hike. BoE announced that active QT (i.e. outright government bond selling) will start after the September meeting with proposed bond sales of 10 billion pounds per quarter, totalling a reduction in bond holdings of 80 billion pounds over 12 months.
As expected, attention was on forward guidance rather than the rate hike itself. The BoE announced that it has adopted a meeting-by-meeting approach stating that "Policy is not on a pre-set path.", giving close to no forward guidance to markets. This is similar to some of the other large central banks, namely the Fed and ECB, although BoE's forward guidance is slightly weaker at this point.
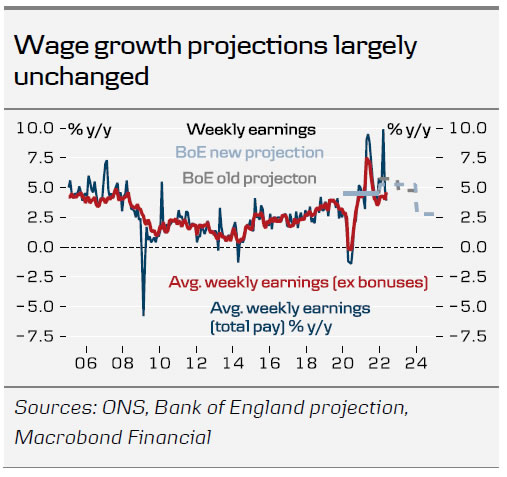
One of the key takeaways from the Monetary Policy Report is that the BoE now projects a recession by Q4 2022 based on market pricing, which feeds well into the narrative playing out in markets where rising recession fears are dominating. This deviates from other central banks, who still communicate that a soft landing is possible.
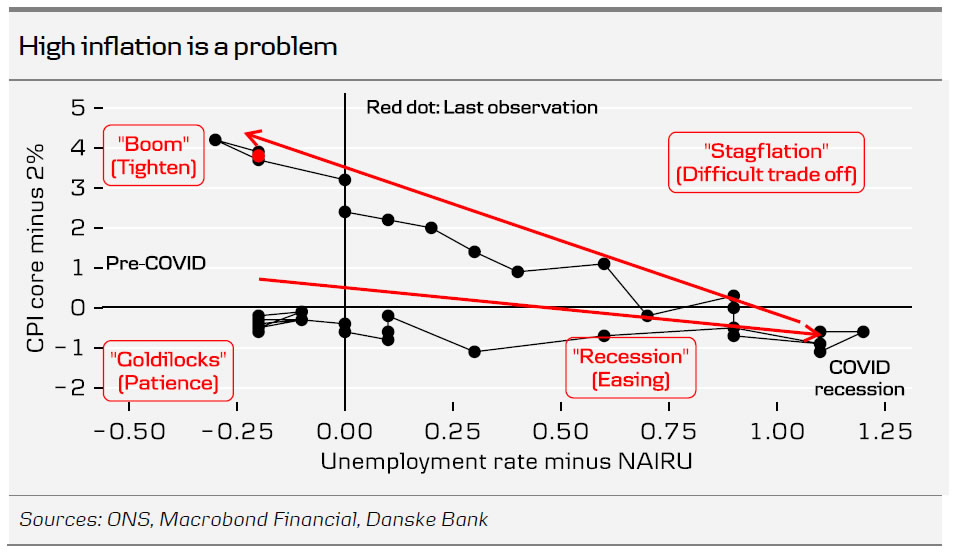
Overall, in our view, it seems fair to conclude that although forward guidance was significantly limited, it is to the dovish side given the economic growth projections. The MPC stated that "the risks around the MPC's projections from both external and domestic factors are exceptionally large at present" highlighting that the course of monetary policy the coming months is still largely uncertain. On the one hand, the Bank of England likely needs to tighten further in order to get inflation under control. On the other hand, the Bank of England is likely to pause when the recession gets visible in data. In other words, monetary policy is not as straight forward in H2 2022 as it was in H1 2022.
Markets reacted accordingly with EUR/GBP moving up from 0.836 to 0.841 and 2yr gilt yields declined to 1.72% from 1.88%. Markets are now pricing in an additional total of nearly 100bp rate hikes this year.
We change our Bank of England call now expecting another 50bp rate hike in September and another 25bp in November, recognising that the Bank of England is probably not ready to fully stop hiking just yet despite rising recession risks. Further tightening is needed in order to cool extraordinarily high inflation pressure. We expect no rate hikes beyond the November meeting (although another 25bp rate hike in December seems like a close call at this point) and believe markets will start to focus even more on possible rate cuts in 2023 when the UK actually falls into recession..
We are slightly more dovish than markets, as the Bank of England has more emphasis on the economic outlook than what markets believe in. We still see a case for EUR/GBP to move slightly higher near-term on relative rates, targeting the cross at 0.86 in 3M. Further out, GBP usually appreciates vs EUR in an environment where USD performs and expect EUR/GBP to move back towards 0.84 in 12M.
Euro Drifting Continues
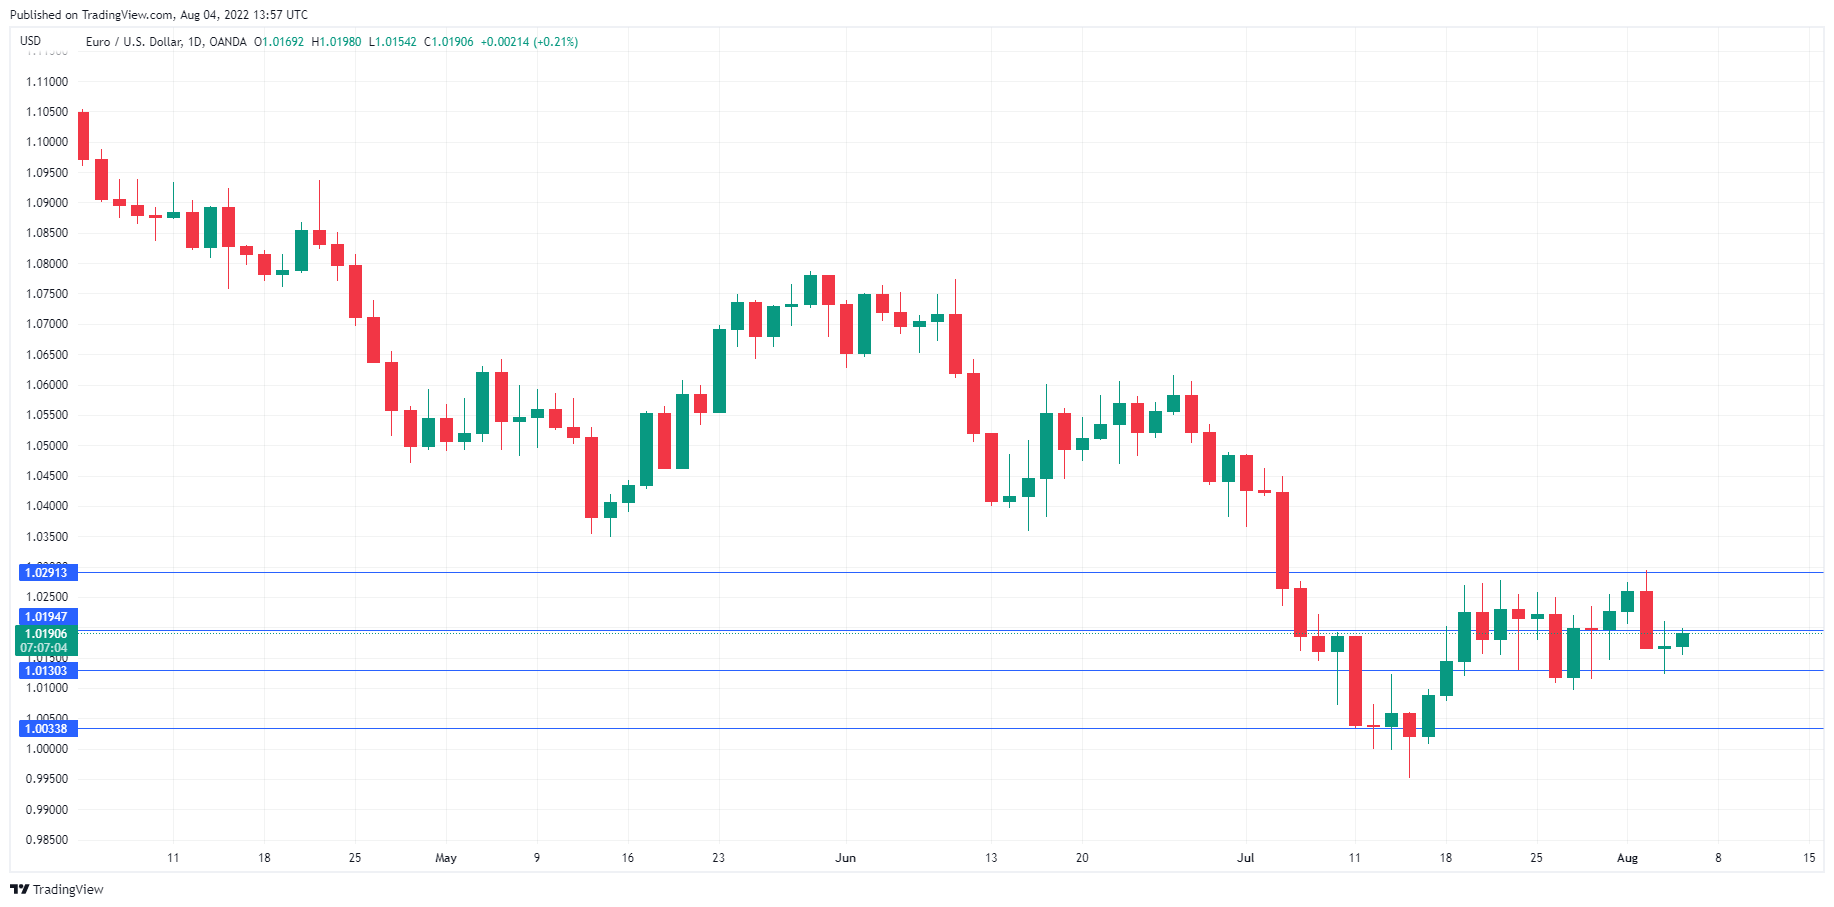
The euro is showing little movement for a second straight day. In the North American session, EUR/USD is trading at 1.0187, up 0.14% on the day.
With a light economic calendar today in both the US and Europe, the euro is likely to continue to have a quiet day. Investors shrugged after a soft reading from German Factory Orders earlier today, with a decline of 0.4% in June. This was better than the forecast of -0.8% but lower than the May reading of -0.2%(revised from +0.1%).
German Factory Orders have now posted declines for five straight months, reflecting prolonged weakness in the manufacturing sector. Earlier this week, German Manufacturing PMI slipped into contraction territory for the first time in over two years, with a reading of 49.3. German manufacturing has been hurt by the slowdown in the global economy, and the slowdown in manufacturing is reflected in these two indicators. This raises concerns about the strength of the German economy, as well as the entire eurozone, as Germany is a bellwether for the rest of the bloc.
It is a stretch to paint an optimistic picture for Germany and the eurozone, with the war in Ukraine dragging on and a possible energy crisis courtesy of Russian President Putin. Inflation in the eurozone shows no signs of peaking and the ECB is playing catch-up, having finally raised interest rates last month for the first time in a decade. Russia has demonstrated that it is willing to weaponise its energy exports, and that could lead to an energy shortage ahead of winter, which is only a few months away.
EUR/USD Technical
- EUR/USD is testing resistance at 1.0194. Above, there is resistance at 1.0291
- There is support at 1.0130 and 1.0033