Sample Category Title
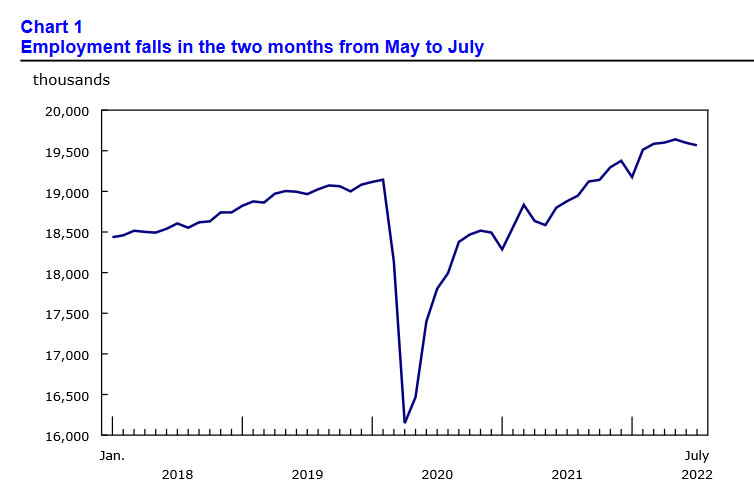
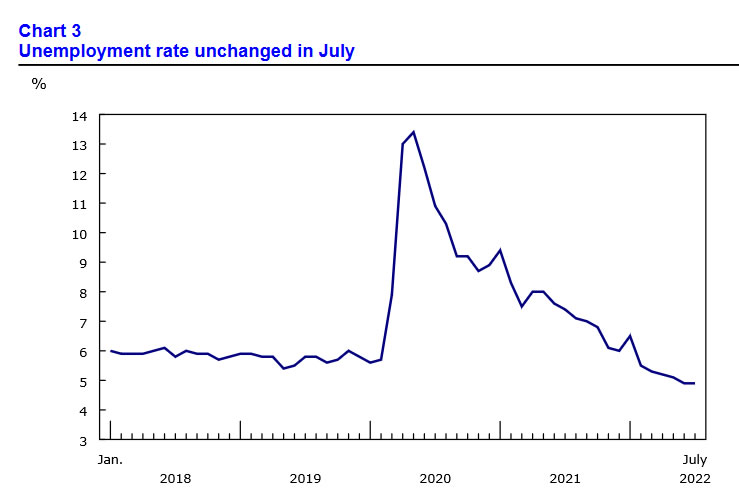
Canada employment dropped -30.6k in Jul, unemployment rate unchanged at 4.9%
Canada employment dropped -30.6k in July, much worse than expectation of 25.0k growth. Services-producing jobs dropped -53k or -0.3% while goods-producing jobs rose 23k or 0.6%.
Unemployment rate was unchanged at 4.9%, below expectation of 5.0%, but matched the historic low reached in June. Total hours worked were down -0.5%. Average hourly wages was up 5.2% yoy.
US NFP grew 528k in Jul, unemployment rate down to 3.5%, strong wage growth
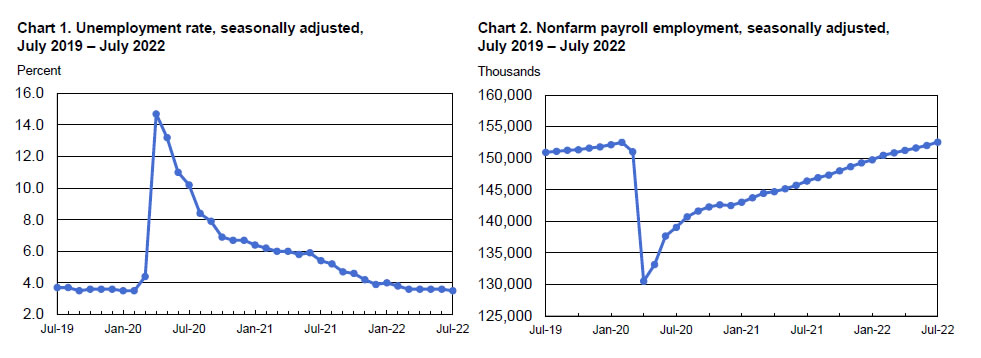
US non-farm payroll employment grew strongly by 528k in July, well above expectation of 250k. That's also much higher than the average gain of 388k over the prior 4 months. Total non-farm employment has also reached its pre-pandemic level.
Unemployment rate dropped from 3.6% to 3.5%, better than expectation of 3.6%. Participation rate dropped -0.1% to 62.1%.
Average hourly earnings rose 0.5% mom in July, above expectation of 0.3% mom.
S&P500: Bear Market Rally or Return to Growth?
The S&P500 is at 4150, having returned to the rebound highs of late May. The direction of the breakout outside the 4100-4200 range will determine its future for the next days or weeks.
In mid-June, the S&P500 halted its correction from the all-time highs. After losing around 25% in just over six months and returning to the lows since December 2020, the stocks have turned up, despite the background rather than thanks to it. In the last month and a half, the financial world has seen two 75-point Fed rate hikes, a shocking downturn in the housing market and a cooling of consumer demand. That said, the index has continued to crawl upwards, even if this recovery cannot be called flat.
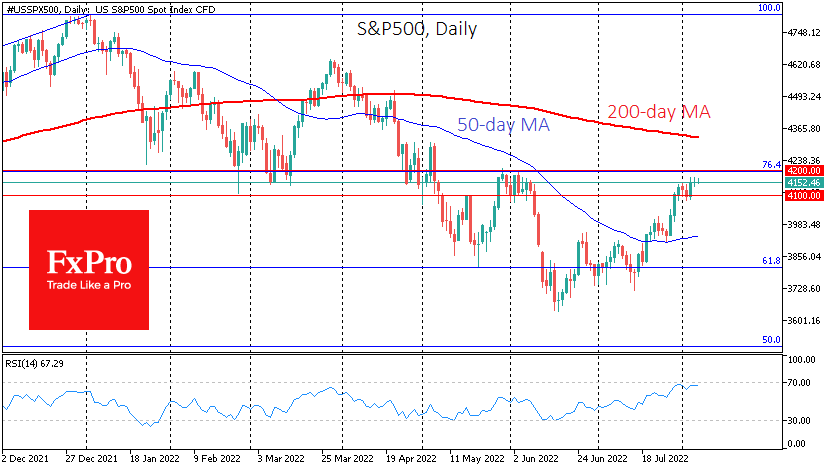
Technically, the S&P500 made a classic Fibonacci correction of the rally from March 2020 to all-time highs in early 2022, getting support on the 61.8% retracement area.
Late last month, a significant signal to break the downtrend was the consolidation above the 50-day moving average, which later turned from resistance into support.
However, locally, it is too early for the bulls to celebrate the return of the bull market. The RSI index on the daily charts is approaching the overbought area, raising the question of a legitimate pullback after a month and a half rally. Separately, the S&P500 index is approaching the circular 4200 level, almost coinciding with the 76.4% retracement of the global rally.
The above disposition shows that gravitational pressure is building up in the equity market, and the downside momentum risks are rising markedly in the near term.
From a longer-term perspective, however, a consolidation above the 4200 levels would mark the start of a new, more solid phase of the equity market recovery. The further upside would no longer be called a “bear market rally”. It would be more of a “return to the upside after a six-month correction”.
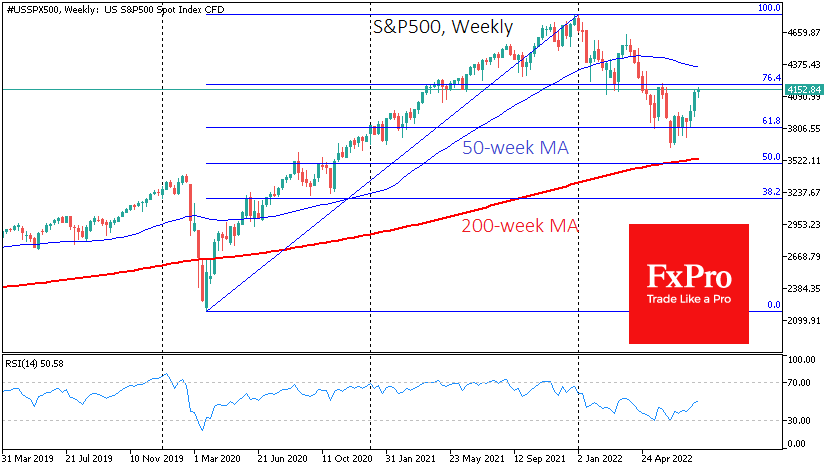
And if the immediate correction takes the S&P500 under 4100 – below the previous local lows – it would indicate that the bearish momentum is taking hold, and we might see a new decline. In that case, investors should be prepared that the markets will not only return to the lows of June but also rewrite them, taking the index towards 3000.
GBPJPY Tests Support Trendline; Bias Bearish
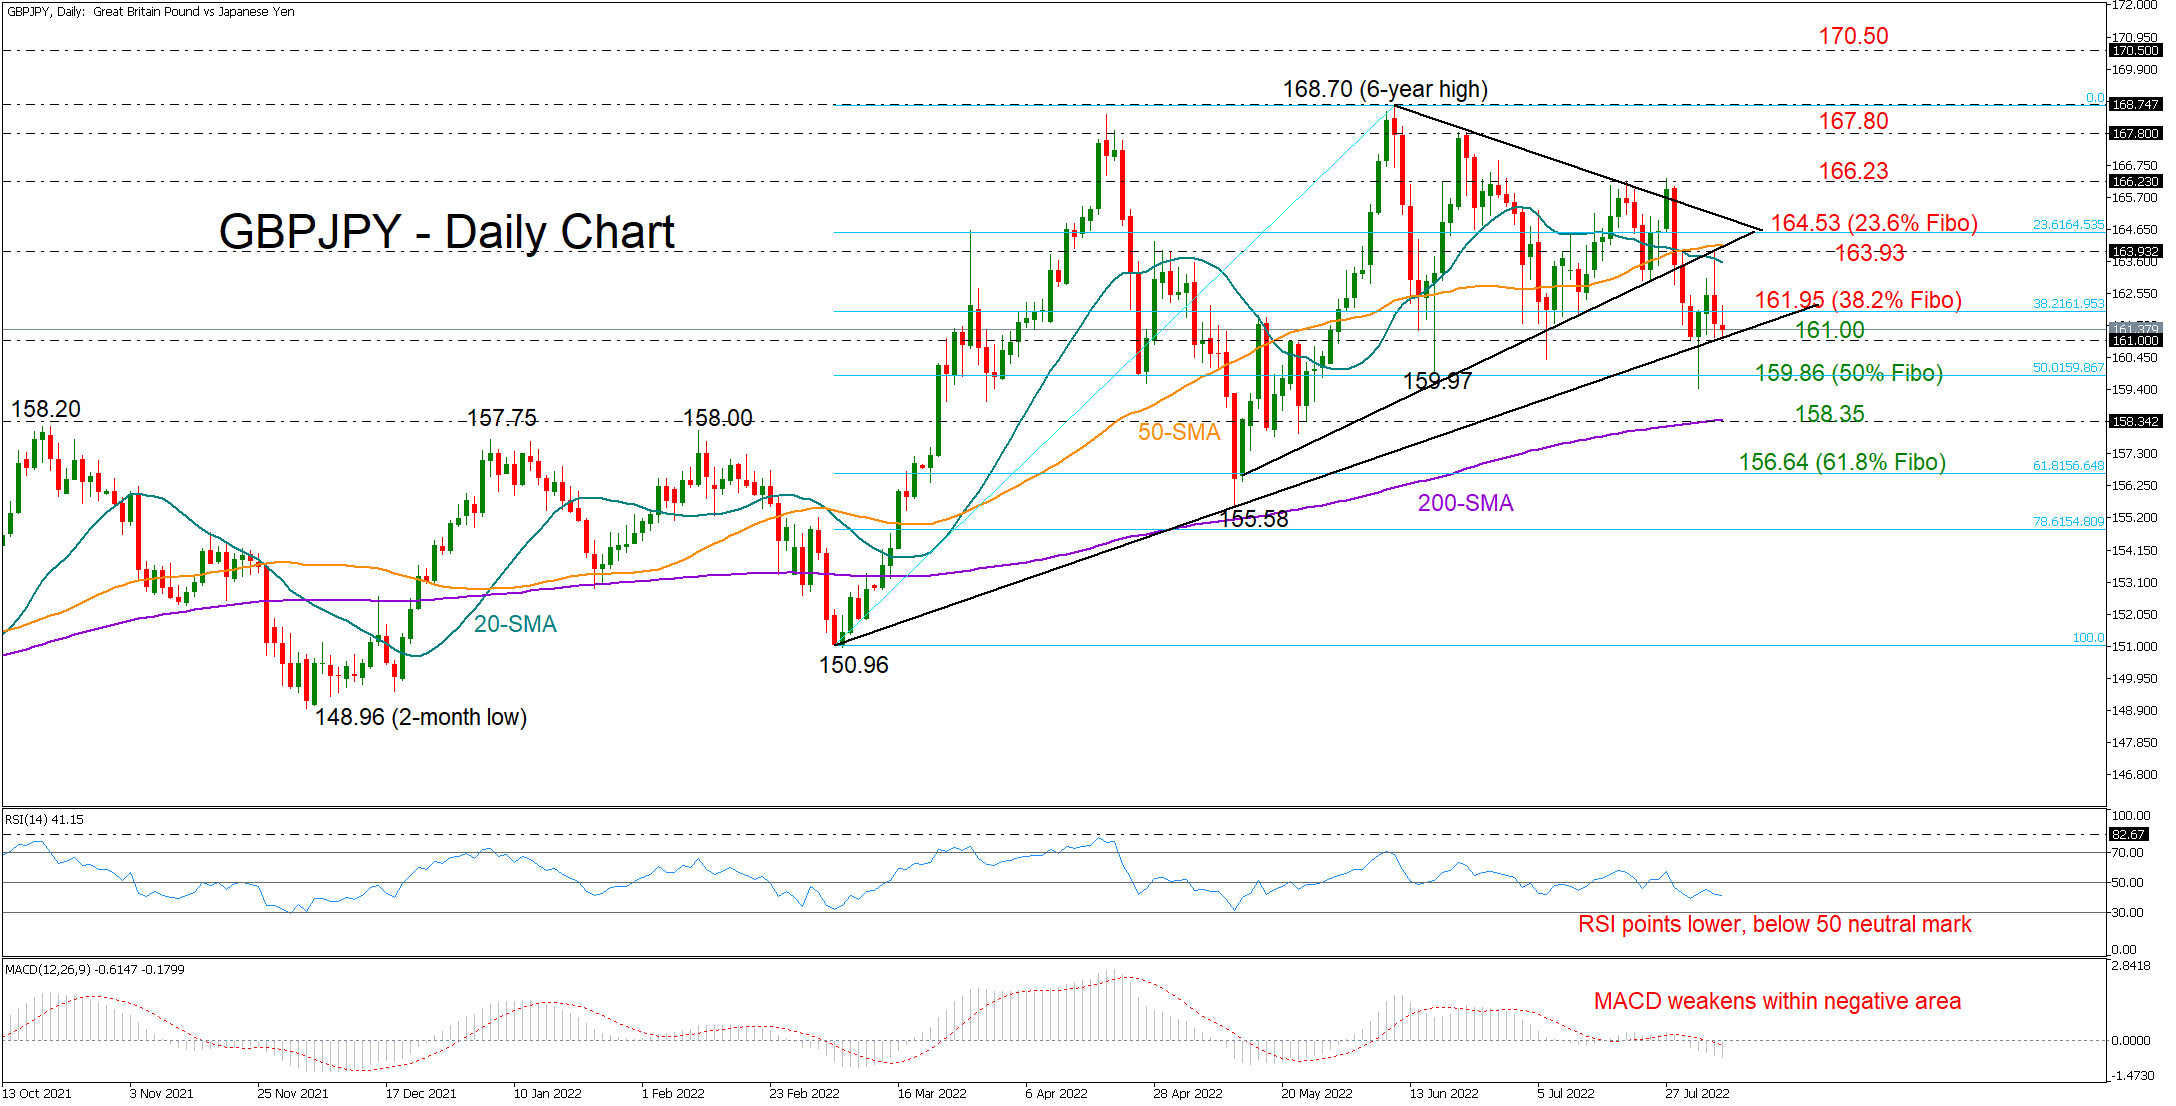
GBPJPY pulled back to test the support trendline at 161.00, which connects the lows from spring, after a failed attempt to pierce its 20- and 50-day simple moving averages (SMAs) around 164.00 on Thursday.
From a technical perspective, sellers seem to have the upper hand as the MACD keeps decelerating within the negative zone and the RSI is reversing southwards, putting in some distance below its 50 neutral mark.
If the bears finally achieve a close below the ascending trendline, the 159.86 area, which coincides with the 50% Fibonacci retracement of the 150.96 – 168.70 upleg, could come to the rescue, rejecting any declines towards the 200-day SMA at 158.35. Should the downfall sharpen below the latter, neutralizing the broad picture, the spotlight will turn to the 61.8% Fibonacci of 156.64.
On the upside, a durable move above the 38.2% Fibonacci of 161.95 may shift attention back to the 20- and 50-day SMAs currently at 163.55 and 164.00 respectively. The 23.6% Fibonacci and the key resistance trendline are also within a breathing distance at 164.53 and could deter any improvement towards the 166.23 border. Nevertheless, if upside pressures persist, traders will next target the 167.80 – 168.70 ceiling.
In brief, GBPJPY continues to face negative risks despite finding a strong footing near an upward-sloping trendline. A close below 161.00 could set the stage for the next bearish round.
BoE Pill: We need flexibility on rates according to cirumstances
BoE Chief Economist Huw Pill told Bloomberg Television, the BoE is not "behind the curve" on tightening.
But he added that investors should not assume there will be another 50bps rate hike in September. "Given the uncertainties we face, I think we need flexibility either to go further, or to stay where we are, and the pace at which we go further to be varied according to circumstances," he said.
Bitcoin Remains in Ascending Corridor
Bitcoin was down 3.5% on Thursday, ending at around $22,500, but almost fully recovered its losses on Friday morning. As a result, changes over the past 24 hours are minimal, with a 0.2% gain to 23,200, with an amplitude of around 4%. Ethereum was trading near $1660 versus $1650 at the same time yesterday.
Other leading altcoins added between 0.4% (XRP) and 2.6% (BNB). Total market capitalisation, according to CoinMarketCap, rose 0.4% overnight to $1.08 trillion. The cryptocurrency Fear & Greed Index rose 1 point to 31.
Bitcoin has been under pressure all Thursday, despite continued positive stock market momentum and a general increase in demand for risk. Such dynamics of the crypto market again show how far it is from the sentiment that pushed the price ahead in the past two years.
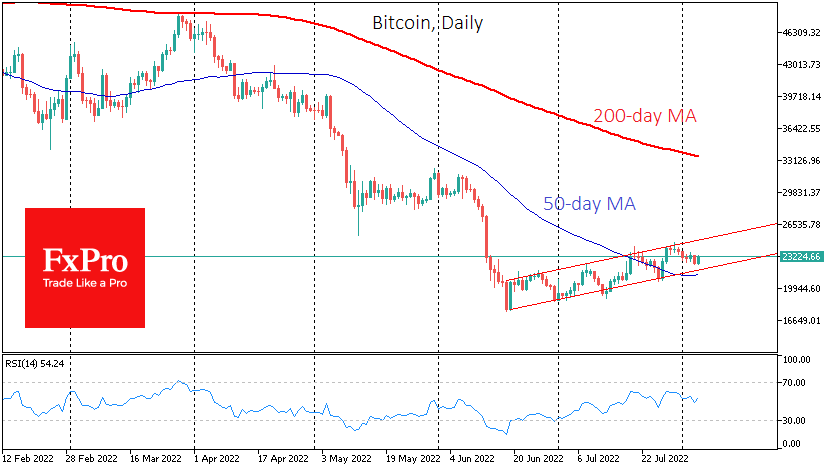
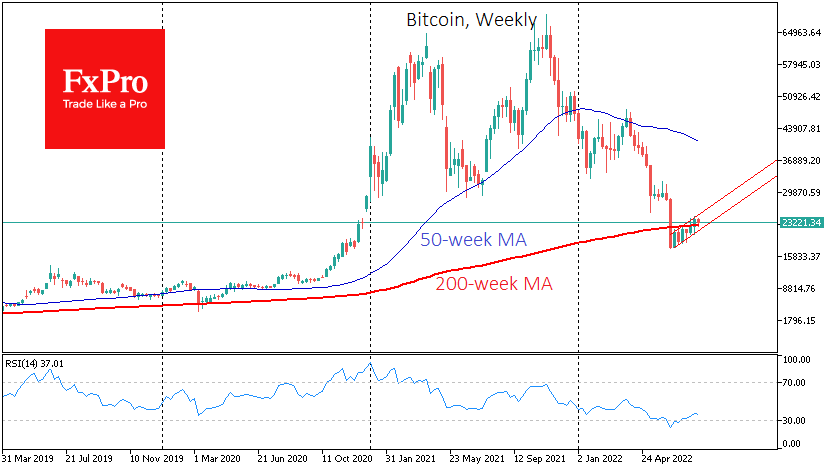
From another perspective, BTCUSD has reversed to the upside this morning just above the lower boundary of its ascending corridor, held for the last seven weeks and stayed above its 200-week moving average.
News background
Ark Invest calculates that BTC has fallen below the 200-WMA only seven times in history. After recovering above that line, the annual return on the asset has averaged around 240%.
Along with the uptrend, the difficulty of mining increased by 1.74% for the first time in two months.
Mastercard noted that it views cryptocurrencies as an asset class rather than a means of payment because of their volatility in price. Stablecoins and DH digital currencies have a better chance of occupying this niche.
FTX CEO Sam Bankman-Fried praised a bill introduced in the US Congress that would give the authority to regulate the crypto market – the Futures Trading Commission (CFTC).
The recent hack of the Project Nomad bridge, in which hackers managed to take out $190 million in assets, was the 13th hack in the industry since the beginning of the year. According to Chainalysis, the total amount of damage was $2bn. Blockchain security agency SlowMist believes that cryptocurrencies are safer than DeFi and firewalls.
According to Peckshield, hackers withdrew $4.8m from ZB, a decentralised crypto exchange that claimed to be the most secure in the world.
GBP/JPY Daily Outlook
Daily Pivots: (S1) 160.62; (P) 162.18; (R1) 163.24; More...
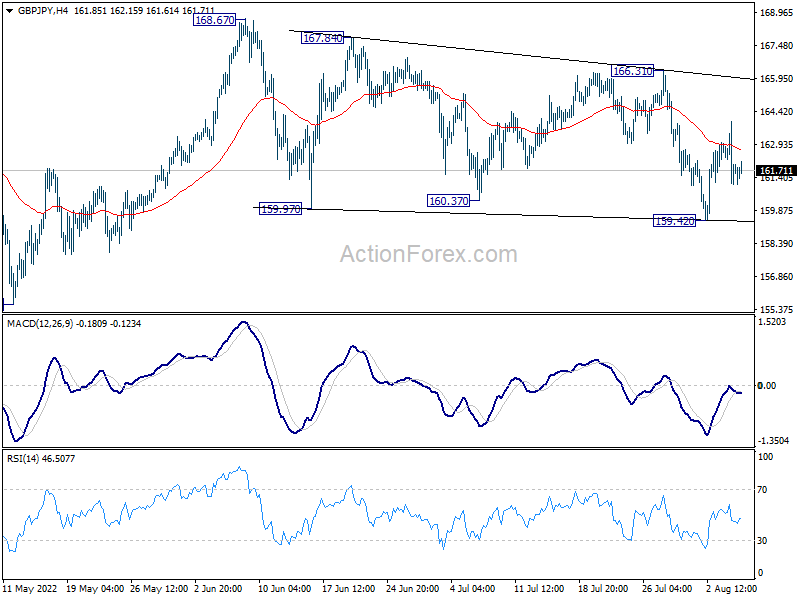
Intraday bias in GBP/JPY remains neutral as range trading continues. Consolidation from 168.67 could still extend further. Break of 166.31 resistance will be the first sign of up trend resumption. meanwhile, break of 159.42 will bring deeper fall towards 155.57 support next.
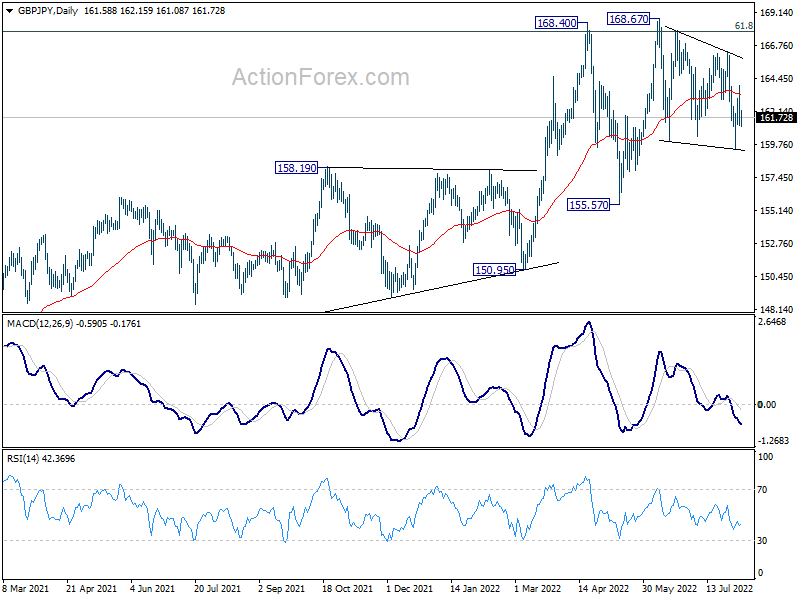
In the bigger picture, up trend from 123.94 (2020 low) is still in progress. Sustained break of 61.8% retracement of 195.86 (2015 high) to 122.75 (2016 low) at 167.93 will be a long term bullish signal, and could pave the way back to 195.86 high. This will now remain the favored case as long as 155.57 support holds, even in case of deep pull back.
EUR/JPY Daily Outlook
Daily Pivots: (S1) 135.61; (P) 136.27; (R1) 136.88; More....
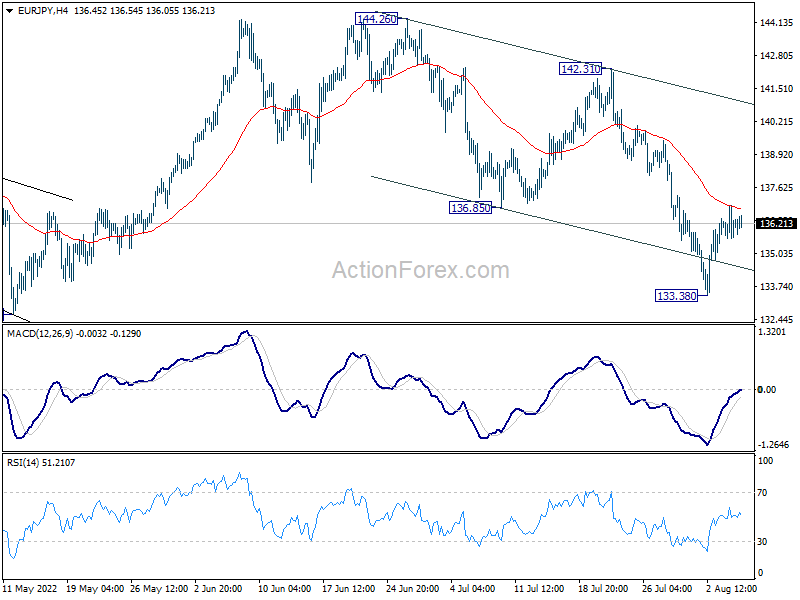
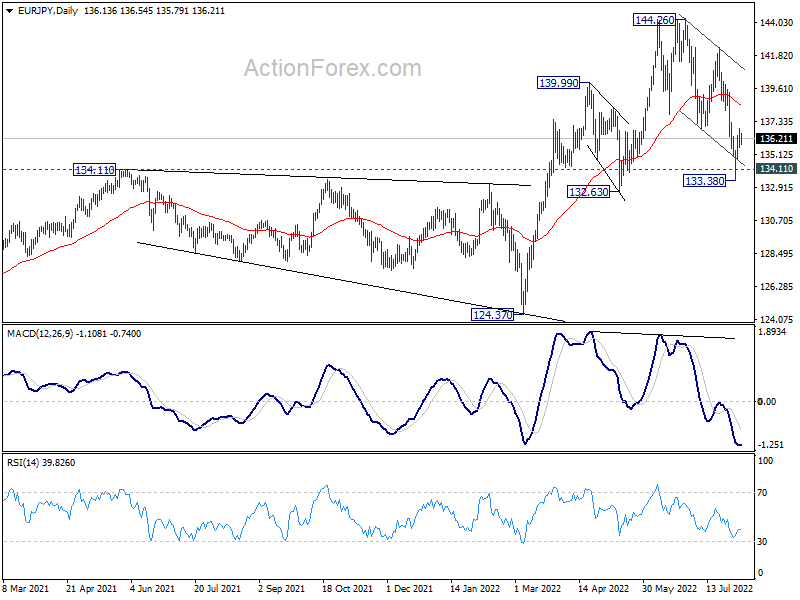
Intraday bias in EUR/JPY stays mildly on the upside, as rebound from 133.38 would continue higher. Sustained break of 55 day EMA (now at 138.54) will suggest that whole correction from 144.26 has completed. This will now remain the favored case as long as 133.38 support holds.
In the bigger picture, up trend from 114.42 (2020 low) is seen as the third leg of the pattern from 109.30 (2016 low). Further rally is in favor as long as 134.11 resistance turned support holds, even in case of deep pull back. Next target is 149.76 (2015 high). However, sustained break of 134.11 will be a sign of medium term bearish reversal and turn focus to 124.37 support for confirmation.
EUR/AUD Daily Outlook
Daily Pivots: (S1) 1.4609; (P) 1.4658; (R1) 1.4752; More...
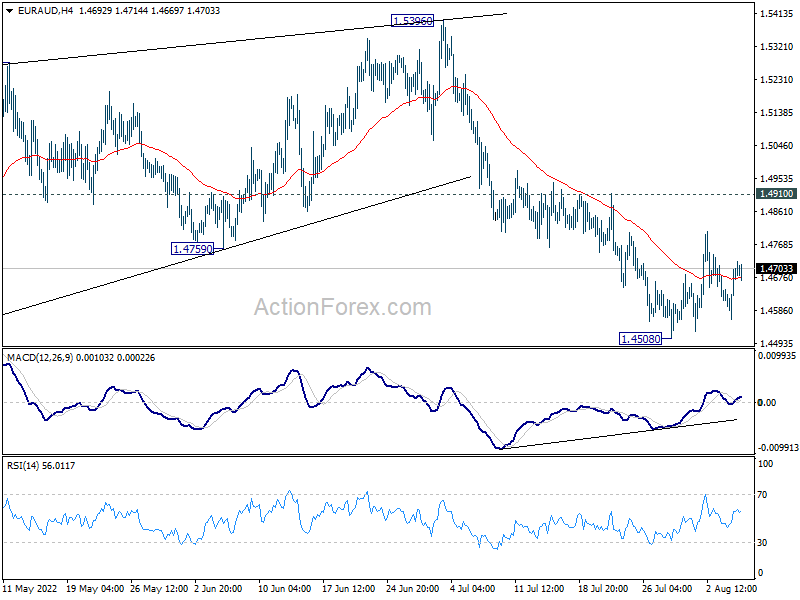
Intraday bias in EUR/AUD stays neutral at this point. While stronger recovery cannot be ruled out, upside should be limited below 1.4910 resistance to bring fall resumption. On the downside, break the 1.4508 will resume the decline from 1.5396 to retest 1.4318 low. However, firm break of 1.4910 will dampen this bearish view and bring stronger rally.
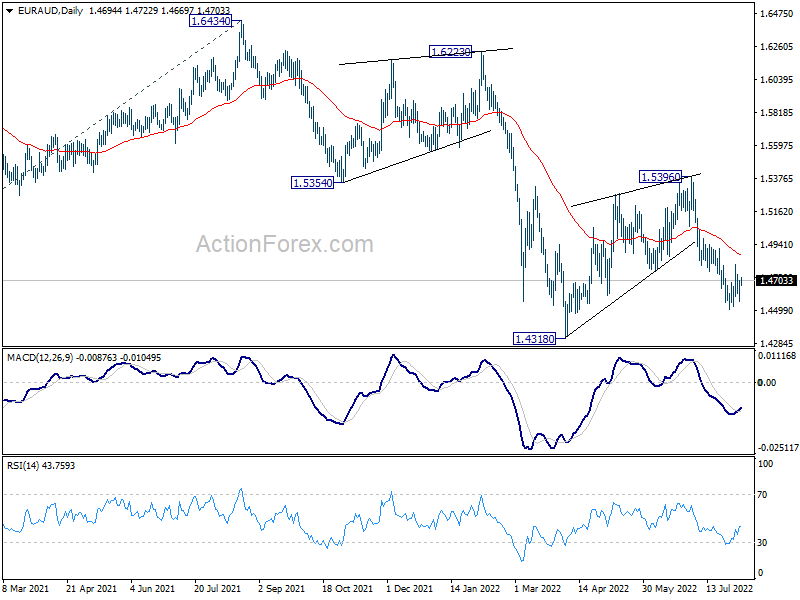
In the bigger picture, rejection by 1.5354 support turned resistance, as well as 55 week EMA (now at 1.5378), maintain medium term bearishness. That is, larger down trend from 1.9799 is not completed yet. Break of 1.4318 low will target 61.8% projection of 1.9799 to 1.5250 from 1.6434 at 1.3623, which is close to 1.3624 long term support (2017 low). This will remain the favored case now as long as 1.5396 resistance holds.
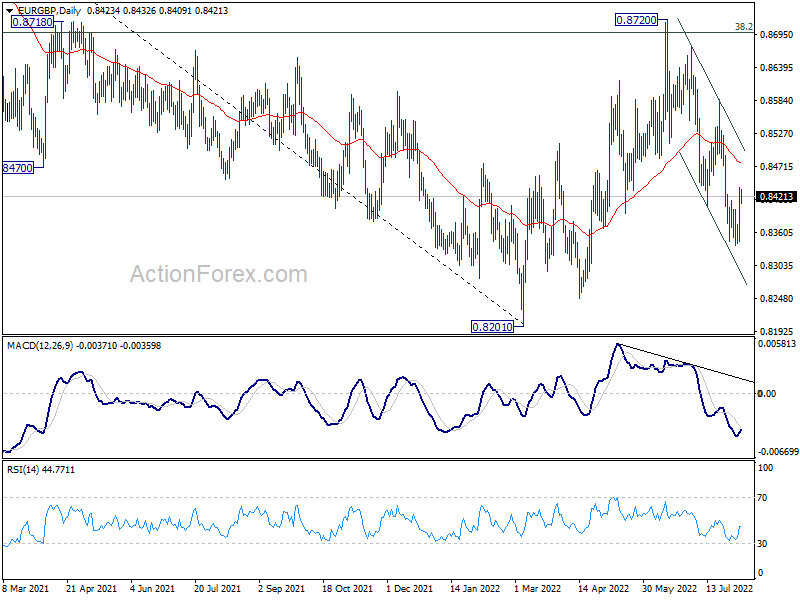
EUR/GBP Daily Outlook
Daily Pivots: (S1) 0.8370; (P) 0.8404; (R1) 0.8460; More...
Intraday bias in EUR/GBP is turned neutral again with break of 0.8414 minor resistance and some consolidation would be seen. But near term outlook will stay cautiously bearish as long as 0.8585 resistance holds. On the downside, break of 0.8338 will resume the fall from 0.8720 and target a test on 0.8201 low.
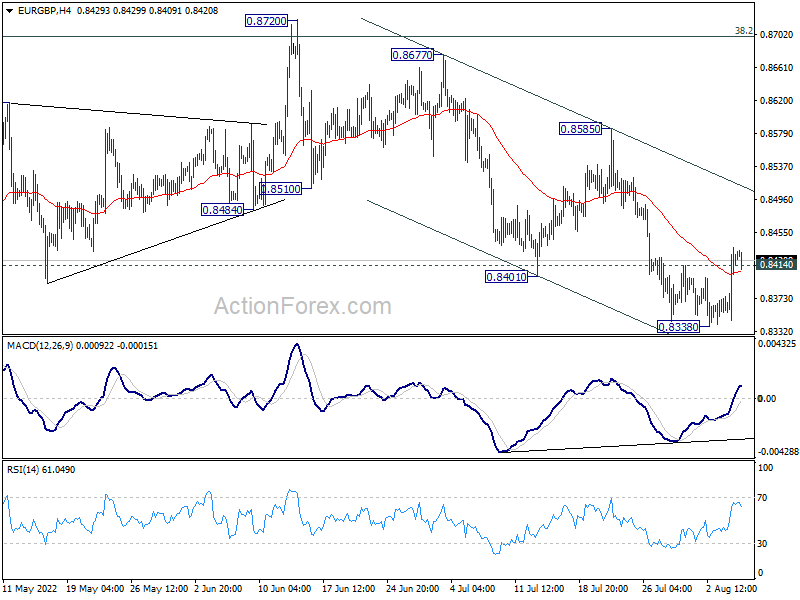
In the bigger picture, current development suggests rejection by 38.2% retracement of 0.9499 to 0.8201 at 0.8697. Medium term term bearishness is maintained. Break of 0.8201 will resume larger down trend from 0.9499 (2020 high). Nevertheless, sustained break of 0.8697 will affirm the case that rise from 0.8201 is a medium term up trend itself.