Sample Category Title
Eco Data 8/8/22
[php_everywhere instance="1"]
Forex and Cryptocurrencies Forecast
EUR/USD: Unexpected Positive News from the US
EUR/USD has been moving sideways in the 1.0100-1.0270 channel for almost three weeks. Timid attempts to break through the upper or lower border of the channel have ended in failure each time. Could it be the summer holiday season to blame? Most likely, the reason is the unexpected economic statistics from the US and the vague prospects that have caused the market confusion.
The US Manufacturing Business Activity Index (ISM) published on Monday, August 01 turned out unexpectedly to be higher than the forecast, 52.8 against 52.0. The index of business activity in the services sector from Markit, which became known on Wednesday, August 03, showed an increase to 47.3 against 47.0 points. The same indicator, but from the US official departments (ISM) also showed an increase to 56.7 points (55.3 a month ago, forecast 53.5). Does it turn out that not everything is so bad in the US economy, it has a serious margin of safety, even despite high energy prices and an aggressive rate hike by the Fed?
Recall that the FOMC (Federal Open Market Committee) meeting of the US Federal Reserve took place on July 27, at which the key interest rate was raised by another 75 basis points (bp). Fed Chairman Jerome Powell, speaking at the end of the meeting, tried to convince everyone that the regulator still retains a hawkish attitude. And that the Fed is ready to accelerate the pace of interest rate hikes if necessary. However, the markets did not believe Powell and reacted to the results of the FOMC meeting with a turn towards the stock market.
Some experts do not rule out that the peak of inflation in the US has already passed. The main driver of its growth was high energy prices as noted above. However, the Core Consumer Price Index, although it is at high levels, has already decreased by 0.6% since March.
The labor market is also doing well. Unemployment in the US has been holding at 3.6% since March, which is a very good indicator. And it became even less in July, 3.5%. And such an important indicator as NFP, the number of new jobs outside the US agricultural sector, which was published on Friday, August 5, with a forecast of 250K, actually reached 528K. And this despite the fact that it was 372K a month earlier.
Jerome Powell said that he did not believe in a recession, as the labor market and a number of sectors of the economy are quite strong. And that the risk of continued high inflation is more significant than the risk of a recession. However, if inflation goes down, and the country's GDP does not show convincing positive dynamics, the scale may tilt towards easing the Fed's monetary policy. It was previously predicted that the key rate could reach 3.4% as a result of monetary restriction, by the end of this year, and rise even higher, up to 3.8% by the end of 2023. The market is currently preparing for the fact that the FOMC may raise the rate not by 0.75%, but by only 0.50% in September, it will stop raising rates altogether in November, and it will return to the quantitative easing (QE) program altogether in 2023.
While the economic situation in the US looks better than expected, according to the latest data, it has definitely worsened in Europe. Retail sales in Germany fell to minus 8.8% on an annualized basis, while they showed an increase to +1.1% a month ago. On the whole, the picture in the Eurozone is just as gloomy: the same indicator fell from +0.4% to -3.7% (against the forecast of -1.7%). This is due to the fact that the population lacks an understanding of what awaits them in the near future. People are afraid of further price increases, primarily because of problems with the supply of energy from Russia. And the possibility of an escalation of the Russian-Ukrainian armed conflict into the EU does not inspire optimism. There is no need to talk about the fear of Russia's use of nuclear weapons.
After the publication of positive data from the US labor market on Friday, August 05, the dollar strengthened somewhat, and the EUR/USD pair closed the five-day period at 1.0180. Like a week ago, 45% of experts vote for the fact that it will still break through the lower border of the channel 1.0100-1.0270, 45% show it the way to the north and 10% - further to the east. As for the oscillators on D1, 25% side with the bears, 60% side with the bulls, and 15% have taken a neutral position. The signals are clearer among trend indicators: 90% look south and only 10% look north.
The nearest support for the EUR/USD pair is the 1.01500 zone, then 1.0100-1.0120, then, of course, there is the 1.0000 level. After it is broken, the bears will target the July 14 low at 0.9950, even lower is the strong 2002 support/resistance zone. 0.9900-0.9930. The next serious task for the bulls will be to break through the 1.0200 resistance, after which they need to rise to the 1.0250-1.0270 zone. The next target is a return to the 1.0400-1.0450 zone, followed by the 1.0520-1.0600 and 1.0650-1.0750 zones.
As for the forthcoming events, the publication of data on the US consumer market (CPI) on Wednesday, August 10 should be noted. This package will be supplemented on Thursday and Friday: August 11 - Producer Price Index (PPI) and August 12 - Consumer Confidence Index of the University of Michigan in the USA. As for the news from Europe, the value of the Harmonized Consumer Price Index in Germany will become known on August 10.
GBP/USD: Bank of England: No Sensation Happened
The main event of the week could have certainly been the meeting of the Bank of England (BOE) on Thursday August 04. It could have been, but it wasn't. Some investors had hoped that the regulator would take a desperate step and raise the rate by 150 bp at once. In this case, it would overtake the current dollar rate (2.50%), which would be a weighty argument in favor of strengthening the British currency. However, the sensation did not happen. The Bank of England raised the rate by 50 bp, bringing it to 1.75%, which had been previously taken into account by the market in quotes.
The minutes of the Monetary Policy Committee (MPC) meeting of the Bank of England turned out to be quite boring as well. If any of its 9 members wanted to raise the rate by 75 bp, it would be taken as a positive development for the pound. And vice versa: the desire to raise the rate by only 25 bp. would put additional pressure on the British currency. But, as is clear from the minutes, all 9 members of the Committee voted unanimously for raising the rate exactly by 50 bp.
The revised economic forecasts turned out to be quite gloomy, and BOE management's post-meeting statements were hazy dovish. According to the head of the Bank of England Andrew Bailey, the current rate hike by 50 bp does not mean that the bank will do the same at each subsequent meeting. "Interest rates will not go back to where they were before the financial crisis," said Andrew Bailey vaguely. "And we don't know what normal interest rates will be in the future." BOE chief economist Hugh Pill added to the haze saying that "the equilibrium level of interest rates is very uncertain."
As a result of the absence of any benchmarks, the GBP/USD pair, having fluctuated between the levels of 1.2064 and 1.2214, returned to the center of this range on Thursday, August 04. On Friday, on the news from the US labor market, it fell to a strong support of 1.2000, and finished at 1.2070.
According to a third of analysts, the past week did not bring anything good to the pound, and therefore the pair will continue its fall. The opposite point of view is also held by a third of the experts, another third remains neutral. The readings of the indicators on D1 are as follows. Among the trend indicators, the ratio is 90% to 10% in favor of the red ones. Among the oscillators, only 35% side with the bears, 25% indicate growth, 40% have taken a neutral position.
The nearest support is located at the level of 1.2000-1.2025, followed by the zone 1.1875-1.1925. Below is the level of 1.1800, the low of July 14 is 1.1759, then 1.1650, 1.1535 and the lows of March 2020. in the zone 1.1400-1.1450. As for the bulls, they will meet resistance in the zones and at the levels of 1.2100-1.2130, 1.2170-1.2215, 1.2245, 1.2280-1.2325 and 1.2400-1.2430.
In terms of macro news coming out of the UK, Friday 12 August could be marked next week. Data on the country's GDP and production in the UK manufacturing industry will be published on this day.
USD/JPY: High Volatility, Neutral Outlook
Looking at the chart, the 134.60-137.00 range is quite attractive for both bulls and bears on the USD/JPY pair. It traded in it from mid-June to early July, and it returned to it at the end of last week. Having started on Monday August 01 from the level of 133.31, the pair reached the local bottom at the level of 130.37 the next day. This was followed by a reversal and the dollar began to actively win back losses. As a result, the last chord sounded at a height of 135.00.
As for the prospects of the Japanese currency, the experts' forecast looks quite neutral, as in the cases of previous pairs. 45% of them are waiting for a new breakthrough of the pair to the north, another 45% hope for a continuation of the downtrend, the remaining 10% talk about a side corridor. The picture is somewhat different in the readings of indicators on D1 and is rather multidirectional. Trend indicators have a ratio of 85% to 15% in favor of green ones. Oscillators have the opposite: 60% look to the north, 40% to the east, while the number of supporters of the downtrend is 0%.
The values of possible slippage and ranges of support/resistance zones have sharply increased due to the ultra-high volatility of the pair. Supports are located at the levels and in the zones 134.75, 134.25, 132.60-133.15, 131.50, 130.40, 128.60 and 126.35-127.00. Resistances are 136.35-137.00, 137.45, 137.90-138.40, 138.50-139.00, followed by the July 14 high of 139.38 and round bull targets of 140.00 and 142.00.
No major events regarding the Japanese economy are expected this week. The only thing to keep in mind is the public holiday on Thursday August 11, when Japan celebrates Mountain Day. This is the youngest public holiday; it was established in 2014 at the initiative of environmental and tourism organizations in order to support the citizens' love for the nature of their country and give the Japanese "the opportunity to get to know the mountains and feel the grace emanating from them."
CRYPTOCURRENCIES: Influencers Talk about a Very Long Crypto Spring
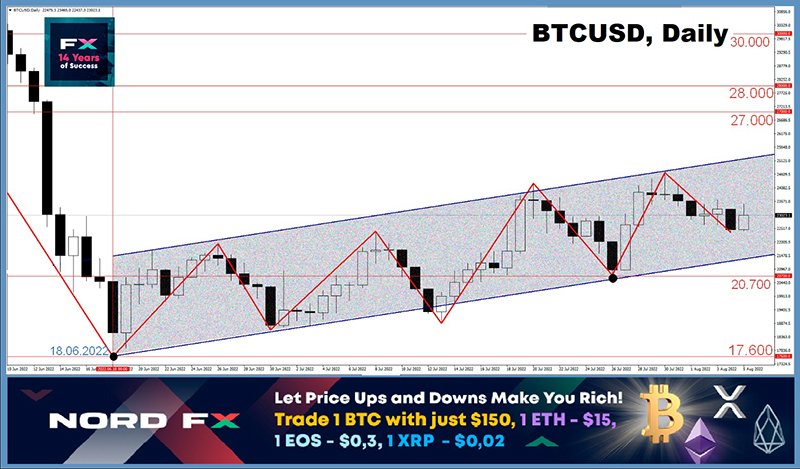
The price of bitcoin fell to $17,597 on June 18, in line with December 2020 levels and almost 75% below its all-time high of $68,918. The BTC/USD pair slowly crept up from that moment on, demonstrating a series of rising lows and highs over 7 weeks. Moreover, the volatility of the pair gradually increased: if it was about $3,150 at the beginning, it exceeded $4,000 by the end of July.
Disputes have not subsided about what happened on June 18 over the past month and a half: did bitcoin find the bottom? Or is it just the middle of the crypto-winter, and the real frosts are yet to come?
At the time of writing, Friday evening, August 05, the total capitalization of the crypto market is $1.089 trillion ($1.098 trillion a week ago), and the Crypto Fear & Greed Index is still in the fear zone, at a level of 31 points (39 a week ago). The BTC/USD pair is trading in the $22,900 zone.
According to Arcane Research analysts, if bitcoin holds the $20,700 level, the price will soon be in the $27,000-$28,000 range. But "if bitcoin falls below $20,700, it will mark a falling low. This is a bearish signal in the context of technical analysis." Arcane Research emphasized that much depends on the dynamics of the US stock market, with which the price of bitcoin is closely correlated. The dynamics of the Fed's key rate also plays an important role. "Rising interest rates increase the cost of capital and thus cause stock prices to fall. Tech stocks are declining the most. As the degree of institutionalization has increased, bitcoin has become closely associated with traditional financial markets," the researchers explained. According to them, if the stock market continues to fall, the downtrend of digital gold will continue. (Note that the S&P500 is currently trading around the important support/resistance zone of 4.100-4.150. But according to Goldman Sachs, the US stock market is headed for another big sell-off.)
Glassnode is also unsure about the continuation of bitcoin's recovery momentum. The rise in prices of BTC and Ethereum in recent days has not been accompanied by a fundamental improvement in the readings of on-chain indicators. And this does not give confidence in a fundamental change in the market situation, the company's analysts believe.
The number of active bitcoin addresses remains within the downtrend channel. With the exception of brief bursts during periods of capitulation, network activity remains subdued. This indicates a small influx of new demand. Similar trends are observed in the Ethereum blockchain. Despite the recent powerful price movement, the network load in terms of the number of transactions has been systematically decreasing since May 2021 to the lowest levels since the summer of 2020.
There has been a surge in activity in recent weeks, which analysts have associated with the consolidation of coins in wallets. They explained that they would change their mind if this trend proved sustainable. Glassnode experts had previously warned that it might take additional time to form a solid foundation. This is evidenced by long-term indicators such as URPD. To increase the chances of a market reversal, it is important to see the transition of speculative coins into the category of "held by long-term investors" (in other words, the "age" of coins from the moment of purchase must exceed 155 days).
Bank of America estimated the volume of withdrawn bitcoins from cryptocurrency platforms to cold wallets at ~$508 million, Ethereum at ~$381 million (data from July 2 to August 1). The first asset has risen in price by 19% over this period, the latter - by 56%. However, the conclusions of the bank's specialists look more optimistic than those of their colleagues from Glassnode. So, in their opinion, the increase in the outflow of cryptocurrencies from exchanges and the growth in net inflows into stablecoins signal a bullish market momentum. At the same time, Bank of America noted the "easing of pressure from sellers" and the transition of the initiative to buyers of digital assets. Experts also pointed to the sustainability of the trend, even despite the fact that the Fed raised key rates by 0.75% on July 27.
Trader and investor Bob Loukas, like many other members of the crypto community, agrees that halvings are driving market trends. The next one is expected in 2024 at block number 840,000. And after bitcoin hits a new all-time high, the digital asset market, according to Bob Lucas, may plunge into a "real crypto winter" in 2026.
According to his model, bitcoin market movements can be measured in cycles of 16 years, consisting of four micro cycles of 4 years each. In this case, the cycles must be counted from one local low to another. "Although it's hard to believe, in theory, bitcoin's 2026 lows could form below the 2022 lows," the investor said.
Mark Yusko, managing partner at Morgan Creek Digital, agrees with the narrative that the main cryptocurrency goes through speculative cycles. In his opinion, BTC is now in the "spring" part of the cycle and forms the basis for the next "summer" bull run, which should occur shortly before the 2024 halving. "In my opinion, the crypto spring has begun," Yusko writes. "If we look at the last two cycles, we will see the same number of days in the cycle where spring began, and winter ended. The crypto spring can last for months, and we don't need a bull market right now. When we get to the crypto summer, we will see the next bull run and it should happen in anticipation of the next halving in 2024."
According to Morgan Creek Digital CEO, the current structure of the bitcoin market points to the process of reaching the bottom. "I am not ready to say unequivocally so far whether the bottom has been reached," the investor said. "But if you look back, you can see that bitcoin has made several higher lows and highs. […] This is a pretty good bullish trend, and a crypto spring is possible."
Mark Yusko also believes that the current price of the first cryptocurrency is unfair. In his opinion, despite the forecasts of experts about a possible fall below $18,000, the "fair value" of the coin should be about $30,000 at the moment, and it could soar to $250,000 by 2026.
Anthony Scaramucci, founder and managing partner of SkyBridge Capital, like Mark Yusko, thinks that after the collapse caused by the bankruptcy of Three Arrows, Celsius and Voyager, the worst of the "bearish" moments for the crypto sector is over. And he also points to 2026, warning that the term of investments in digital assets should be at least 4 or 5 years. As for the "fair value" of bitcoin, it, in his opinion, should now be in the region of $40,000.
Another top manager, Pantera Capital's CEO, Dan Morehead, shares a similar opinion. Like his colleagues, he believes that the digital asset market has almost bottomed out. There are still companies that are in the process of liquidation in bankruptcy court. However, the largest defaults have already occurred in May and June, when the pressure on the industry reached its peak. "I think we are really close to the end of the market crisis. The market has been falling for eight months now. We observed the most severe manifestations of the crisis in November, May and June. It seems that we have seen everything that we should have," said the CEO of Pantera Capital.
Summary 8/8 – 8/12
Monday, Aug 9, 2022
[php_everywhere instance="1"]
Tuesday, Aug 9, 2022
[php_everywhere instance="2"]
Wednesday, Aug 10, 2022
[php_everywhere instance="3"]
Thursday, Aug 11, 2022
[php_everywhere instance="4"]
Friday, Aug 12, 2022
[php_everywhere instance="5"]
EUR/USD Weekly Outlook
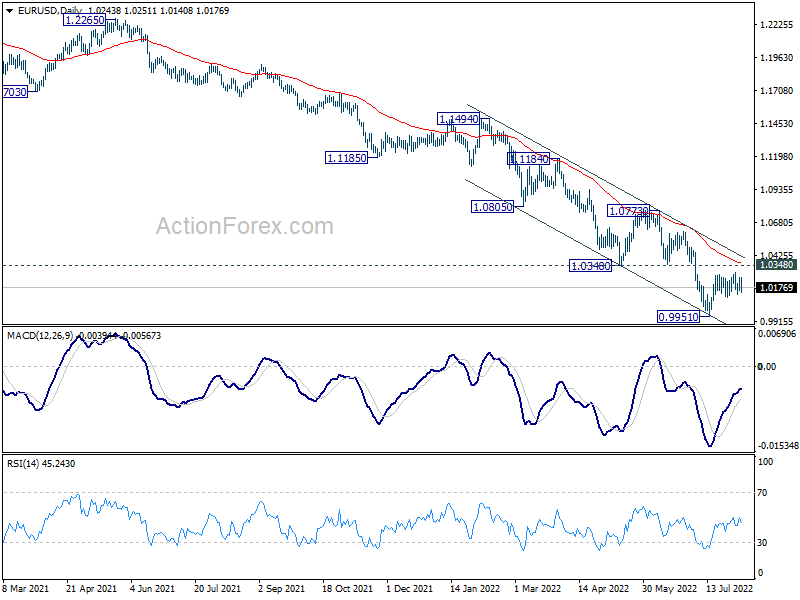
EUR/USD edged higher last week but settled back into established range. Initial bias stays neutral this week first. On the downside, break of 1.0095 minor support will argue that larger down trend is ready to resume. Intraday bias will be back to the downside for retesting 0.9951 low first. For now, outlook will stay bearish as long as 1.0348 support turned resistance holds, even in case of another rise.
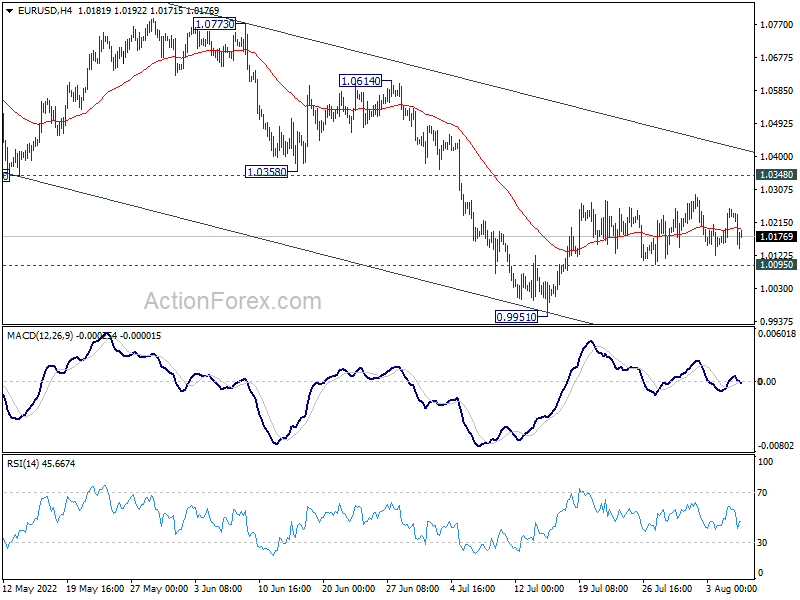
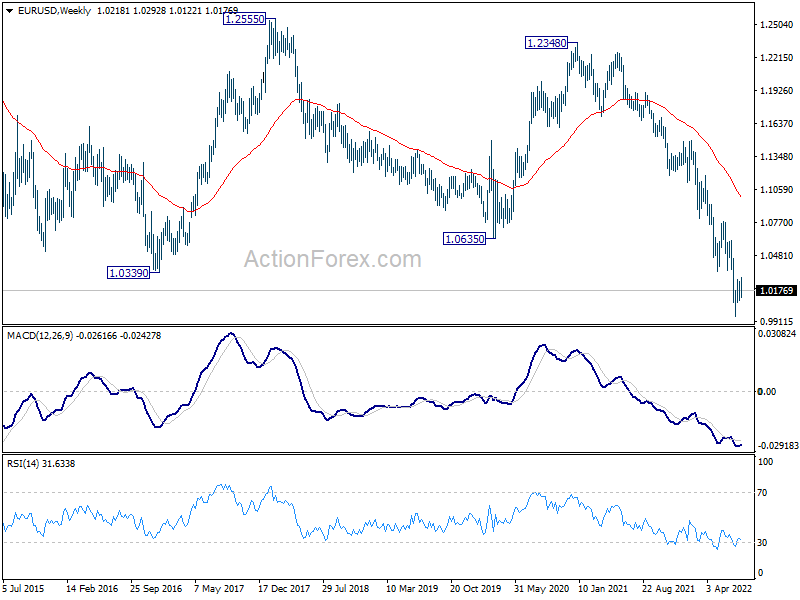
In the bigger picture, down trend from 1.6039 (2008 high) is still in progress. Next target is 100% projection of 1.3993 to 1.0339 from 1.2348 at 0.8694. In any case, outlook will stay bearish as long as 1.0773 resistance holds, in case of strong rebound.
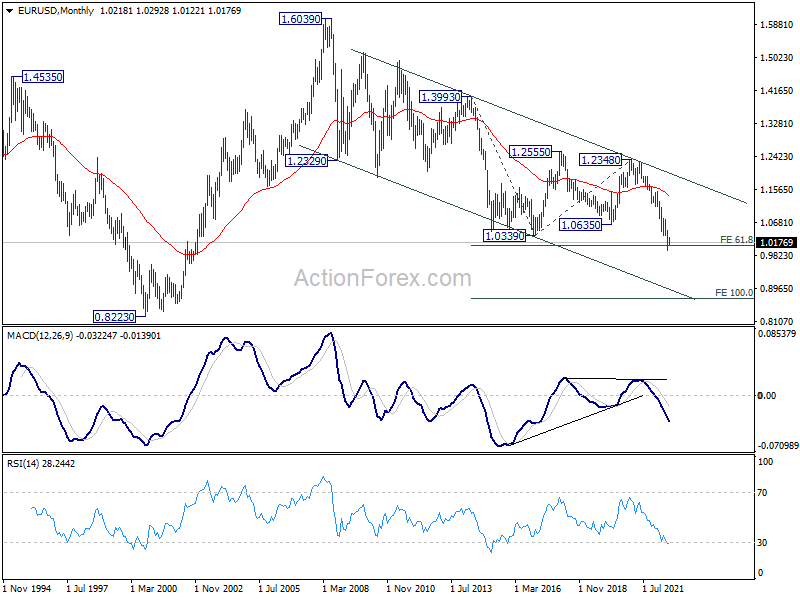
In the long term picture, long term down trend from 1.6039 (2008 high) resuming. Sustained break of 61.8% projection of 1.3993 to 1.0339 from 1.2348 at 1.0090 will pave the way to 100% projection at 0.8694.
USD/JPY Weekly Outlook
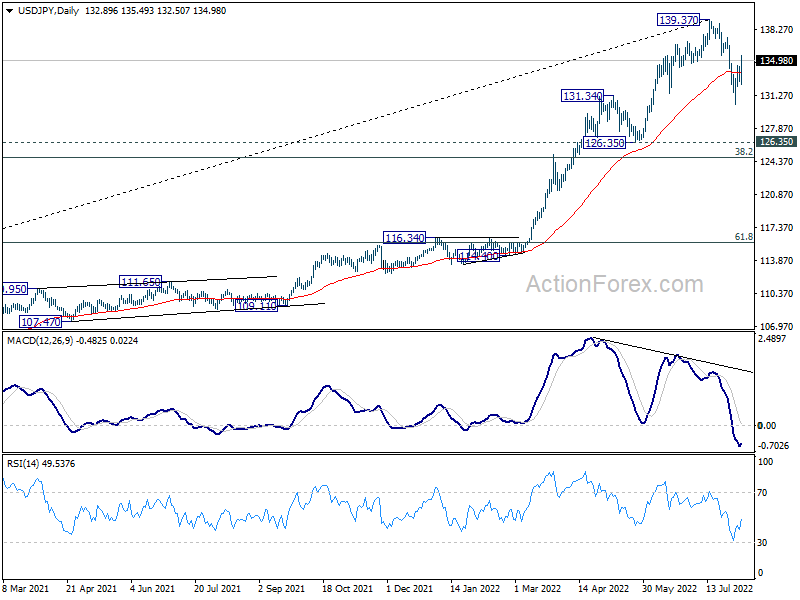
USD/JPY's correction from 139.37 extended to as low as 130.38 last week but rebounded strongly since then. Initial bias is mildly on the upside this week for retesting 139.37 high. Upside should be limited there to bring another fall, as the third leg of the consolidation pattern from 139.37. On the downside, below 132.50 minor support will resume the fall from 139.37 towards 126.35 structural support.
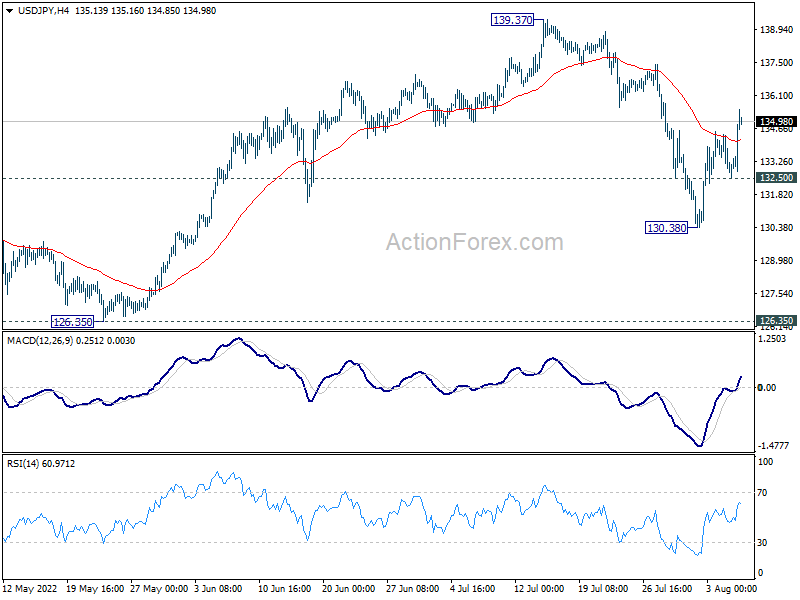
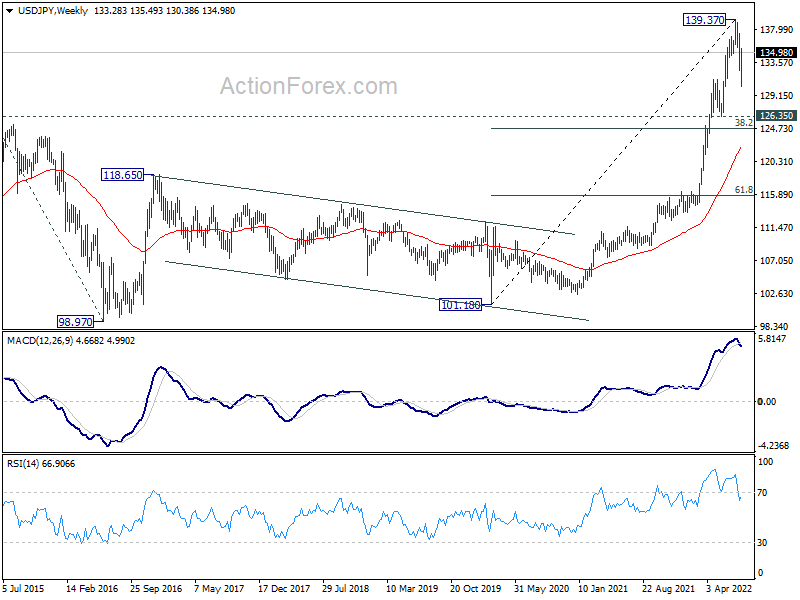
In the bigger picture, fall from 139.37 medium term top is seen as correcting whole up trend from 101.18 (2020 low). While deeper decline cannot be ruled out, outlook will stays bullish as long as 55 week EMA (now at 121.84) holds. Long term up trend is expected to resume through 139.37 at a later stage, after the correction finishes.
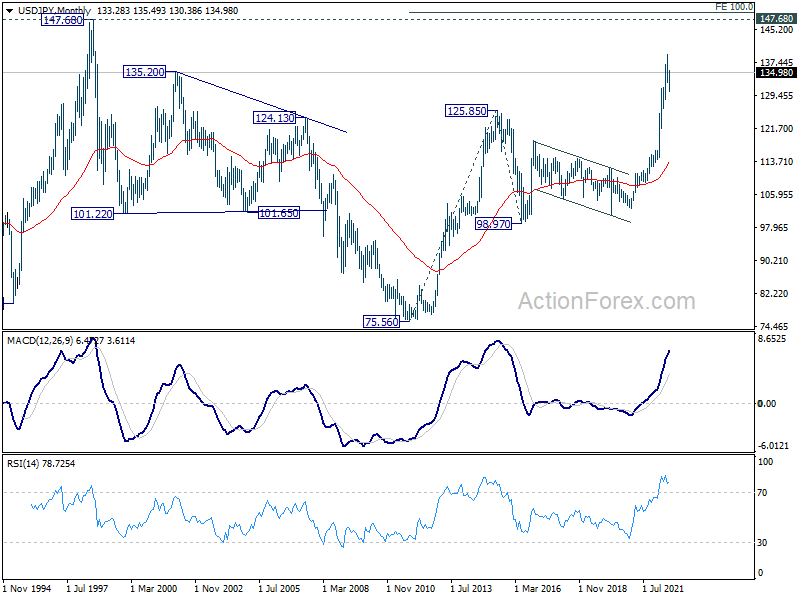
In the long term picture, rise from 101.18 is seen as part of the up trend from 75.56 (2011 low). Further rally is expected to 100% projection of 75.56 (2011 low) to 125.85 (2015 high) from 98.97 at 149.26, which is close to 147.68 (1998 high). This will remain the favored case as long as 55 week EMA (now at 122.31) holds.
GBP/USD Weekly Outlook
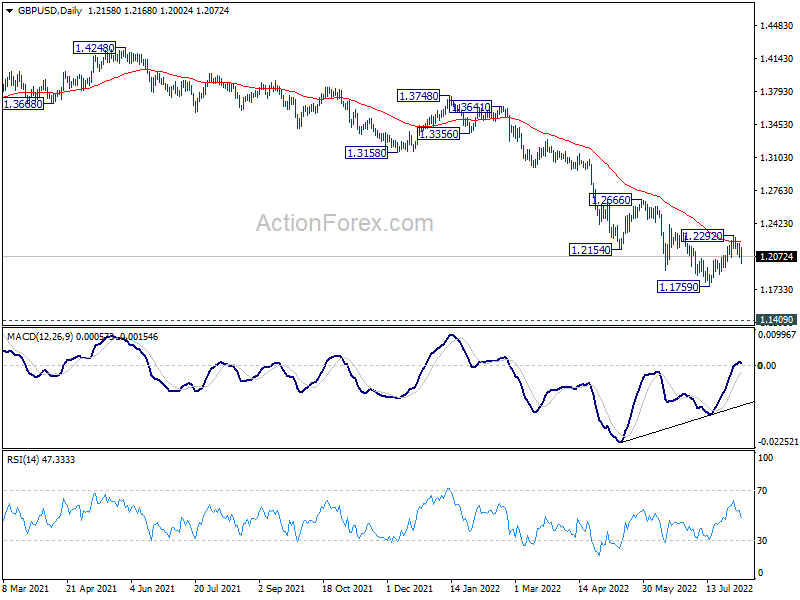
Despite edging higher to 1.2292 last week, subsequent fall in GBP/USD suggests that rebound from 1.1759 has completed, after hitting 55 day EMA. Initial bias is mildly on the downside for retesting 1.1759 low. On the upside, break of 1.2292 will resume the rebound towards 1.2405 resistance instead.
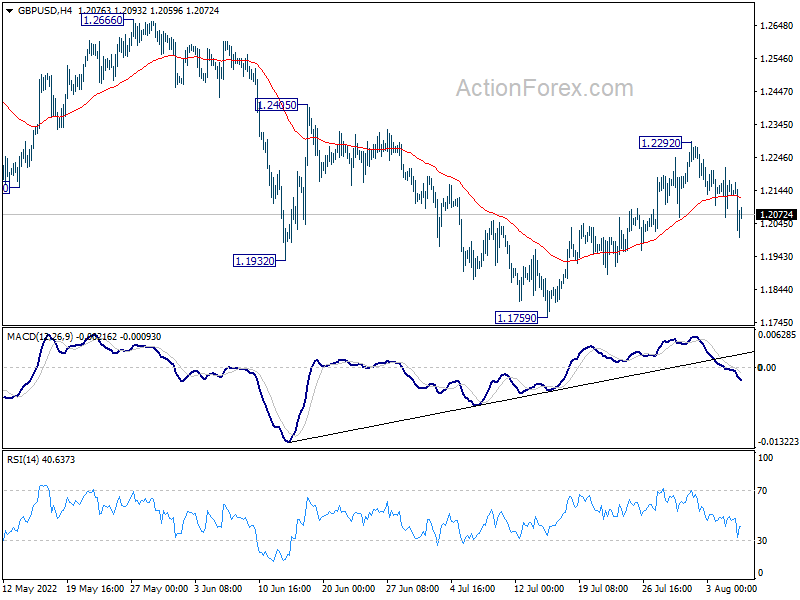
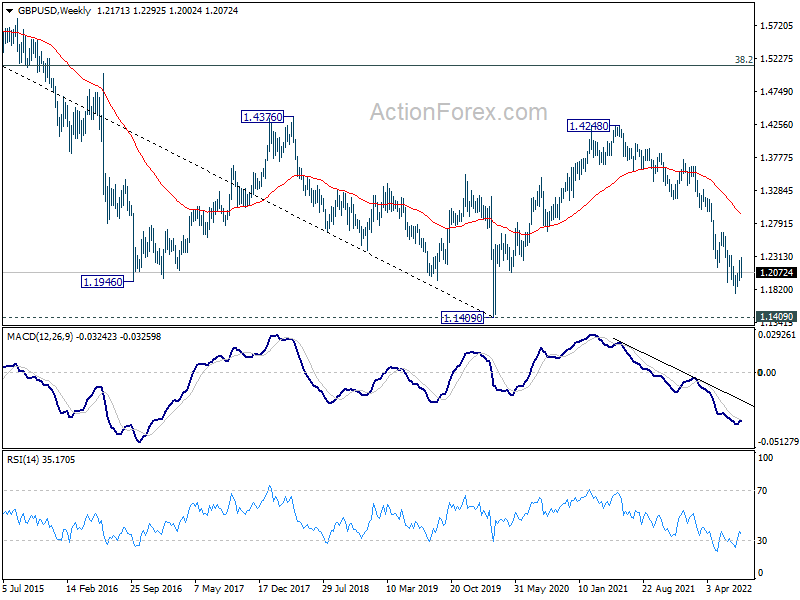
In the bigger picture, fall from 1.4248 (2018 high) could be a leg inside the pattern from 1.1409 (2020 low), or resuming the longer term down trend. Deeper decline is expected as long as 1.2666 resistance holds. Next target is 1.1409 low. However, firm break of 1.2666 will bring stronger rise back to 55 week EMA (now at 1.2925).
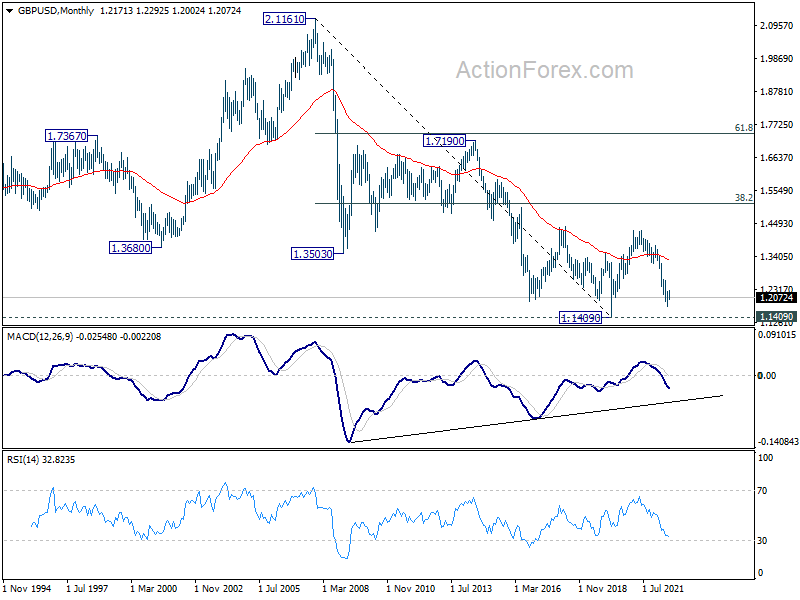
In the longer term picture, rebound from 1.1409 long term bottom should have completed at 1.4248 already, well ahead of 38.2% retracement of 2.1161 to 1.1409 at 1.5134. The development argues that price actions from 1.1409 are developing into a corrective pattern only. That is, long term bearishness is retained for resuming the down trend from 2.1161 (2007 high) at a later stage.
USD/CHF Weekly Outlook
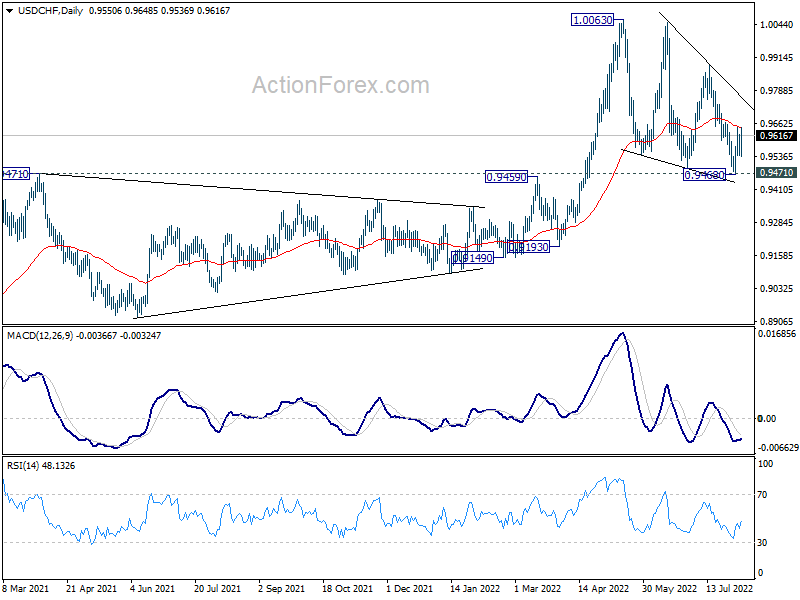
USD/CHF edged lower to 0.9468 last week but recovered strongly after drawing support from 0.9471. As a temporary top was formed at 0.9650, initial bias is neutral this week first. On the upside, break of 0.9650, and sustained trading above 55 day EMA (now at 0.9647) will raise the chance that corrective pattern from 1.0063 has completed. Further rally should then be seen to 0.9884 resistance next. However, decisive break of 0.9471 support will carry larger bearish implication.
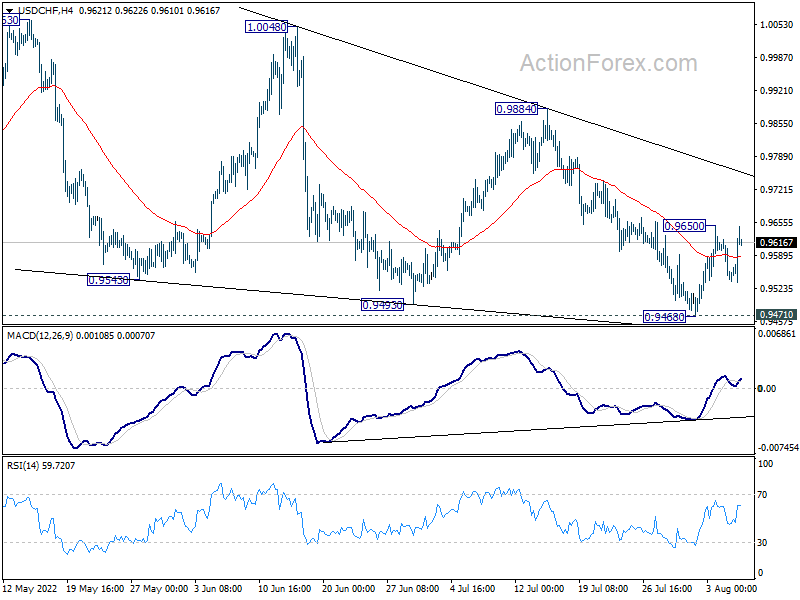
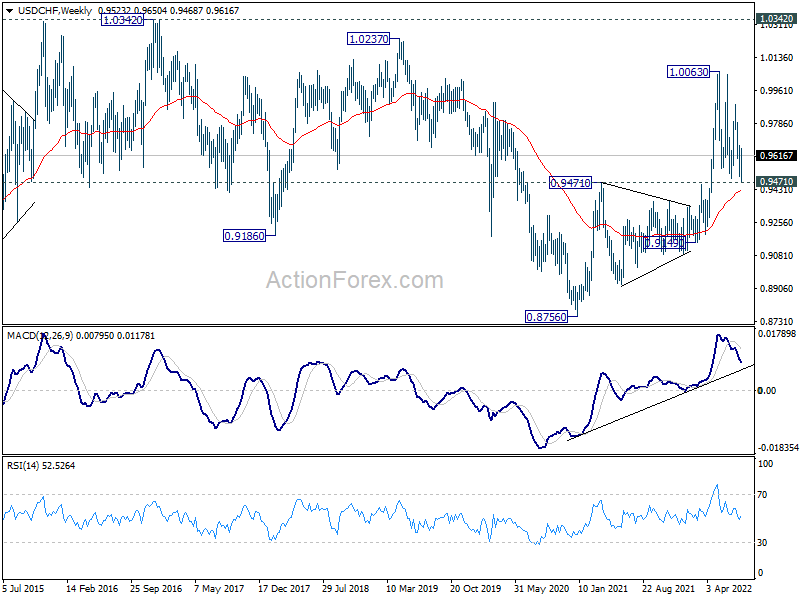
In the bigger picture, medium term up trend from 0.8756 (2021 low) is still in progress. On resumption, next target is 1.0342 (2016 high). Sustained break there will resume long term up trend from 0.7065 (2011 low). This will remain the favored case as long as 0.9471 resistance turned support holds. However, firm break of 0.9471 will raise the chance that such up trend is over.
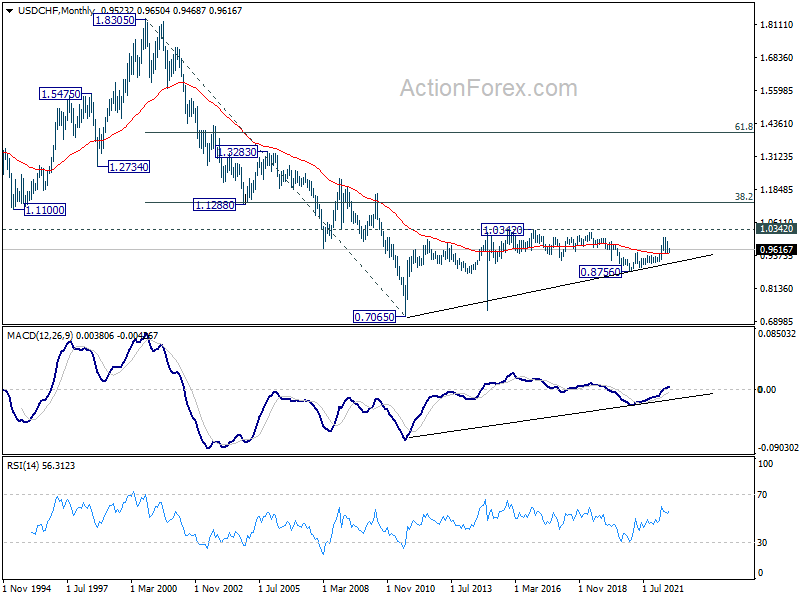
In the long term picture, current development argues that the correction from 1.0342 (2016 high) has completed at 0.8756 (2020 low) already. Rise from 0.7065 (2011 low) might be ready to resume. Firm break of 1.0342 will confirm and target 38.2% retracement of 1.8305 (2000 high) to 0.7065 at 1.1359. However, sustained break of 0.9471 resistance turned support will argue that long term sideway trading from 1.0342 is still extending.
AUD/USD Weekly Outlook
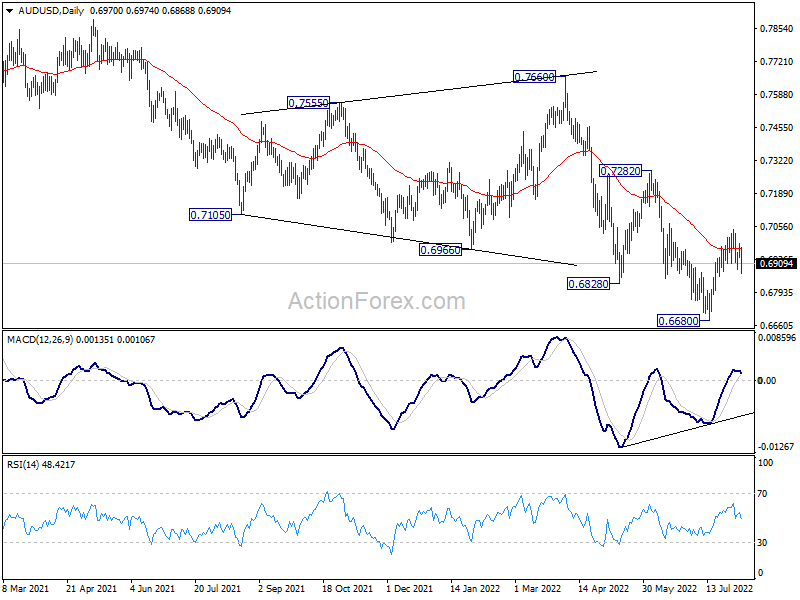
AUD/USD edged higher to 0.7045 last week but retreated since then. Initial bias is neutral this week first. On the upside, break of 0.7045 will resume the rebound from 0.6680 to 0.7282 key resistance next. On the downside, however, break of 0.6858 minor support will argue that the rebound is over. Intraday bias will then be back on the downside for retesting 0.6680 low.
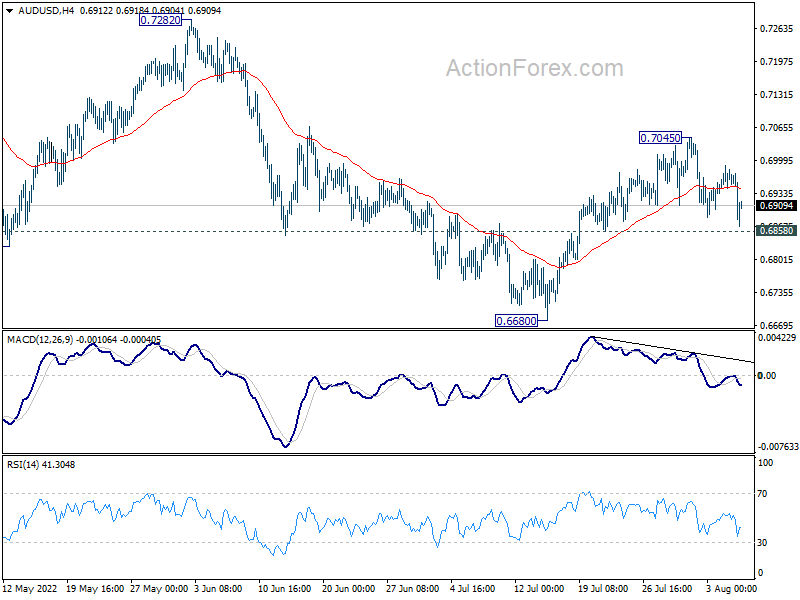
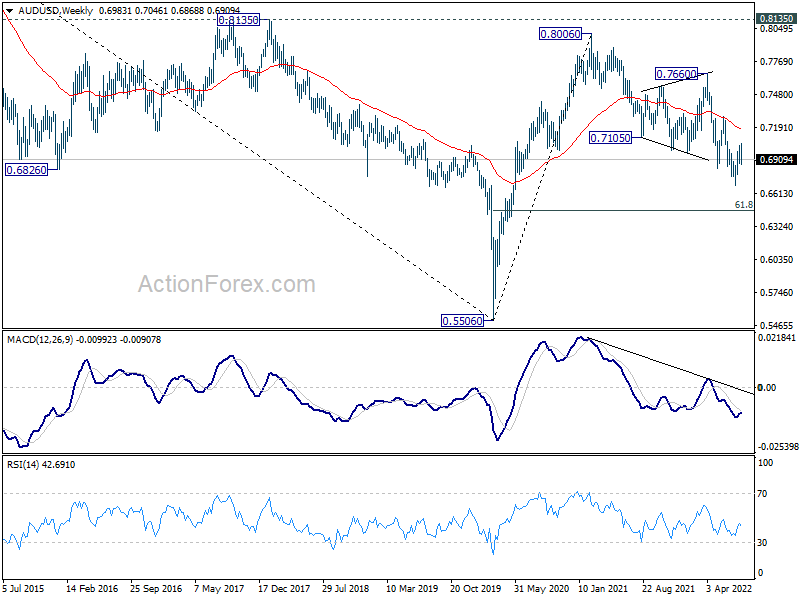
In the bigger picture, price actions from 0.8006 (2021 high) is seen more as a corrective pattern to rise from 0.5506 (2020 low). Or it could be a bearish impulsive move. In either case, outlook will remain bearish as long as 0.7282 resistance holds. Next target is 61.8% retracement of 0.5506 to 0.8006 at 0.6461.
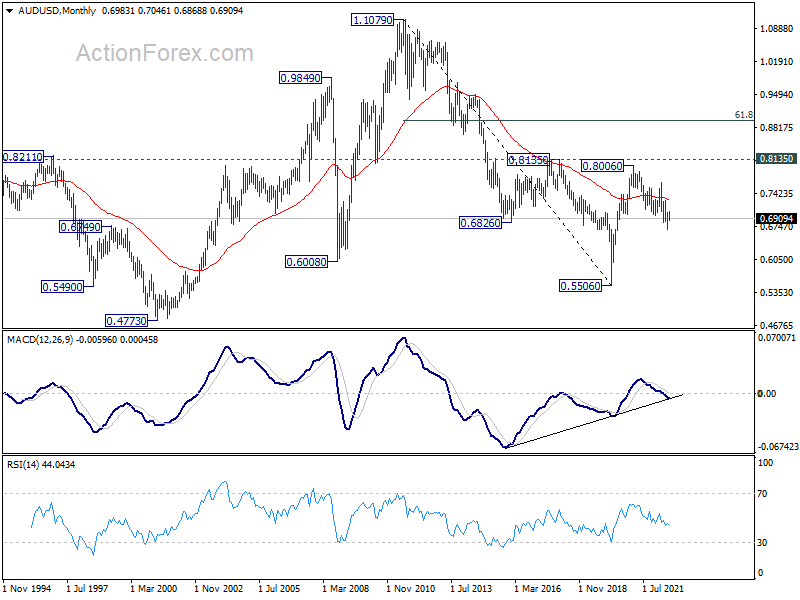
In the long term picture, rejection by 0.8135 resistance suggests that the long term down trend from 1.1079 (2011 high) is not ready to reverse. Yet, the structure of the fall from 0.8006 still argues that it's a corrective move. Hence, break of 0.5506 low is not envisaged for now. The long term outlook stays neutral first, and will be reassessed later after the fall from 0.8006 completes.
USD/CAD Weekly Outlook
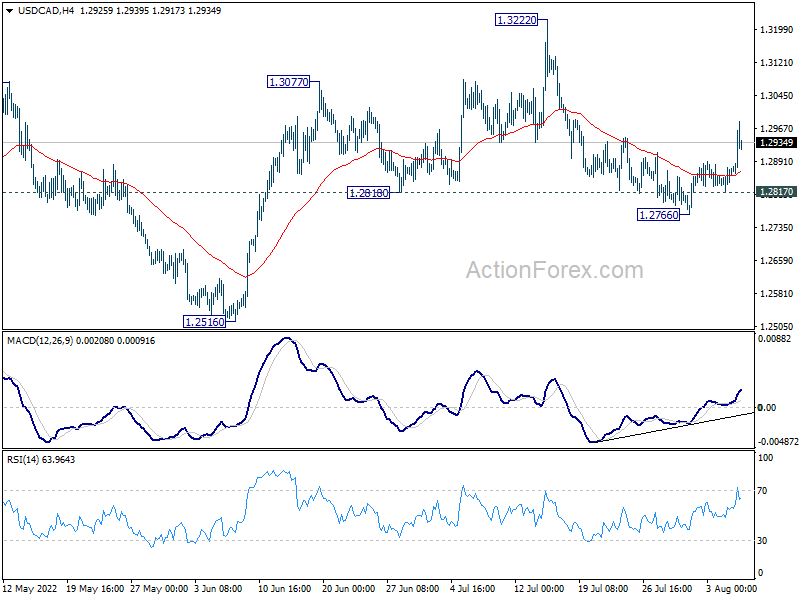
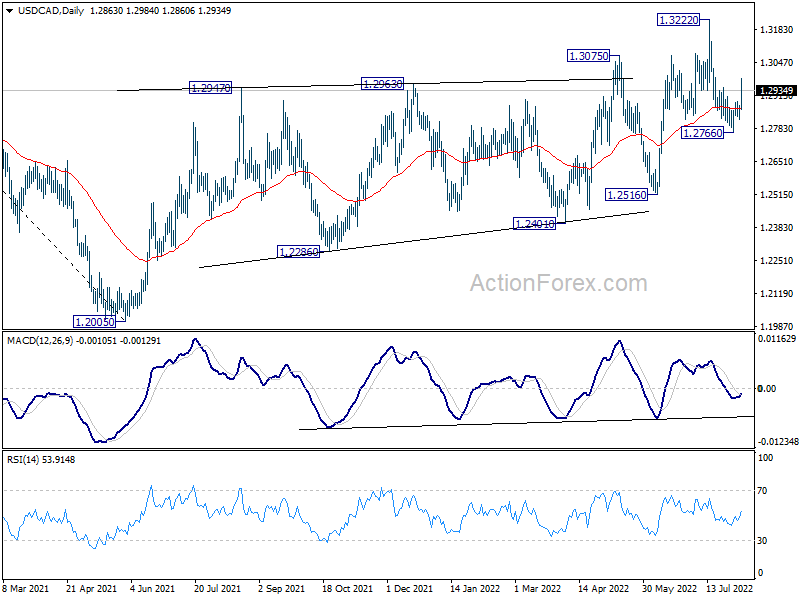
USD/CAD edged lower to 1.2766 last week but rebounded strongly since then. The development argues that pull back from 1.3222 has completed, and revived near term bullishness. Initial bias is mildly on the upside for retesting 1.3222 next. On the downside, however, break of 1.2817 minor support will suggest that the fall from 1.3222 is resuming through 1.2766.
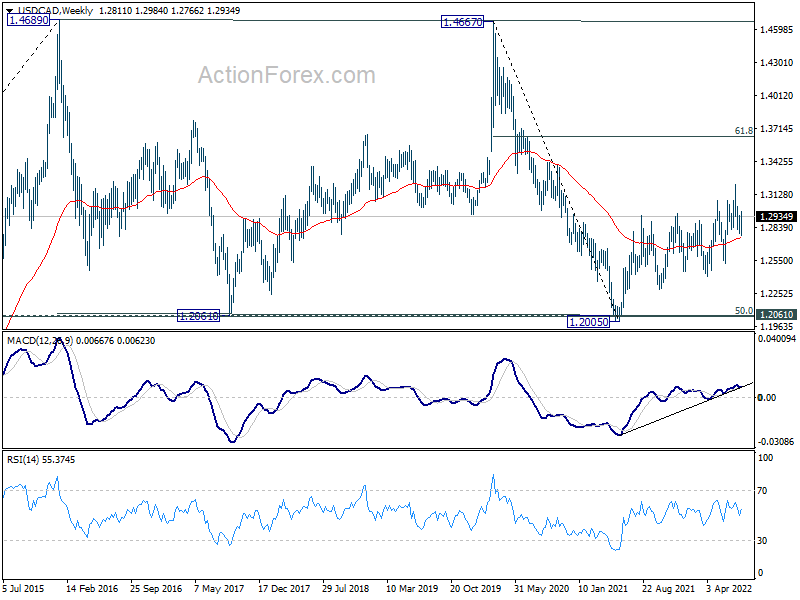
In the bigger picture, down trend from 1.4667 (2020 high) should have completed at 1.2005, after defending 1.2061 long term cluster support. Rise from there should target 61.8% retracement of 1.4667 to 1.2005 (2021 low) at 1.3650. This will remain the favored case now as long as 1.2516 support holds.
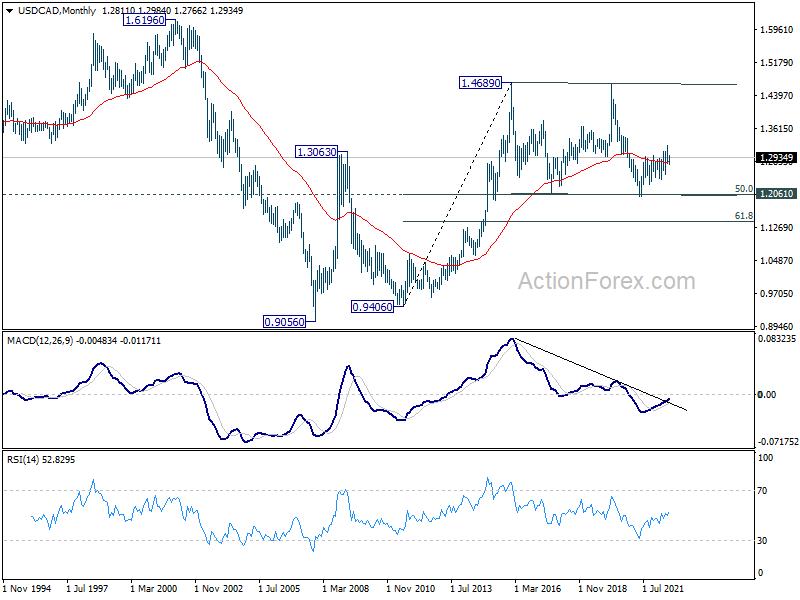
In the longer term picture, price actions from 1.4689 (2016 high) are seen as a consolidation pattern only. That is, up trend from 0.9506 (2007 low) is still expected to resume at a later stage. This will remain the favored case as long as 1.2061 support holds, which is close to 50% retracement of 0.9406 to 1.4689 at 1.2048.
GBP/JPY Weekly Outlook
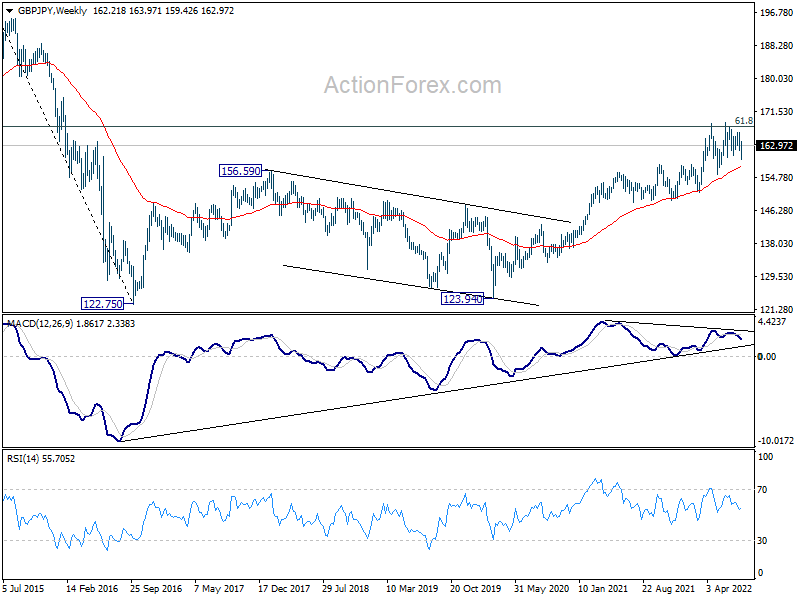
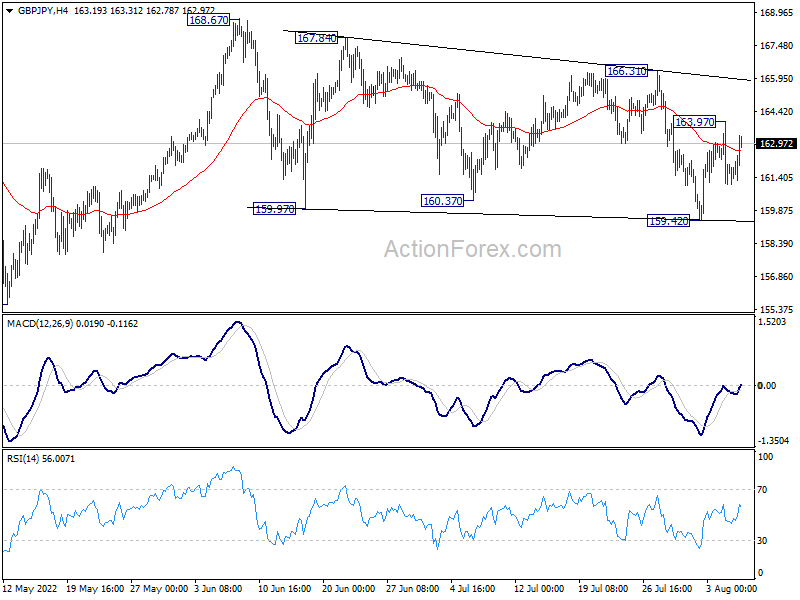
GBP/JPY dipped to 159.42 last week but quickly recovered. Initial bias stays neutral this week first and consolidation pattern from 168.67 might extend. On the upside, above 163.97 will turn bias to the upside, and resume the rebound to 166.31 resistance. Break there will be the first sign of up trend resumption. On the downside, break of 159.42 will extend the correction towards 155.57 support.
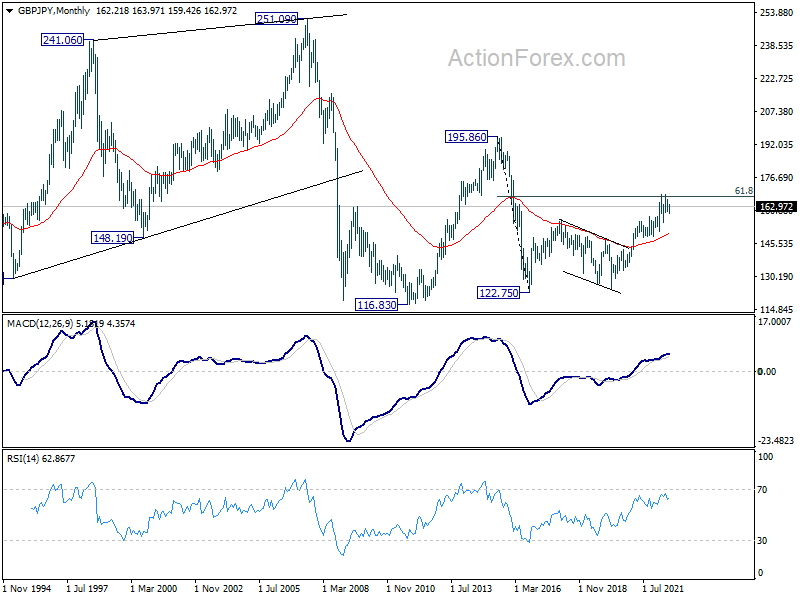
In the bigger picture, up trend from 123.94 (2020 low) is still in progress. Sustained break of 61.8% retracement of 195.86 (2015 high) to 122.75 (2016 low) at 167.93 will be a long term bullish signal, and could pave the way back to 195.86 high. This will remain the favored case as long as 155.57 support holds, even in case of deep pull back.
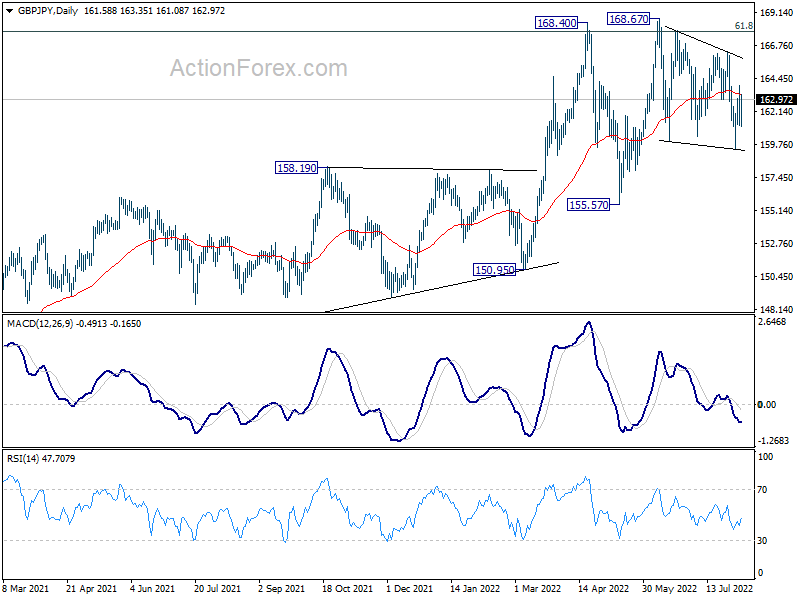
In the longer term picture, rise from 122.75 could be the third leg the the pattern from 116.83 (2011 low). Further rise will remain in favor as long as 55 month EMA (now at 149.84) holds. Sustained break of 61.8% retracement of 195.86 to 122.75 at 167.93. will pave the way to 195.86 (2015 high).