Sample Category Title
EUR/JPY Weekly Outlook
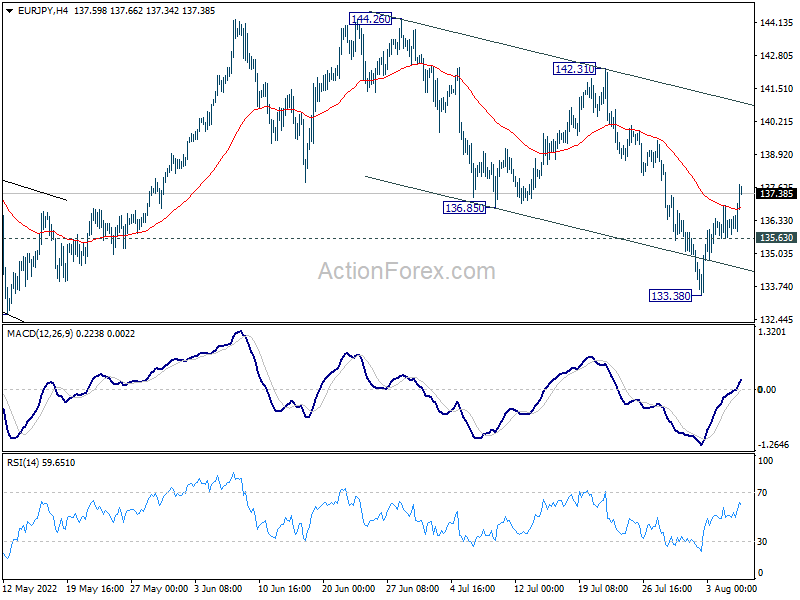
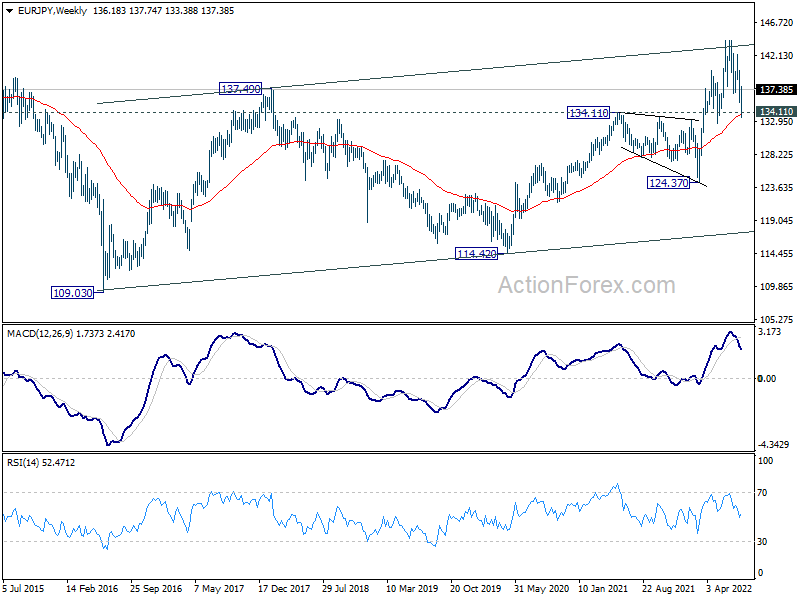
EUR/JPY dropped to as low as 133.38 last week, but recovered strongly after drawing support from 134.11 resistance turned support. Initial bias is now on the upside this week. Sustained trading above 55 day EMA (now at 138.52) will suggest that whole correction from 144.26 has completed. Further rally would then be seen back to retest 144.26 high. However, break of 135.63 will turn bias back to the downside for 133.38 low instead.
In the bigger picture, up trend from 114.42 (2020 low) is seen as the third leg of the pattern from 109.30 (2016 low). Further rally is in favor as long as 134.11 resistance turned support holds, even in case of deep pull back. Next target is 149.76 (2015 high). However, sustained break of 134.11 will be a sign of medium term bearish reversal and turn focus to 124.37 support for confirmation.
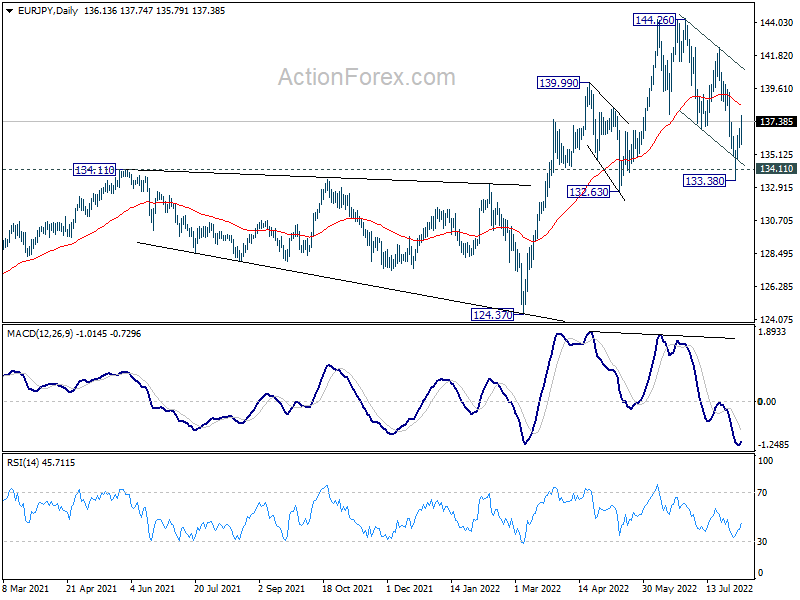
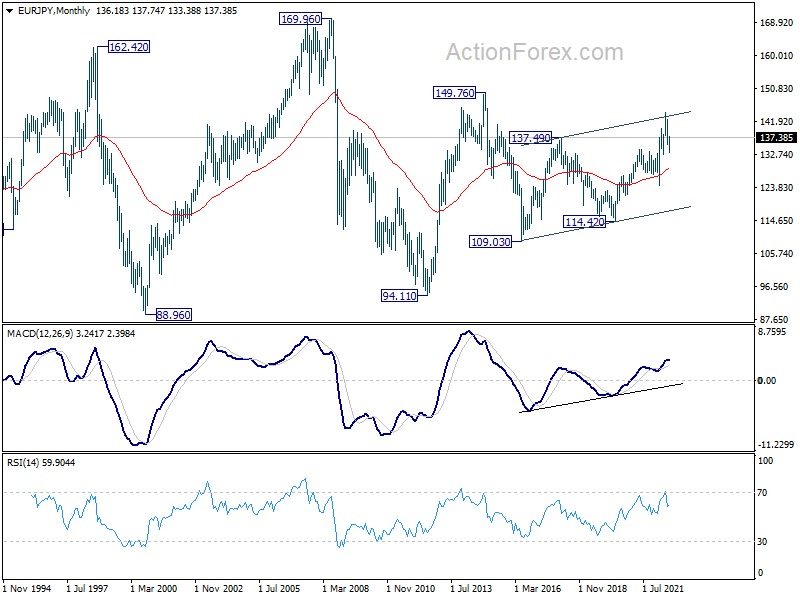
In the long term picture, up trend from 94.11 (2012 low) is seen as in the third leg. Further rally would be seen to 149.76 resistance (2014 high) and above. This will remain the favored case as long as 55 month EMA (now at 128.86) holds.
EUR/GBP Weekly Outlook
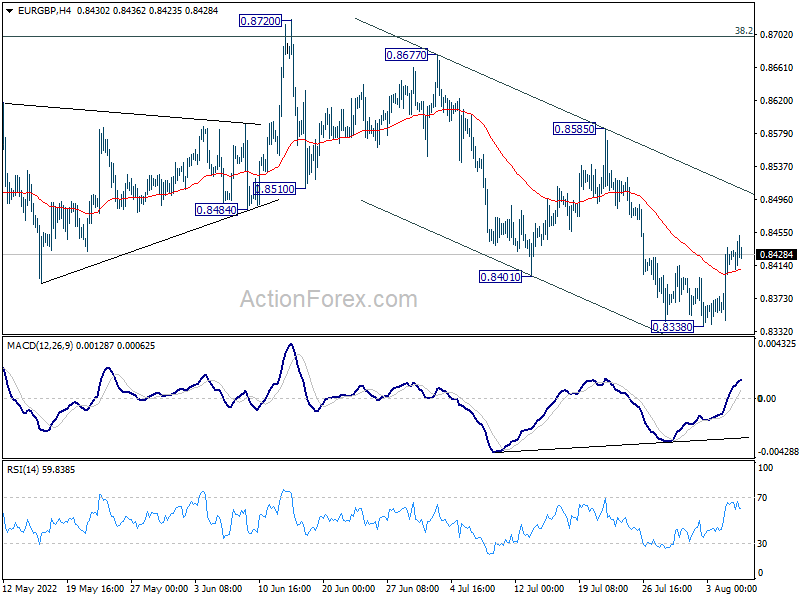
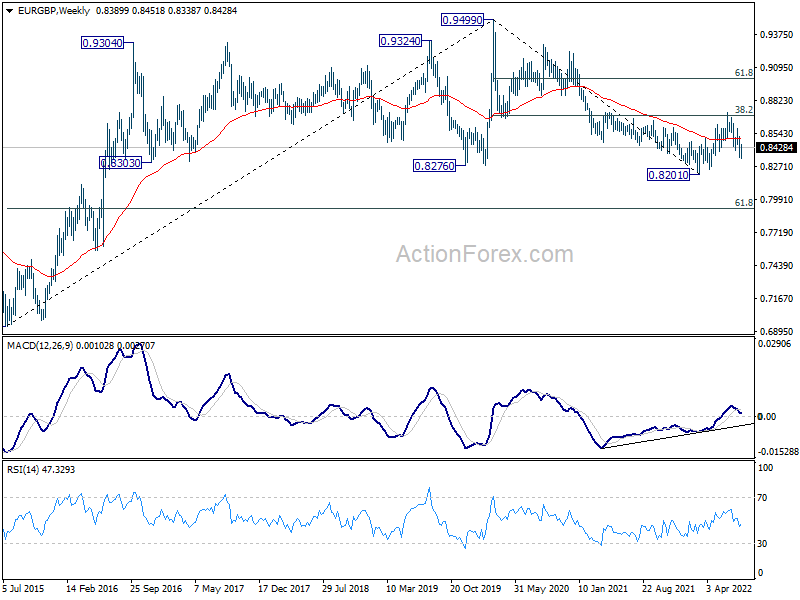
EUR/GBP edged lower to 0.8338 last week, but recovered since then. Initial bias remains neutral this week first. While stronger recovery might be seen, outlook will stay bearish as long as 0.8585 resistance holds. Break of 0.8338 will resume the decline from 0.8720 to retest 0.8201 low.
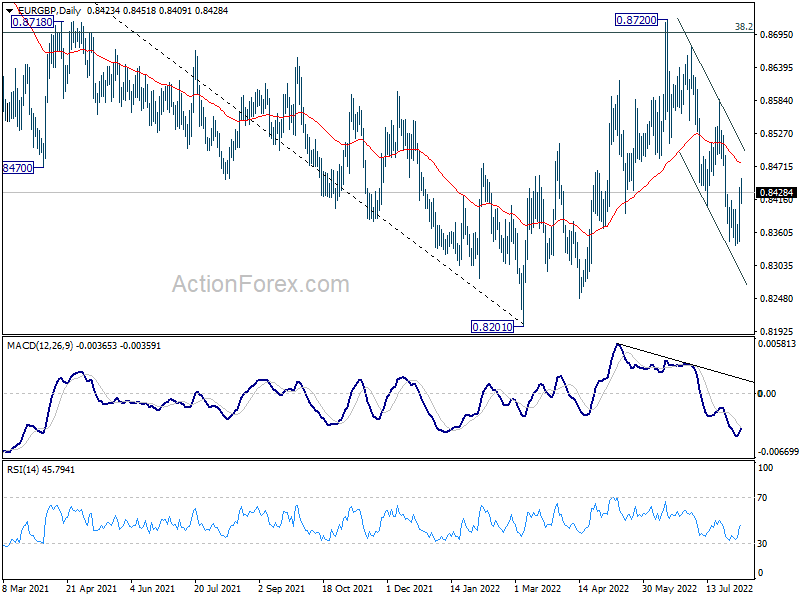
In the bigger picture, current development suggests rejection by 38.2% retracement of 0.9499 to 0.8201 at 0.8697. Medium term bearishness is maintained. Break of 0.8201 will resume larger down trend from 0.9499 (2020 high). Nevertheless, sustained break of 0.8697 will affirm the case that rise from 0.8201 is a medium term up trend itself.
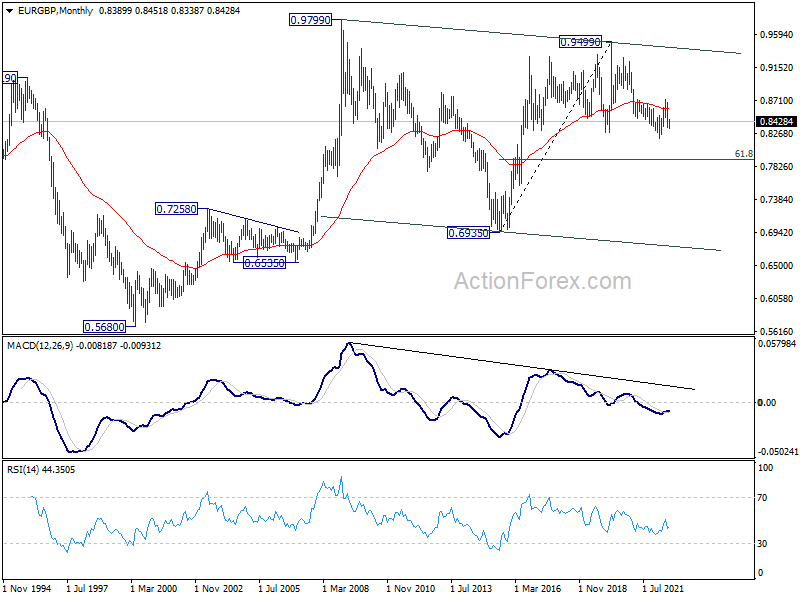
In the long term picture, the lack of medium term downside momentum suggests that fall from 0.9499 (2020 high) is merely a correction to rise from 0.6935 (2015 high). In case of another fall, downside should be contained by 61.8% retracement of 0.6935 to 0.9499 at 0.7917 to bring rebound. Sustained trading above 55 month EMA (now at 0.8591) will indicate that the correction has completed and bring retest of 0.9499.
EUR/AUD Weekly Outlook
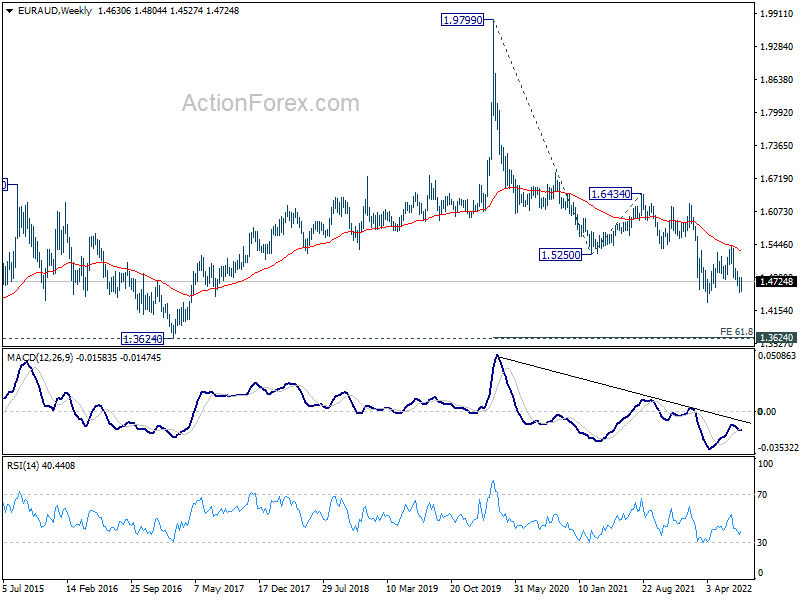
EUR/AUD stayed in consolidation from 1.4508 last week and outlook is unchanged. Initial bias stays neutral this week first. While stronger recovery cannot be ruled out, upside should be limited below 1.4910 resistance to bring fall resumption. On the downside, break the 1.4508 will resume the decline from 1.5396 to retest 1.4318 low. However, firm break of 1.4910 will dampen this bearish view and bring stronger rally.
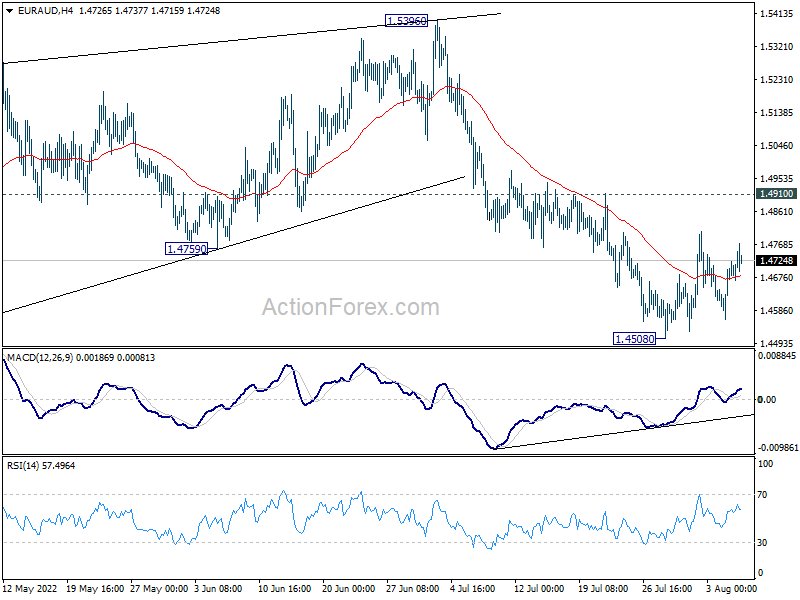
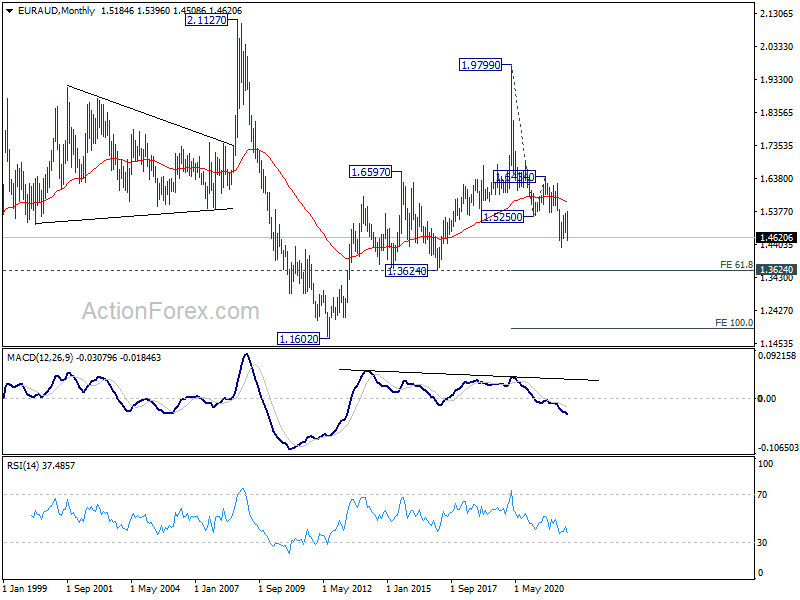
In the bigger picture, down trend from 1.9799 is still in progress. Break of 1.4318 low will target 61.8% projection of 1.9799 to 1.5250 from 1.6434 at 1.3623, which is close to 1.3624 long term support (2017 low). This will remain the favored case now as long as 1.5396 resistance holds.
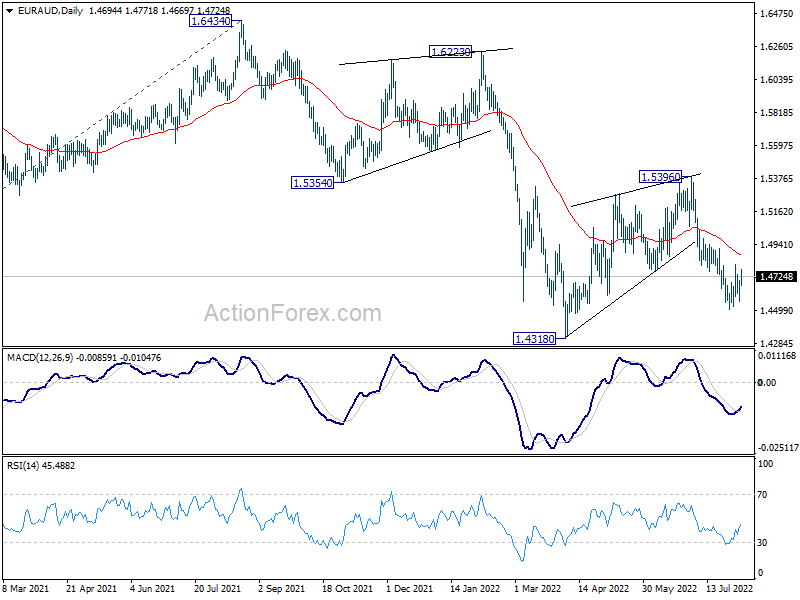
In the longer term picture, fall from 1.9799 (2020 high) is seen as the third leg of the pattern from 2.1127 (2008 high). Deeper fall should be seen to 1.3624 support. Decisive break there would pave the way back to 1.1602 (2012 low). This will remain the favored case as long as 55 month EMA (now at 1.5656) holds.
EUR/CHF Weekly Outlook
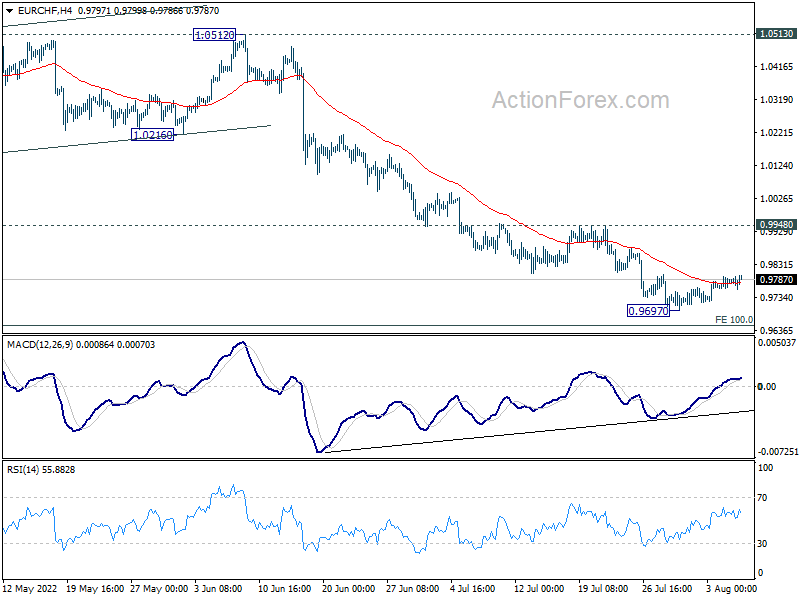
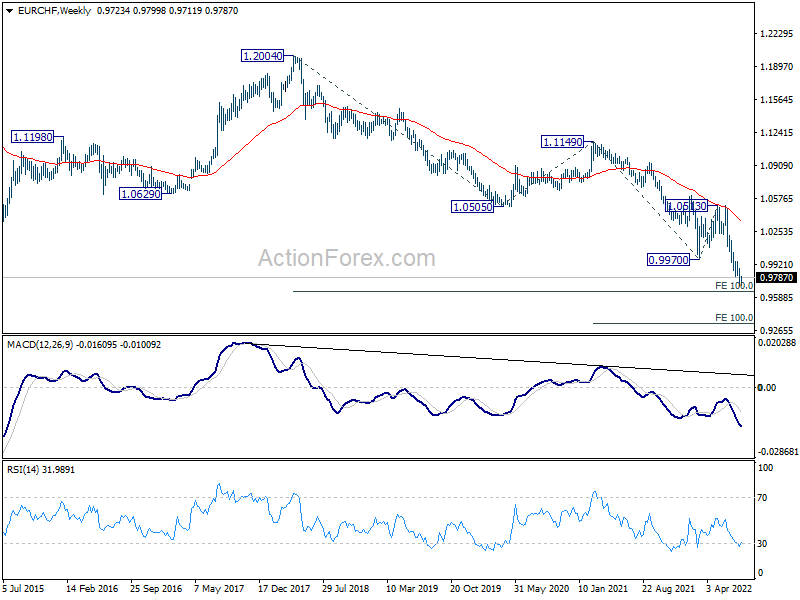
EUR/CHF turned into consolidation last week. Initial bias stays neutral this week first. While further fall cannot be ruled out, some support might be seen from 0.9650 long term projection level to bring rebound. Break of 0.9948 resistance will indicate short term bottoming. Nevertheless, firm break of 0.9650 will target 100% projection of 1.1149 to 0.9970 from 1.0513 at 0.9334.
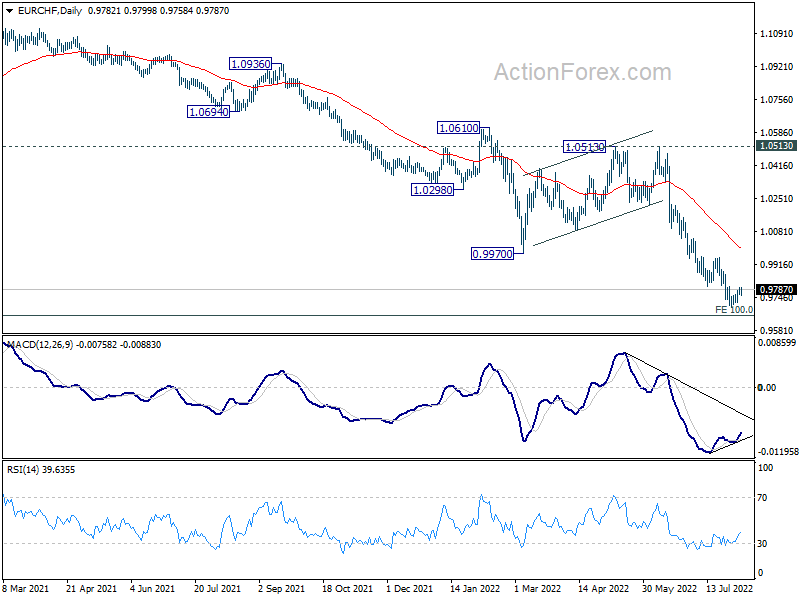
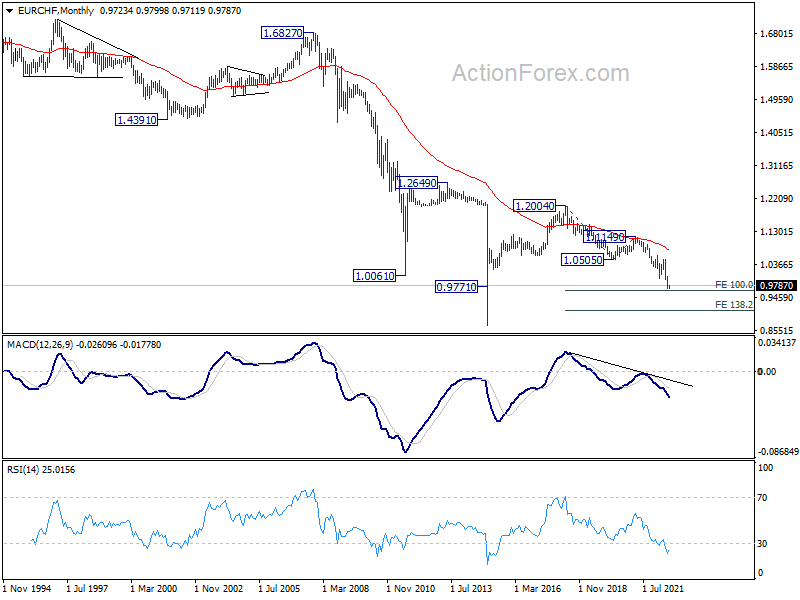
In the bigger picture, long term down trend from 1.2004 (2018 high) is expected to target 100% projection of 1.2004 to 1.0505 to 1.1149 at 0.9650. Firm break there will target 138.2% projection at 0.9033. On the upside, break of 1.0513 resistance is needed to indicate medium term bottoming. Otherwise, outlook will stay bearish in case of strong rebound.
In the long term picture, capped below 55 month EMA, EUR/CHF is seen as extending the multi-decade down trend. There is no prospect of a bullish reversal until some sustained trading above the 55 month EMA (now at 1.0764).
Dollar Rose, Yen Fell as Traders Adjusted Bet on Fed Hikes
The strong set of job market data seemed to have cleared much concern over recession in the US, and set the tone for the financial markets. Benchmark treasury yields jumped as traders added bets on Fed continuing with the current pace of tightening beyond neutral. Stocks markets were resiliently firm despite that and look set to extend near term rebound.
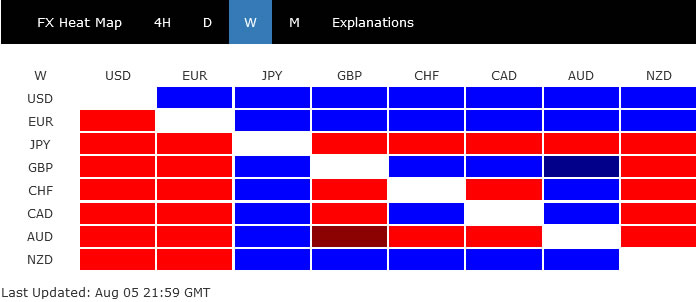
In the currency markets, Dollar ended as the strongest, even though rising yield was countered by risk-on sentiment. But it couldn't break out of range against the steady Euro. Yen was the worst performing, pressured by the development in both stocks and bonds markets. Sterling and Aussie were mixed after respect central banks' rate hikes. The Pound didn't end up too badly considering the grim outlook of UK economy as painted by BoE.
Overall, risk-on sentiment could continue in the coming week. Dollar should remain firm but need fresh inspiration from consumer inflation data. Yen's extended selloff could be the most apparent theme.
Market repricing 75bps hike by Fed in Sep after NFP
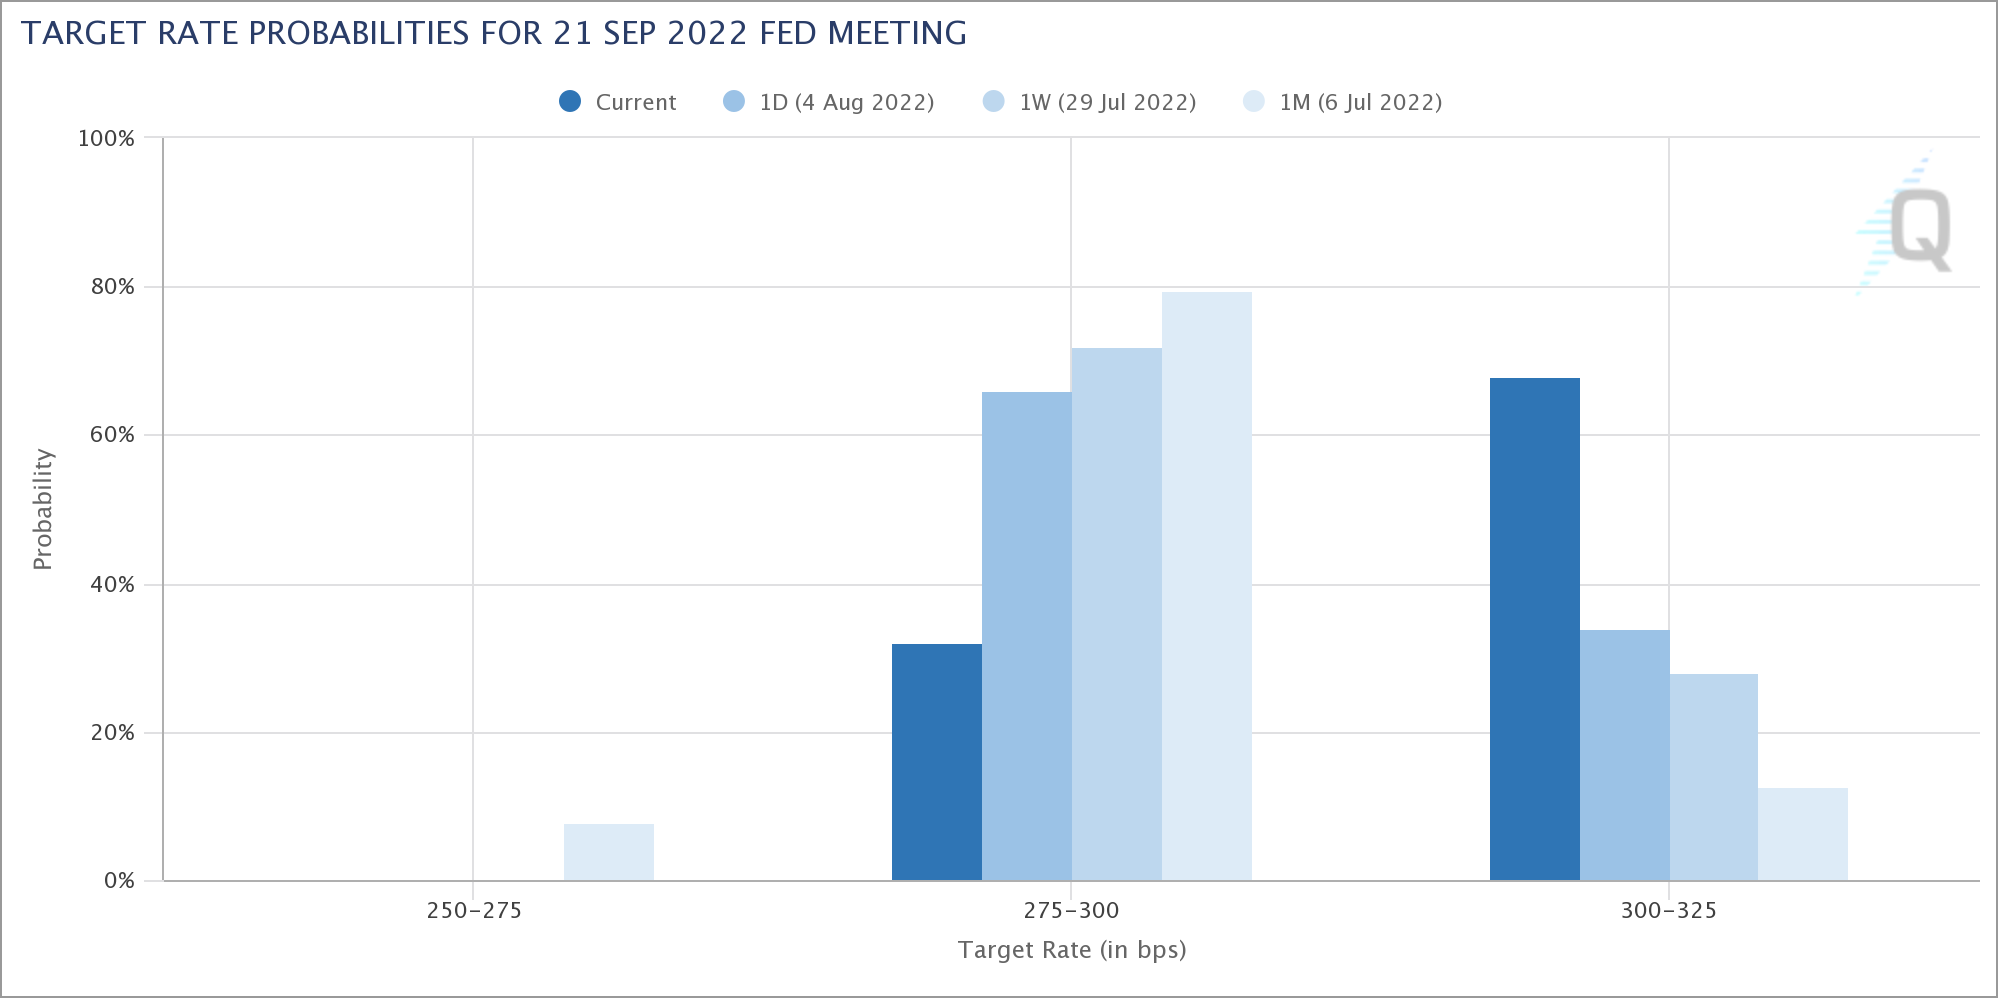
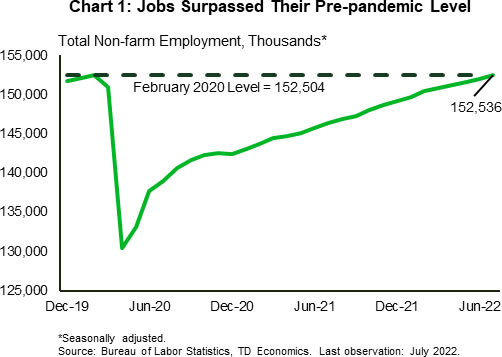
There have been talks of Fed slowing the tightening pace starting from the September meeting. But such speculations receded after an all-round strong non-farm payroll on Friday. The 528k job growth was much higher than the average gain of 388k over the prior four months, with total employment level reaching its pre-pandemic level. Unemployment rate dropped further to 3.5% while average hourly earnings printed a strong 0.5% mom growth. That put an end to whether a recession has started in the US.
Traders were quick in repricing the chance of another 75bps rate hike by Fed in September. There's now 68% chance of seeing federal funds rate at 3.00-3.25% out of the meeting, comparing to just 28% chance a week ago.
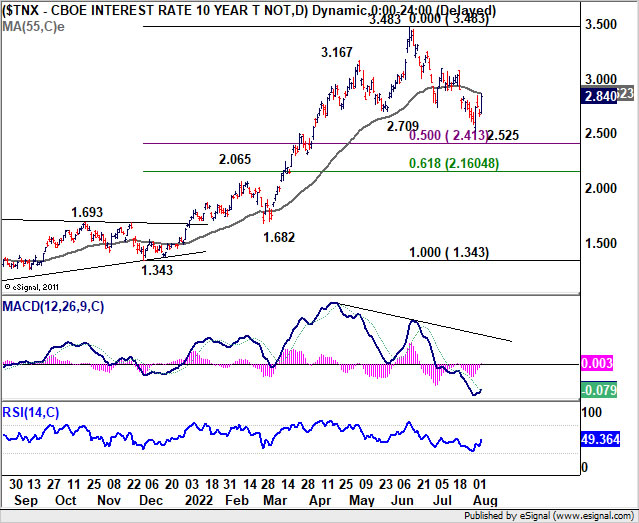
US 10-year yield already in second leg of medium term consolidation?
US 10-year yield rebounded notably after NFP to close at 2.840. Immediate focus is on 55 day EMA (now at 2.868) in the coming days. Sustained break there would argue that fall from 3.483 has already completed at 2.525, ahead of 50% retracement of 1.343 to 3.483 at 2.413.
In this case, TNX should be already in the second leg of the medium term consolidation pattern from 3.483, and further rebound should be seen to to 3.000 handle and above. Rejection by 55 day EMA, however, will bring another down leg towards 2.413 before bottoming.
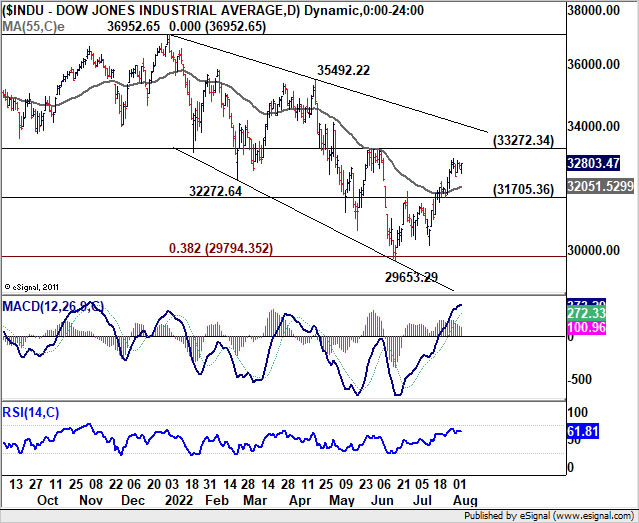
DOW facing key resistance in the next few days
Major US stock indexes edged higher last week, and were not bothered by expectation of another big Fed hike in September. The coming days will be crucial in determining the near term outlook for stocks. DOW's rebound from 29653.39 is set to extend to take on 33272.34 resistance, which is close to 55 week EMA (now at 33164.20).
Sustained trading above these levels will argue that whole correction from 36952.65 has completed at 29653.29, after hitting 38.2% retracement of 18213.65 to 36952.65 at 29794.35. In this case, further rally should be seen to 35492.22/36952.65 resistance zone next.
However, rejection by 33272.45, followed by break of 31705.36 support, should set up another test on 26953.29 low at least.
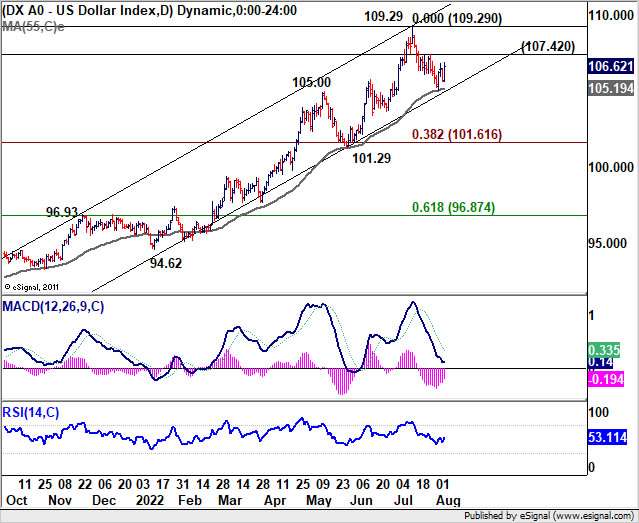
Dollar index supported by 55 day EMA, staying well inside rising channel
Dollar index recovered last week as it responded to the rise in benchmark yield on the one hand. But momentum was capped by risk-on sentiment on the other hand. Nonetheless, the support from 55 day EMA (now at 105.19) was a bullish sign. DXY is also kept well within the medium term rising channel.
107.42 minor resistance will be the main focus in the coming week. Make or break could depend on the CPI release. Firm break of 107.42 should confirm that pull back from 109.29 has completed, and retest of this high should be seen then. Though, even in this case, up trend resumption through 109.29 would probably more depend on the next set of job and inflation data.
But anyway, near term risk for DXY will now be on the upside as long as 55 day EMA holds.
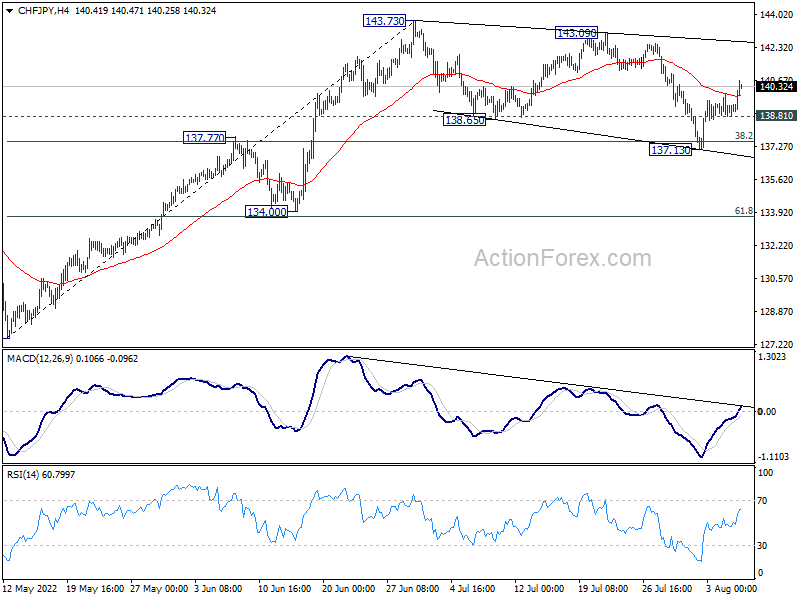
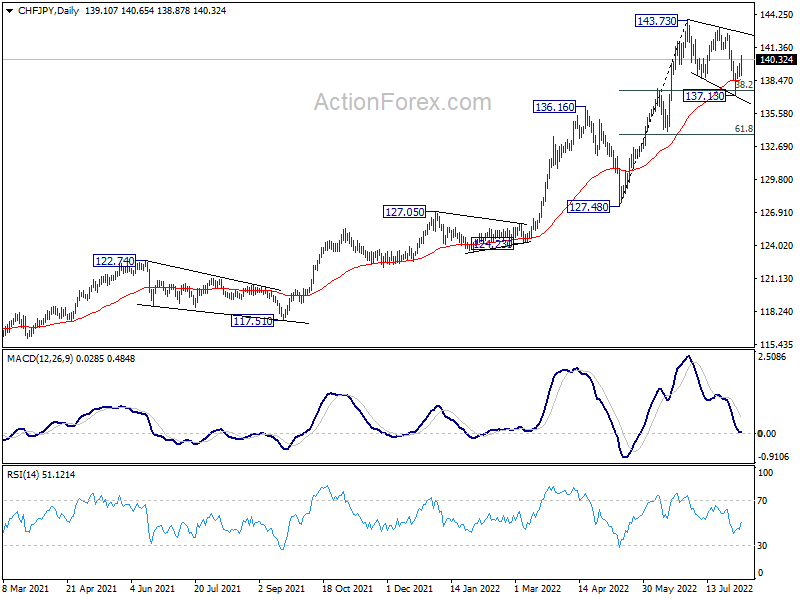
CHF/JPY finished corrective pattern at 137.13
The next development in Yen is also worth a note. The rebound in Yen might have ended as major global benchmark yields stabilized and recovered. On the other hand, Japan 10-year JGB yield has indeed closed lower at 0.163, farther away from BoJ's 0.25% cap.
Even CHF/JPY managed to extend the rebound from 137.13 last week, with a close above 4 hour 55 EMA, as well as 55 day EMA. The development argues that corrective pattern from 143.73 might have completed with three waves down to 137.13 already, above 136.16 resistance turned support, and after breaching 38.2% retracement of 127.48 to 143.73 at 137.52.
Further rally is expected as long as 138.81 support holds. Break of 143.09 resistance will suggest that larger up trend is ready to resume. If that happens, there should be upside breakouts in some other Yen crosses in tandem.
USD/JPY Weekly Outlook
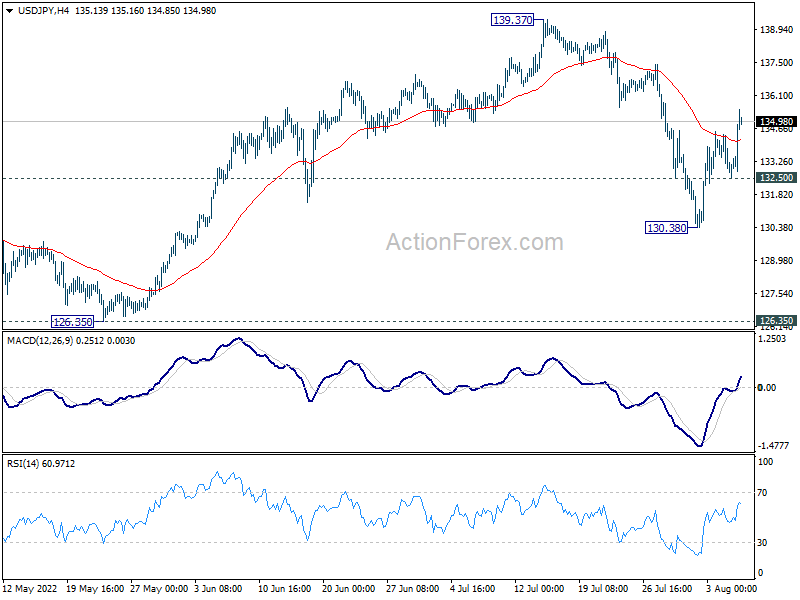
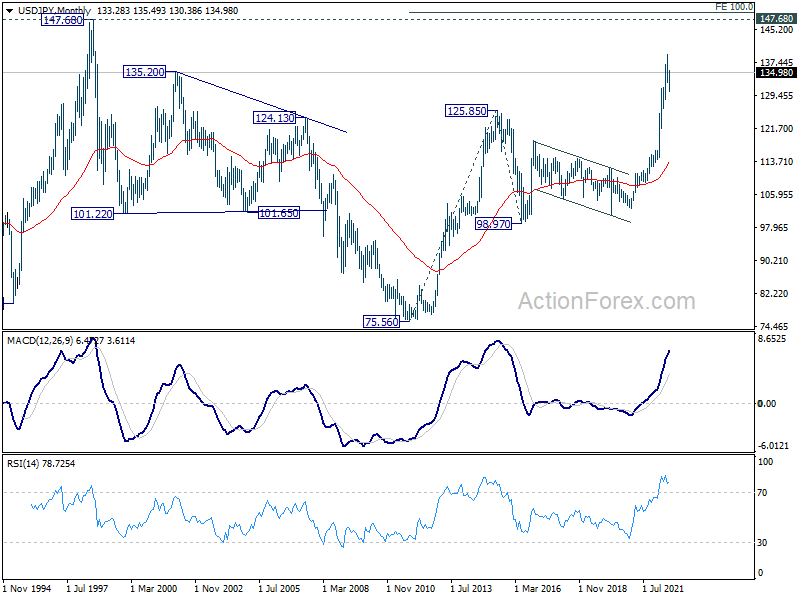
USD/JPY's correction from 139.37 extended to as low as 130.38 last week but rebounded strongly since then. Initial bias is mildly on the upside this week for retesting 139.37 high. Upside should be limited there to bring another fall, as the third leg of the consolidation pattern from 139.37. On the downside, below 132.50 minor support will resume the fall from 139.37 towards 126.35 structural support.
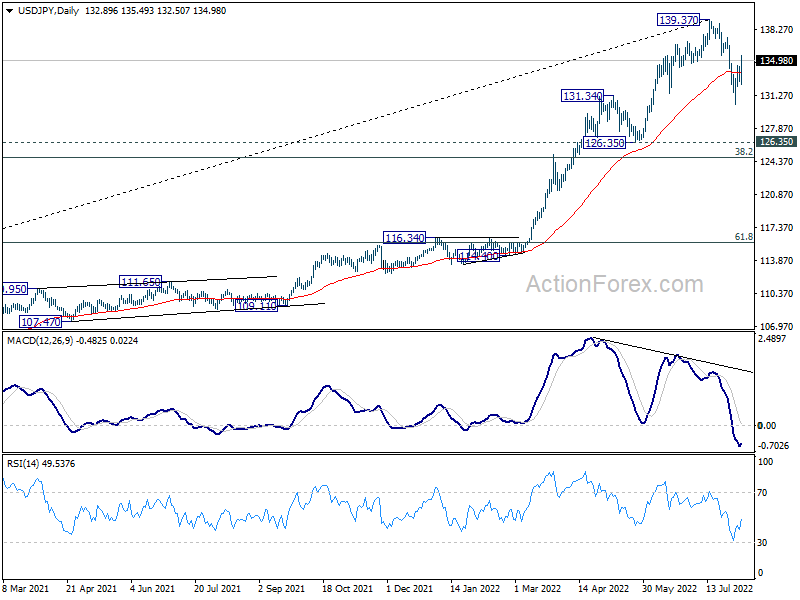
In the bigger picture, fall from 139.37 medium term top is seen as correcting whole up trend from 101.18 (2020 low). While deeper decline cannot be ruled out, outlook will stays bullish as long as 55 week EMA (now at 121.84) holds. Long term up trend is expected to resume through 139.37 at a later stage, after the correction finishes.
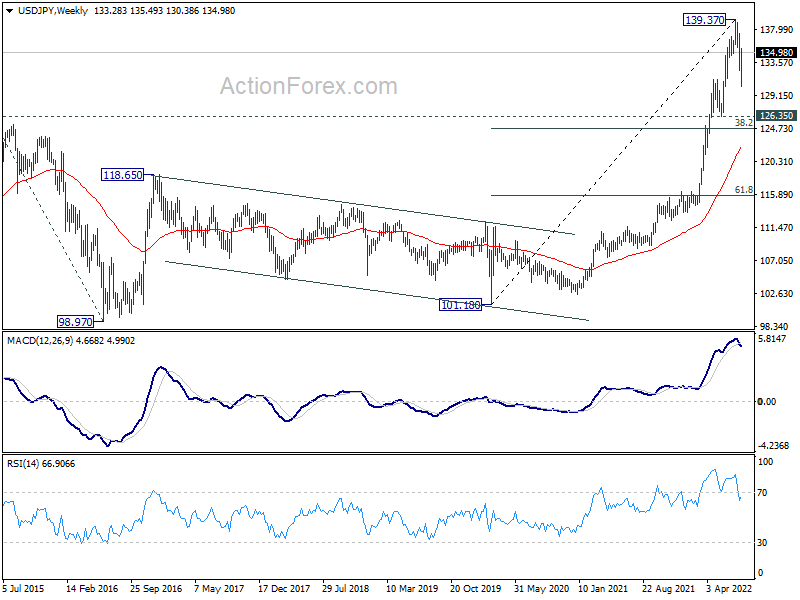
In the long term picture, rise from 101.18 is seen as part of the up trend from 75.56 (2011 low). Further rally is expected to 100% projection of 75.56 (2011 low) to 125.85 (2015 high) from 98.97 at 149.26, which is close to 147.68 (1998 high). This will remain the favored case as long as 55 week EMA (now at 122.31) holds.
Reserve Bank of Australia Sees Flexible Path Forward
Summary
- The Reserve Bank of Australia (RBA) raised its Cash Rate by 50 bps to 1.85% at its August meeting and signaled that further rate hikes will be needed to bring inflation back toward target over time.
- Several elements of the monetary policy announcement were essentially unchanged from previous meetings. However, there were also some important changes in language that lead us to believe the RBA will revert to smaller hikes going forward. Notably, the central bank indicated that while further normalization of policy is expected in the months ahead, it also noted that policy is "not on a pre-set path". The RBA also dropped references to "extraordinary monetary support" that had appeared in previous announcements, suggesting it now sees itself a bit further along the monetary tightening path, and perhaps does not need to move at an accelerated 50 bps pace anymore. Given these changes, we believe the RBA will be more flexible moving forward with regard to the size and timing of future rate hikes.
- With signals of further tightening but more flexibility, we now expect 25 bps rate hikes at the RBA's next several meetings in September, October, November, December and February, which would see the Cash Rate peak at 3.10% by early next year.
RBA Signals More Rate Hikes, but by How Much and at What Pace?
In a widely expected move, the Reserve Bank of Australia (RBA) continued down the path of monetary tightening at its August meeting, raising its Cash Rate by 50 bps to 1.85%. The central bank signaled that further rate hikes are needed to bring inflation down to target and rebalance supply and demand dynamics.
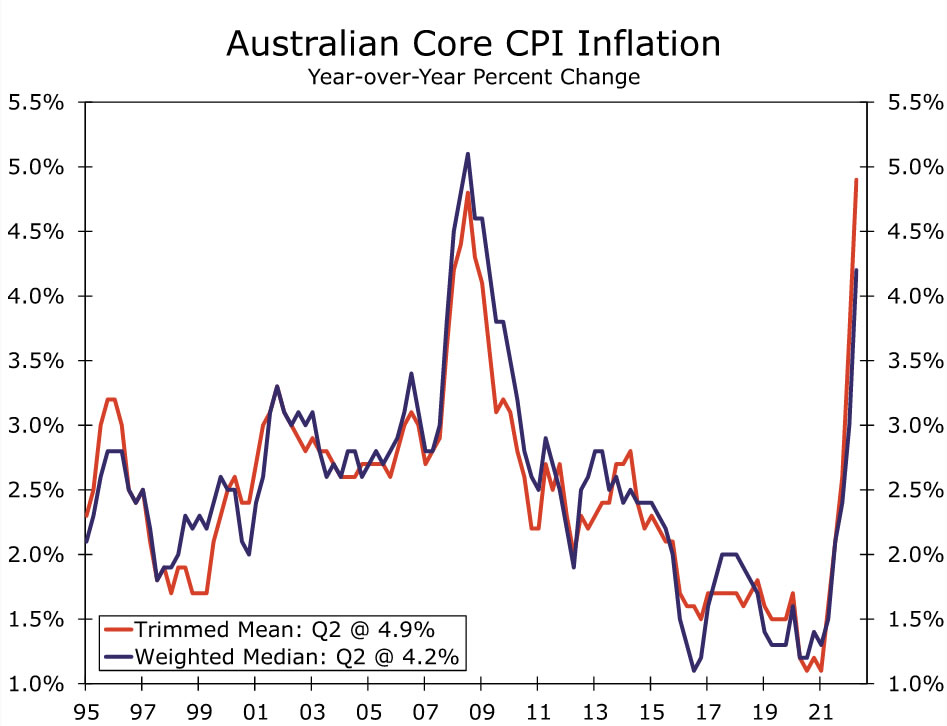
Taking a closer look at the details of the monetary policy announcement, with a few exceptions, the RBA's language was very similar to prior meetings. As in previous announcements, the central bank brought attention to tightness in the labor market and evidence of wage growth, as well as resilient consumer spending, while reiterating that the outlook for household spending remains a key uncertainty amid high inflation. Speaking of inflation, the central bank emphasized that price pressures are still elevated within Australia, driven by both global and local factors, and released updated inflation forecasts in its Statement on Monetary Policy. The RBA's lifted its central CPI forecast for CPI inflation and now expects it to reach around 7.75% over 2022, 4.25% in 2023, and 3% in 2024. In addition, looking at underlying price pressures, trimmed mean inflation is expected to peak at 6% this year and decline to 3%, the top end of the RBA's target, by 2024. The central bank expects wage growth to accelerate further, and to eventually be the primary driver of inflation in a tight labor market. On the growth front, GDP forecasts show the economy experiencing respectable growth, averaging 4% this year before slowing to 2.25% in 2023 and 1.75% in 2024. The growth outlook suggests the economy should be able to absorb further tightening. With much of the language unchanged from previous announcements, we believe the RBA is still on track to continue hiking rates. The question is: by how much and at what pace?
To answer this question, we look to the few notable changes in language that lead us to think the RBA will move forward with a smaller magnitude of rate hikes than its recent 50 bps increments. While the RBA again said that it expects to take further steps in normalizing monetary conditions over the months ahead, and that the size and timing of future interest rate increases will be guided by incoming data, the latest announcement added that policy is not on a "pre-set path". This phrasing suggests the RBA will be more flexible moving forward with regard to the size and timing of future rate hikes, pointing to a meeting-by-meeting approach to monetary policy decisions based on incoming data. Other central banks around the world have also adopted this more flexible meeting-by-meeting approach, notably the Federal Reserve and European Central Bank. Overall, we expect the RBA to pay close attention to Q2 wage data and July employment data released between now and its September policy meeting.
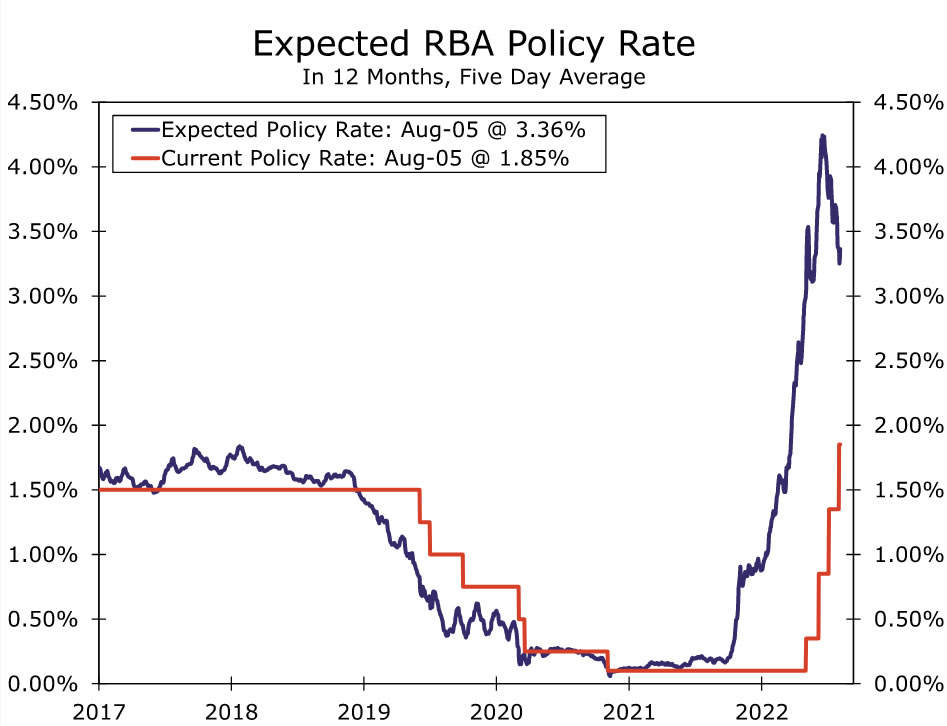
In addition, the August announcement dropped previous references to "withdrawal of extraordinary monetary support". Instead, this phrase was replaced with more standard language that "the increase in interest rates is a further step in the normalization of monetary conditions in Australia." This new language hints that the RBA believes it is now a bit further along the monetary tightening path, and perhaps does not need to move at an accelerated 50 bps pace anymore—also a mildly dovish tilt. Furthermore, in its Statement on Monetary Policy, the RBA indicated it is seeking to bring inflation down in a way that keeps the economy on an "even keel". We believe this language is also consistent with a more measured pace of rate hikes. Against this backdrop, we now expect the RBA to revert to a steady pace of consecutive 25 bps rate hikes at its next several meetings in September, October, November, December and February, which would bring the Cash Rate to 3.10% by early 2023.
Weekly Economic & Financial Commentary: July Jobs Report Squashes Current Recession Fears
Summary
United States: July Jobs Report Squashes Current Recession Fears
- Employers added over half a million jobs in July, which squashes arguments that the U.S. economy is currently in recession. While other measures of labor market strength have shown more pronounced signs of slowing, the July jobs report puts further pressure on the Fed to act aggressively in its fight against inflation.
- Next week: Productivity (Tues.), CPI (Wed.)
International: Global Central Banks Deliver Another Round of Rate Hikes
- The Bank of England stepped up the pace of its monetary tightening, raising its policy rate 50 bps to 1.75% this week, and also notified it would likely begin active sales of its government bond holdings shortly after its September announcement. The Reserve Bank of Australia (RBA) also hiked rates 50 bps but hinted at a more flexible approach moving forward. We expect the RBA to revert to 25 bps increments from September. Brazil's Central Bank raised its Selic Rate 50 bps this week, and we now expect one final 25 bps hike to 14.00% at its September monetary policy announcement.
- Next week: Brazil CPI (Tue.), Mexico Overnight Rate (Thu.), U.K. GDP (Fri.)
Credit Market Insights: Household Debt Surges in the Second Quarter
- Total household debt balances rose by $312B in the second quarter of this year, a 2% increase from last quarter. Debt has now surpassed $16T and has increased by over $2T since the start of 2020.
Topic of the Week: Tension in Taiwan
- Speaker of the House Nancy Pelosi's visit to Taiwan made one thing clear: U.S.-China tensions are not going anywhere anytime soon and international trade between the two countries continues to hang in the balance.
The Weekly Bottom Line: More Fuel to the Recession Debate
U.S. Highlights
- The U.S. economy added a whopping 528k jobs in July, pushing employment above its pre-pandemic level. The unemployment rate also ticked lower, falling back to its pre-pandemic historical low of 3.5%.
- Sentiment indicators also surprised to the upside, with the manufacturing sector faring better than expected and the services sector pointing to plenty of pent-up demand.
- Data out this week support the narrative that the U.S. economy is not currently in a recession, and more monetary tightening will be required from the FOMC to slow inflation and restore balance in the labor market.
Canadian Highlights
- Preliminary data from the regional real estate boards this week showed that home sales and prices in Canada’s major cities continued to ease in July.
- The labour market disappointed expectations for a modest gain, and instead shed 30.6k jobs in July.
- The slowdown in the labour market and broader economic activity suggests that rate hikes are already starting to bite. Sill, with wage growth remaining strong, more tightening will be required to cool current inflationary pressures.
U.S. - More Fuel to the Recession Debate
This week, the debate on whether the Fed will be able to achieve a soft landing intensified. Equities were trading up most of the week as investors bought into the positive economic news with an expectation that a slowdown in economic growth will avoid a severe downturn. In contrast, the bond market took a grimmer view of the future, by pushing the 10Y2Y yield inversion deeper into negative territory, suggesting a recession may be looming on the horizon.
Investors weren’t the only ones arguing about the economic prospects. In academic circles, the debate on whether a soft landing can be achieved was out in the open. At its core is the argument that job vacancies can’t decline by a large amount without the economy falling into recession. This week’s release of June’s Job Openings and Labor Turnover Survey (JOLTS) showed that job openings dipped to 10.7 million while job vacancy rate continued to decline, indicating we have likely already surpassed peak tightness in the labor market. Still, demand for workers continued to outpace supply - a sign of a still strong labor market.
Indeed, anyone in search of more signs that the economy is in fact not in a recession need to look no further than today’s jobs report. July data shows that the economy added a whopping 528k jobs (well above the consensus forecast of 250k), while revisions resulted in additional 28k jobs – enough for the payroll figures to surpass their pre-pandemic level (Chart 1). The unemployment rate declined by a tenth of a percentage point to 3.5%, while the labor force participation rate fell slightly to 62.1%. Furthermore, average hourly earnings accelerated – not quite what the Fed was looking for as this increases the possibility of inflation becoming entrenched.
Meanwhile, sentiment indicators also surprised to the upside. The Institute for Supply Managements’ (ISM) readings for the manufacturing sector slipped modestly but came in above expectation. Demand is clearly slowing with new orders contracting for the second month in a row. Still, this comes with less pressure on suppliers, as supplier delivery times rose at their slowest pace since before the pandemic. Moreover, the inventories subindex continues to show improvement. This corresponds with rising auto inventories, where increased production helped improve market supply to roughly 28 days from February’s low of just 24 days.
The ISM services index pointed to a broad pickup in services activity, proving again that there is still plenty of pent-up demand. The gap between the supplier deliveries time and the rest of the index’s drivers narrowed in July – a month after a similar improvement in the manufacturing sector. This seems to have contributed to a decline in the prices paid component in both sectors of the economy (Chart 2). The sizeable deceleration in the ISM price subindexes may very well be a harbinger of a slowing pace in broader price growth, which we’ll hopefully see in next week’s CPI report.
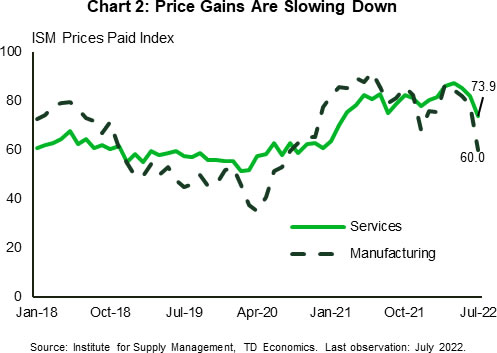
Still, at the 40-year high price growth is too overwhelming for the Fed to scale back on rate hikes. For now, robust employment growth adds further conviction that the economy remains on a solid footing and suggests the FOMC needs to remain aggressive in tightening rates to help cool inflation and re-anchor inflation expectations.
Canada - Cooling Like It Should
Coming on the heels of the soft GDP print for May and the modest flash reading for June, this week brought further signs that the Canadian economy is slowing. Nowhere has this been more evident than the housing market. Under the weight of soaring borrowing costs and still elevated home prices, the Canadian housing market continued to cool in July. Preliminary sales data from the regional real estate boards out this week showed that resale activity and prices across Canada's major cities were all lower.
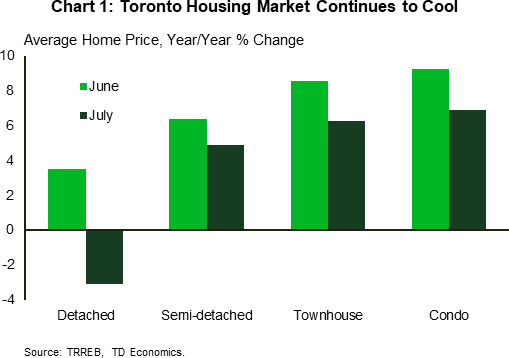
The most glaring declines came from the GTA, where home sales were down 47% from July 2021, which was more than the 41% year-over-year drop reported in June. Meanwhile, supply continued to increase, with active listings up 58% from year-ago levels. Prices were also down on the month. Across the more expensive detached segment, home prices swung from a modest year-over-year gain to an outright decline in July (Chart 1).
In Vancouver, the slowdown also accelerated, with sales down 43.3% from last year. Unlike in Toronto, detached home prices were still higher - up 11% from year-ago levels - though gains have also ebbed relative to June. The more affordable Calgary market is holding up better than its pricier peers, with sales down just 2.5% from last year. Falling sales across the detached and semi-detached segments were largely offset by gains in the more affordable multifamily segment. Detached prices were still up 14.8% y/y in July.
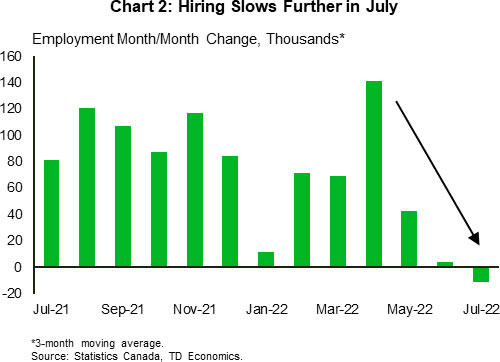
The theme of a slowdown extended to the labour market. Friday's job report surprised to the downside, with the labour market shedding 30.6k jobs in July. This marked the second consecutive monthly decline, and the loss of hiring momentum is becoming increasingly evident (Chart 2). The underlying details of the report were also on the softer side, with full-time employment falling by 13.1k, while hours worked declined by 0.5% m/m. Perhaps one silver lining is the fact that the labour market is still tight, with the unemployment rate holding at 4.9% - matching its historic low in June. Wage growth also remained strong, with average monthly earnings up 5.2% y/y.
The slowdown in the labour market and broader economic activity suggests that previous rate hikes are already starting to bite. Indeed, this is something that the Bank of Canada is trying to accomplish as it works to rein in inflation. While the Bank will likely find some solace in the nascent signs of weakening demand, the fact that wage growth remains elevated suggests more will be required in terms of monetary tightening to cool current inflationary pressures. To that end, the focus now shifts to the July CPI report which will be released on August 16th, as markets try and gauge just how big of move the BoC has in store in September. Stay tuned!
Week Ahead – Fear Returns ahead of Inflation Data
Can the Fed afford to ease off the brake?
The end of last week was a bit of a reality check for investors that were maybe getting a little carried away with the supposed “dovish pivot” from the Fed and turning a blind eye to the data and what central bank policymakers were saying.
Perhaps the experience of the last 12 months can explain the latter but there’s no ignoring the data that we saw on Friday. The US economy is certainly not behaving like it’s in a recession; rather the labour market is so hot that the Fed may not be able to slow down as hoped.
While the UK is preparing for a long period of stagflation, the US is desperately trying to avoid a hard landing. The inflation data next week may shed further light on whether the Fed can afford to ease off the brake in September or possibly even be forced to slam on harder.
US
It is all about inflation this week. Now that some Fed members have pushed back on the idea of a Fed pivot, investors will want to see if inflation continues to show signs that inflation has peaked. The US economy might be slowing down and that will lead to some demand destruction for goods.
The July inflation report is expected to show a much slower pace of price pressure, but if it ends up being a hot report, expectations for the September FOMC meeting could swing further to a 75 basis point rate increase. The month-over-month reading is expected to show a 0.2% increase, down from the 1.3% pace in the prior month. The headline year-over-year reading is expected to ease from 9.1% to 8.8%.
The other important data set for the week is the preliminary University of Michigan consumer sentiment report, which is expected to stabilize.
Traders will also pay close attention to a few Fed appearances during the week from Evans, Kashkari, and Daly. Leading up to the September policy decision, traders will want to know how many Fed members are positioning themselves for a slower pace of tightening policy.
Election season continues with US primary elections in Connecticut, Minnesota, Vermont, and Wisconsin.
EU
Next week is looking a little quiet on the European front, with final inflation data the only notable release. Of course, it will attract plenty of attention considering the level of central bank activity at the moment but revisions do tend to be less impactful.
With the winter already in mind, the focus will remain on Russian gas flows as Nord Stream 1 continues to run at 20%.
UK
GDP data on Friday is the standout next week, especially in light of the bleak BoE forecasts on Thursday. The country may not be in a recession yet but the central bank thinks it will very soon and the slump will be long and painful. If the GDP data on Friday is unexpectedly negative, it will compound the misery facing the country over the next couple of years.
Russia
Inflation and GDP data is released next week with the former seen falling to 15.3%, allowing for further rate cuts from the CBR as it seeks to address the strength of the rouble and support the economy.
South Africa
Only tier three data releases next week, with manufacturing, mining and gold production among them.
Turkey
A selection of economic data is due next week from unemployment to industrial production and the current account. Inflation jumped to 79.6% last month, further highlighting the failure of the monetary policy experiment. We could get more evidence next week but ultimately, it won’t make a difference.
Switzerland
Inflation hit 3.4% last month, further increasing the odds of a 50 basis point hike from the SNB next month. The central bank does like to surprise markets so an inter-meeting move is possible. Next up is unemployment data on Monday.
China
China releases its trade balance data over the weekend, but it should have little market impact on Monday. China CPI will be released on Wednesday with inflation expectations universally benign at 2.50% YoY. The risk is that the inflation story starts to catch up with China, where growth is muted.
The Pelosi/Taiwan visit is not expected to have a long-lasting impact on local markets, which were already pricing it out on Friday. Developments in China’s property developer sector, real estate bad loans, and covid zero continue to present the main headline risk to China.
India
The RBI hiked by 0.50% on Friday, higher than expected, with a hawkish tone to the statement. The INR did not respond positively, nor has it to lower oil prices. A strong jobs report hasn’t helped and a higher inflation number from the US next week could see it test record lows against the US dollar above 80.00. That could also restart foreign investor outflows from the Sensex once again, which has recovered over the past two weeks.
Australia
AUD/USD remains at the mercy of international investor flows as a global sentiment gauge. AUD has staged a major technical breakout higher but gains have been limited by AUD/JPY due to the USD/JPY collapse.
Consumer and business sentiment on Monday are the only releases of note this week. Australian equities continue to track the Nasdaq and S&P 500.
New Zealand
NZD/USD remains at the mercy of international investor flows as a global sentiment gauge. NZD has staged a major technical breakout higher but gains have been limited by NZD/JPY due to the USD/JPY collapse.
NZ electronic card spending on Tuesday, and business PMI and food inflation on Friday, are closely watched data points for NZ. Higher spending and food inflation will reinforce the view that more aggressive RBNZ tightening is on the way. Could be a short-term negative for local equities and a short-term positive for the currency.
Japan
The USD/JPY collapse extended to 130.50, just shy of 130.00. It is attempting to form a base at these levels but its direction remains entirely dependent on the US/Japan interest rate differential. Hawkish comments from FOMC members over the past week have lifted USD/JPY back to 132.00 while the jobs report gave it another kick higher.
Japan has a heavy week of data releases, but all are tier-2 and unlikely to have a big impact on the markets. The Nikkei continues to closely track the Nasdaq.
Singapore
Singapore retail sales were soft this past week, easing MAS tightening fears in October. That should take the edge off Singapore’s GDP this Thursday and if that data is soft, SGD weakness could well resume. A hawkish MAS has meant SGD has outperformed in the Asia FX space.
Singapore earnings have been firm for Q2 supporting equity prices.
Economic Calendar
Saturday, Aug. 6
Economic Events
- US Secretary of State Blinken visits the Philippines
- Berkshire Hathaway Inc. quarterly earnings are released
Sunday, Aug. 7
Economic Data/Events
- China trade, forex reserves
- US Secretary of State Blinken travels to Africa
Monday, Aug. 8
Economic Data/Events
- Australia foreign reserves
- Singapore foreign reserves
- Japan BoP
- New Zealand 2-yr inflation expectation
- Iran Nuclear Deal talks to continue in Vienna
Tuesday, Aug. 9
Economic Data/Events
- US NFIB small business optimism, nonfarm productivity
- US primary elections are held in Connecticut, Minnesota, Vermont and Wisconsin
- Australia NAB business confidence, household spending
- China aggregate financing, money supply, new yuan loans
- Japan M2 money stock, machine tool orders
- Mexico CPI, international reserves
- New Zealand heavy traffic index, card spending
- Philippines GDP, trade, unemployment
- Thailand consumer confidence
- Parties are vying to fill the 1st District seat left vacant by the death of Republican Representative Jim Hagedorn
Wednesday, Aug. 10
Economic Data/Events
- US July CPI M/M: 0.2%e v 1.3% prior; Y/Y: 8.8%e v 9.1% prior, wholesale inventories
- Germany CPI
- Russia CPI
- Australia consumer confidence
- China PPI
- Japan PPI
- Thailand rate decision
- Chicago Fed President Evans talks about the economy and monetary policy
- Minneapolis Fed President Kashkari speaks on stagflation
- Chinese Ambassador to Australia Xiao Qian speaks at Australia’s National Press Club
- EIA crude oil inventory report
Thursday, Aug. 11
Economic Data/Events
- US PPI, initial jobless claims
- Argentina CPI
- Australia consumer inflation expectations
- China FDI
- Israel trade
- Mexico (Banxico) rate decision: Expected to raise Overnight Rate by 75bps to 8.50%
- Mexico industrial production
- New Zealand home sales, net migration
- Peru rate decision
- Singapore GDP
- South Africa manufacturing production
- South Korea money supply
- Thailand foreign reserves
- Turkey current account
- San Francisco Fed President Daly is interviewed on Bloomberg TV
- UK Tory Party leadership holds hustings in Cheltenham
- Denmark’s government holds Ukraine conference
Friday, Aug. 12
Economic Data/Events
- US University of Michigan consumer sentiment
- Spain CPI
- Poland CPI
- India CPI
- UK GDP
- Russia GDP
- China medium-term lending
- Eurozone industrial production
- France unemployment, CPI
- India industrial production, trade
- Italy trade
- New Zealand food prices, PMI
- Turkey industrial production
- UK GDP industrial production
- EasyJet Plc pilots are set to strike in Spain
Sovereign Rating Updates
- Denmark (Fitch)
- Hungary (S&P)
- Switzerland (S&P)
- Denmark (Moody’s)
- Germany (Moody’s)
- Belgium (DBRS)
Forward Guidance: Soaring U.S. Inflation to Ease Off in July
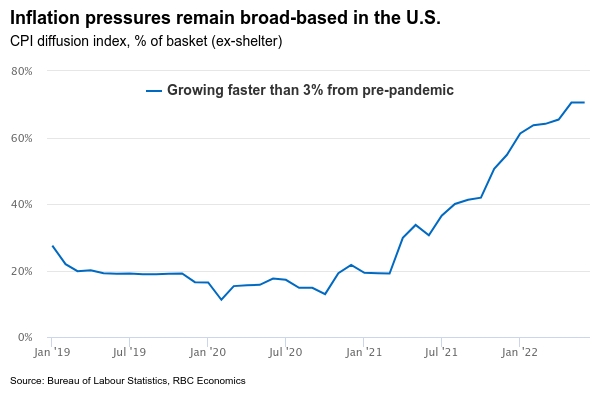
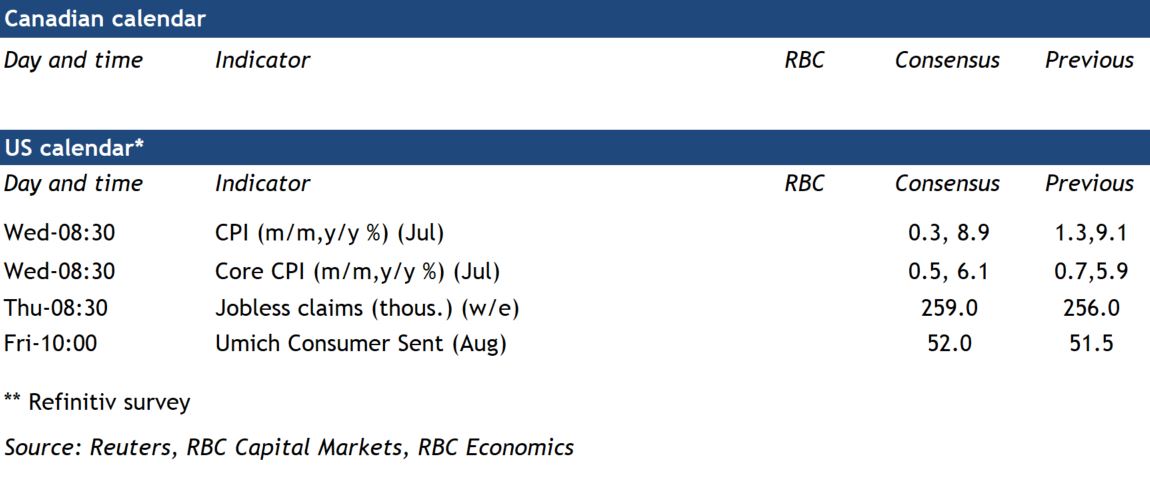
U.S. inflation numbers are expected to edge lower next week, dropping to 8.8% in July. The slowdown (the reading was at 9.1% in June) comes after inflation hit record levels following more than a year of persistent supply chain pressures, elevated domestic demand and soaring commodity prices. The dip will likely reflect an easing in gasoline price growth on lower oil prices. By contrast, the year-over-year growth in food prices probably didn’t change much, with core (ex-food & energy) prices edging a bit higher compared to a year ago. Broader measures of price inflation are still very high. Over 70% of items in the consumer basket (excluding shelter) were growing faster than 3% in June.
There are reasons to believe that inflation will continue to slow. Global supply chain pressures have eased more sustainably since late spring, as shipping times and costs fall. Commodity prices, though very high, have also been trending lower. And with high inflation and rising borrowing costs squeezing consumers’ real buying power, there are already early signs of slowing domestic consumer demand. Goods purchases in volume terms have fallen in recent months, to 3% below levels a year ago in June.
Still, spending on services, especially those that are leisure and travel related, will remain strong over the summer. Rent prices having increased more substantially over the past months are also expected to strengthen further. A bigger pullback in consumer demand will likely be necessary to get inflation moving back toward the Federal Reserve’s 2% target rate. Overall, we look for the Fed to hike rates to 3.25% - 3.5% range by end of this year