

Sample Category Title
Strong US Jobs Data Revive Fed Hawks
The US economy added 528’000 new nonfarm jobs in July, significantly higher than 250’000 expected by analysts. Last month’s data was revised up to 400’000. The unemployment rate fell to 3.5%, the lowest level since late 1960s. Wages grew 5.2% vs 4.9% expected by analysts.
Strong US jobs data revived the Federal Reserve (Fed) hawks on Friday. The US 10-year yield jumped, and the US dollar gained. Gold gave back a part of gains, and was offered into to the $1800 mark, as the higher yields increased the opportunity cost of holding the non-interest-bearing gold.
US stocks closed in the negative, although the three major US indices closed the first week of August in the positive. The S&P500 gained 0.4%, while Nasdaq jumped more than 2% last week, in the continuation of the July rally.
It's all about the market rhetoric
Stock don’t need good data, they need softer yields, as softer yields push their valuations higher.
Since the beginning of July, the S&P500 recovered more than 10%, while Nasdaq bounced around 17% higher. This was partly due to the better-than-feared earnings reports, but mostly due to the easing US yields on the back of growing recession expectations.
As such, the market rhetoric went from ‘the Fed is hiking interest rates to fight inflation and that’s bad for the stocks’, to ‘higher rates will push the US economy into recession and get the Fed to slowdown, and maybe to reverse its rate hiking policy’. This shift in expectations had a cooling effect on the US yields, and the softer yields pushed stock prices higher, as lower rates automatically push the stock valuations higher.
Inflation is key
The S&P 500 is nearing an important technical level near 4180 level, the peak reached in June, before the index plunged again below the 3700 mark; we could see sellers come in play into the 4200 mark, and bring the index lower.
But the sentiment will mostly depend on this week’s inflation data. If US inflation starts easing, the Fed could rethink about smaller rate hikes, which could give another positive swing to the stocks.
Therefore, inflation data is, again, key. Analysts expect that the US inflation may have slowed to 8.7% in July from 9.1% printed a month earlier. It’s possible given that the oil prices eased around 15% last month.
For now, the Fed is given around 70% chance to hike the rates by another 75bp in September. We will see how that evolves throughout the week.
Is crude oil below $90 pb sustainable?
The barrel of US crude kicks off the week slightly upbeat, below the $90 level. But the news that China started mass testing in the Hainan beach resort comes as a warning that China is still not done with its fight against Covid.
Last week, OPEC increased the production outlook by a laughable, and a completely meaningless 100’000 barrels per day. That’s about 0.1% of the global oil output.
But the recession fears and the slowing demand will likely continue driving the market; we could see a further downside pressure on oil prices.
Strong Jobs Report Supports the Case for Another 75bp in September
Market movers today
A quiet start to the week in terms of data releases. The Euro Area Sentix Index will be released for August and markets are looking for indications that the weakness in July's leading indicators has persisted into August. In addition, Manufacturing PMI will be released for Norway.
Later in the week, the key data release will be the US July CPI on Wednesday. Lower gasoline prices point towards inflation pressure easing to 0.3% m/m/8.8% y/y, but the focus will be on the development in the underlying core measures. Following last week's strong jobs report we continue to see risks tilted towards faster inflation and increasing pressure on Fed to continue with a third 75bp hike in September. On Friday, markets will also be following the University of Michigan's Flash Consumer Sentiment survey for August, and especially the longer-term inflation expectations component.
The 60 second overview
July jobs report: Against expectations of weakening jobs growth, the non-farm payrolls surprised to the upside as 528 thousand new jobs were created in July. The growth in employment was very broad-based, and the June figures were also revised slightly higher. Labour shortages continue to push wage inflation higher, as labour force participation declined to 62.1% (from 62.2%) and average hourly earnings rose 0.5% m/m/5.2% y/y. Even though the latest JOLTs job openings data does point towards easing labour demand, overall labour market conditions remain very tight as the unemployment rate reached its pre-pandemic low at 3.5%. The combination of strong employment gains and fast wage inflation supports the case for further Fed tightening, and we continue to expect another 75bp hike at the September meeting. US 2y yields rose by around 15bp following the strong report, and market now prices in around 70% probability for the 75bp hike.
US politics: Last night, the US Senate passed a bill dubbed the 'Inflation Reduction Act', which aims to both increase spending into green energy and lower prescription drug prices, as well as decreasing the budget deficit by hiking corporate tax rates. Overall, if the bill is signed to law, it is expected to reduce US fiscal deficit by around USD 300bn, or 1.2% of the current GDP. The reduction in deficit will, however, be split over the upcoming decade, so the near-term impact on inflation will likely be very limited given that Congressional Budget Office's baseline forecast for the US fiscal deficit for next year is 3.8% of GDP. In addition, the slight reduction in deficit will partly be offset by new spending from the Chips and Science Act passed in late July. That being said, the two bills do address some of the longer-term vulnerabilities that western economies have faced over the past couple of years related to inflation, supply chains and energy, and thus they could provide the Democratic Party a boost in support ahead of the mid-term elections later this year.
Equities: Global equities slightly lower on Friday but the main equity story being the comeback for value stocks. The NFP report brought back the inflation and central bank scare with higher yields and an even more inverted yield curve. The sign of economic overheating from the NFP report sent energy, materials and financials higher while rest of the sectors were lower. The equity story temporarily back to what we saw the first five months of the year but despite the value outperformance on Friday it still lost 1.5% relative to the growth sectors last week. The US performance on Friday, Dow +0.2%, S&P 500 -0.2%, Nasdaq -0.5% and Russell 2000 +0.8%. Asian markets are mixed this morning and the same goes for the western futures with European ones slightly higher and US ones slightly lower.
FI: Treasury yields jumped 10bp in the 10y area on the US labour market report that saw more than double the new jobs than consensus expected. Markets repriced central bank expectations, in particular raising the odds for a 75bp rate hike at the September meeting. While US yields saw an idiosyncratic jump on the release, the European session saw a more gradual rise in yields which accelerated after the jobs market report. 10y Bunds rose 15bp on the day to stand at 0.95%. The Dec22 Euribor contract rose 10bp (yield). Markets have priced in just above 100bp until year end (€STR). Bund ASW rose above the 90 mark again.
FX: Broad USD rebounded on Friday following the strong US jobs numbers. EUR/USD dropped below 1.02 and USD/JPY rose above 135. Oil prices dropped last week, but EUR/NOK was largely unaffected and stayed below the 10.00 level.
Technical Outlook and Review
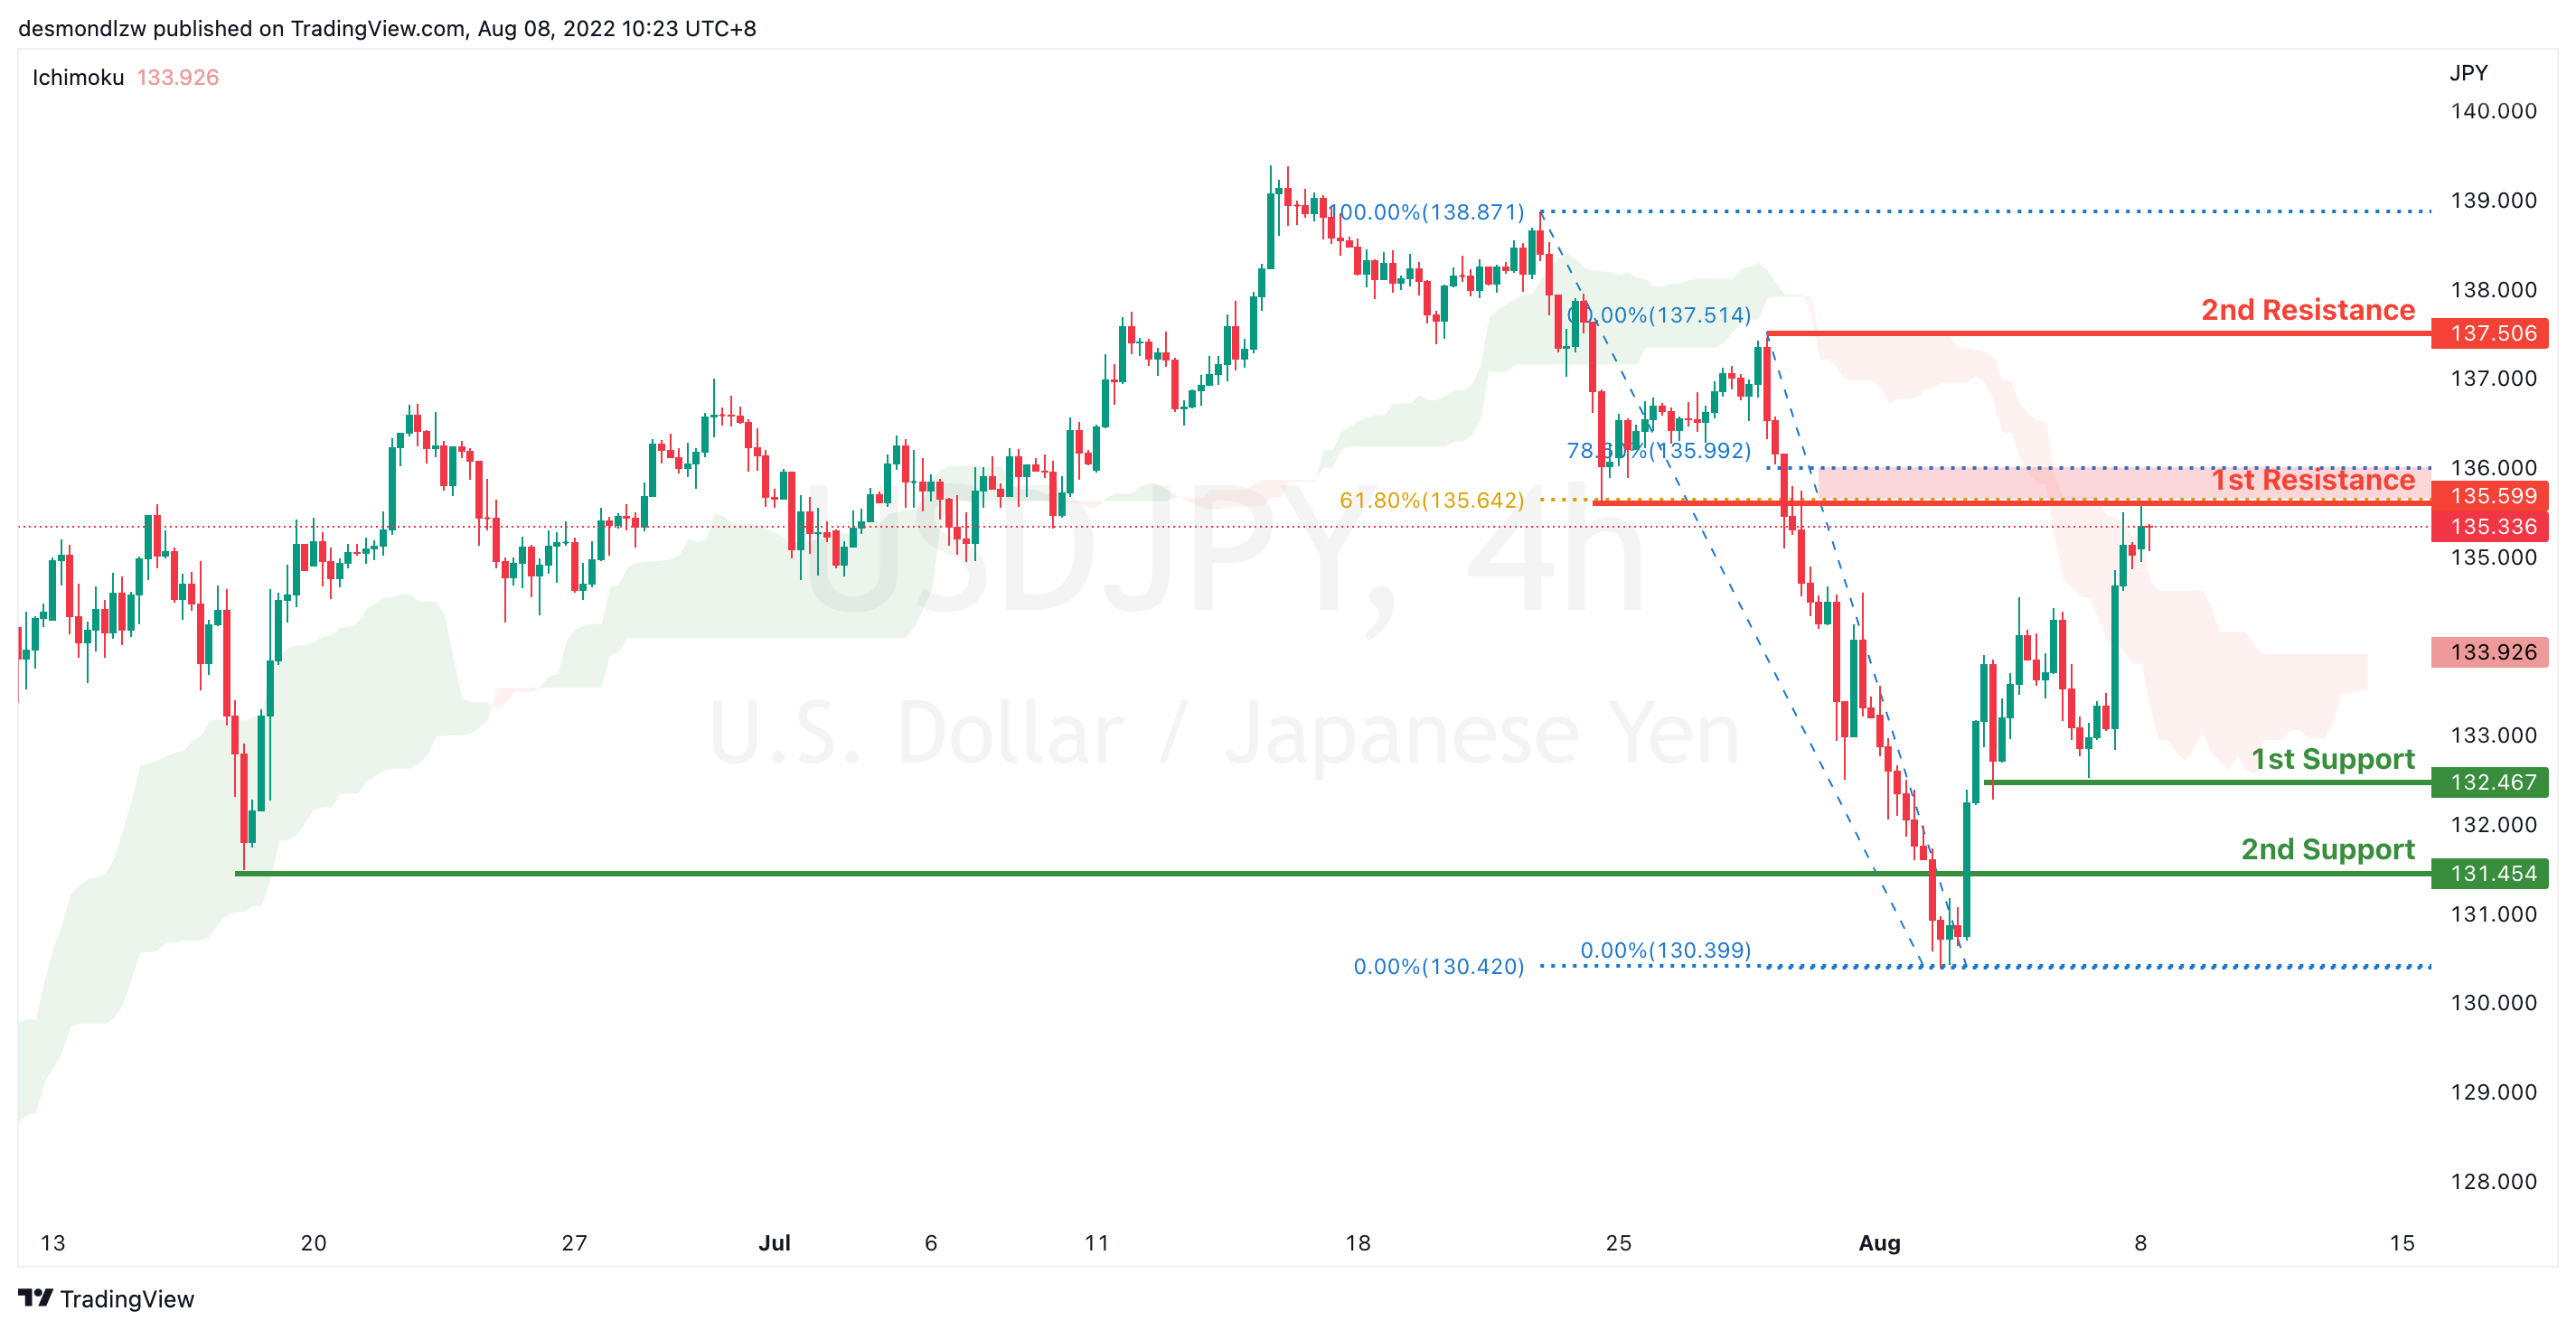
USD/JPY:
On the H4, price is bullish biased as it’s testing the first resistance at 135.599 which coincides with the 61.8% Fibonacci retracement and the previous swing low. If price breaks this level, it will move up to test at the second resistance which is the previous swing high at 137.506. Alternatively, price could pull back to test at the first support 132.467 which is the previous swing low
Areas of consideration:
- H4 time frame, 1st resistance at 137.506
- H4 time frame, 1st support at 132.467
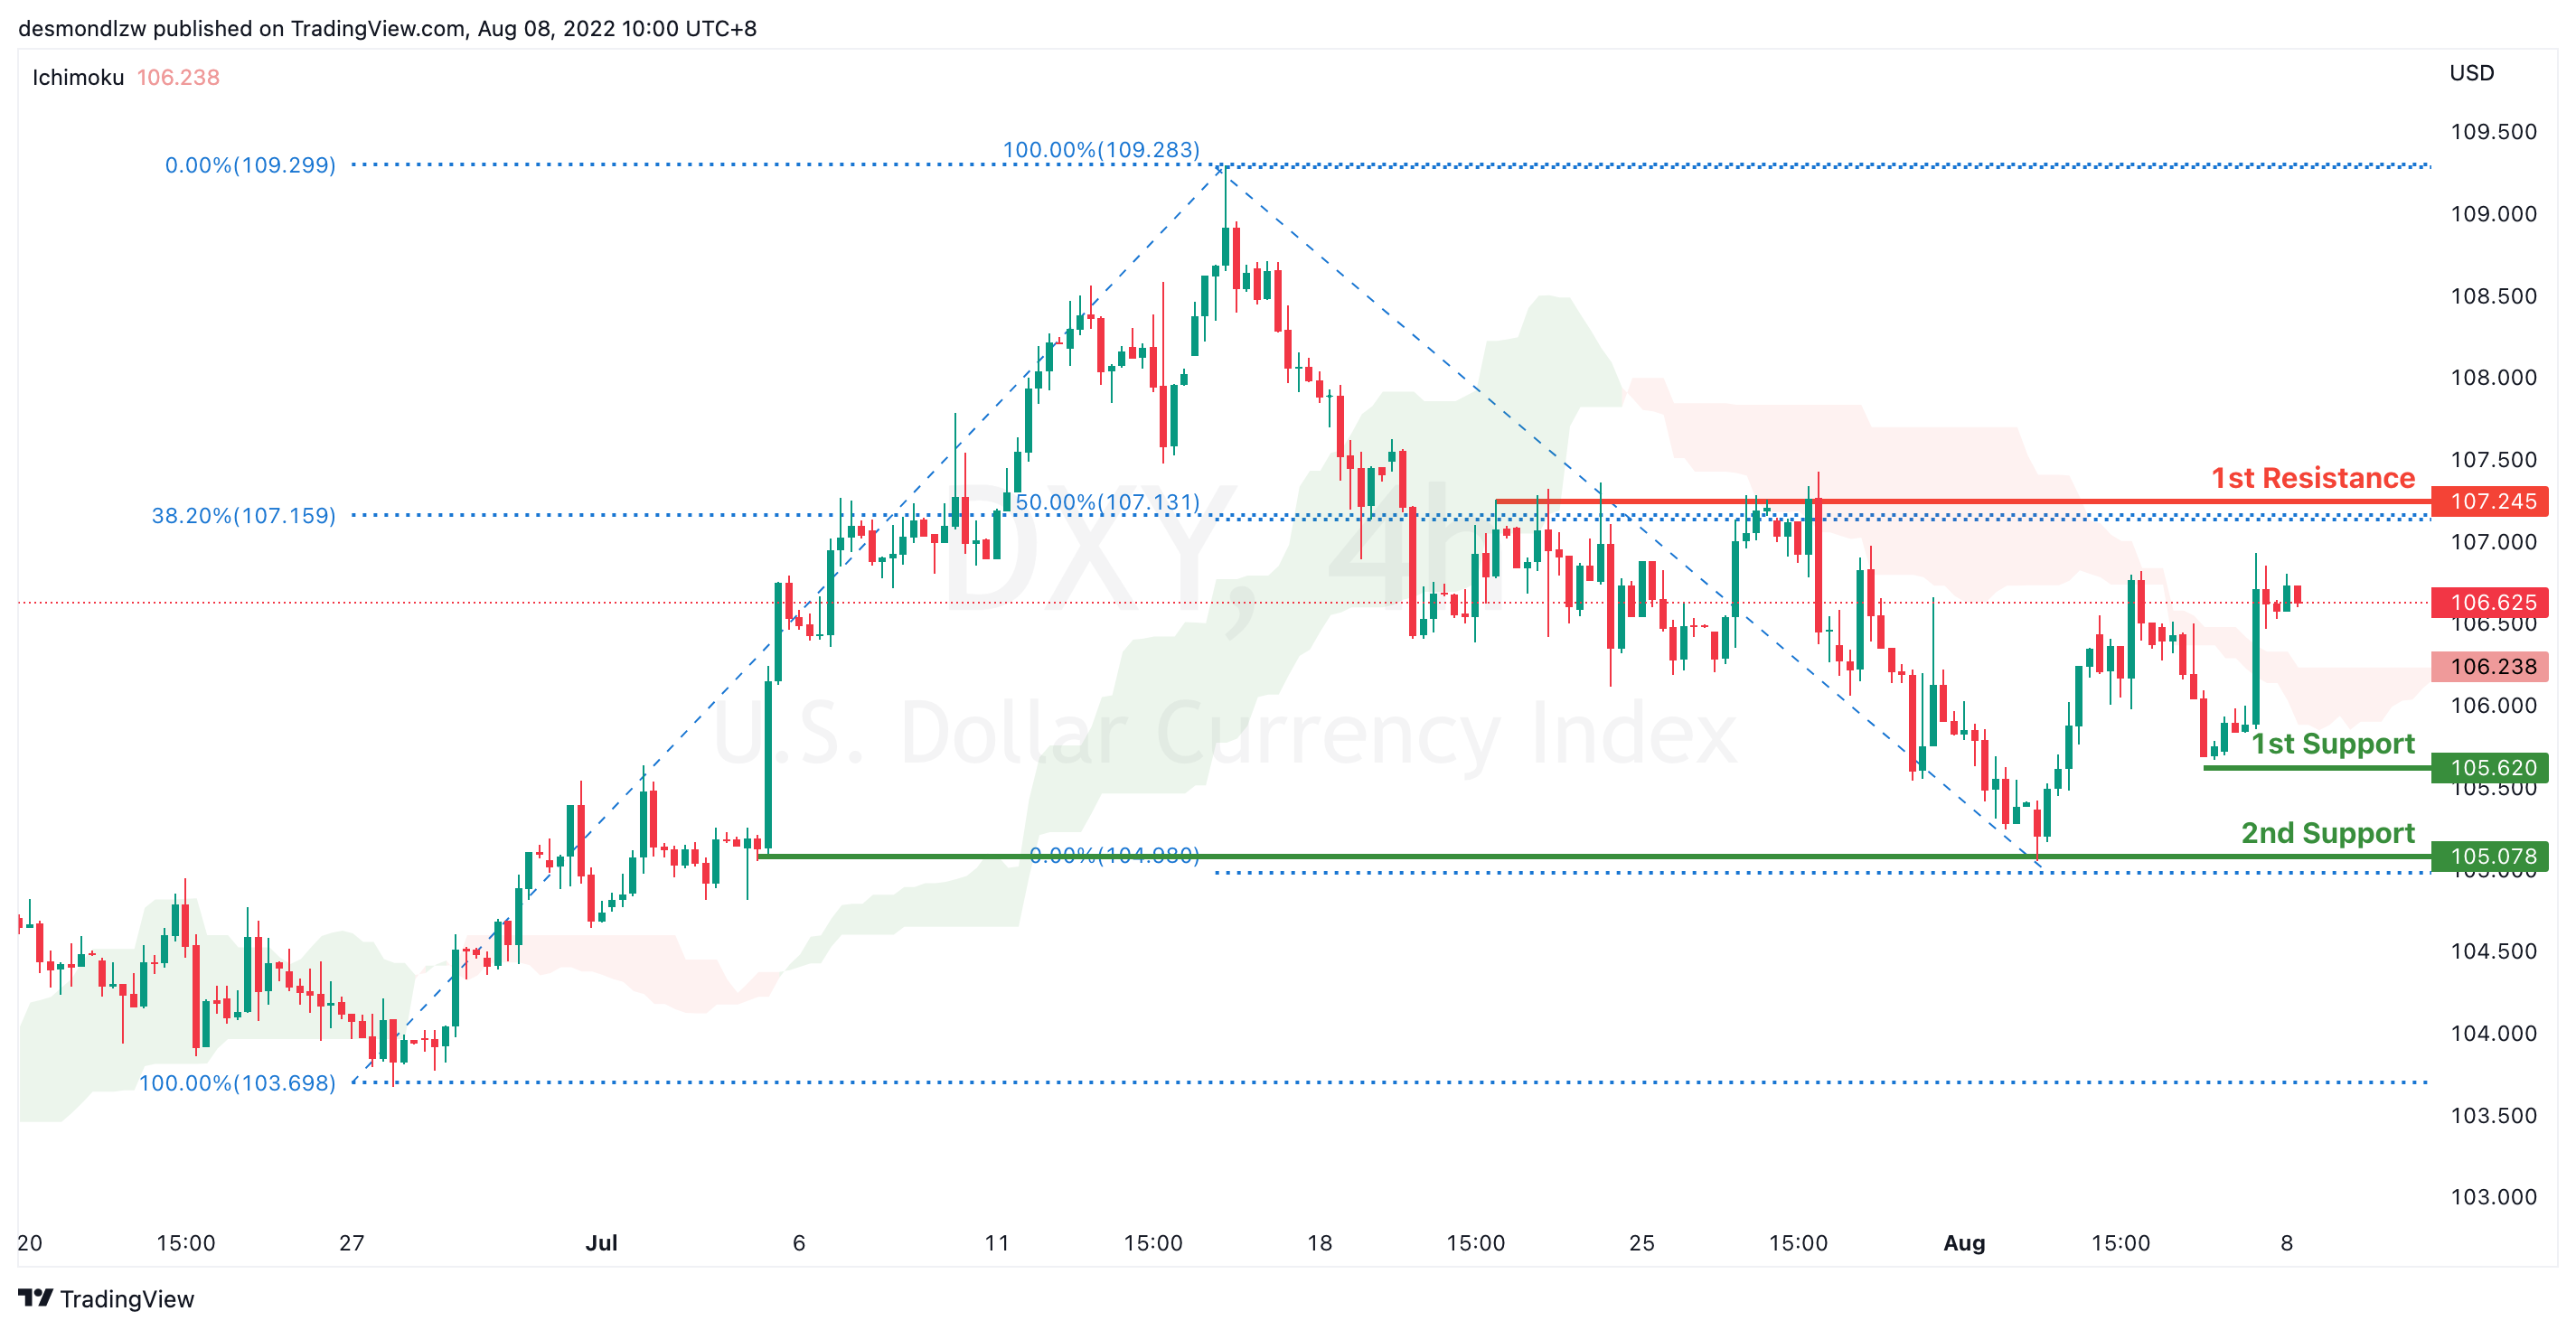
DXY:
On the H4, prices have broken the ascending trend into a bearish biased trend. Prices look like it’s pulling back to test at the first resistance 107.245 where the 38.2% Fibonacci retracement sits. If prices break the first resistance it will confirm a bullish momentum and prices will continue to move in an ascending trend. If prices movement continues in the descending trend, it will test at the first support 105.620 and then the second support at previous swing low 105.078
Areas of consideration:
- H4 time frame, 1st resistance at 107.245
- H4 time frame, 1st support at 105.620
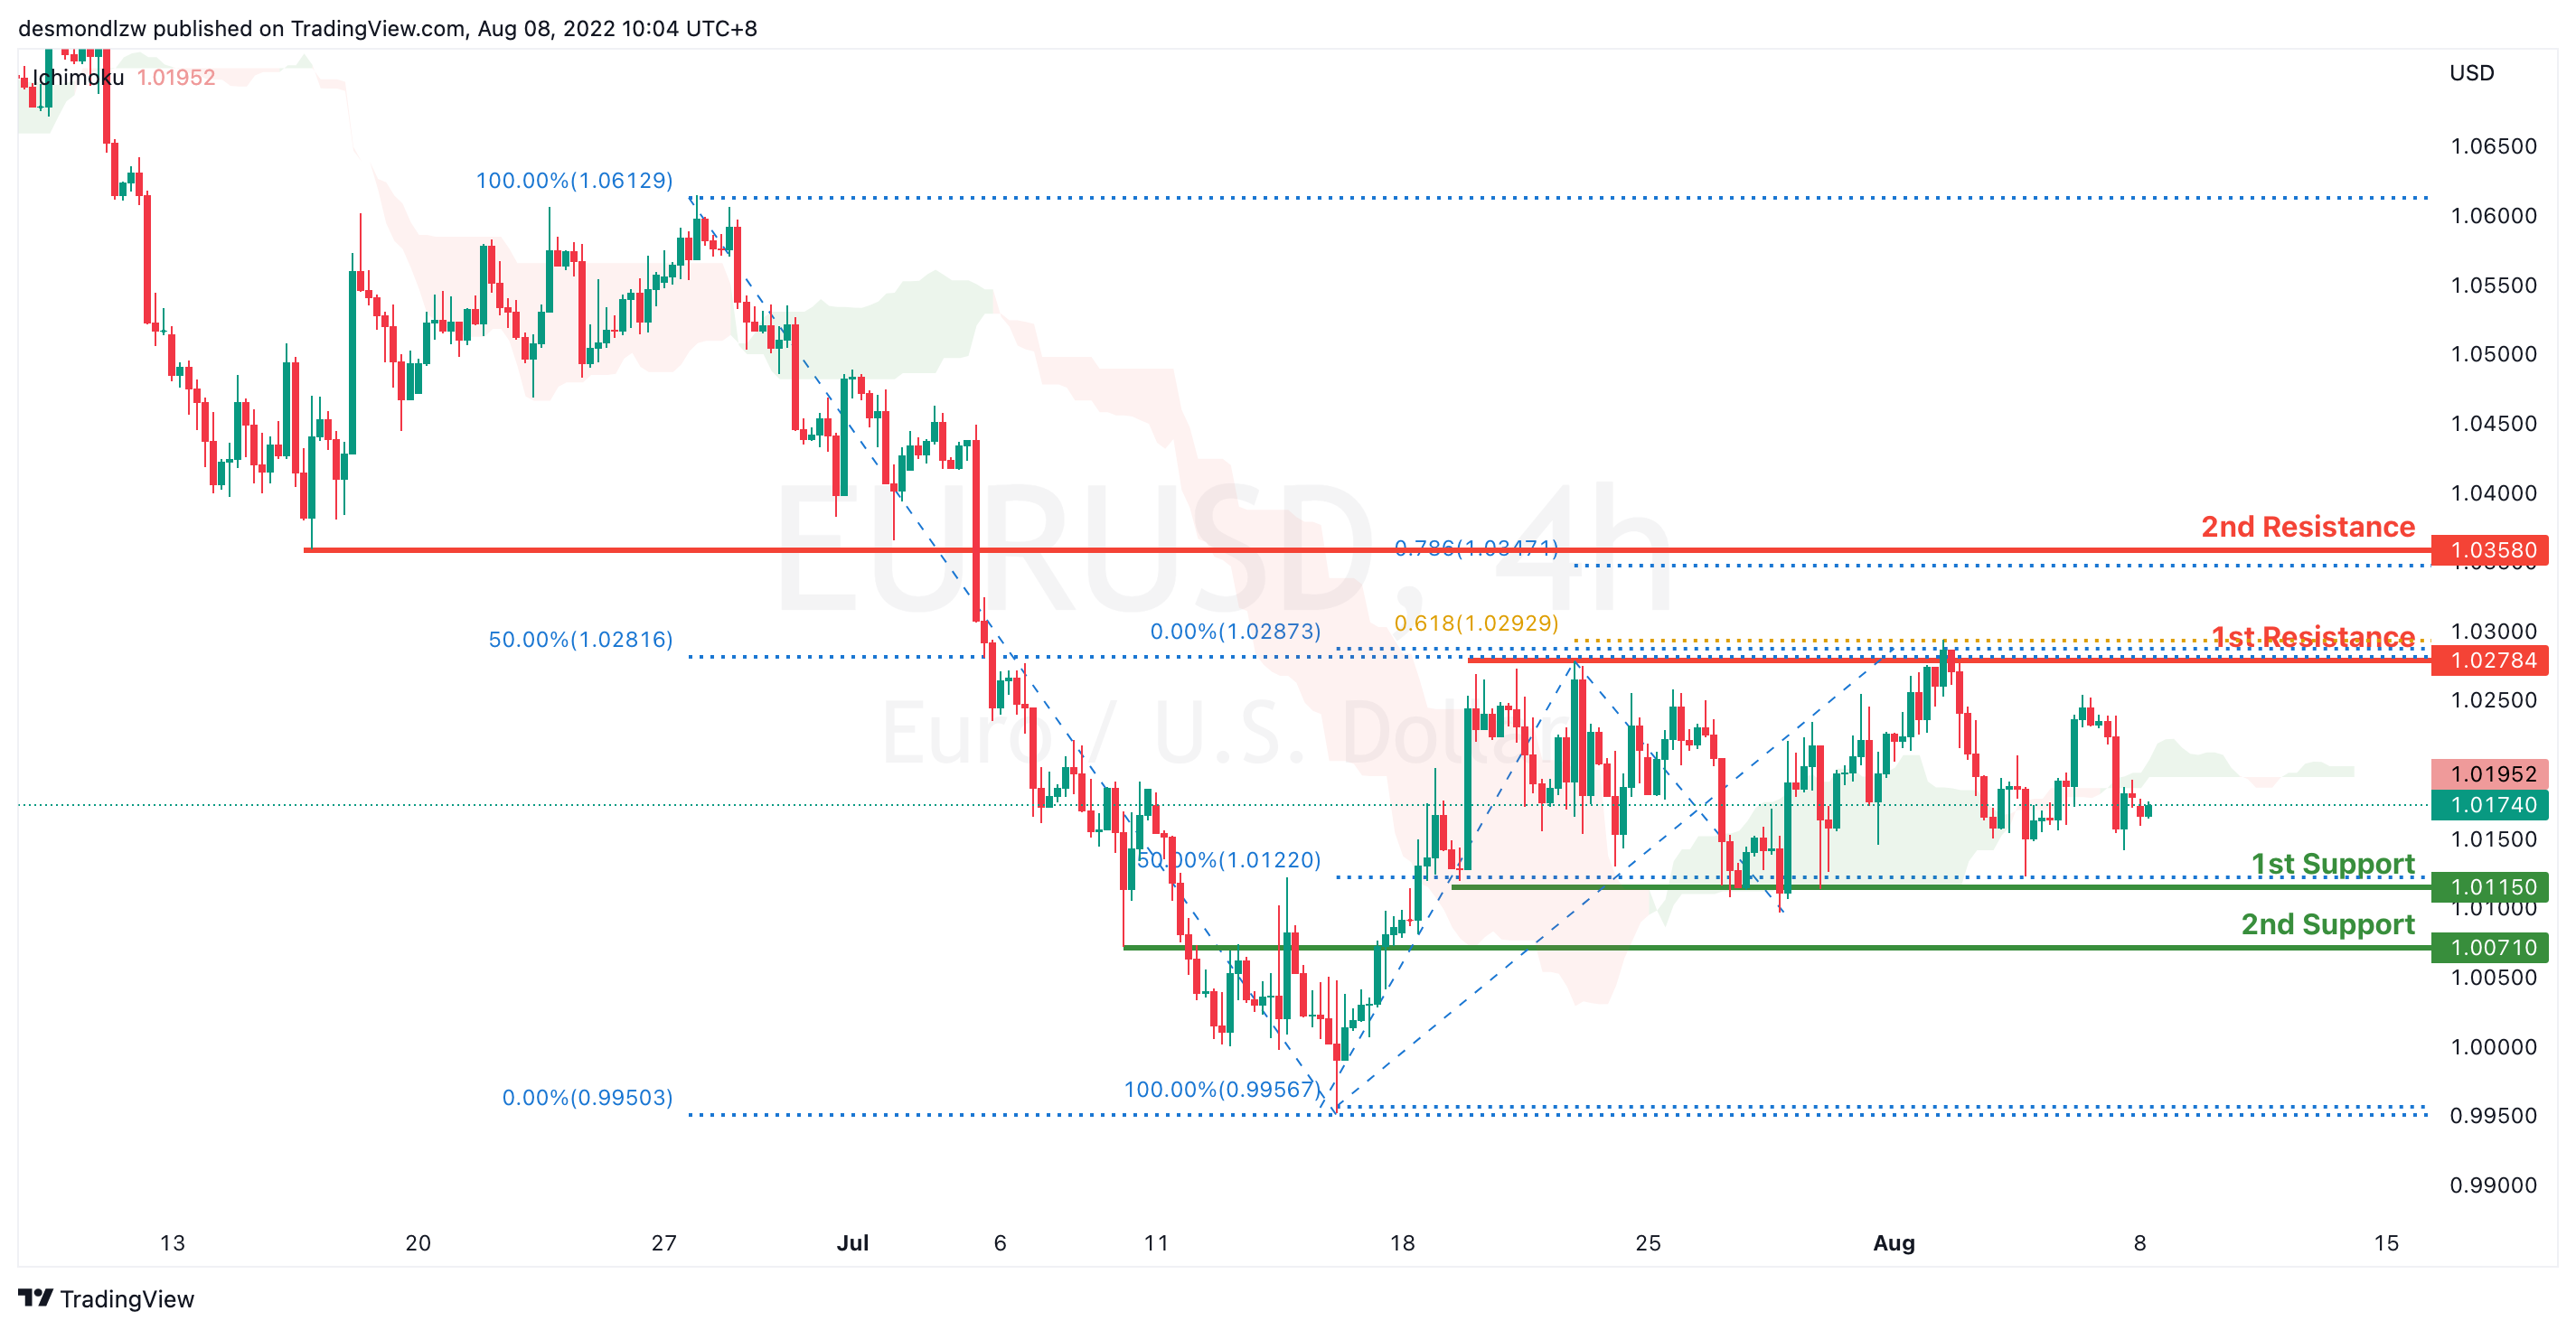
EUR/USD :
On the H4, prices have broken the bearish trend moving into a slightly bullish biased trend. Price is ranging and it seems like it’s going back to test the first support at 1.011. If prices breaks the first support, it will pull back further to test at 50% Fibonacci retracement. Alternatively, If price fails to break the first support, it will test the first resistance at 50% retracement and 61.8% fibonacci projection 1.027
Areas of consideration :
- H4 1st resistance at 1.027
- H4 1st support at 1.011
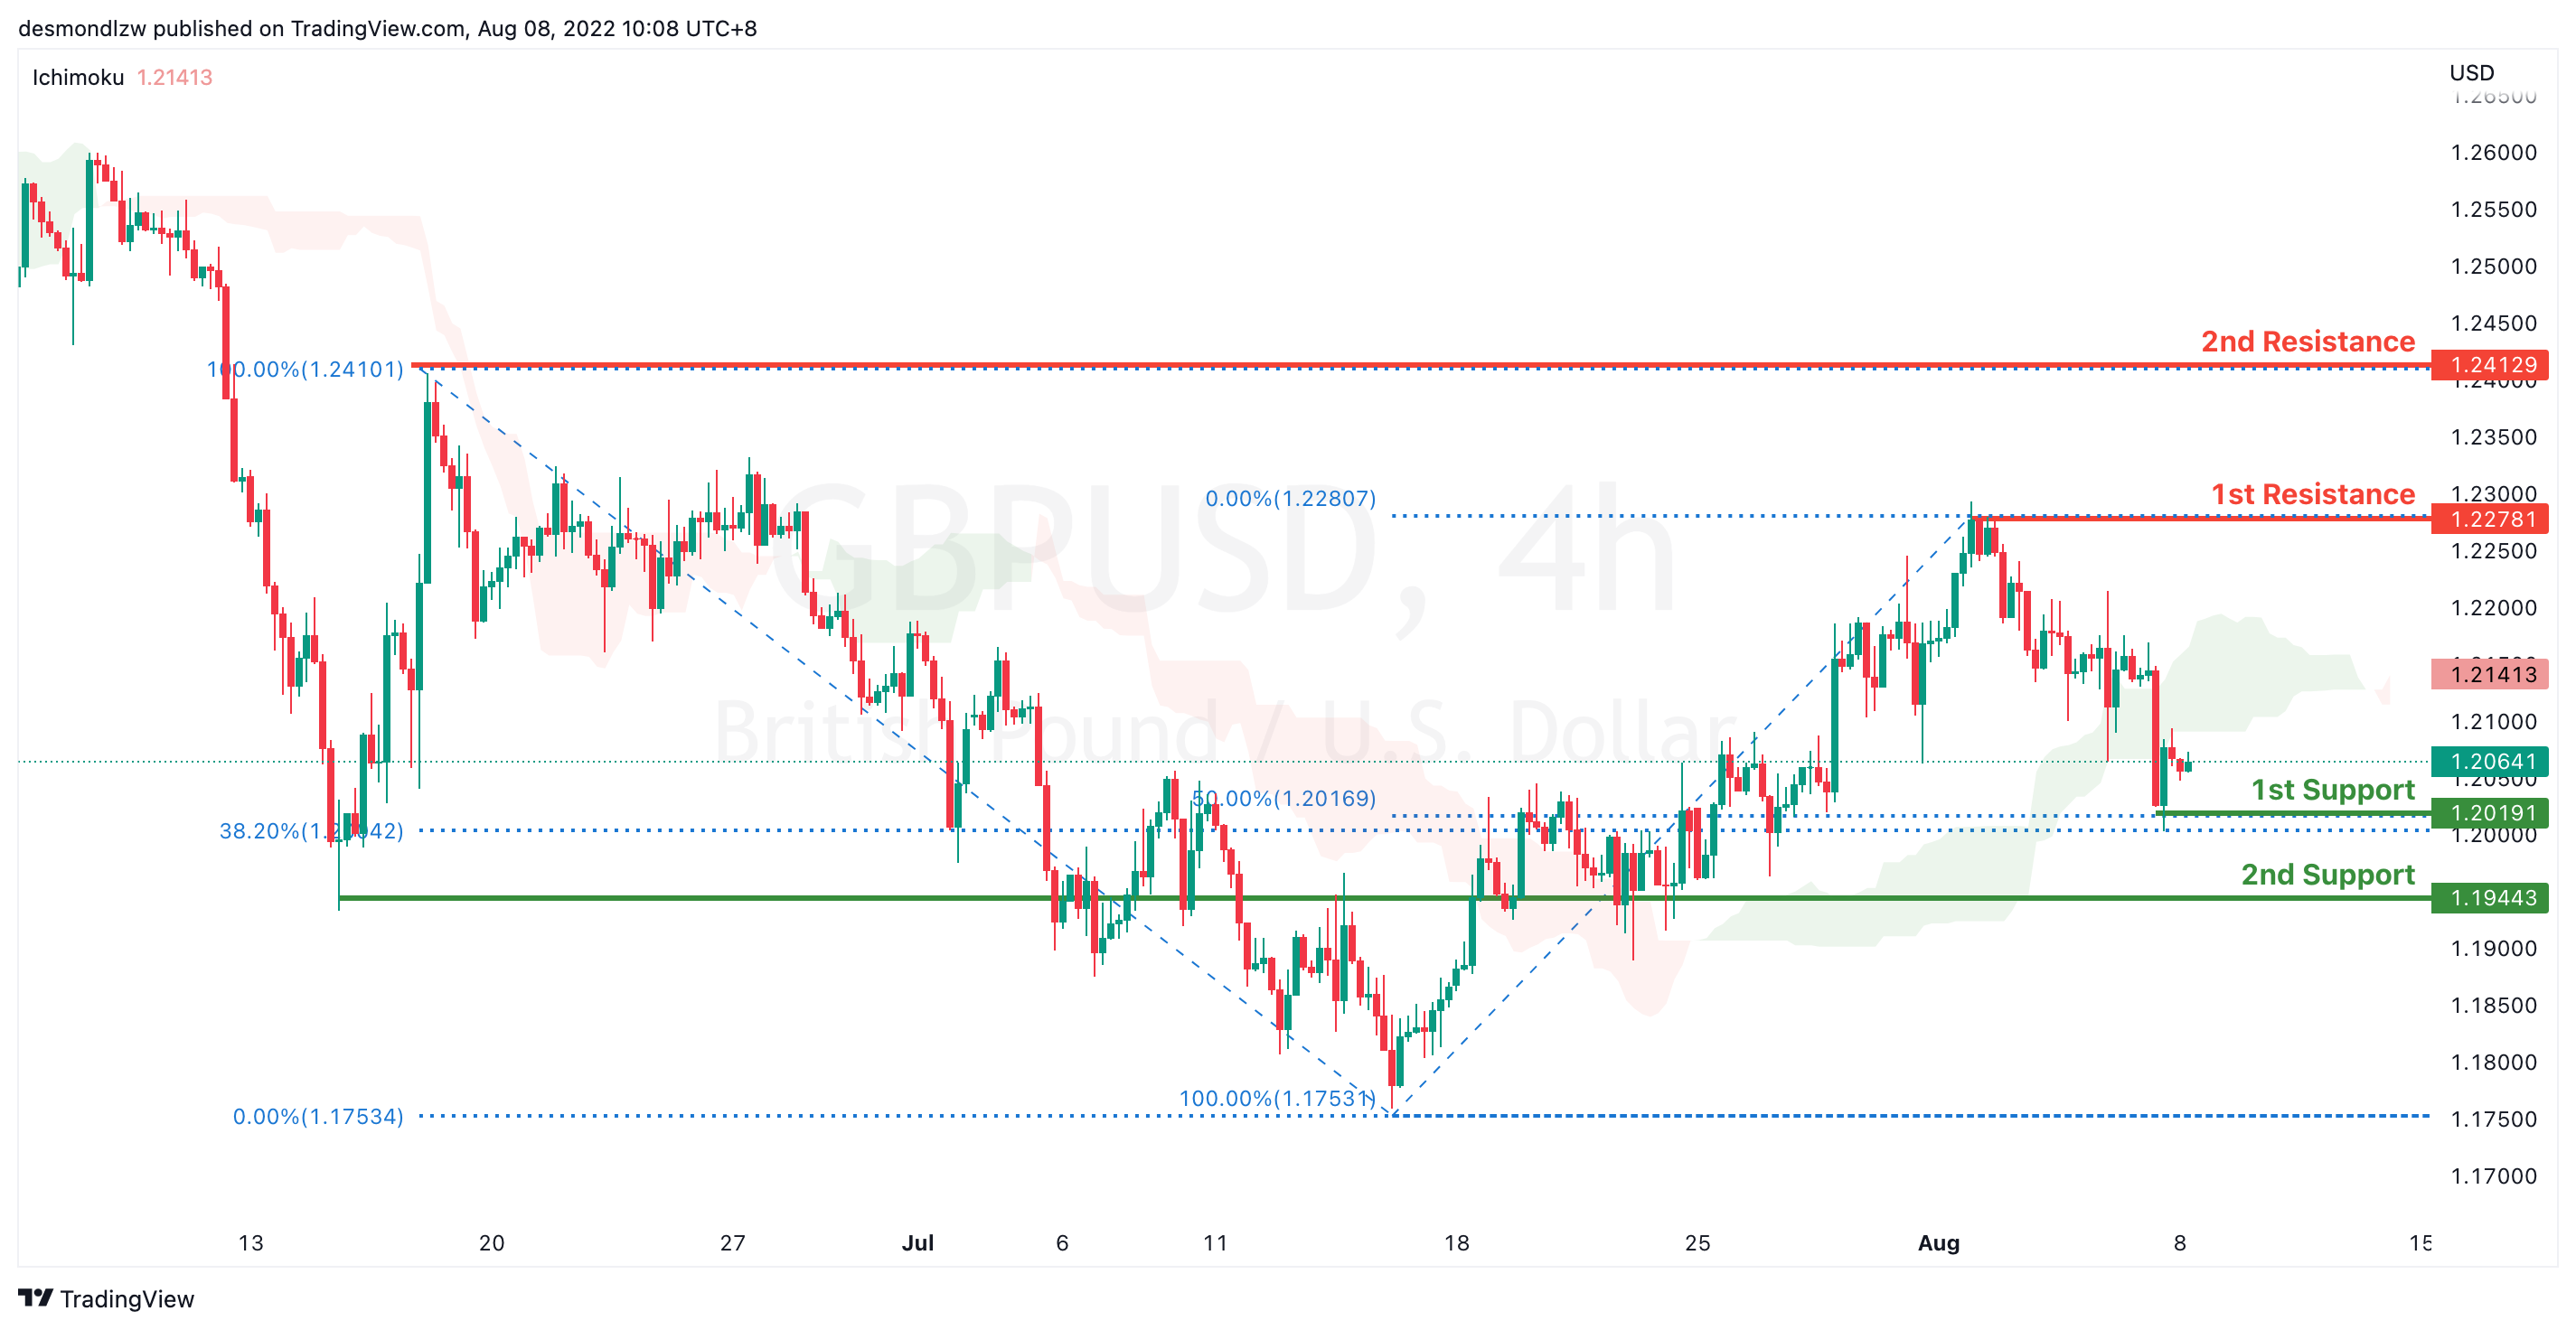
GBP/USD:
On the H4, with prices breaking the ascending channel we are now slightly bearish biased. Price is now testing the first support at 1.208 which coincides with 38.2% Fibonacci retracement. If price break supports and confirms downside trend, we would expect downside momentum to carry price to 2nd support at 1.194 61.8% Fibonacci retracement. Alternatively, price could bounce back to test at 78.6% Fibonacci retracement at 1.227
Areas of consideration:
- H4 1st resistance at 1.227
- H4 1st support at 1.2106
USD/CHF:
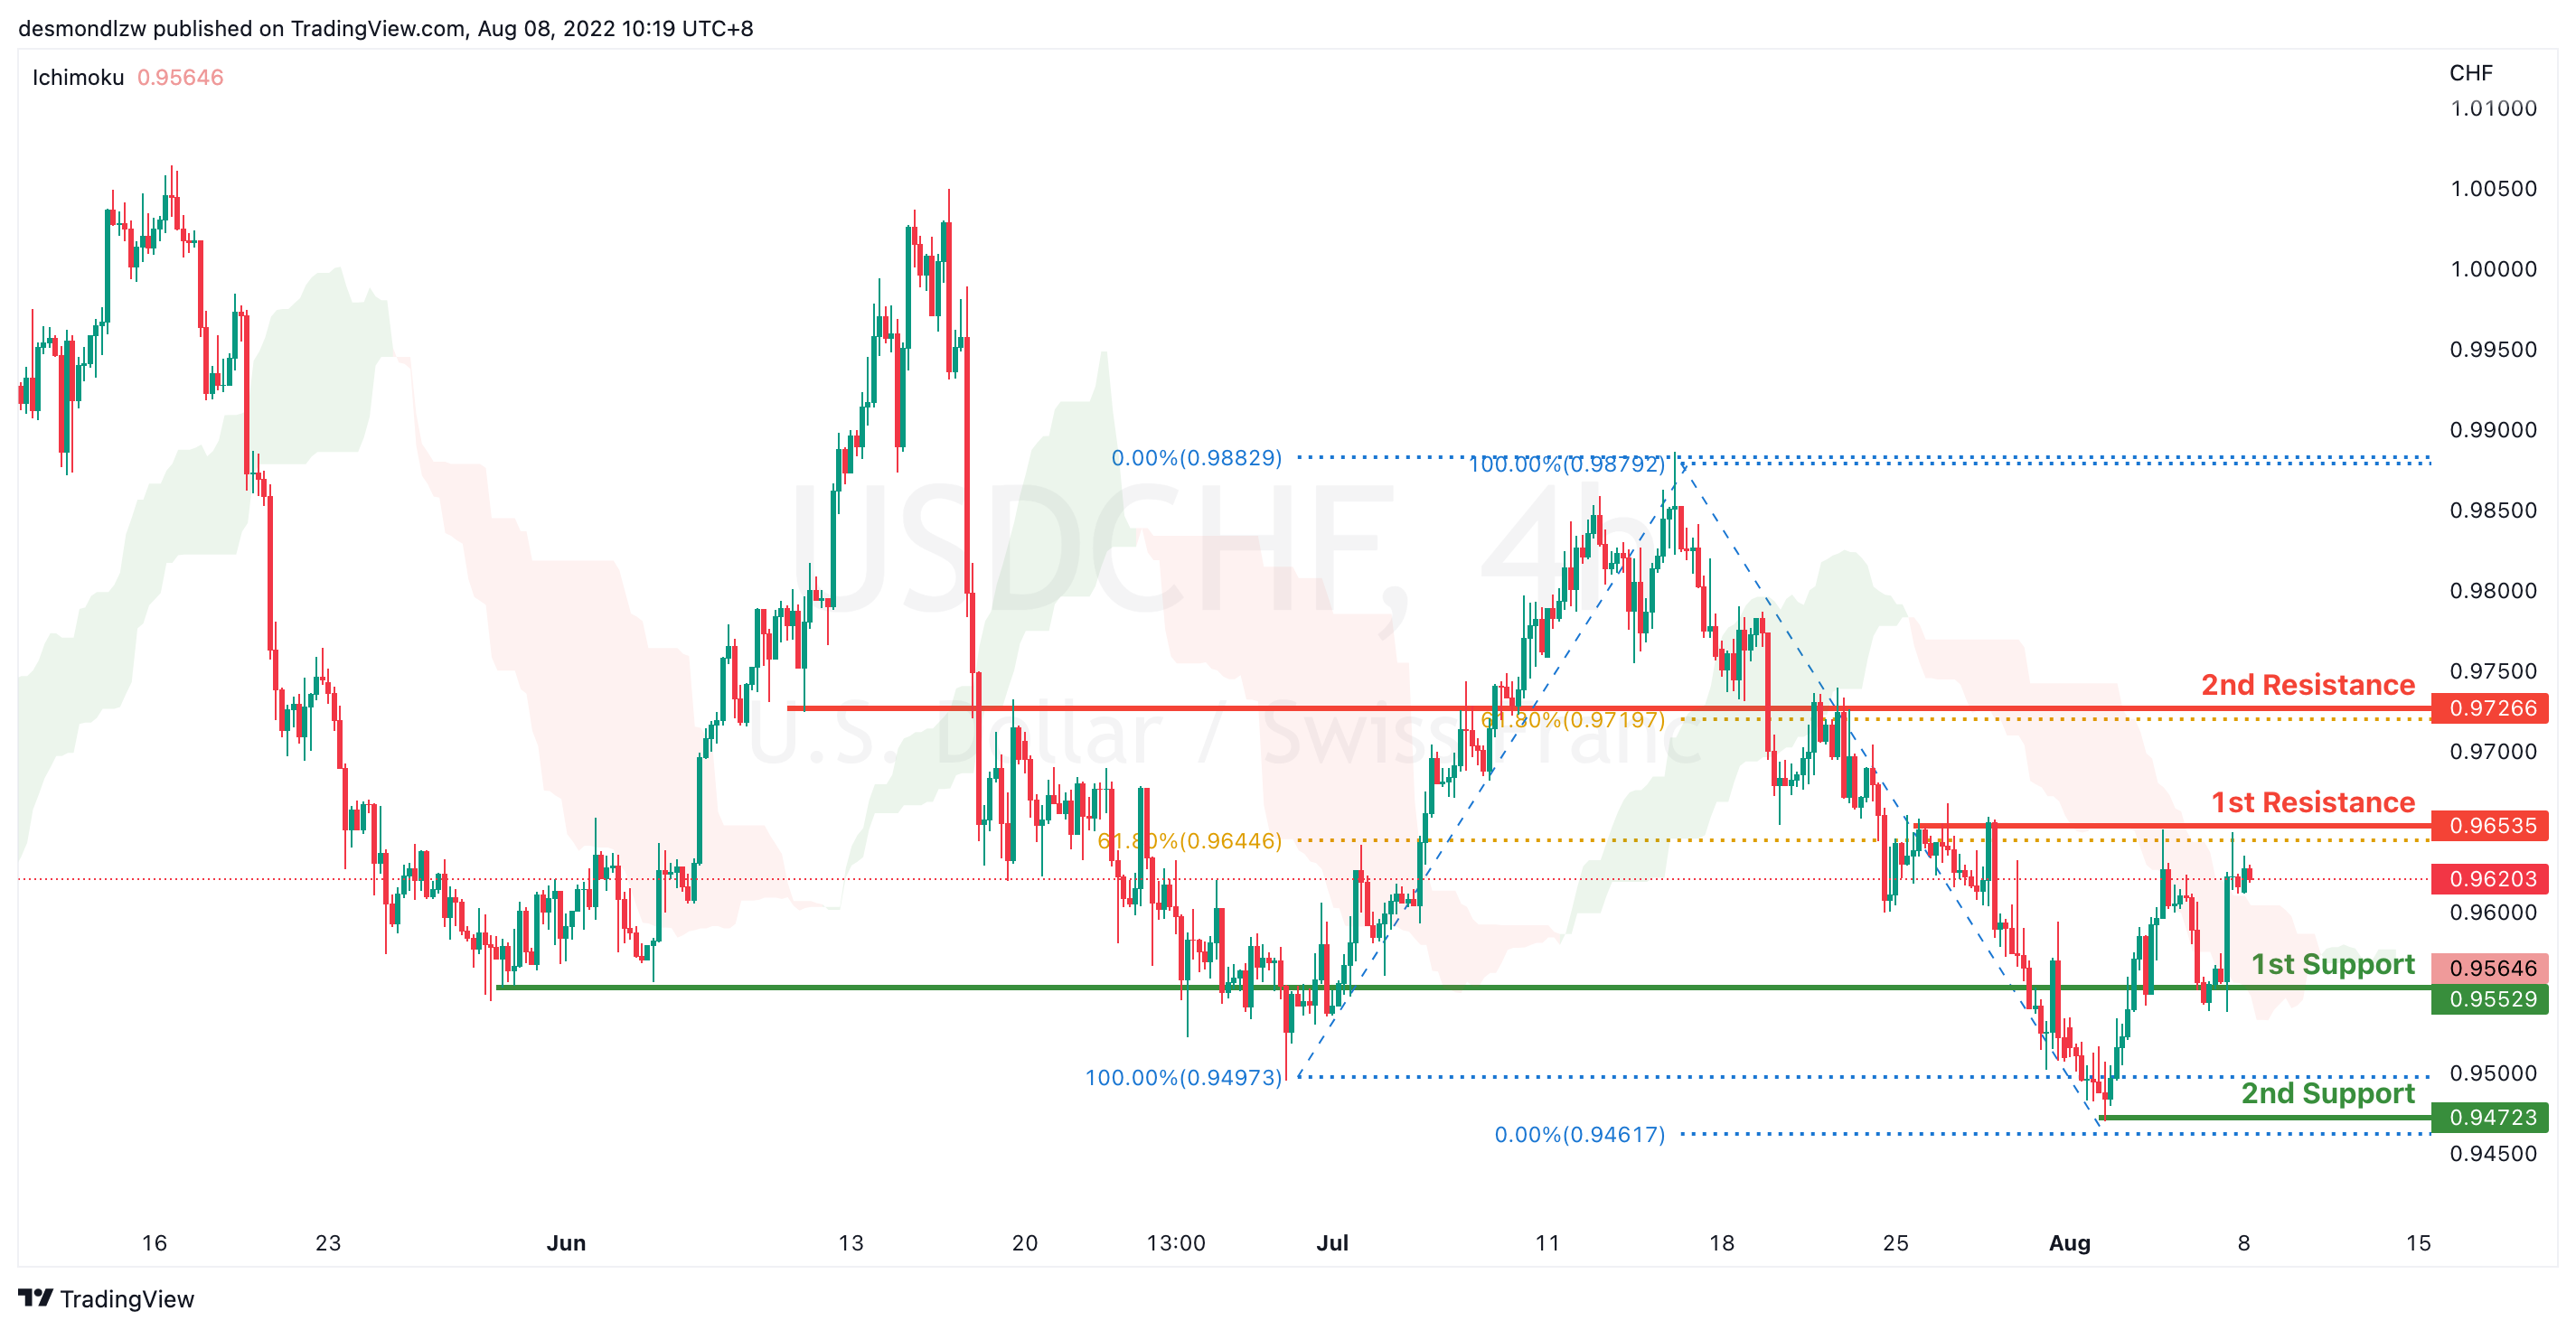
On the H4, prices have signalled a slightly bearish momentum. It has rejected the 1st resistance at 0.966 which is also the 50% Fibonacci retracement to test at the 1st support 0.955 23.6% fibonacci retracement. If prices break this key level, it will pull back further to test at the second support at 0.947. Alternatively price could bounce back to test at 1st resistance 0.965 subsequently the second resistance at 0.97266
Areas of consideration
- H4 1st resistance at 0.965
- H4 1st support at 0.955
XAU/USD (GOLD):
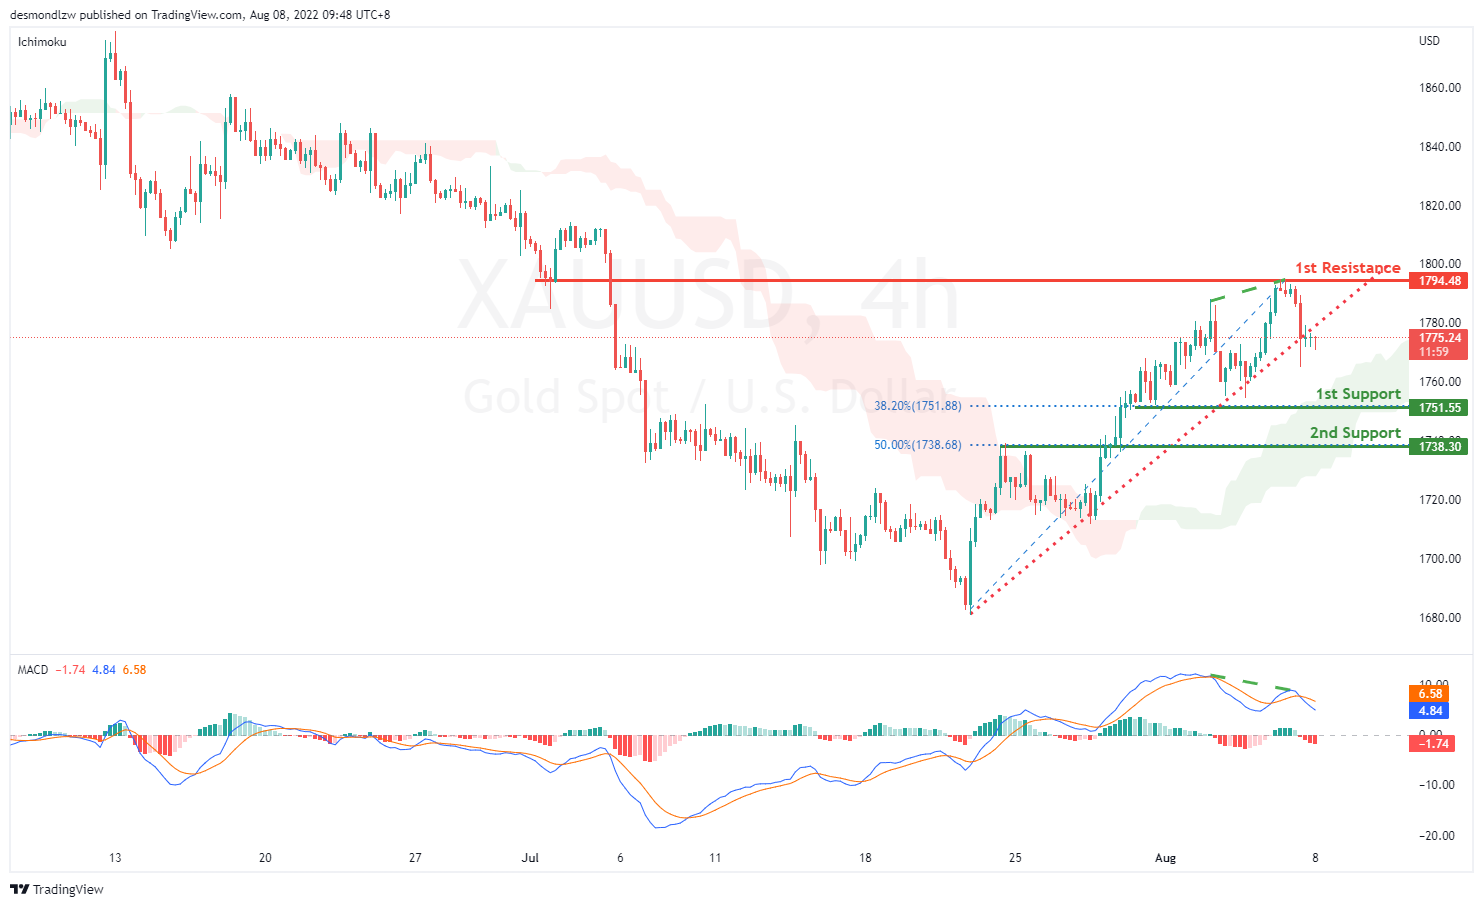
On the H4, with prices breaking the ascending trendline, and the price and MACD is showing a bearish divergence, we have a bearish bias that the price may drop to the 1st support at 1751.55, which is in line with the 38.2% fibonacci retracement. If the price continues going down, it may drop to 2nd support at 1738.30, which is in line with 50% fibonacci retracement. Alternatively, prices may rise to 1st resistance at 1794.48,,which is in line with the swing high.
Areas of consideration:
- H4 time frame, 1st support at 1751.55
- H4 time frame, 2nd support at 1738.30
AUD/USD:
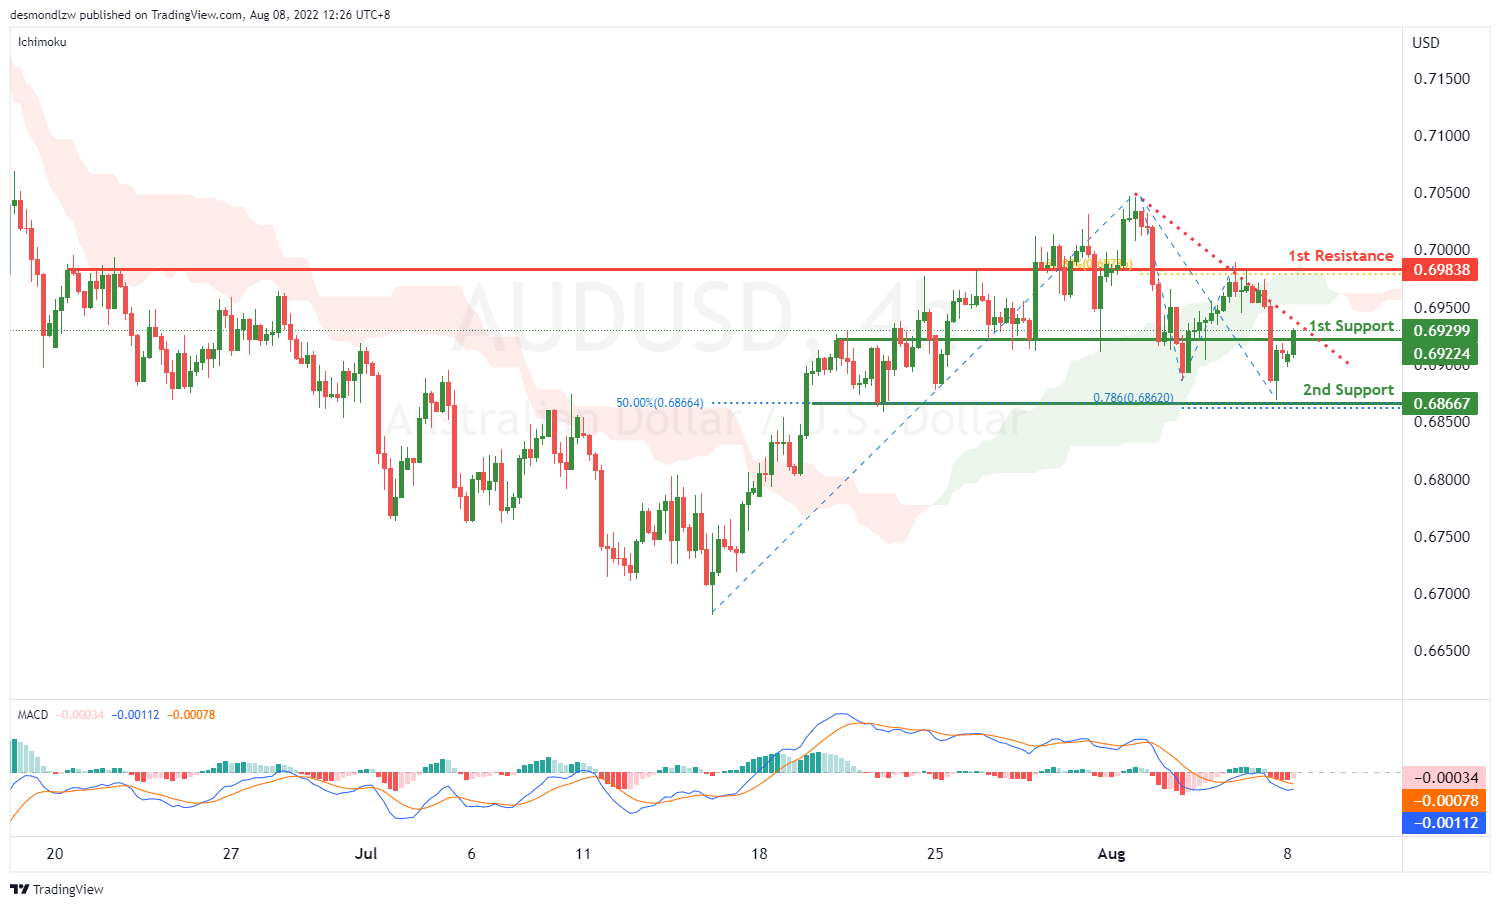
On the H4, with price going along the descending trendline, below the ichimoku cloud and the DIF line is breaking below the signal line in MACD, we have a bearish bias that price may drop from the 1st support at 0.69224, where the pullback support is to the 2nd support at 0.68667 where the 50% fibonacci retracement and 78.6% fibonacci projection are. Alternatively, price may rise to the 1st resistance at 0.69838 which is in line with 61.8% fibonacci retracement and swing highs.
Areas of consideration
- H4 1st support at 0.69224
- H4 2nd support at 0.68667
NZD/USD:
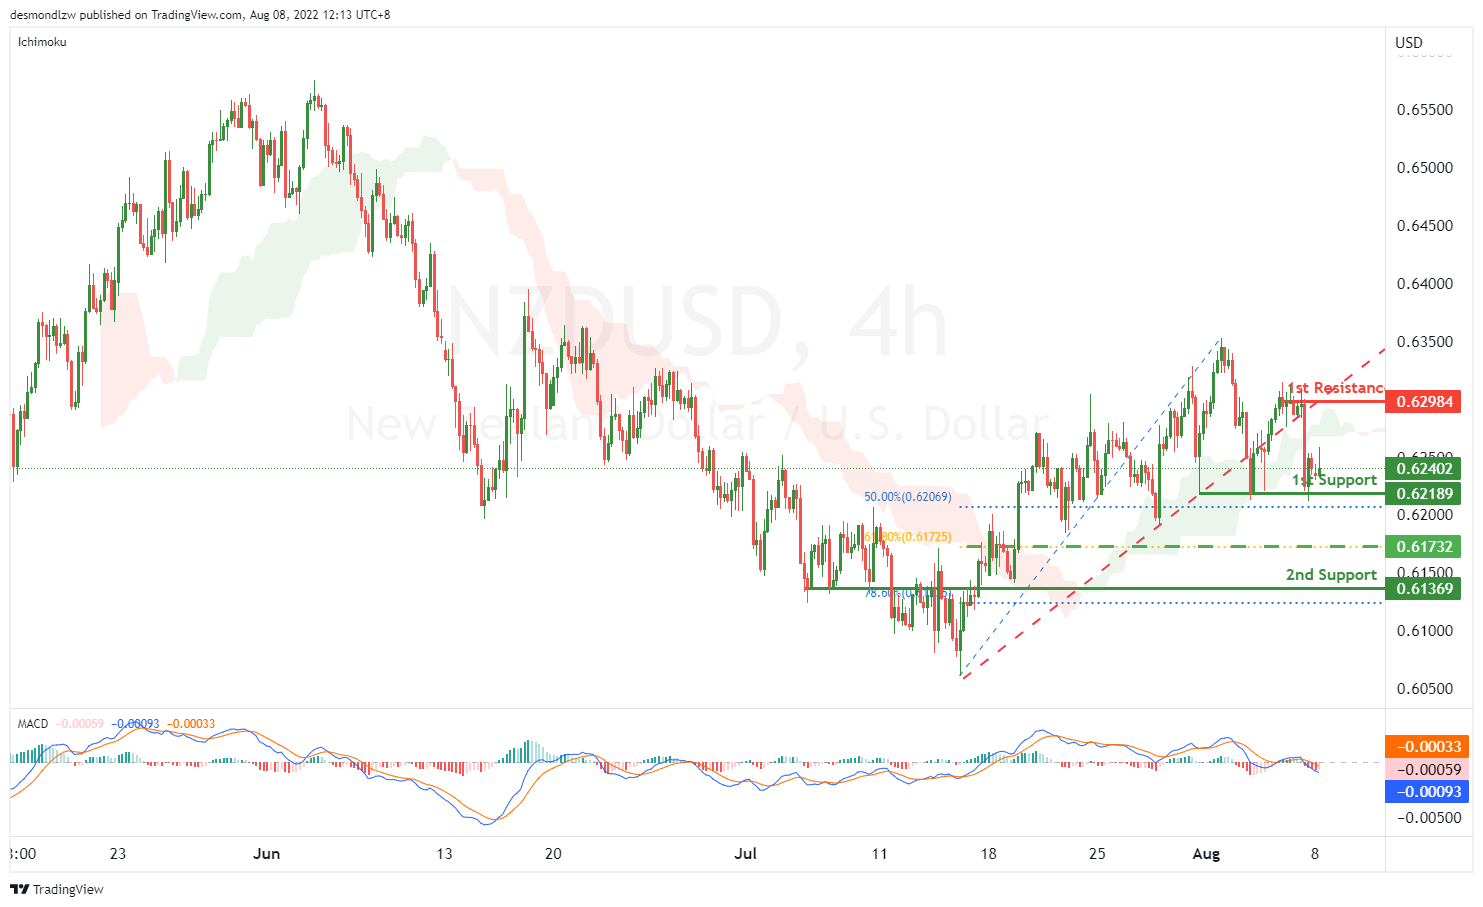
On the H4, with price breaking the ascending trendline, the DIF line is breaking the signal line, we have a bearish bias that price may rise from the 1st support at 0.62189 where overlap support and 50% fibonacci retracement to the 2nd support at 0.61369 where 78.6% fibonacci retracement is. Alternatively, price may reverse off the 1st support and rise to 1st resistance at 0.62984 where the swing high resistance is. Take note the price of 0.61732 could be our intermediate support, which is in line with 61.8% fibonacci retracement.
Areas of consideration:
- H4 time frame, 1st support at 0.62189
- H4 time frame, 2nd support at 0.61369
USD/CAD:
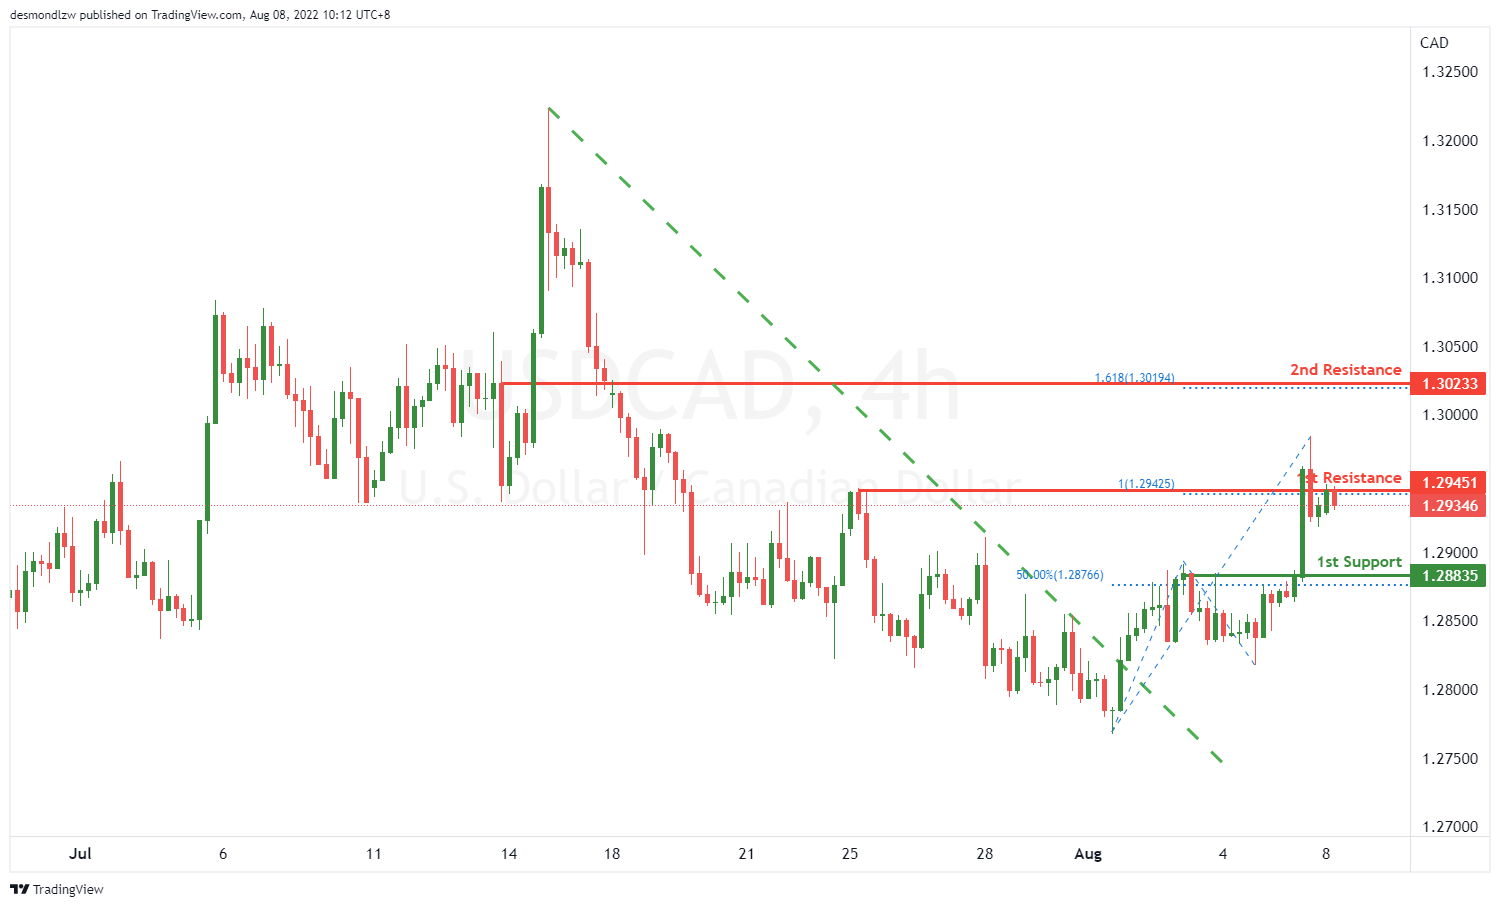
On the H4, with the price breaking the descending trendline and below ichimoku cloud, we have a bullish bias that the price may rise from our 1st resistance at 1.29451, which is in line with 100% fibonacci projection to our 2nd resistance at 1.30233, which is in line with the 161.8% fibonacci projection. Alternatively, the price may drop to the 1st support at 1.28835, which is in line with 50% fibonacci retracement and pullback support.
Areas of consideration:
- H4 time frame, 1st resistance at 1.29451
- H4 time frame, 2nd resistance at 1.30233
OIL:
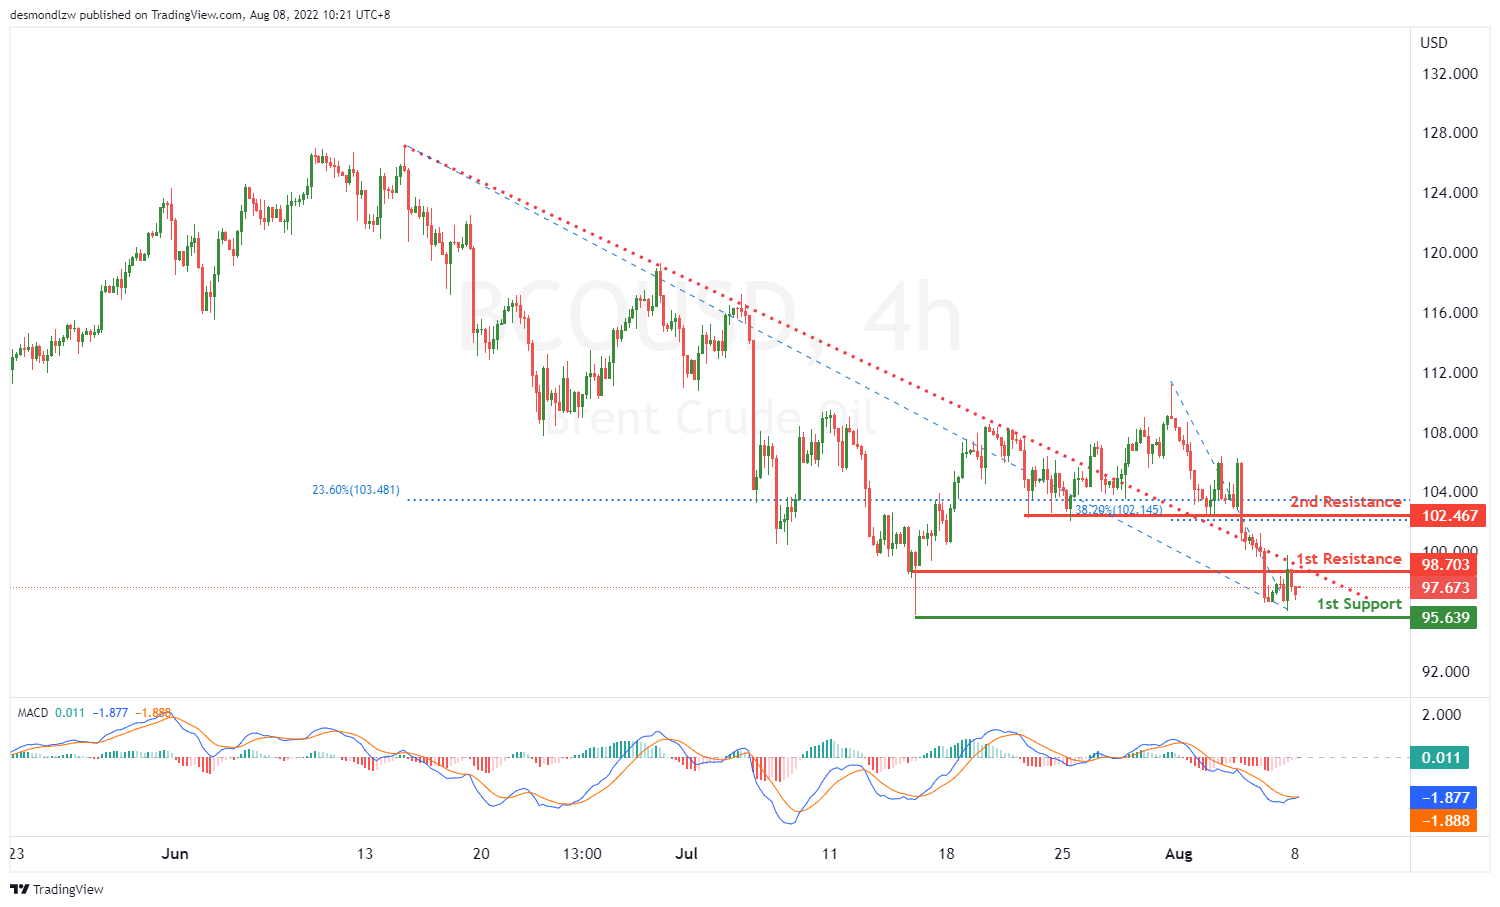
On the H4, with price almost touching the descending trendline, and the histogram of MACD is decreasing under zero while the DIF is breaking the DEA, we have a bullish bias that the price may rise from our 1st resistance at 98.703, which is in line with the overlap resistance to the 2nd resistance at 102.467, which is in line with the 23.6% fibonacci retracement and 38.2% fibonacci retracement. Otherwise, the price may drop to our 1st support at 95.639, where the swing low support is.
Areas of consideration:
- H4 time frame, 1st resistance at 98.703
- H4 time frame, 2nd resistance at 102.467
Dow Jones Industrial Average:
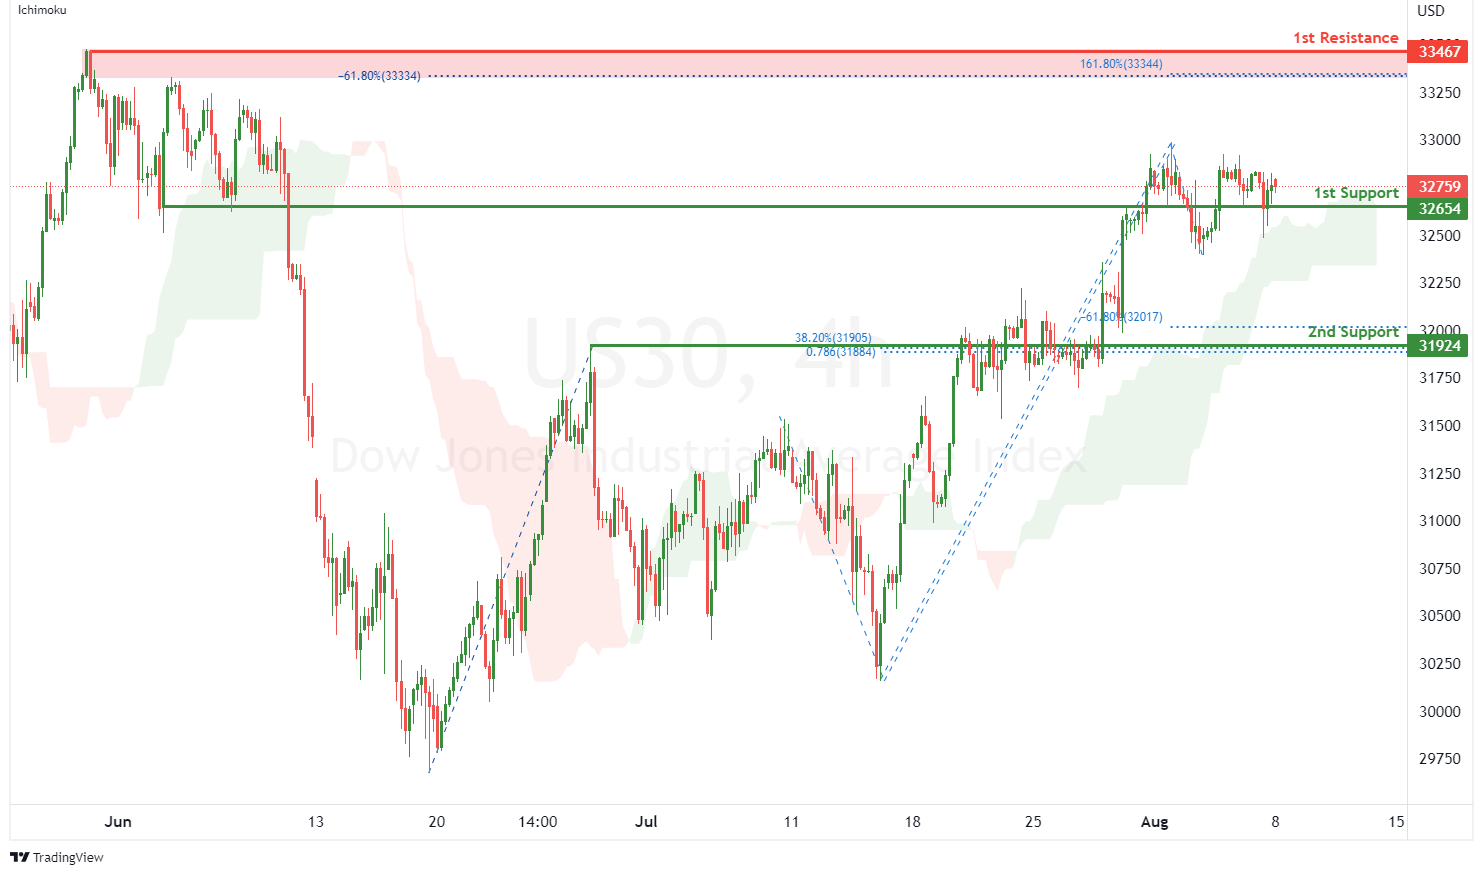
On the H4, with price moving above the ichimoku indicator, we have a bullish bias that price will rise from the 1st support at 32654 where the pullback support is to the 1st resistance at 33467 where the swing high resistance, 161.8% fibonacci extension and -61.8% fibonacci expansion are. Alternatively, price could break 1st support structure and drop to 2nd support at 31924 where the pullback support, -61.8% fibonacci expansion, 38.2% fibonacci retracement and 78.6% fibonacci projection are.
Areas of consideration:
- H4 time frame, 1st resistance of 33467
- H4 time frame, 1st support at 32654
DAX:
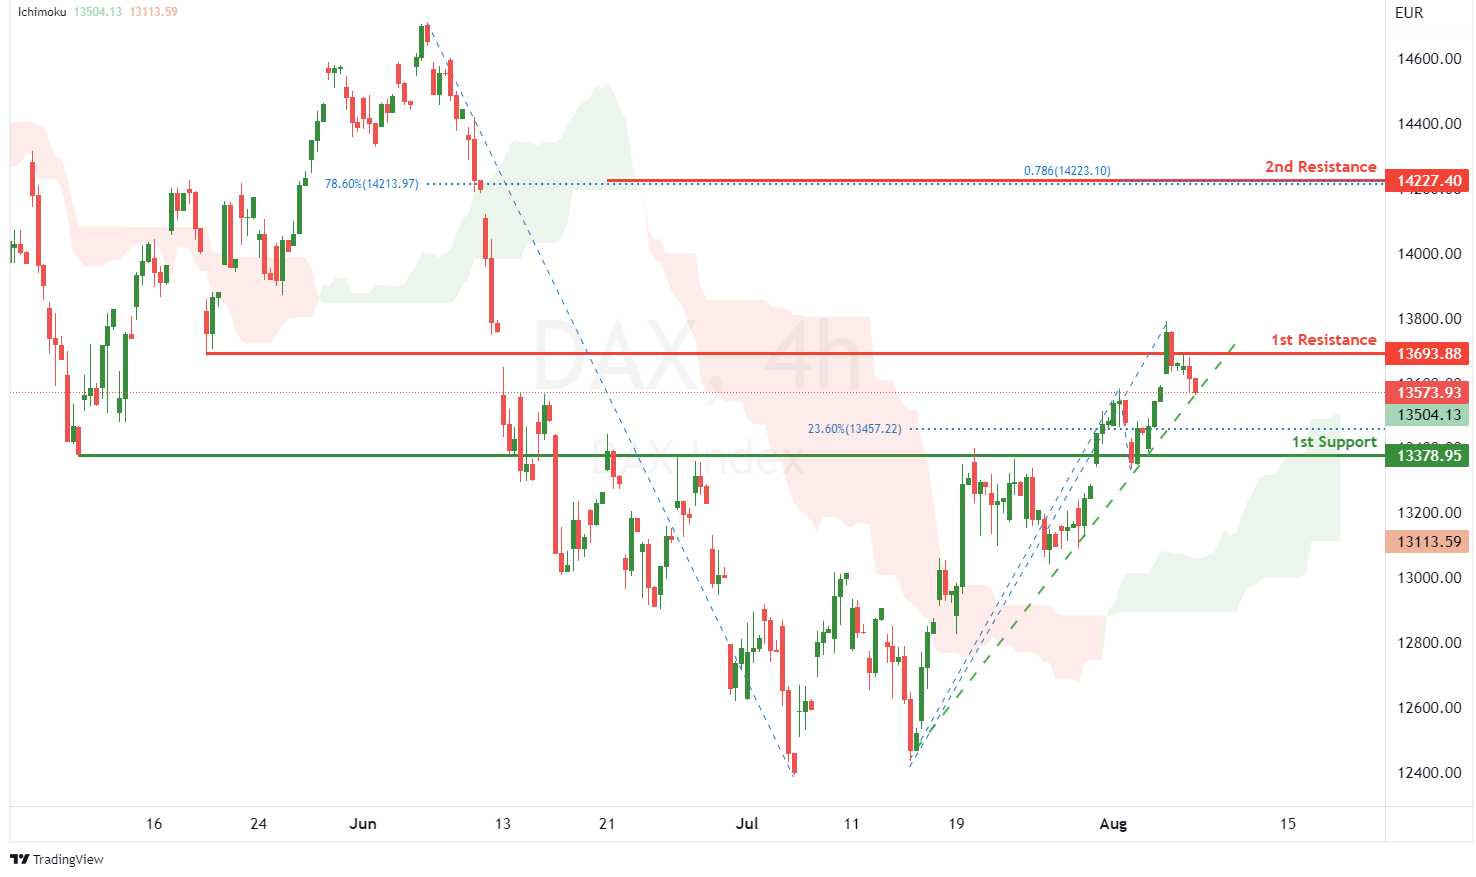
On the H4, with price moving above the ichimoku indicator and along the ascending trendline, we have a bullish bias that price will rise to 1st resistance at 13693.88 where the pullback resistance is. Once there is upside confirmation of price breaking 1st resistance structure, we would expect bullish momentum to carry price to 2nd resistance at 14227.40 in line with 78.6% fibonacci projection and 78.6% fibonacci retracement. Alternatively, price could drop to 1st support at 13378.95 where the overlap support and 23.6% fibonacci retracement are.
Areas of consideration:
- H4 time frame, 1st resistance of 13693.88
- H4 time frame, 1st support at 13378.95
ETHUSD:
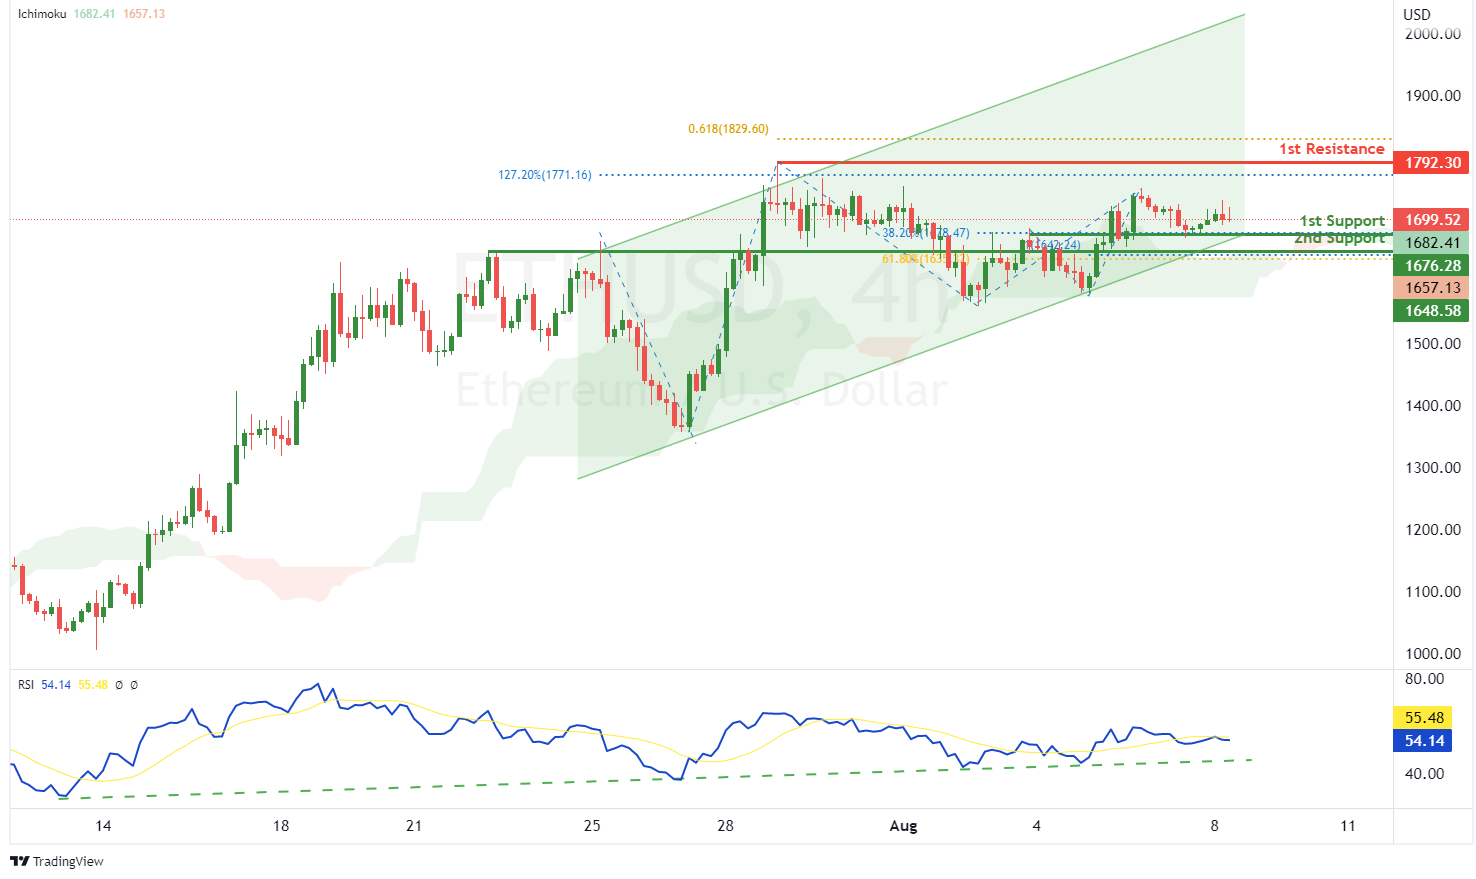
On the H4, with RSI moving along an ascending trendline and price moving within an ascending channel as well as above the ichimoku indicator, we have a bullish bias that price will rise from 1st support at 1676.28 where the pullback support and 38.2% fibonacci retracement are to the 1st resistance at 1792.30 where the swing high resistance, 127.2% fibonacci extension and 61.8% fibonacci projection are. Alternatively, price could break 1st support and drop to 2nd support at 1648.58 where the overlap support, 61.8% fibonacci retracement and 100% fibonacci projection are.
Areas of consideration:
- H4 time frame, 1st resistance of 1792.30
- H4 time frame, 1st support at 1676.28
BTCUSD:
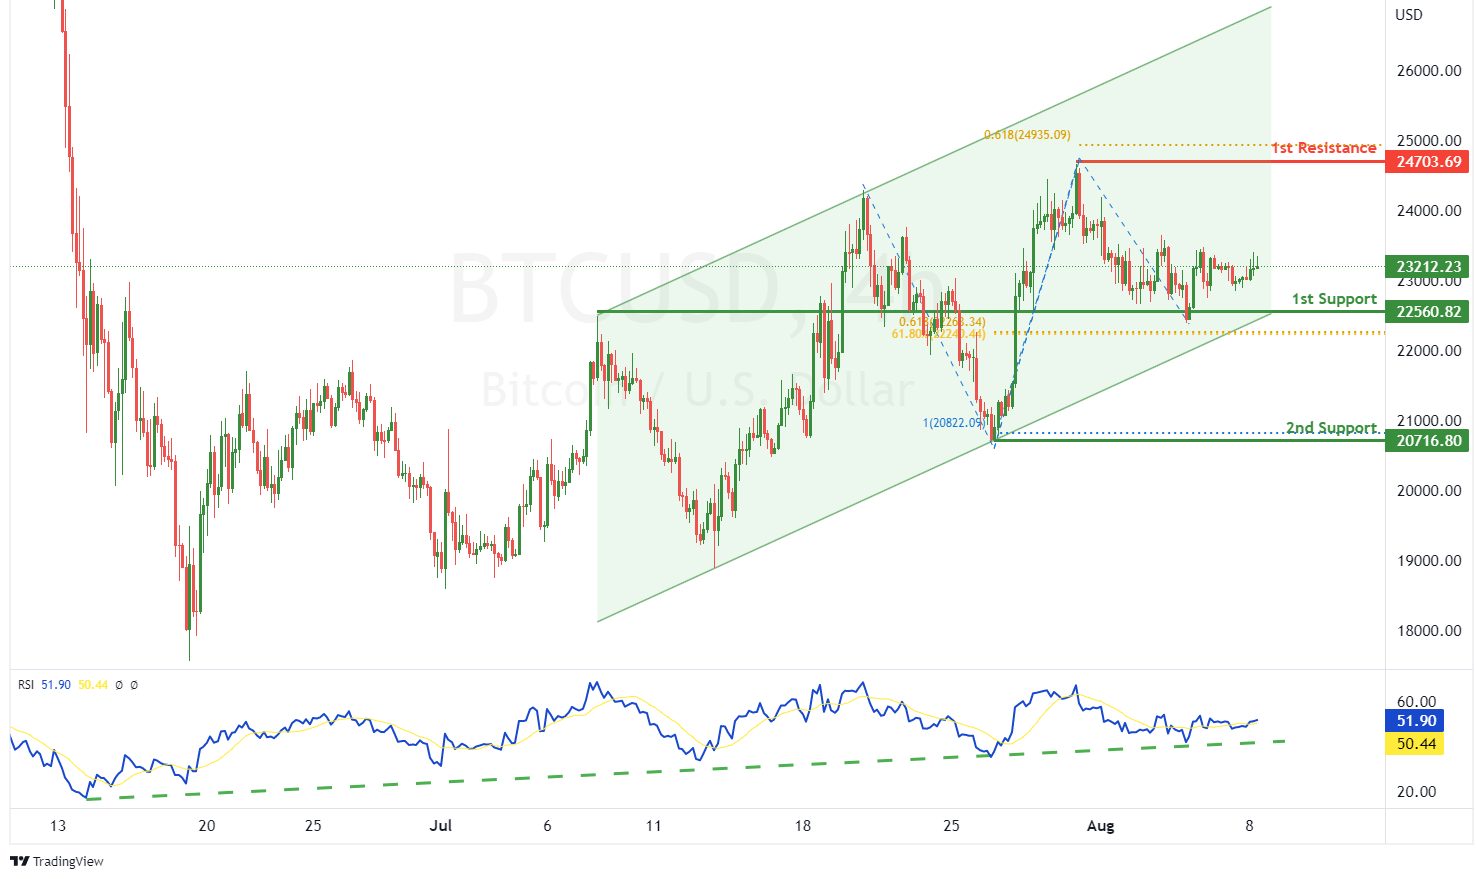
On the H4, with price moving within a bullish channel and RSI moving along an ascending trendline, we have a bullish bias that price will rise from our 1st support at 22560.82 where the pullback support, 61.8% fibonacci retracement and 61.8% fibonacci projection are to the 1st resistance at 24703.69 where the swing high resistance and 61.8% fibonacci projection are. Alternatively, price could break 1st support structure and drop to 2nd support at 20716.80 where the swing low support and 100% fibonacci projection are.
Areas of consideration:
- H4 time frame, 1st resistance of 24703.69
- H4 time frame, 1st support at 22560.82
S&P 500:
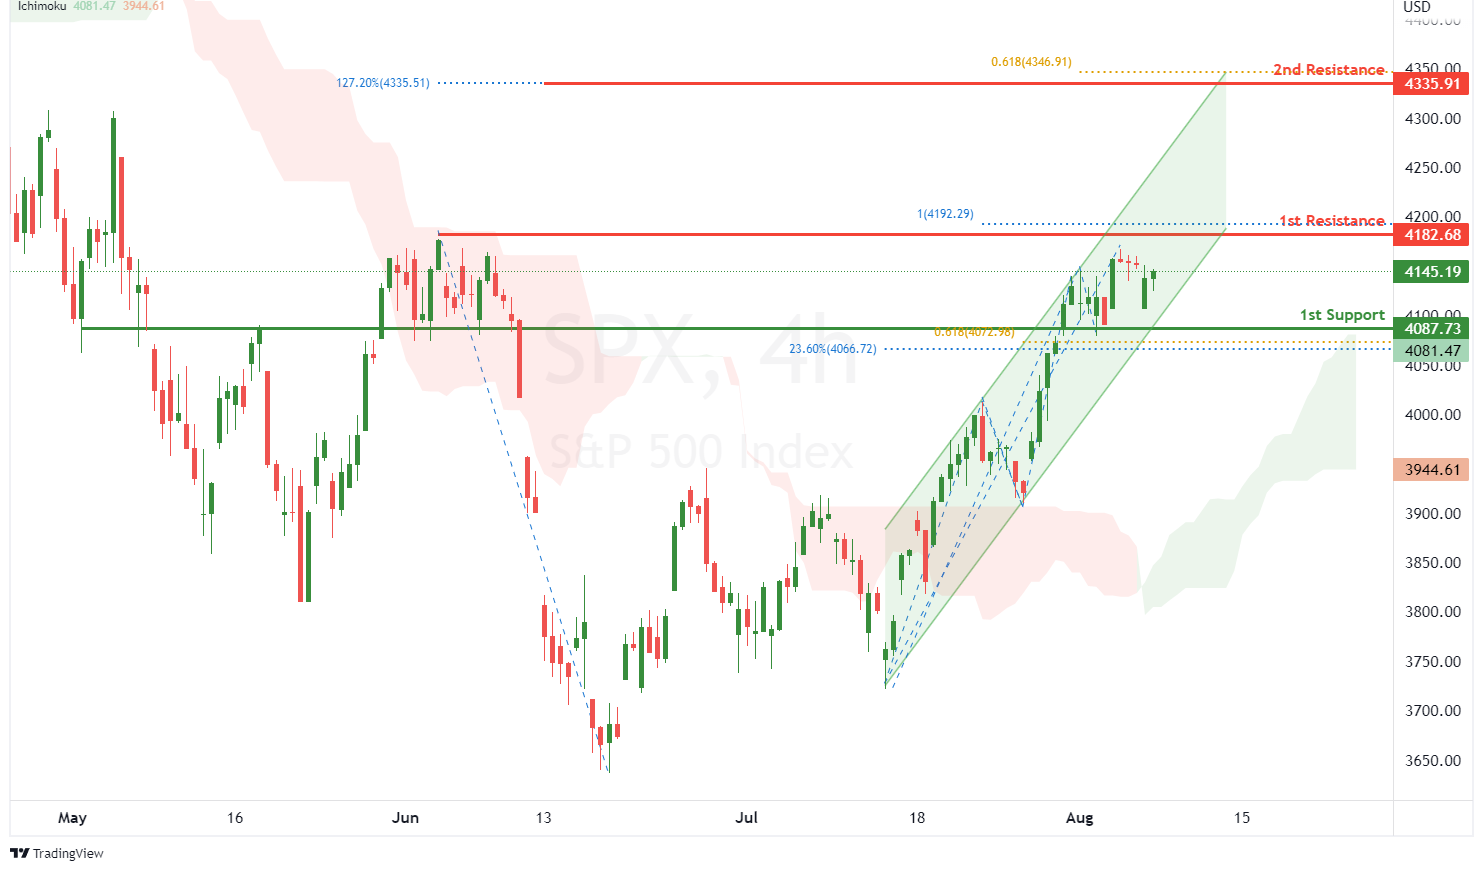
On the H4, with price moving above the ichimoku indicator and within an ascending channel, we have a bullish bias that price will rise to our 1st resistance at 4182.68 where the swing high resistance and 100% fibonacci projection are. Once there is upside confirmation that price has broken the 1st resistance structure, we would expect bullish momentum to carry price to 2nd resistance at 4335.913 where the 127.2% fibonacci extension and 61.8% fibonacci projection are. Alternatively, price could drop to 1st support at 4087.73 where the overlap support, 23.6% fibonacci retracement and 61.8% fibonacci projection are.
Areas of consideration:
- H4 time frame, 1st resistance of 4182.68
- H4 time frame, 1st support at 4087.73
USD/CHF Daily Outlook
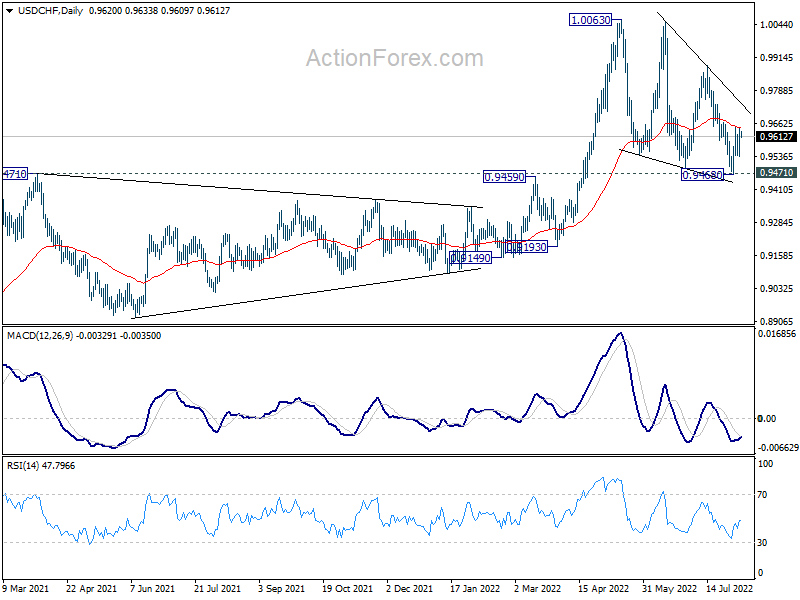
Daily Pivots: (S1) 0.9553; (P) 0.9602; (R1) 0.9665; More...
Intraday bias in USD/CHF remains neutral for the moment. On the upside, break of 0.9650, and sustained trading above 55 day EMA (now at 0.9647) will raise the chance that corrective pattern from 1.0063 has completed. Further rally should then be seen to 0.9884 resistance next. However, decisive break of 0.9471 support will carry larger bearish implication.
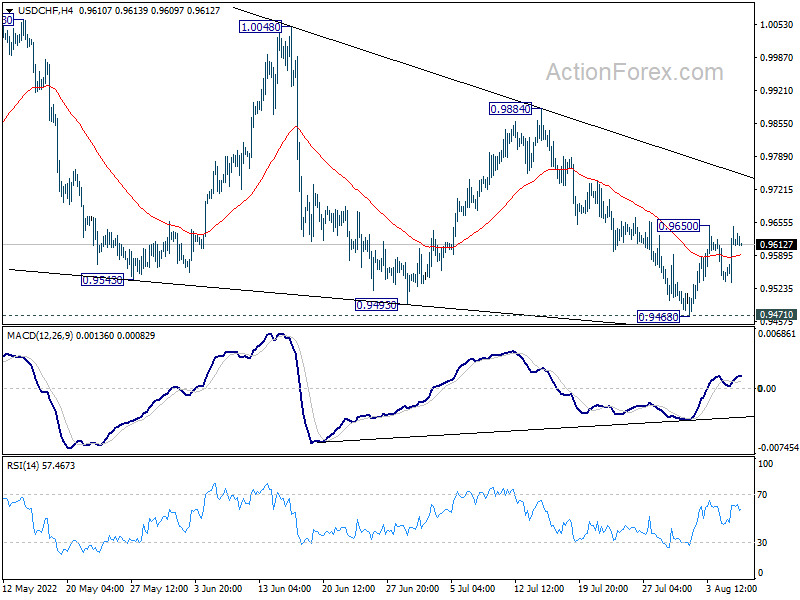
In the bigger picture, medium term up trend from 0.8756 (2021 low) is still in progress. On resumption, next target is 1.0342 (2016 high). Sustained break there will resume long term up trend from 0.7065 (2011 low). This will remain the favored case as long as 0.9471 resistance turned support holds. However, firm break of 0.9471 will raise the chance that such up trend is over.
Yen Stays Weak in Quiet Markets, US CPI to Move the Markets This Week
Yen stays generally soft in relatively quiet markets in Asia. But Dollar also softens slightly. On the other hand, Australian Dollar is firmer up on steady market sentiment, as followed by Swiss Franc and Euro. Sterling and Canadian are mixed for now. The economic calendar is light this week. The most market moving even would be on US CPI release on Wednesday, unless there is significant geopolitical developments.
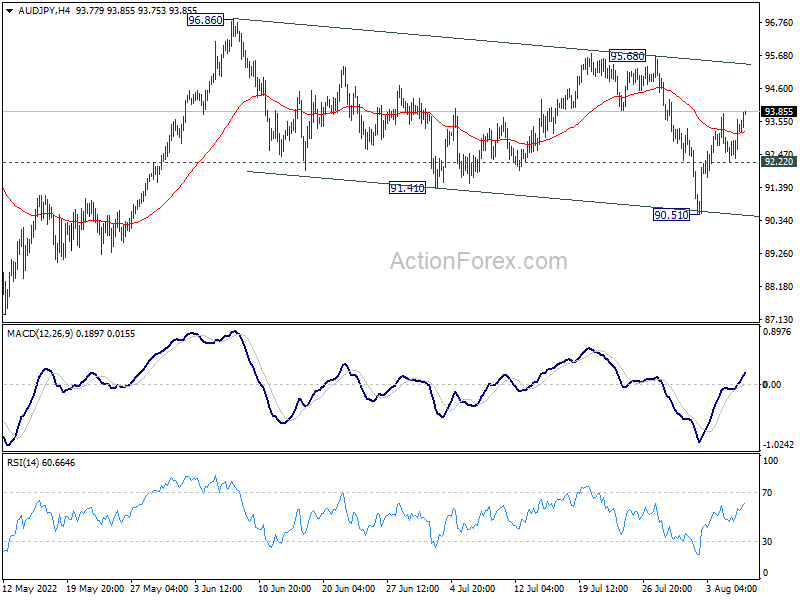
Technically, AUD/JPY is resuming near term rebound from 990.51 by breaching last week's high at 93.79. Corrective pattern from 96.86 high could have completed with three waves down to 90.51. Further rise is now in favor as long as 92.22 minor support holds, towards 95.68 resistance next. Break there will argue that larger up trend is ready to resume through 96.86 high. Such development will be monitor to verify the strength of underlying risk-on sentiment, if stock market rallies continue this week.
In Asia, at the time of writing, Nikkei is up 0.27%. Hong Kong HSI is down -0.70%. China Shanghai SSE is up 0.18%. Singapore Strait Times is down -0.58%. Japan 10-year JGB yield is up 0.0117 at 0.174.
Fed Bowman supports more 75bps hikes until seeing inflation declining
Fed Governor Michelle Bowman sad in a speech over the weekend, she supported Fed's 75bps rate hike in July, as well as the view that "ongoing increases" would be appropriate at "coming meetings".
"My view is that similarly-sized increases should be on the table until we see inflation declining in a consistent, meaningful, and lasting way," she added.
Bowman saw a "significant risk of higher inflation into next year for food, housing, fuel, and vehicles." And, the supply problems seem "likely to persist". But job market was tight with unemployment rate finally returning to the pre-pandemic level of 3.5%. Her base case is for a pickup in growth during H2, and for moderate growth in 2023.
Fed Daly: most important risk out there is inflation
San Francisco Fed President Mary Daly said in a CBS New interview, "if you're out in the economy, you don't feel like you're in a recession. That's the bottom line. The most important risk out there is inflation. And I think the job market just confirms that."
She added that a 50bps hike in September is still "absolutely" appropriate. "And we need to be data dependent. It could. We need to leave our minds open. We have two more inflation reports coming out, another jobs report. We continue to collect all the information from the context we talk to you to see how this is working its way through the economy," She said.
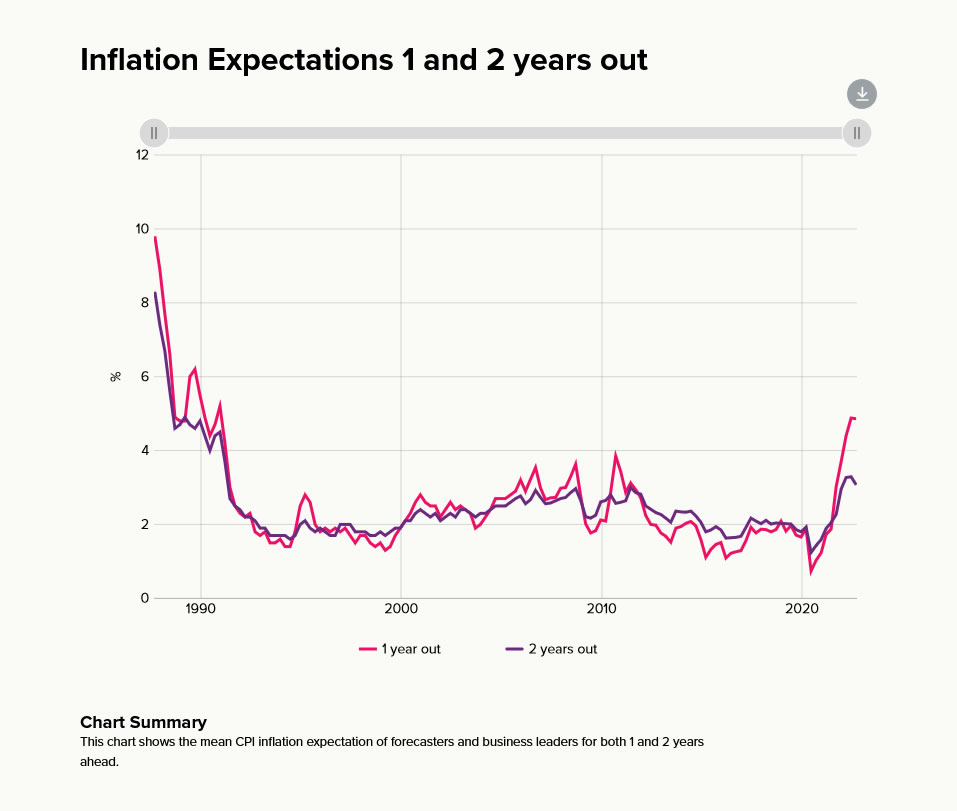
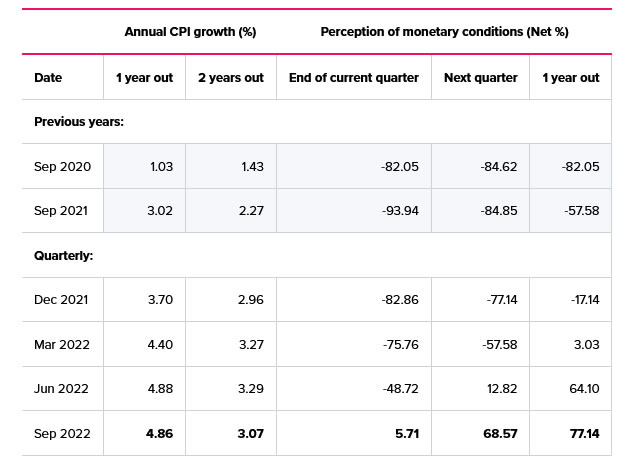
RBNZ 2-yr inflation expectation dropped to 3.07% in Q3
According to the latest RBNZ Survey of Expectations, the one-year-out inflation was relatively unchanged at 4.86% in Q3, down from Q2's 4.88%. Expectations were still much higher than Q1's 4.4% and Q4's 3.7%.
However, two-year-out inflation expectation has fallen significantly to 3.07% in Q3, down from Q2's 3.29%. That's already below Q1's 3.27% but still above Q4's 2.96%.
Still, the most watched 2 year expectation sit above RBNZ's target range. There is no change in market expectation that RBNZ would deliver another 50bps rate hike on August 17.
US CPI back in spotlight in a light week
US CPI will come back to spotlight in a relatively light week. It's expected to slow from four-decade high at 9.1% yoy to 8.7% yoy. There are altogether two set of CPI data before Fed next meets on September 21. By then, Fed should know whether CPI is still climbing, plateauing, or has peaked.
US U of Michigan consumer sentiment will also be watched. elsewhere, Eurozone Sentix investor confidence, UK GDP, and Eurozone production will also catch some attention.
Here are some highlights for the week:
- Monday: Japan current account; Swiss unemployment rate; Eurozone Sentix investor confidence.
- Tuesday: Australia Westpac consumer sentiment, NAB business confidence; Japan M2, machine tool orders; US non-farm productivity.
- Wednesday: Japan PPI; China CPI, PPI; Germany CPI final; US CPI.
- Thursday: US PPI, jobless claims.
- Friday: New Zealand BusinessNZ manufacturing; UK GDP, production, trade balance; Eurozone industrial production; US import prices, U of Michigan consumer sentiment.
USD/CHF Daily Outlook
Daily Pivots: (S1) 0.9553; (P) 0.9602; (R1) 0.9665; More...
Intraday bias in USD/CHF remains neutral for the moment. On the upside, break of 0.9650, and sustained trading above 55 day EMA (now at 0.9647) will raise the chance that corrective pattern from 1.0063 has completed. Further rally should then be seen to 0.9884 resistance next. However, decisive break of 0.9471 support will carry larger bearish implication.
In the bigger picture, medium term up trend from 0.8756 (2021 low) is still in progress. On resumption, next target is 1.0342 (2016 high). Sustained break there will resume long term up trend from 0.7065 (2011 low). This will remain the favored case as long as 0.9471 resistance turned support holds. However, firm break of 0.9471 will raise the chance that such up trend is over.
Economic Indicators Update
| GMT | Ccy | Events | Actual | Forecast | Previous | Revised |
|---|---|---|---|---|---|---|
| 23:50 | JPY | Bank Lending Y/Y Jul | 1.80% | 1.40% | 1.30% | |
| 23:50 | JPY | Current Account (JPY) Jun | 0.84T | -0.03T | 0.01T | |
| 03:00 | NZD | RBNZ Inflation Expectations Q3 | 3.07% | 3.29% | ||
| 05:00 | JPY | Eco Watchers Survey: Current Jul | 53.6 | 52.9 | ||
| 05:45 | CHF | Unemployment Rate Jul | 2.20% | 2.20% | ||
| 08:30 | EUR | Eurozone Sentix Investor Confidence Aug | -26.3 | -26.4 |
RBNZ 2-yr inflation expectation dropped to 3.07% in Q3
According to the latest RBNZ Survey of Expectations, the one-year-out inflation was relatively unchanged at 4.86% in Q3, down from Q2's 4.88%. Expectations were still much higher than Q1's 4.4% and Q4's 3.7%.
However, two-year-out inflation expectation has fallen significantly to 3.07% in Q3, down from Q2's 3.29%. That's already below Q1's 3.27% but still above Q4's 2.96%.
Still, the most watched 2 year expectation sit above RBNZ's target range. There is no change in market expectation that RBNZ would deliver another 50bps rate hike on August 17.
Fed Daly: Most important risk out there is inflation
San Francisco Fed President Mary Daly said in a CBS New interview, "if you're out in the economy, you don't feel like you're in a recession. That's the bottom line. The most important risk out there is inflation. And I think the job market just confirms that."
She added that a 50bps hike in September is still "absolutely" appropriate. "And we need to be data dependent. It could. We need to leave our minds open. We have two more inflation reports coming out, another jobs report. We continue to collect all the information from the context we talk to you to see how this is working its way through the economy," She said.
Fed Bowman supports more 75bps hikes until seeing inflation declining
Fed Governor Michelle Bowman sad in a speech over the weekend, she supported Fed's 75bps rate hike in July, as well as the view that "ongoing increases" would be appropriate at "coming meetings".
"My view is that similarly-sized increases should be on the table until we see inflation declining in a consistent, meaningful, and lasting way," she added.
Bowman saw a "significant risk of higher inflation into next year for food, housing, fuel, and vehicles." And, the supply problems seem "likely to persist". But job market was tight with unemployment rate finally returning to the pre-pandemic level of 3.5%. Her base case is for a pickup in growth during H2, and for moderate growth in 2023.
EUR/USD Faces Resistance, Risk of Downside Break
Key Highlights
- EUR/USD is facing resistance near the 1.0290 zone.
- A key bullish trend line is forming with support near 1.0145 on the 4-hours chart.
- GBP/USD is struggling to stay above the 1.2000 support zone.
- Crude oil price extended its decline below the $90 support.
EUR/USD Technical Analysis
The Euro started a decent upward move above the 1.0150 resistance zone against the US Dollar. EUR/USD even traded above 1.0220 before the bears appeared.
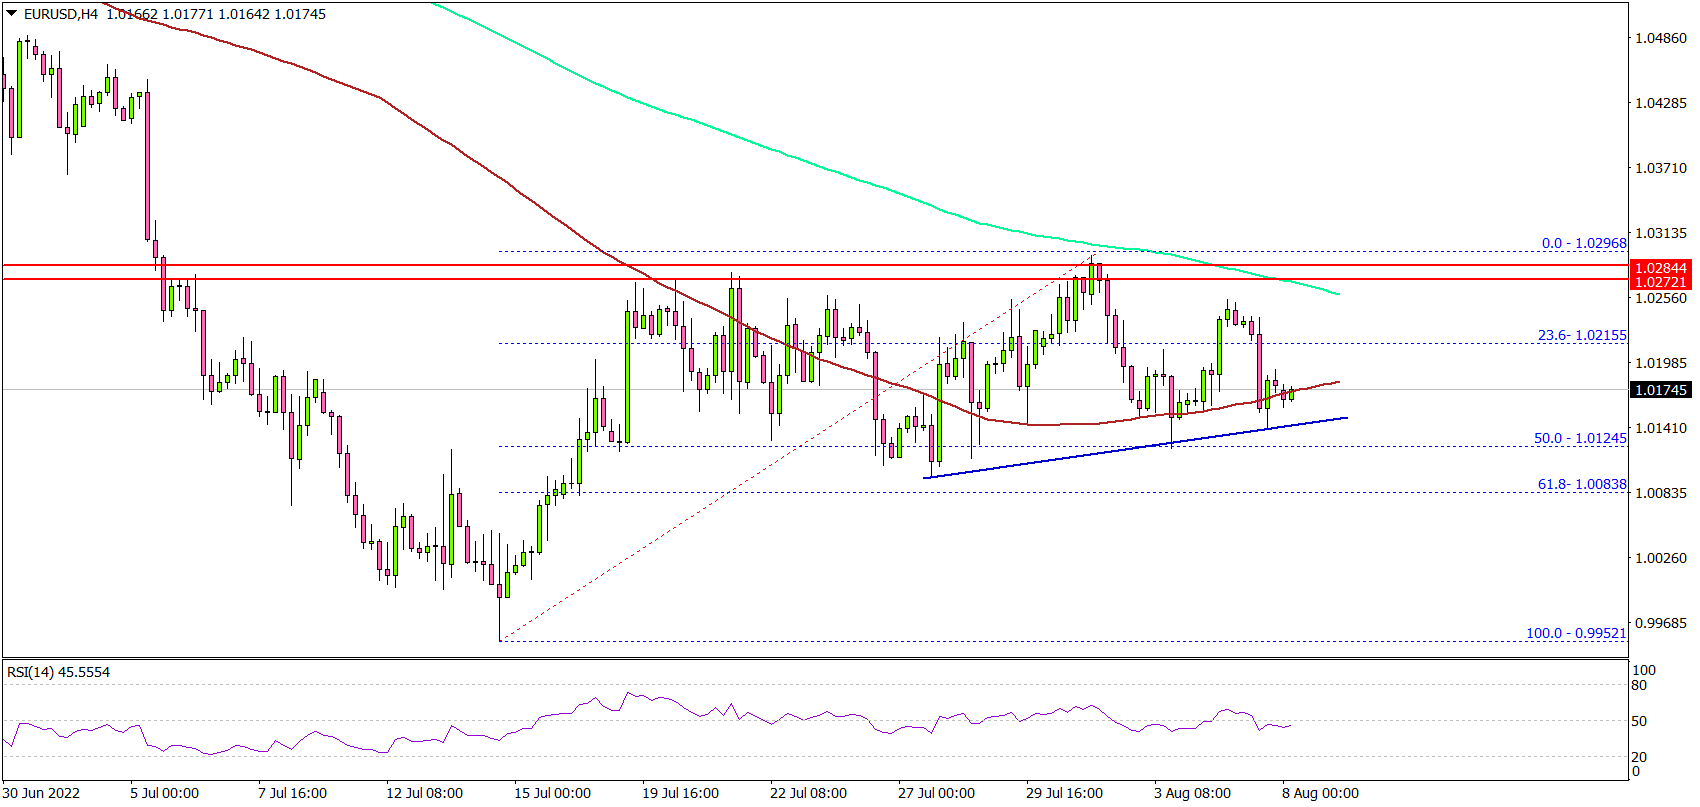
Looking at the 4-hours chart, the pair faced a strong resistance near the 1.0295 level. A high was formed near the 1.0296 level and the price is now correcting lower.
There was a move below the 1.0250 support zone. The pair even settled below the 100 simple moving average (red, 4-hours), and the 200 simple moving average (green, 4-hours).
It is now struggling to stay above the 1.0160 support zone. The first major support is near the 1.0150 level. There is also a key bullish trend line forming with support near 1.0145 on the same chart. A downside break below the trend line support might spark a sharp decline.
The next major support is near 1.0100. Any more losses might send the pair towards the 1.0050 zone. On the upside, the pair is facing resistance near the 1.0250 level.
The next major resistance is near the 1.0290 level, above which the pair could accelerate higher. In the stated case, the pair could rise towards the 1.0350 resistance zone in the near term.
Looking at crude oil price, there was a sharp decline below the $95.00 and $92.0 support levels. The price even traded below the $90.00 level and remains at a risk of more downsides.
Economic Releases
- Euro Zone Sentix Investor Confidence for August 2022 - Forecast -24.7, versus -26.4 previous.
NZ First Impressions RBNZ Survey of Expectations September quarter 2022
The RBNZ’s latest Survey of Expectations showed that expectations for inflation over the coming years remain elevated. However, the trend higher seen in recent months looks to have been arrested, with expectations easing at some of the key medium-term horizons. That will leave the RBNZ feeling more comfortable that the risks of high inflation becoming embedded in the economy are easing off.
Details
Inflation expectations
- One year ahead: 4.86% (Prev: 4.88%)
- Two years ahead: 3.07% (Prev: 3.29%)
- Five years ahead: 2.33% (Prev: 2.42%)
- Ten years ahead: 2.13% (Prev: 2.11%)
Details
The RBNZ’s latest Survey of Expectations showed that expectations for inflation over the coming years remain elevated. However, the trend higher seen in recent quarters looks to have been arrested, with expectations easing at some of the key medium-term horizons
Looking at the details of today’s report, expectations for inflation one year ahead held steady at 4.9%. Expectations at this short horizon tend to follow actual inflation closely. And with the latest survey coming hot on the heels of the monster 7.3% inflation outcome in the year to June, that lack of movement will be welcome news for the RBNZ.
The bigger focus for the central bank is expectations over longer horizons (two or more years ahead). Historically, those have been a better guide to how businesses will adjust prices and wages, and signal if the inflation target is viewed as credible. On this front, today’s news will also have been welcomed by the central bank.
The closely watched two-year ahead measure pull back to 3.1% (from 3.3% last quarter). Similarly, the five-year ahead measure softened to 2.3% (from 2.4% previously), while expectations for inflation in 10 years’ time remained steady at 2.1%.
Implications
Today’s easing in inflation expectations will leave the RBNZ feeling more comfortable that the risks of high inflation becoming embedded in the economy are easing off. That is particularly important given the current multi-decade high in actual inflation and related risks of a wage-price spiral.
Even so, today’s survey still points to strong inflation pressures in the New Zealand economy and reinforces the case for rate rises. We’re forecasting another 50bp rise at next week’s RBNZ policy meeting.