Sample Category Title
USD/JPY Mid-Day Outlook
Daily Pivots: (S1) 133.21; (P) 134.36; (R1) 136.18; More...
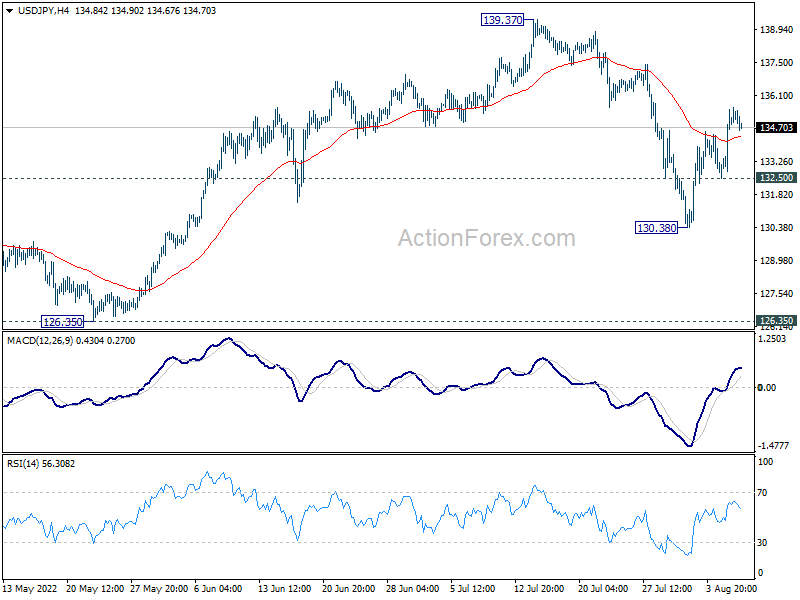
USD/JPY retreats mildly but intraday bias stays mildly on the upside. Rise from 130.38 should target a test on 139.37 high. Strong resistance could be seen there to limit upside, to bring another fall, as the third leg of the consolidation pattern from 139.37. On the downside, below 132.50 minor support will resume the fall from 139.37 towards 126.35 structural support.
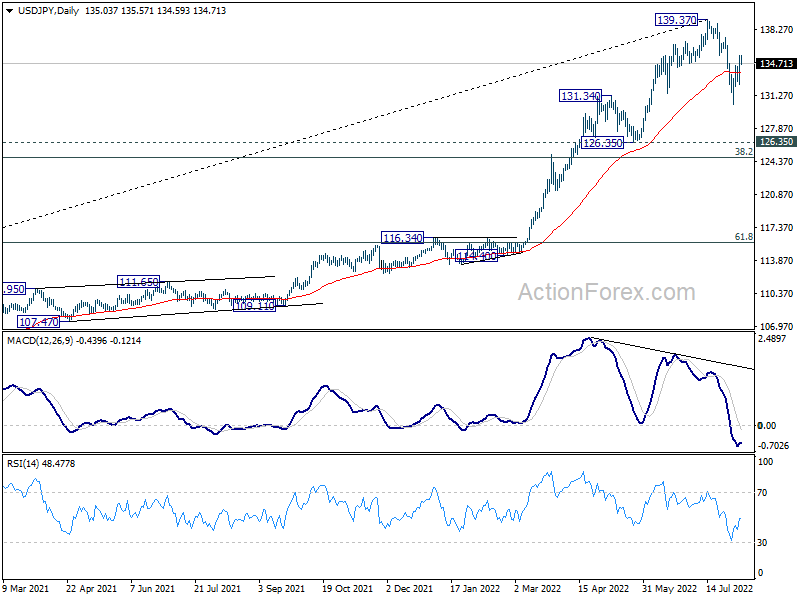
In the bigger picture, fall from 139.37 medium term top is seen as correcting whole up trend from 101.18 (2020 low). While deeper decline cannot be ruled out, outlook will stays bullish as long as 55 week EMA (now at 121.84) holds. Long term up trend is expected to resume through 139.37 at a later stage, after the correction finishes.
NZ Dollar Rebounds on Inflation Expectations
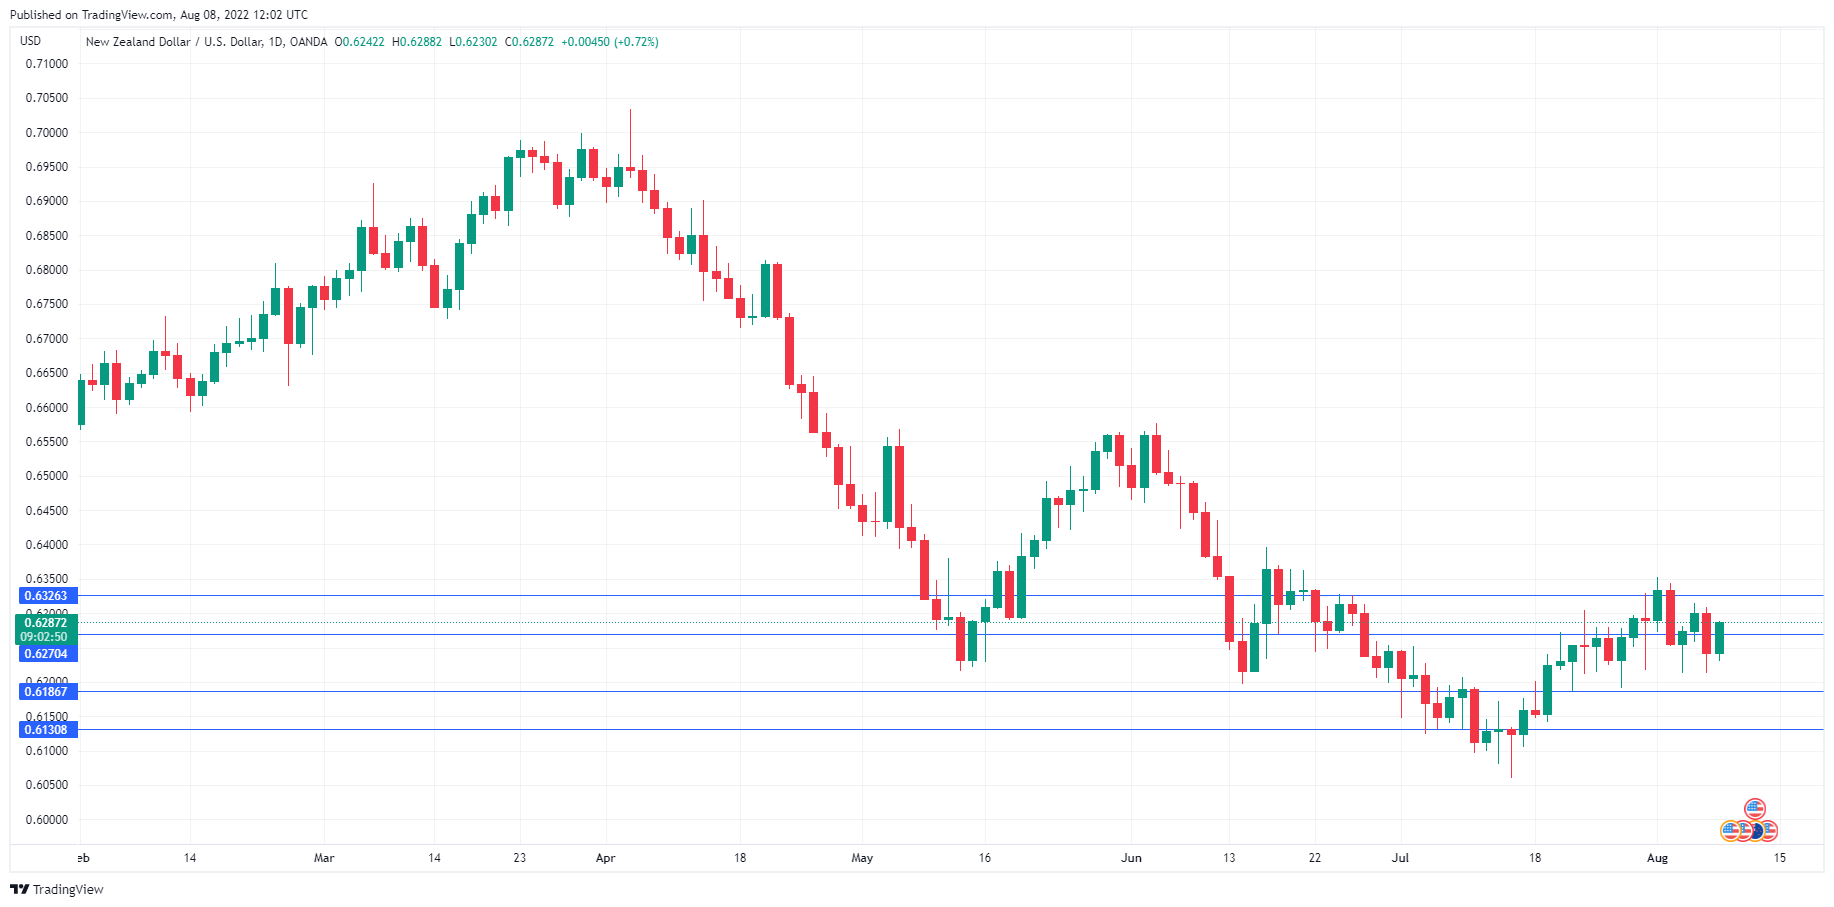
The New Zealand dollar has started the week with strong gains. In the European session, NZD/USD is trading at 0.6281, up 0.63% on the day.
US Nonfarm payrolls send dollar higher
The week ended with a bang as US nonfarm payrolls smashed it out of the ballpark. The July release came in at 528 thousand, well above the estimate of 250 thousand. The immediate effect of the massive NFP release was the US dollar posting broad gains on Friday, as NZD/USD slid almost 1%, but the currency has recovered much of those losses today.
The US employment report points to a labour market that remains tight. Unemployment ticked down to 3.5% from 3.6%, and wage growth remained unchanged at 5.2%, ahead of the forecast of 4.9%. For the Fed, the strong gain in wages is well above the Fed’s inflation target of 2% and lends support to another supersize rate 0.75% hike come September.
The US labour market remains robust, but the sharp tightening of rates has reduced activity in other parts of the economy, especially manufacturing and goods and service. Still, the US does not appear to be in a recession despite all the noise after two straight negative quarters of GDP. There is no set definition for a recession, but one view is that it is a significant decline in activity across the economy, and that is clearly not the case in the US, with a red-hot labour market.
In New Zealand, RBNZ Inflation Expectations ticked lower in Q2, dropping to 3.07%, down from 3.27% in Q1. This is close to the central bank’s upper band of its inflation target of 3%. Inflation, which rose to 7.3% in the second quarter, has yet to peak, but the slight fall in inflation expectations will be welcomed by the RBNZ, as it marks the first drop after eight straight quarters of acceleration. The RBNZ meets next Wednesday and is likely to raise rates by 0.50%.
NZD/USD Technical
- 0.6271 has switched to resistance and is a weak line. Above, there is resistance at 0.6350
- There is support at 0.6213 and 0.6134
AUD/USD Mid-Day Report
Daily Pivots: (S1) 0.6863; (P) 0.6919; (R1) 0.6968; More...
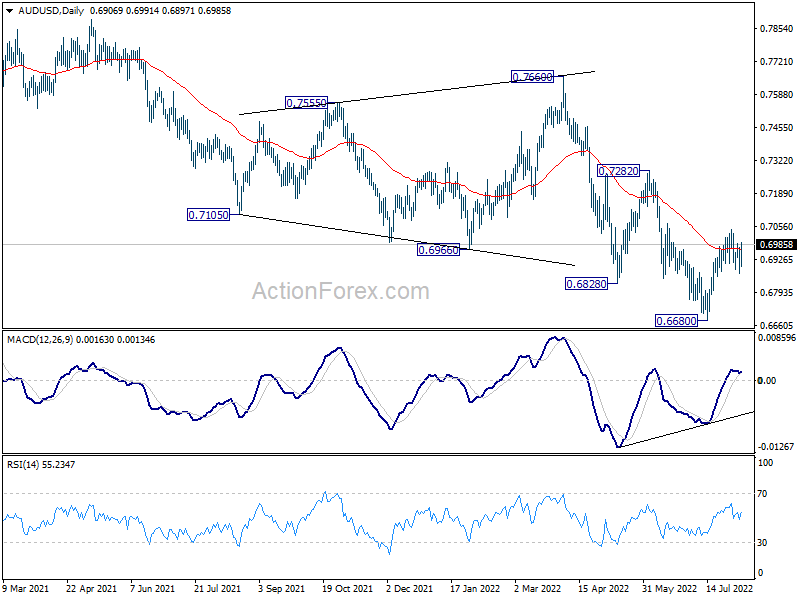
AUD/USD rebounds notably today but stays below 0.7045 resistance. Intraday bias remains neutral first. On the upside, break of 0.7045 will resume the rebound from 0.6680 to 0.7282 key resistance next. On the downside, however, break of 0.6858 minor support will argue that the rebound is over. Intraday bias will then be back on the downside for retesting 0.6680 low.
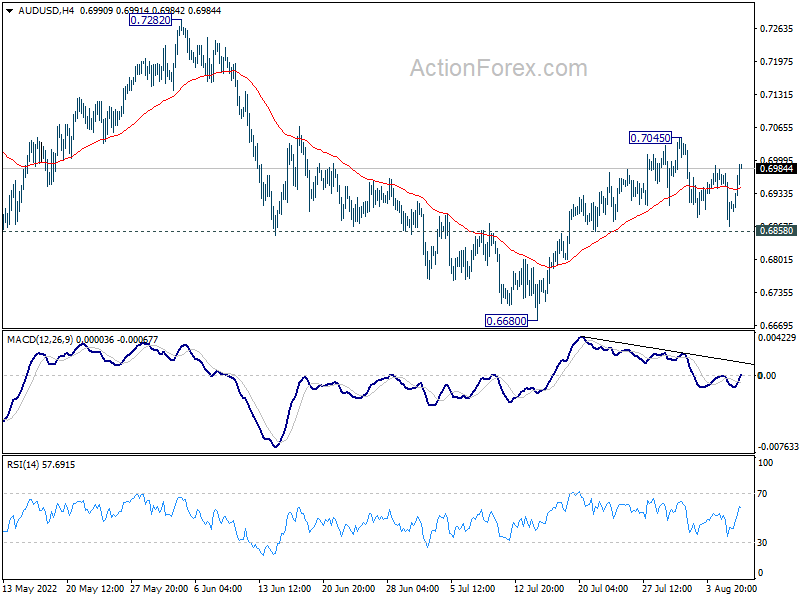
In the bigger picture, price actions from 0.8006 (2021 high) is seen more as a corrective pattern to rise from 0.5506 (2020 low). Or it could be a bearish impulsive move. In either case, outlook will remain bearish as long as 0.7282 resistance holds. Next target is 61.8% retracement of 0.5506 to 0.8006 at 0.6461.
Markets in Risk-on Mood, Aussie Higher, Dollar Lower
The financial markets are trading with a risk-on mood today. Major European indexes are trading up while US futures also point to higher open. Commodity currencies are trading generally higher, as led by Aussie. Meanwhile, Dollar is leading Yen and Euro lower. Sterling and Swiss Franc are mixed for now, trading a bit on the soft side.
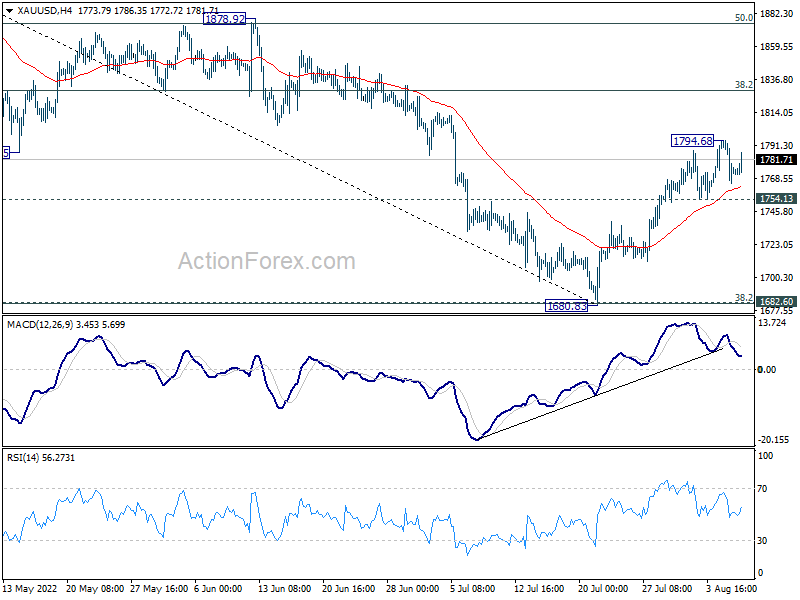
Technically, Gold's retreat from 1794.68 is so far very shallow. Further rally is expected as long as 1754.14 support holds. Break of 1794.68 will target 38.2% retracement of 2070.06 to 1680.83 at 1829.51. When that happens, it might be accompanied by another selloff in Dollar.
In Europe, at the time of writing, FTSE is up 0.64%. DAX is up 0.95%. CAC is up 1.06%. Germany 10-year yield is down -0.0365 at 0.919. Earlier in Asia, Nikkei rose 0.26%. Hong Kong HSI dropped -0.77%. China Shanghai SSE rose 0.31%. Singapore Strait Times dropped -0.36%. Japan 10-year JGB yield rose 0.0152 to 0.178.
Eurozone Sentix improved to -25.2, but recession still very likely
Eurozone Sentix Investor Confidence improved slightly from -26.4 to -25.2 in August, better than expectation of -26.3. Current Situation index ticked up from -16.5 to -16.3. Expectations index also edged up from -35.8 to -33.8.
However, Germany Investor Confidence dropped from -24.2 to -24.4, lowest since May 2020. Current Situation index dropped from -13.0 to -14.8, lowest since February 2021. Expectations index, on the other hand, ticked up from -34.8 to -33.5.
Sentix said, the improvement in Eurozone "does not mean that the all-clear has been given". And, "a recession in the Eurozone is still very likely."
RBNZ 2-yr inflation expectation dropped to 3.07% in Q3
According to the latest RBNZ Survey of Expectations, the one-year-out inflation was relatively unchanged at 4.86% in Q3, down from Q2's 4.88%. Expectations were still much higher than Q1's 4.4% and Q4's 3.7%.
However, two-year-out inflation expectation has fallen significantly to 3.07% in Q3, down from Q2's 3.29%. That's already below Q1's 3.27% but still above Q4's 2.96%.
Still, the most watched 2 year expectation sit above RBNZ's target range. There is no change in market expectation that RBNZ would deliver another 50bps rate hike on August 17.
Ethereum breaks higher on risk-on sentiment, bitcoin lags
Both ethereum and bitcoin follow generally positive market sentiment and rise as another week starts. Nevertheless, bitcoin is clearly lagging behind.
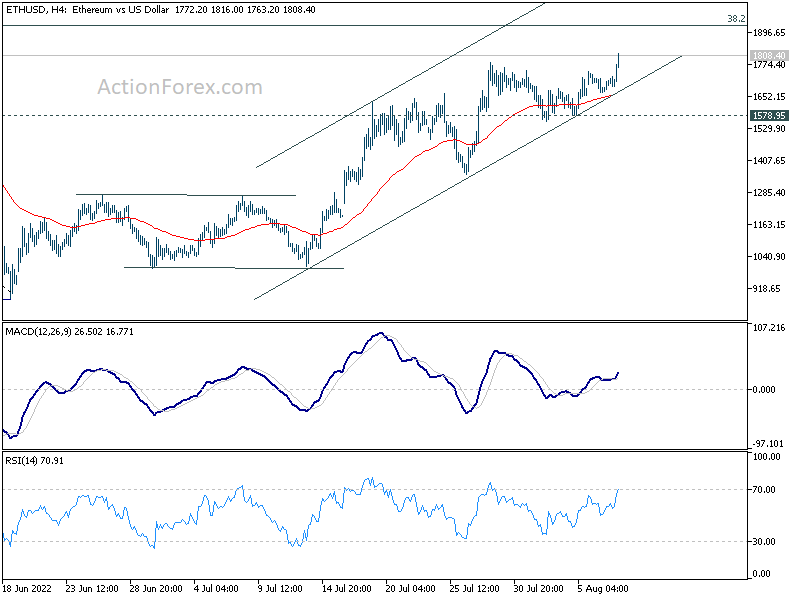
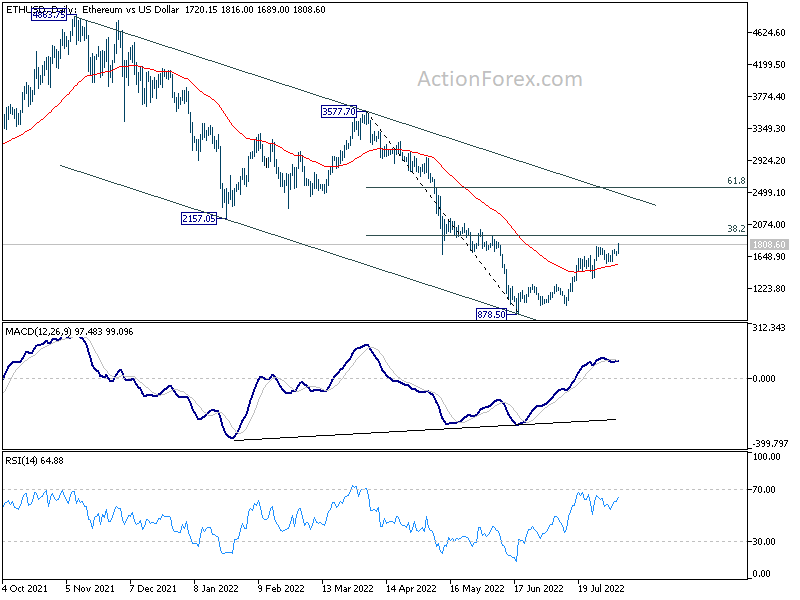
Ethereum breaks through near term resistance at 1783.2 today, as rally from 878.5 low resumes. The sustained trading above 55 day EMA is a bullish signal, so is the bearish divergence condition in daily MACD. Current rise is seen as, at least, a correction to fall from 3577.70. Further rally is expected as long as 1578.96 support holds. Next target is 38.2% retracement of 3577.7 to 878.5 at 1909.5. Decisive break there will raise the chance of medium term reversal, and target 2157.05 support turned resistance next.
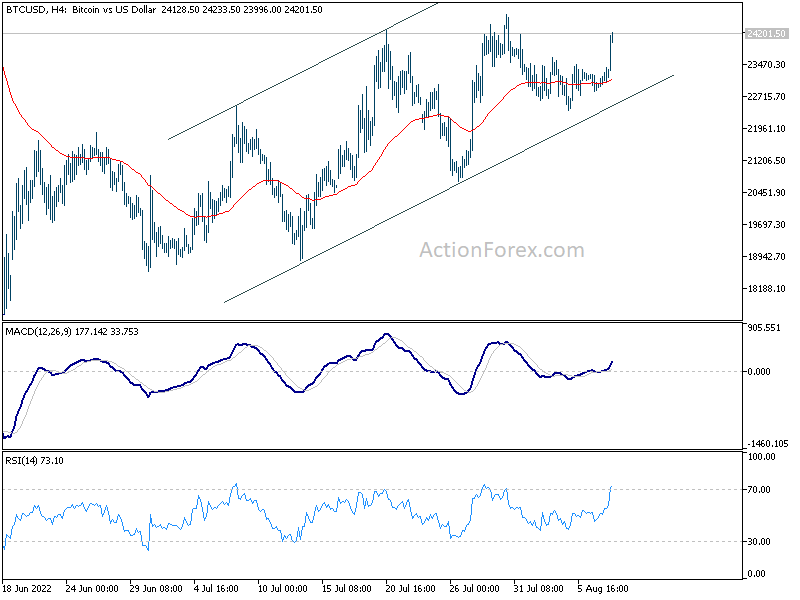
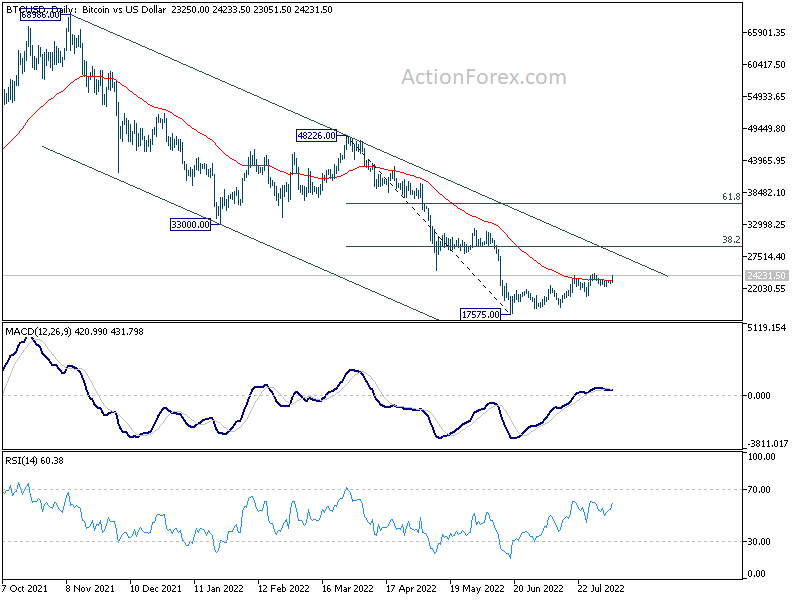
Bitcoin also rallies today but it's stuck below near term resistance at 24949. It has yet gotten rid of 55 day EMA clearly. Nevertheless, there is still upside prospect as helped by the rally in ethereum. Break of 24949 will target 38.2% retracement of 48226 to 17575 at 29283.
AUD/USD Mid-Day Report
Daily Pivots: (S1) 0.6863; (P) 0.6919; (R1) 0.6968; More...
AUD/USD rebounds notably today but stays below 0.7045 resistance. Intraday bias remains neutral first. On the upside, break of 0.7045 will resume the rebound from 0.6680 to 0.7282 key resistance next. On the downside, however, break of 0.6858 minor support will argue that the rebound is over. Intraday bias will then be back on the downside for retesting 0.6680 low.
In the bigger picture, price actions from 0.8006 (2021 high) is seen more as a corrective pattern to rise from 0.5506 (2020 low). Or it could be a bearish impulsive move. In either case, outlook will remain bearish as long as 0.7282 resistance holds. Next target is 61.8% retracement of 0.5506 to 0.8006 at 0.6461.
Economic Indicators Update
| GMT | Ccy | Events | Actual | Forecast | Previous | Revised |
|---|---|---|---|---|---|---|
| 23:50 | JPY | Bank Lending Y/Y Jul | 1.80% | 1.40% | 1.30% | |
| 23:50 | JPY | Current Account (JPY) Jun | 0.84T | -0.03T | 0.01T | |
| 03:00 | NZD | RBNZ Inflation Expectations Q3 | 3.07% | 3.29% | ||
| 05:00 | JPY | Eco Watchers Survey: Current Jul | 43.8 | 53.6 | 52.9 | |
| 05:45 | CHF | Unemployment Rate Jul | 2.20% | 2.20% | 2.20% | |
| 08:30 | EUR | Eurozone Sentix Investor Confidence Aug | -25.2 | -26.3 | -26.4 |
Ethereum breaks higher on risk-on sentiment, bitcoin lags
Both ethereum and bitcoin follow generally positive market sentiment and rise as another week starts. Nevertheless, bitcoin is clearly lagging behind.
Ethereum breaks through near term resistance at 1783.2 today, as rally from 878.5 low resumes. The sustained trading above 55 day EMA is a bullish signal, so is the bearish divergence condition in daily MACD. Current rise is seen as, at least, a correction to fall from 3577.70. Further rally is expected as long as 1578.96 support holds. Next target is 38.2% retracement of 3577.7 to 878.5 at 1909.5. Decisive break there will raise the chance of medium term reversal, and target 2157.05 support turned resistance next.
Bitcoin also rallies today but it's stuck below near term resistance at 24949. It has yet gotten rid of 55 day EMA clearly. Nevertheless, there is still upside prospect as helped by the rally in ethereum. Break of 24949 will target 38.2% retracement of 48226 to 17575 at 29283.
Nasdaq Heads for 14,000, Focusing on Positivity in the Economy Rather than a Rate Hike
Markets were confused by Friday’s US labour market data, not knowing how to react to solid job growth. This is a negative for equities, as it makes us expect a third consecutive 75-point Fed rate hike at the next meeting on 21 September. But job growth and the continued pace of wage increases is a positive signal from the economy, where companies continue to hire, and people continue to spend. In our view, there are more positives here, encouraging long-term buying in sagging stocks, despite the risks of local corrections due to short-term overbuying.
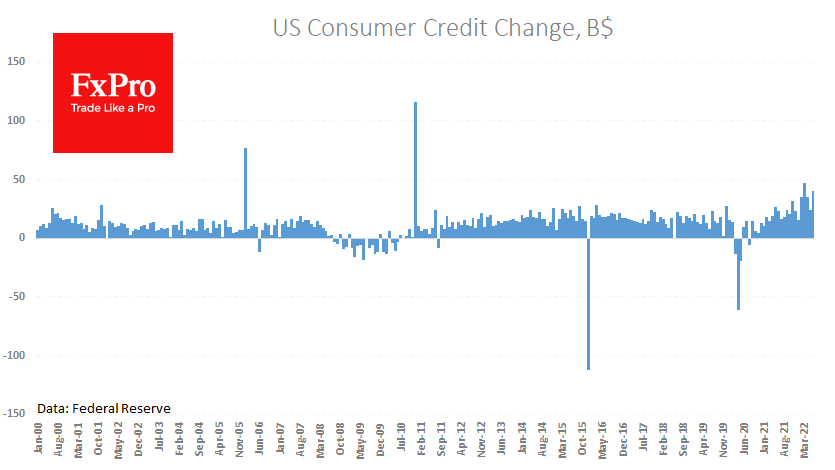
In July, the US labour market added over half a million jobs and maintained a 5.2% y/y growth in hourly earnings. The Fed on Friday also reported consumer credit growth of $40.2bn in June, up from $23.8bn in May and $25bn expected. This is a very high reading, as we only saw higher in March, excluding two spikes caused by one-off programmes.
People are rushing to borrow before rates get even higher. This promises to heat consumer inflation even more, so there will be pressure on the Fed to conduct policy tightening more quickly. But Americans are no longer as indebted as they were at the start of the financial crisis, so we can’t say yet that the situation will end in a global financial crisis – 2.0.
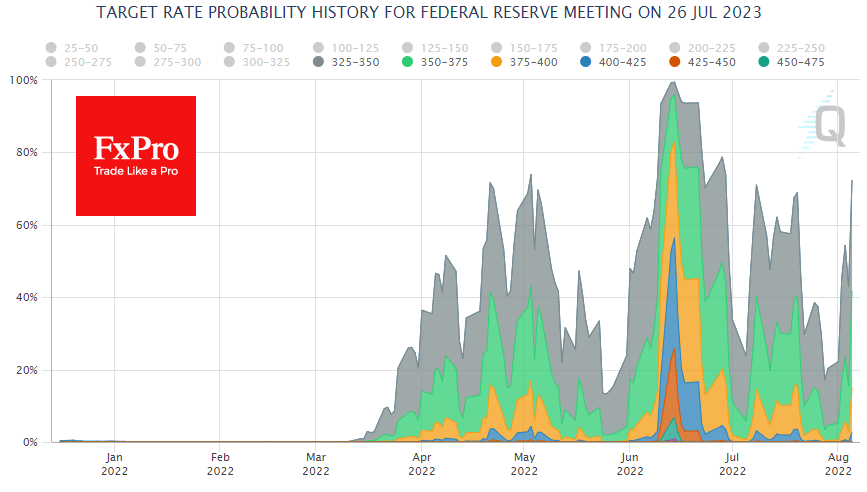
Debt markets, the so-called “smart money”, have eased their bets that on July 2023 the rates will be much higher. This trend broke in August but, as we can see, has not stopped stock buyers. Strong employment growth in July, credit data and durable goods orders confirm that the economy is coping with the Fed’s tightening. So far, rate hikes and rising inflation have only been a stimulus to accelerate consumption.
A caveat is worthwhile here too. In the next two quarters, the Fed will likely step on the brake pedal too much. In that case, the sell-off could return to the stock market. But this is just causing future turmoil. The current data, for now, sets the stage for continued careful stock buying.
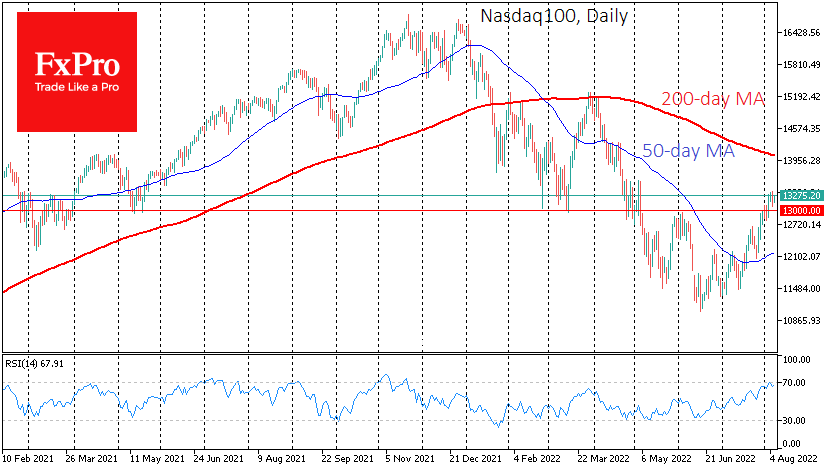
The nearest technical target for the Nasdaq100 looks to be the 200 SMA, which coincides with the round level of 14,000. If the markets opt for a swing-back before a new ascending impulse to clear the local oversold area, it is worth looking at 13,000. This area concentrates on the local highs of June and the lows of April, March, February, and May 2021.
US 500 Index Defends Bullish Direction; Bias Cautiously Positive
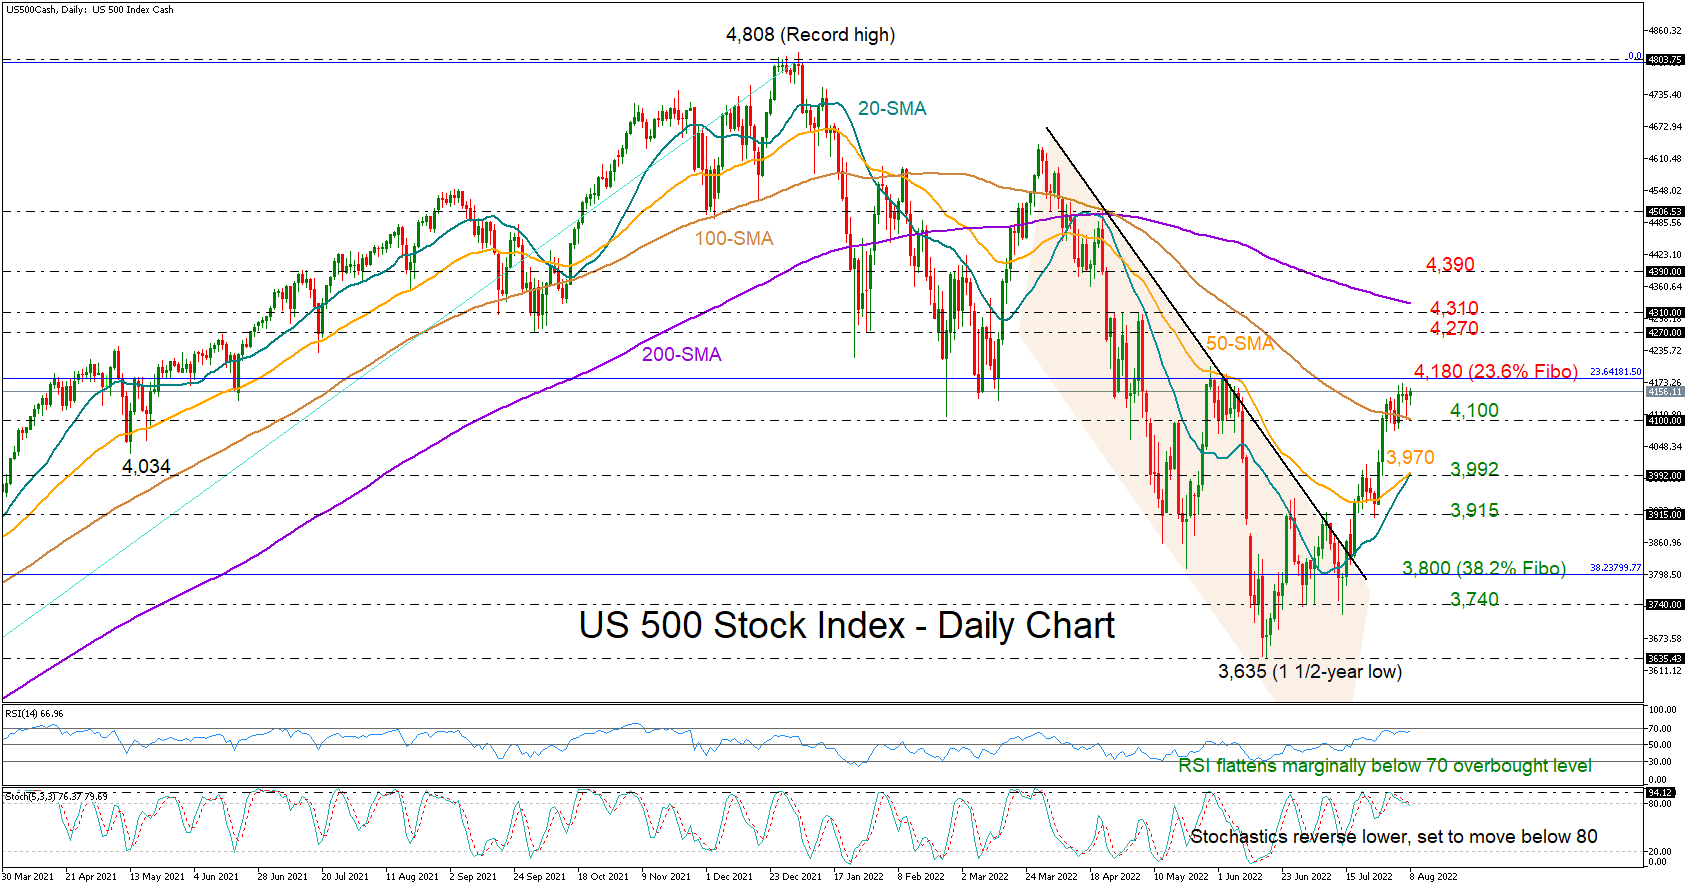
The US 500 stock index (cash) managed to crawl above its 100-day simple moving average (SMA) last week and rise as high as 4,170, adding more credence to the short-term bullish trend.
Although the price is marginally below the previous high, a successful break of which is needed to violate the medium-term downtrend, the momentum indicators have started to flash overbought signals. The RSI is flattening marginally below 70, while the stochastics have already reversed south and are set to cross below 80, suggesting that the bears might be around the corner.
A decisive close above the 4,180 region, where the 23.6% Fibonacci retracement of the 2,183 – 4,808 uptrend is positioned, could eliminate negative risks, likely triggering an exciting rally towards the 4,270 restrictive region. Higher, all attention will turn to the 4,310 key resistance zone and the 200-day SMA. If the bulls claim the latter, the next obstacle could occur around 4,390.
On the downside, the 100-day SMA will be closely watched at 4,100. Failure to bounce here could produce a sharp decline towards the 20- and 50-day SMAs, which are set to post a bullish cross around 3,992. Moving lower, the bears will next test the support region around 3,915.
All in all, the US 500 index keeps defending its short-term bullish direction, though some weakness cannot be ruled out in the coming sessions as the overbought signals arise.
GBP/JPY Daily Outlook
Daily Pivots: (S1) 161.62; (P) 162.50; (R1) 163.87; More...
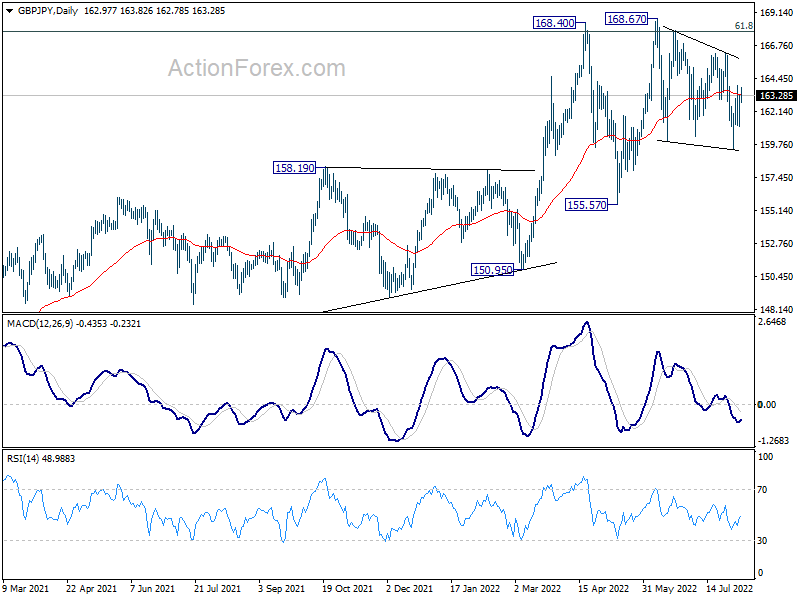
Intraday bias in GBP/JPY remains neutral for the moment, and consolidation pattern from 168.67 might extend. On the upside, above 163.97 will turn bias to the upside, and resume the rebound to 166.31 resistance. Break there will be the first sign of up trend resumption. On the downside, break of 159.42 will extend the correction towards 155.57 support.
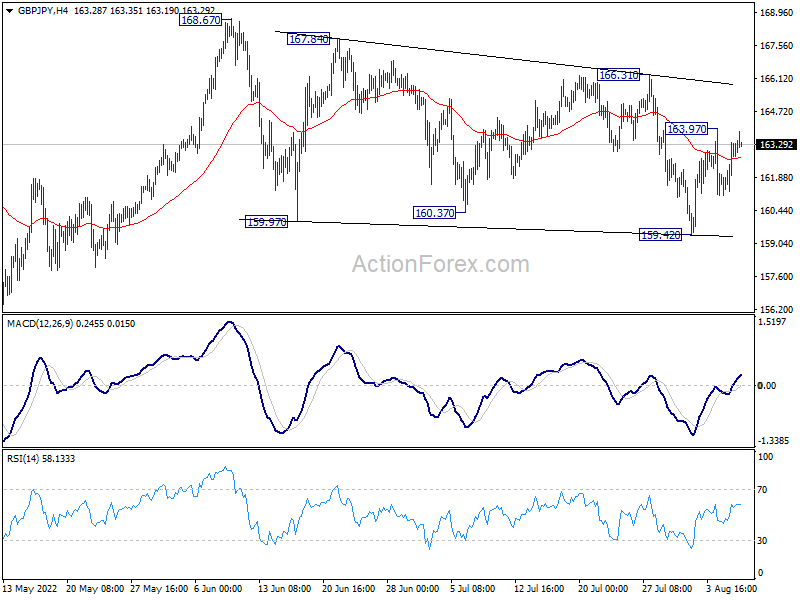
In the bigger picture, up trend from 123.94 (2020 low) is still in progress. Sustained break of 61.8% retracement of 195.86 (2015 high) to 122.75 (2016 low) at 167.93 will be a long term bullish signal, and could pave the way back to 195.86 high. This will remain the favored case as long as 155.57 support holds, even in case of deep pull back.
EUR/JPY Daily Outlook
Daily Pivots: (S1) 136.22; (P) 136.99; (R1) 138.17; More....
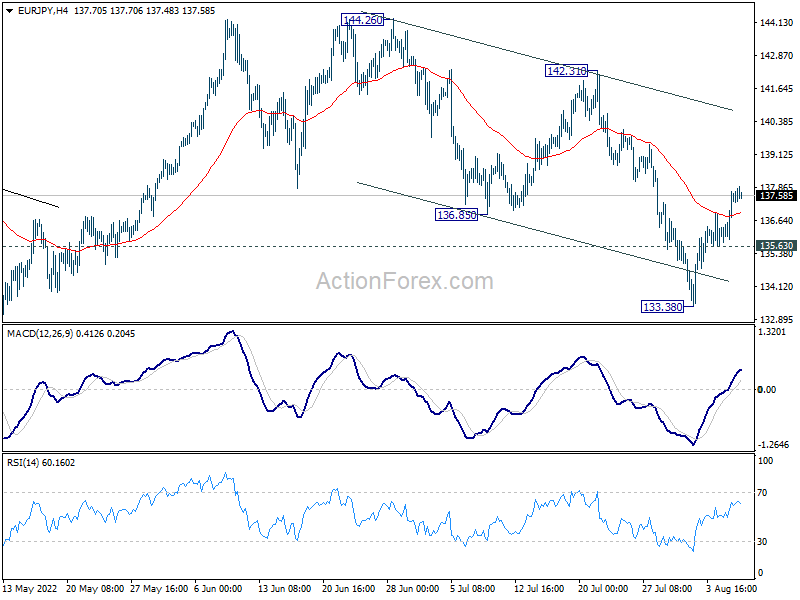
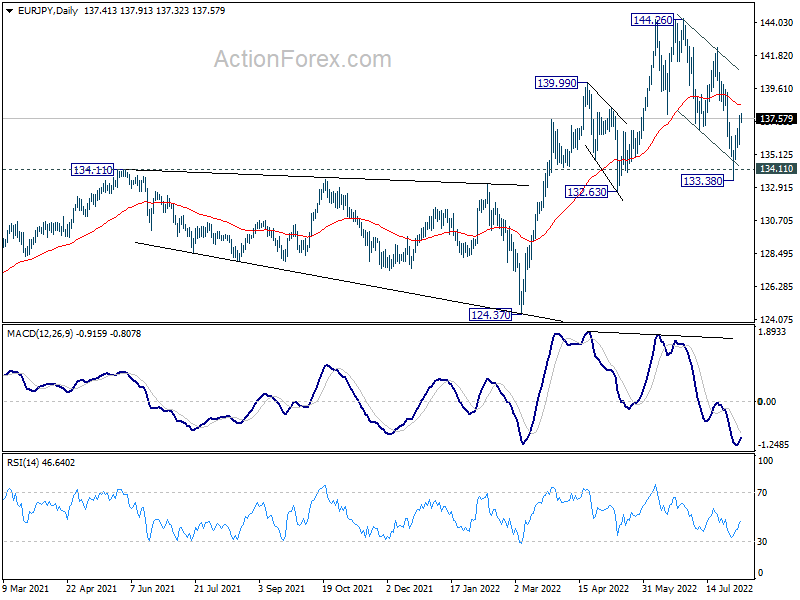
Intraday bias in EUR/JPY remains mildly on the upside for the moment. Sustained trading above 55 day EMA (now at 138.48) will suggest that whole correction from 144.26 has completed. Further rally would then be seen back to retest 144.26 high. However, break of 135.63 will turn bias back to the downside for 133.38 low instead.
In the bigger picture, up trend from 114.42 (2020 low) is seen as the third leg of the pattern from 109.30 (2016 low). Further rally is in favor as long as 134.11 resistance turned support holds, even in case of deep pull back. Next target is 149.76 (2015 high). However, sustained break of 134.11 will be a sign of medium term bearish reversal and turn focus to 124.37 support for confirmation.
EUR/GBP Daily Outlook
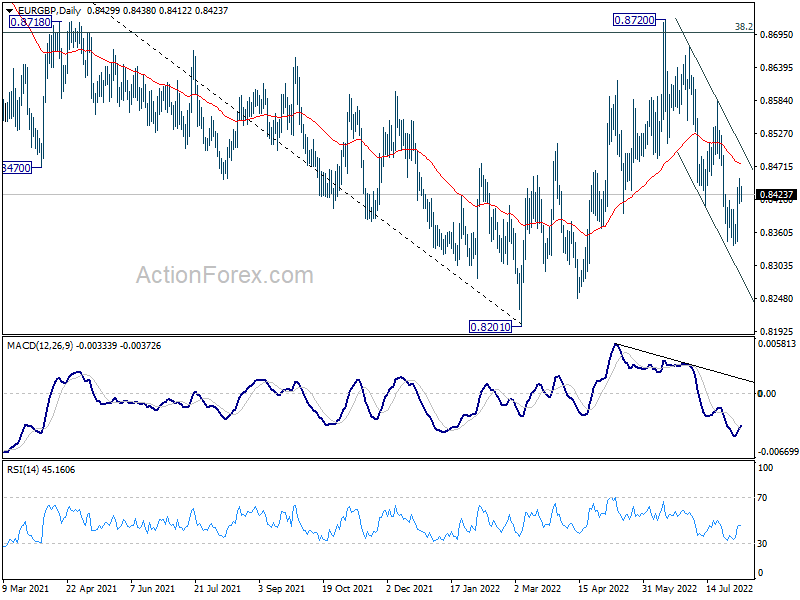
Daily Pivots: (S1) 0.8410; (P) 0.8431; (R1) 0.8452; More...
Intraday bias in EUR/GBP remains neutral for the moment. While stronger recovery might be seen, outlook will stay bearish as long as 0.8585 resistance holds. On the downside, break of 0.8338 will resume the decline from 0.8720 to retest 0.8201 low.
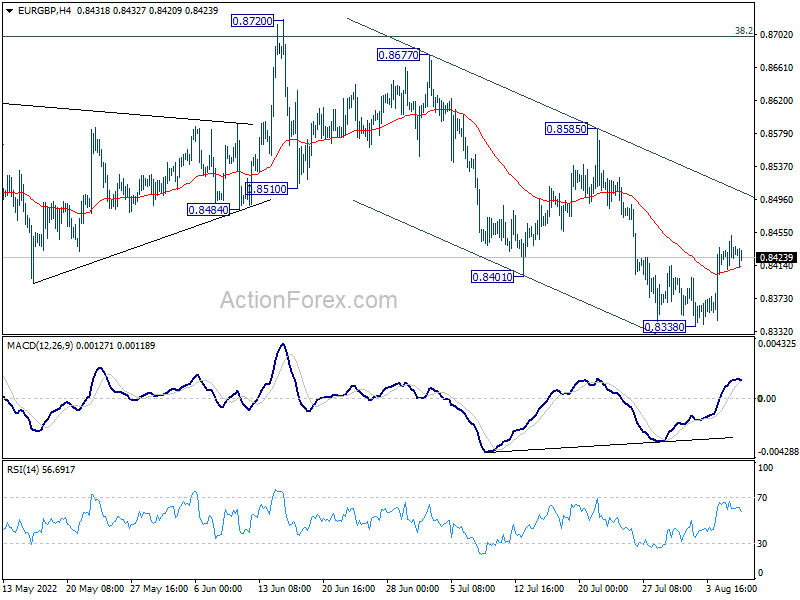
In the bigger picture, current development suggests rejection by 38.2% retracement of 0.9499 to 0.8201 at 0.8697. Medium term bearishness is maintained. Break of 0.8201 will resume larger down trend from 0.9499 (2020 high). Nevertheless, sustained break of 0.8697 will affirm the case that rise from 0.8201 is a medium term up trend itself.