

Sample Category Title
EUR/AUD Daily Outlook
Daily Pivots: (S1) 1.4674; (P) 1.4725; (R1) 1.4777; More...
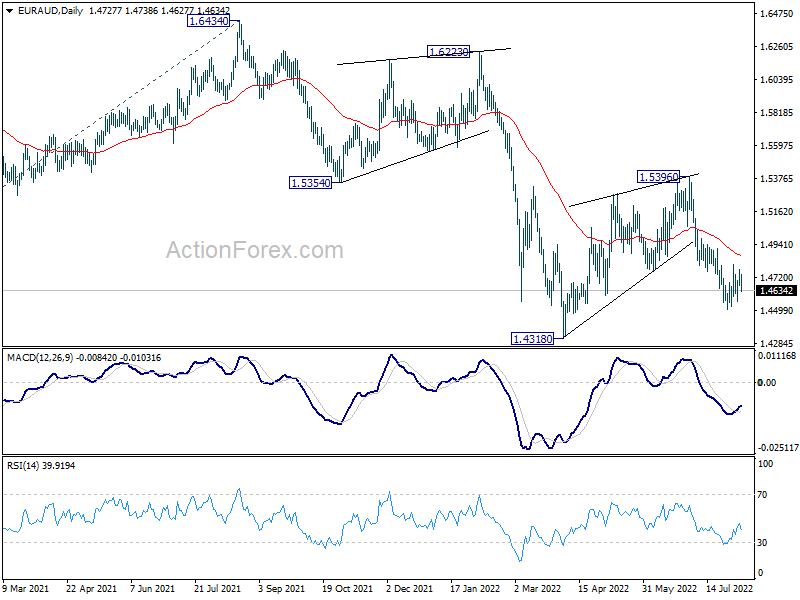
EUR/AUD is still bounded inside consolidation from 1.4508 and intraday bias remains neutral. While stronger recovery cannot be ruled out, upside should be limited below 1.4910 resistance to bring fall resumption. On the downside, break the 1.4508 will resume the decline from 1.5396 to retest 1.4318 low. However, firm break of 1.4910 will dampen this bearish view and bring stronger rally.
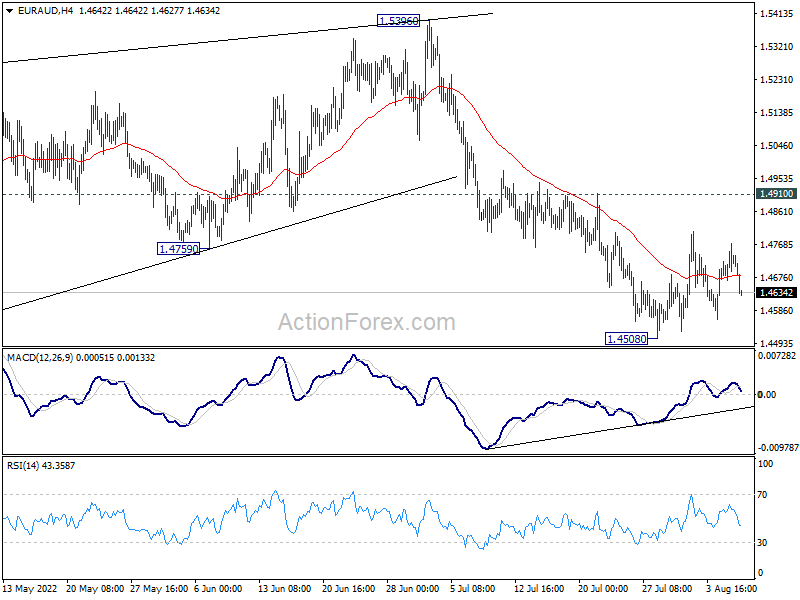
In the bigger picture, down trend from 1.9799 is still in progress. Break of 1.4318 low will target 61.8% projection of 1.9799 to 1.5250 from 1.6434 at 1.3623, which is close to 1.3624 long term support (2017 low). This will remain the favored case now as long as 1.5396 resistance holds.
EUR/CHF Daily Outlook
Daily Pivots: (S1) 0.9766; (P) 0.9784; (R1) 0.9808; More....
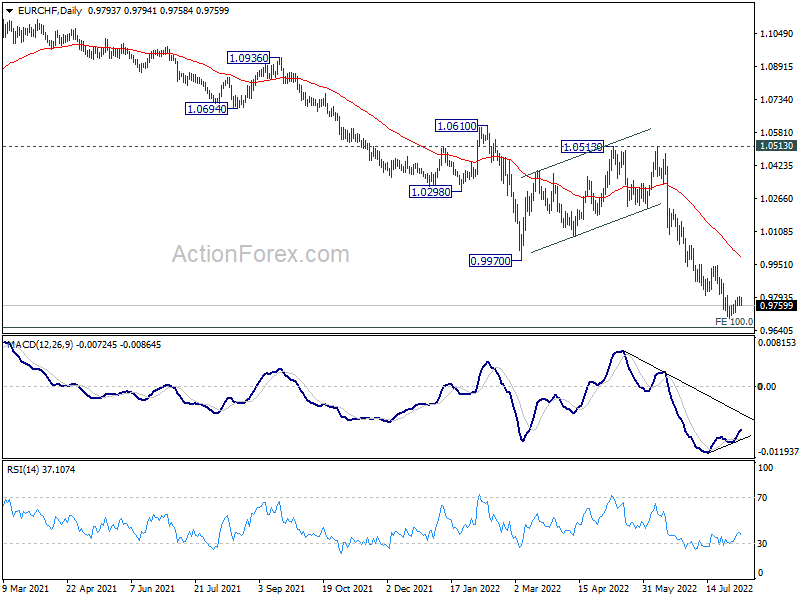
Intraday bias in EUR/CHF stays neutral as consolidation from 0.9697 is extending. While further fall cannot be ruled out, some support might be seen from 0.9650 long term projection level to bring rebound. Break of 0.9948 resistance will indicate short term bottoming. Nevertheless, firm break of 0.9650 will target 100% projection of 1.1149 to 0.9970 from 1.0513 at 0.9334.
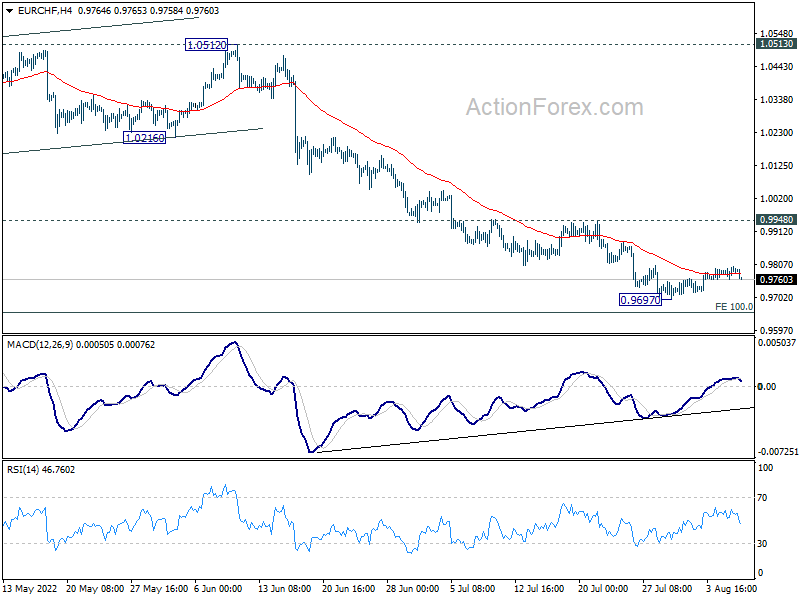
In the bigger picture, long term down trend from 1.2004 (2018 high) is expected to target 100% projection of 1.2004 to 1.0505 to 1.1149 at 0.9650. Firm break there will target 138.2% projection at 0.9033. On the upside, break of 1.0513 resistance is needed to indicate medium term bottoming. Otherwise, outlook will stay bearish in case of strong rebound.
GBPJPY Wave Analysis
- GBPJPY reversed from support level 160.50
- Likely to rise to resistance level 166.00
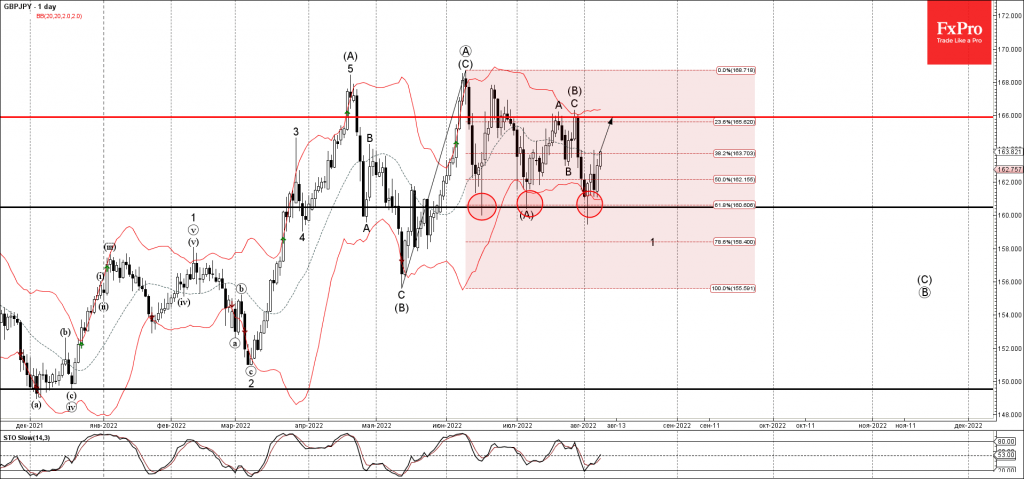
GBPJPY currency pair recently reversed up with the daily Hammer from the key support level 160.50 (which has been continually reversing the price from the middle of June).
The support zone near the support level 160.50 was strengthened by the lower daily Bollinger Band and by the 61.8% Fibonacci correction of the upward impulse from May.
GBPJPY can be expected to rise toward the next resistance level 166.00 (top of the earlier waves A and C).
EURJPY Wave Analysis
- EURJPY broke resistance level 136.65
- Likely to rise to resistance level 138.00
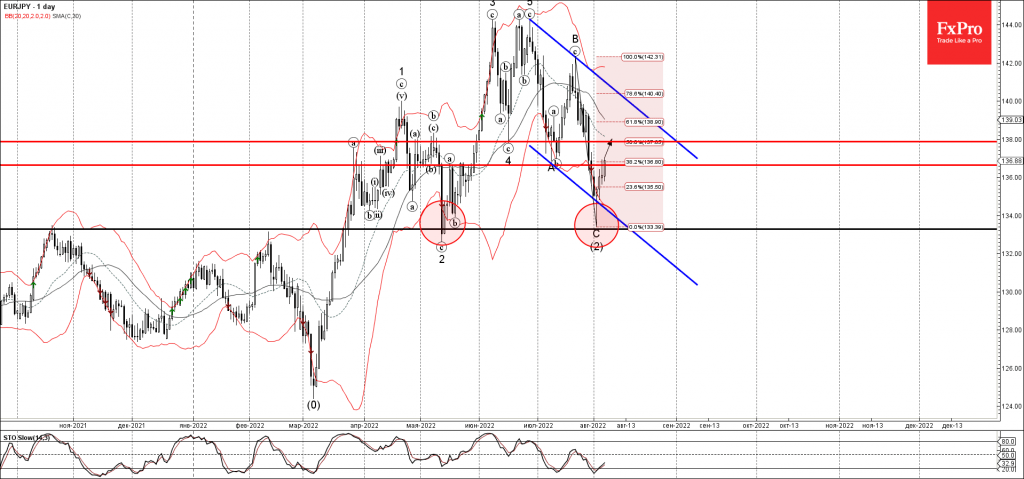
EURJPY currency pair recently broke the resistance level 136.65 intersecting with the 38.2% Fibonacci correction of the downward impulse C from July.
The breakout of the resistance level 136.65 should accelerate the active intermediate impulse wave (3) from the start of August.
Given the strongly bearish yen sentiment, EURJPY can be expected to rise toward the next resistance level 138.00.
GBPUSD Selling The Rallies At The Blue Box Area
Another instrument that we have been trading lately is GBPUSD forex pair. In this technical blog we’re going to take a quick look at the Elliott Wave charts of GBPUSD and explain the trading strategy. As our members know, GBPUSD is bearish against the 1.2670 pivot. Recently the pair has given us good trading opportunity. In the further text we are going to explain the Elliott Wave Forecast and the trading strategy.
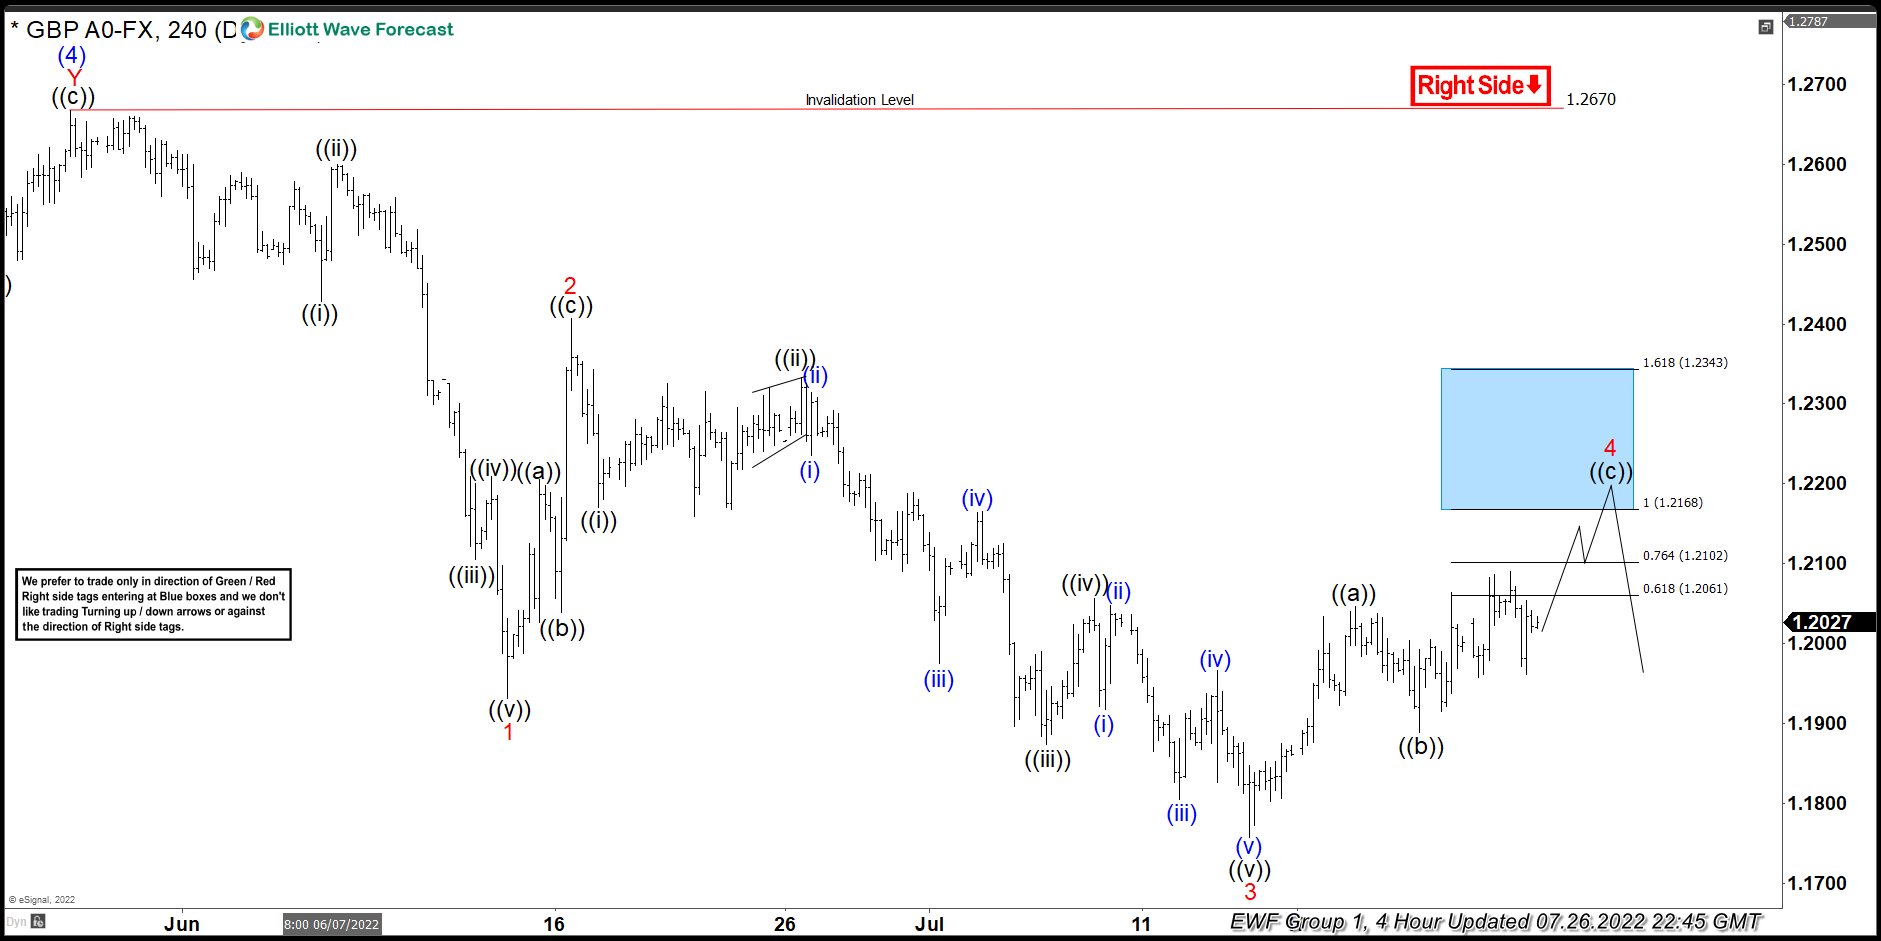
GBPUSD H4 Elliott Wave Analysis 07.26.2022
GPBUSD is showing higher high sequences from the lows. Recovery looks incomplete at the moment. We expect more upside within wave 4 recovery toward blue box area : 1.2343-1.2168. Strategy is selling the pair at the marked zone. Invalidation for the trade would be break above 1.618 fibs extension: 1.2343. As the main trend is bearish we expect sellers to appear at the blue box for 3 waves pull back at least. Once pull back reaches 50 Fibs against the ((b)) black low, we will make short position risk free ( put SL at BE) and take partial profits.
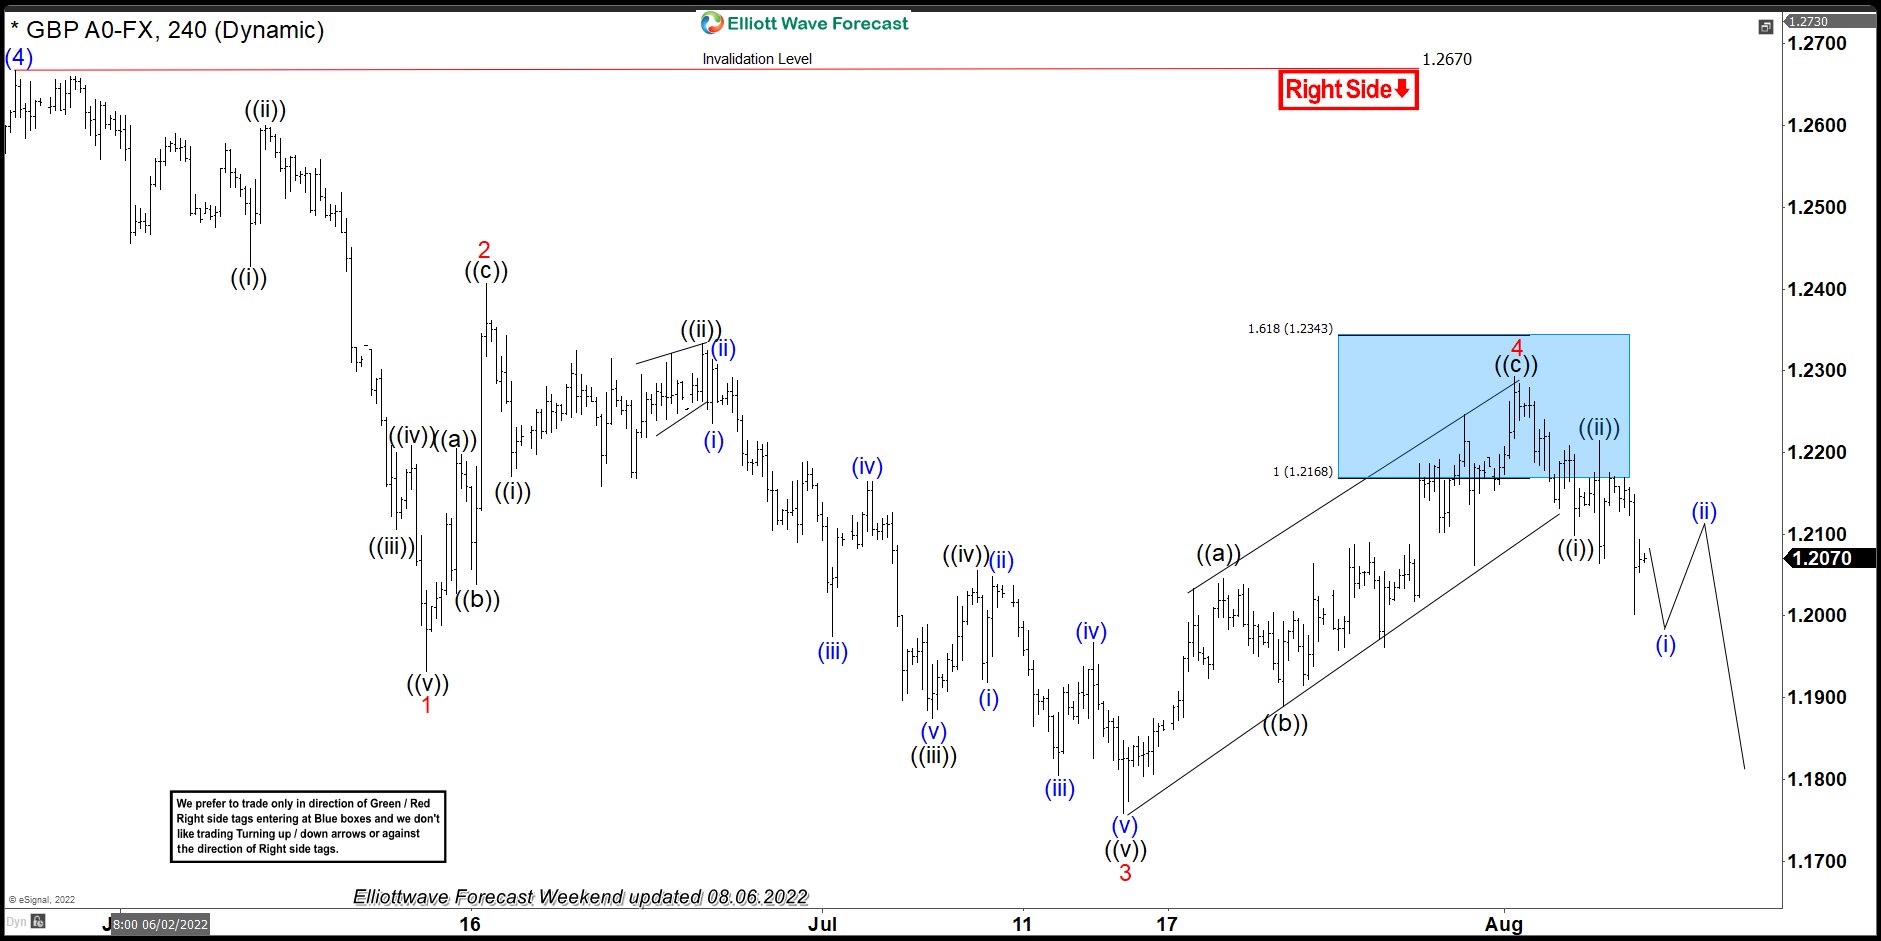
GBPUSD H4 Elliott Wave Analysis 08.06.2022
Eventually , GBPUSD made extension higher toward our selling zone :1.2343-1.2168. The pair found sellers right at the blue box and made reaction from there that has reached 50 fibs against the ((b)) black low. As a result, members who took short trades mad positions risk free . ( Put SL at BE) and took partial profits. At this stage we see wave 4 red completed at 1.2293 high. We would like to see break of previous low : 3 red 07/14 to confirm wave 5 red is in progress.
Keep in mind market is dynamic and presented view could have changed in the mean time. You can check most recent charts in the membership area of the site. Best instruments to trade are those having incomplete bullish or bearish swings sequences.We put them in Sequence Report and best among them are shown in the Live Trading Room.
EURUSD Continues to Trade Within Tight Boundaries
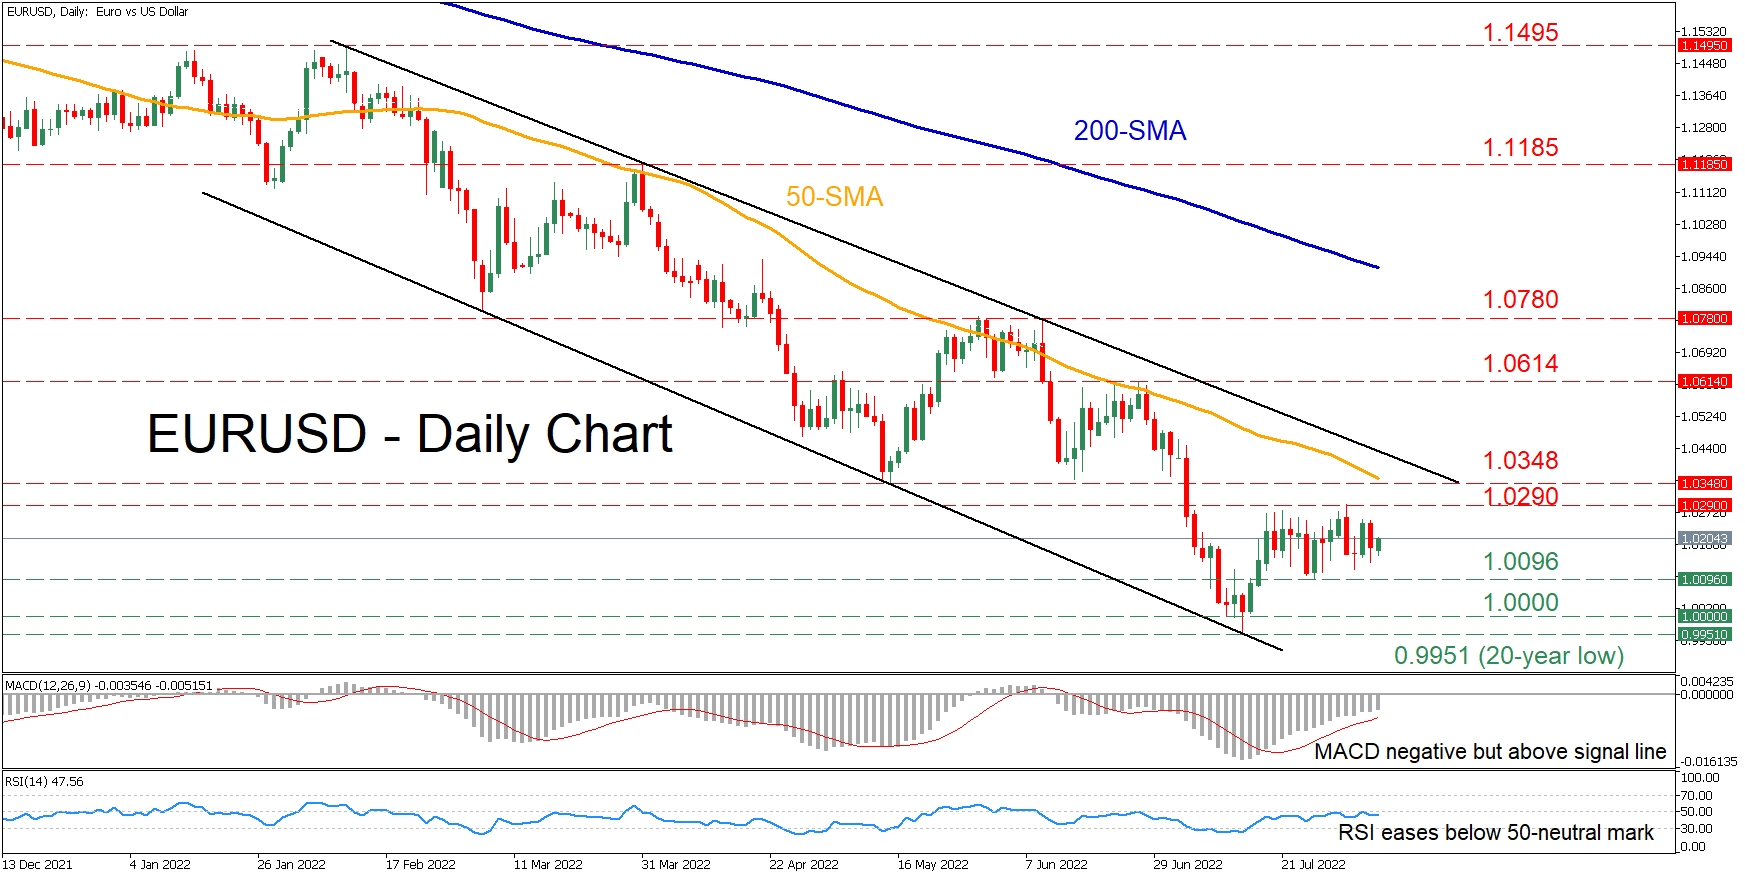
EURUSD has been trading sideways for three weeks after the price managed to rebound from the 20-year low of 0.9951. In addition, the pair is currently standing below both its descending 50- and 200-day simple moving average (SMAs), endorsing a broader bearish technical picture.
The momentum indicators suggest that near-term risks are tilted to the downside. Specifically, the MACD histogram remains in the negative territory but above its red signal line, while the RSI is flatlining beneath its 50-neutral mark.
Should negative momentum strengthen, the pair could descend to test the 1.0096 barrier. Sliding beneath that floor, the spotlight may turn to parity, which is considered a crucial psychological mark by markets. A violation of the latter could pave the way for the 20-year low of 0.9951.
On the flipside, upside pressures could send the pair to test 1.0290, which is the upper boundary of its recent rangebound pattern. Piercing through this region, the bulls might aim for 1.0348 before the 1.0614 peak appears on the radar. Even higher, 1.0780 could prove to be a tough obstacle for the price to overcome.
In brief, even though EURUSD has merely recovered, the price action remains within its long-term descending channel. Therefore, for the sentiment to reverse, the pair needs to initially escape its bearish pattern to the upside.
Gold Stays Within Bearish Channel
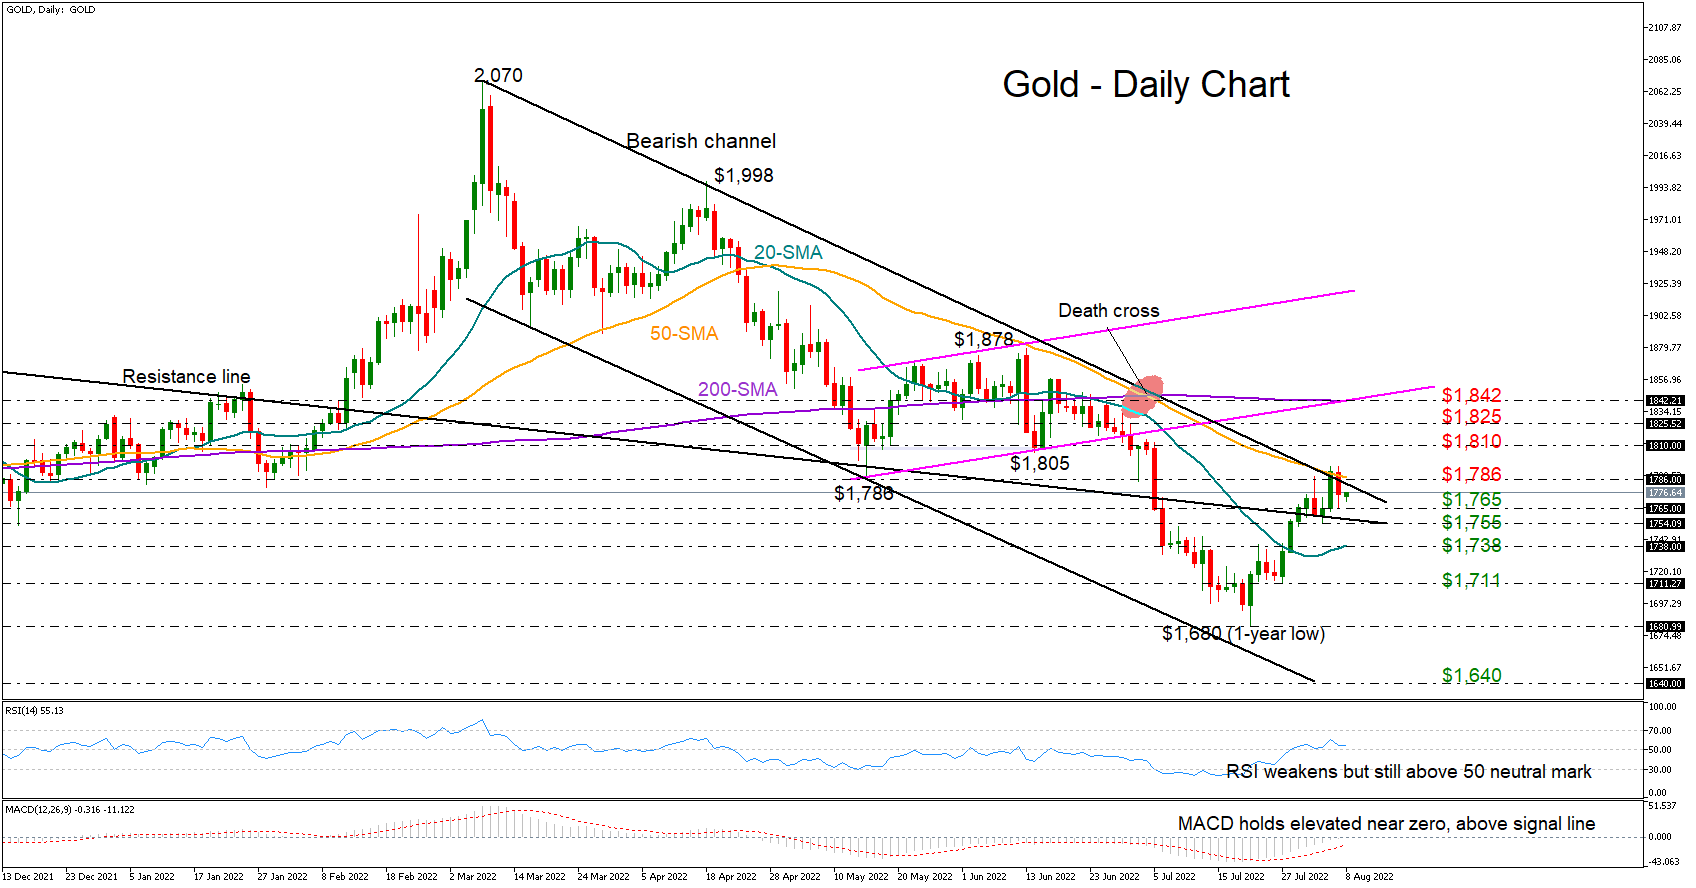
Gold was trading with a muted tone during Monday's early European trading hours at $1,774 following the pullback near the 50-day simple moving (SMA) and the surface of the downward-sloping channel last Friday.
The latest decline raised concerns about whether a new downturn will start within the bearish channel, but the momentum indicators have yet to clarify this. Although losing steam, the RSI is still above its 50 neutral mark, while the MACD remains attached around zero and marginally above its red signal line, both reflecting a neutral short-term bias instead.
Should selling pressures resurface, the $1,765 - $1,755 region could again come immediately to the rescue. If it fails to block the way down, the spotlight will turn to the 20-day SMA at $1,738, while lower, the bears will aim to breach the $1,711 restrictive region in order to meet the one-year low of $1,680.
Alternatively, the bulls may retry to raise their fortune above the channel’s upper boundary and the 50-day SMA at $1,786. If they succeed this time, buying interest could grow towards the $1,810 - $1,825 zone. The 200-day SMA at $1,842 could be a more critical target.
In brief, despite Friday’s failure to exit the bearish channel, gold has yet to motivate selling practices. A break below $1,758 could make a downside reversal more likely.
Bitcoin’s Bullish Stability
Bitcoin has been down 1.2% over the past seven days, trading at $23,600. These are tiny moves by crypto market standards. Indeed, the first cryptocurrency has been dealing with little amplitude over the past week.
Ethereum has added the same amount of 2.6% to $1720 in the last 24 hours and seven days. The top altcoins’ 7-days performance ranges from -0.11% (Solana) to +19% (Avalanche).
The total capitalisation of the crypto market, according to CoinMarketCap, rose 2.5% for the week to $1.1 trillion. The Bitcoin Dominance Index slipped 0.6 percentage points to 40.4% over the same period. The Cryptocurrency Fear and Greed Index fell 3 points for the week to 30 and remains in a state of “fear”.
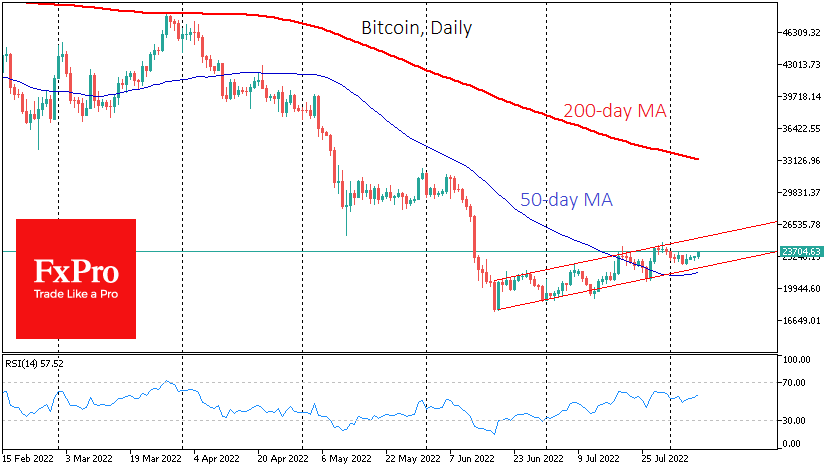
Last week Bitcoin made its fourth reversal from decline to rise within a moderately rising range. Investors were probably inspired by the positive dynamics of the stock markets amid recovering risk demand there. Buying forces reversed the trend even before the price reached the lower boundary of the corridor and the 50-day average.
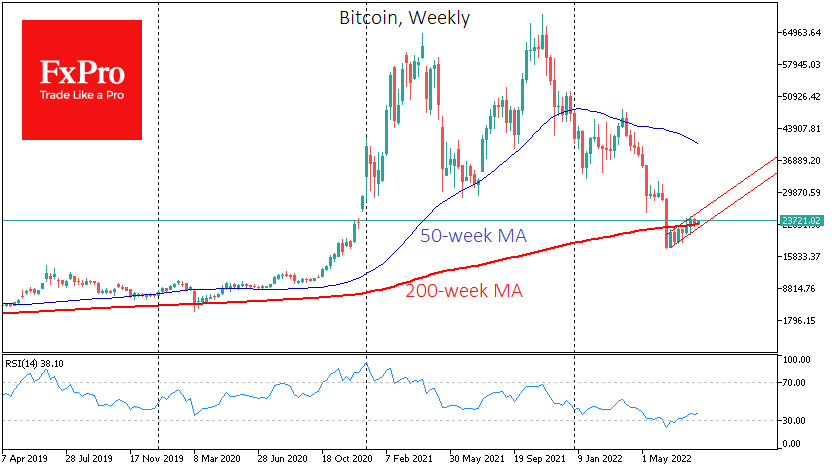
The 200-week moving average, in this case, acted as a support line, which we see as a confirmation that the downtrend in cryptocurrencies is over. However, it is worth remembering that a rally rarely follows this. Typically, the market goes through a long period of uncertain and vulnerable growth. Only global events like halving or extreme liquidity injections from central banks or governments into the financial system can kick-start a rally.
Background
That said, Americans are investing in cryptocurrencies despite the market downturn. According to The Balance’s financial website, 39% of US investors have become more invested in cryptocurrencies.
American investor and Shark Tank star Kevin O’Leary said he had bought high market capitalisation cryptocurrencies such as Bitcoin and Ethereum despite the slump in his investment portfolio.
According to a Cumberland survey of institutional investors, most respondents expect bitcoin to rise to $32K as soon as this year. Before that, however, BTC could fall to $16K.
Tesla CEO Elon Musk again spoke out in support of Dogecoin. According to him, the “dogecoin” cryptocurrency network can handle significantly more transactions than the bitcoin network.
CME Group, one of the world’s leading derivatives players, will launch BTC and ETH futures in euros.
Cautious Post-Jobs Report
A relatively slow start to the week as investors continue to digest Friday's jobs report and what it means for financial markets just as some optimism was returning.
The report itself was strong almost across the board, with participation being the only outlier, but Fed officials will not have been quite so enthused which makes it a tough one for investors to get too excited about.
On the one hand, it strengthens the argument that the economy is not really experiencing a recession as the labour market is simply too strong. On the other, it's also extremely tight and wages are continuing to rise at a fast rate which will make the task of fighting inflation that much harder.
With another 75 basis point rate hike next month now the favoured outcome, although a lot can change in that time, it could be a nervy couple of days for investors ahead of Wednesday's inflation report. It turns out the shift to data-dependency isn't all it was cracked up to be.
Another record Chinese trade surplus but also more lockdowns
It's a relatively quiet day, and the economic calendar continues to look very thin. How traders continue to respond to Friday's report will be key in how we start the week. Asia is off to a mildly positive start but it's nothing to write home about.
Cities on the Chinese resort island of Hainan have been placed in lockdown following another Covid outbreak, reminding investors once more of the country's commitment to its zero-Covid policy at all costs. At the same time, Hong Kong has sought to appease residents and the business community by cutting quarantine periods from seven days to three. While still very restrictive compared to much of the world at this point, it was a bolder move than anticipated and highlighted the pressure to return to normal life.
Chinese trade data highlighted the struggles of the domestic economy, with imports rising 2.3% annually last month while exports remained surprisingly strong up 18%, delivering another record trade surplus. The numbers aren't expected to remain quite so favourable in the months ahead as reopening momentum fades, leaving the import numbers a concern.
Iran talks resume as oil makes small gains
Oil prices are a little higher today, recovering from the lows on Friday. The jobs report highlighted how strong the economy remains although traders are now increasingly nervous about more aggressive tightening sending the economy into a deeper recession further down the road. It really is a lose-lose.
The resumption of Iran nuclear talks today is one potential downside risk for the oil price, given the ability of the country to quickly ramp up production if a deal is struck. Not to mention its reportedly large oil and gas reserves. A deal could apparently be struck within days although we have heard that a lot at times this year.
Gold nervously eyeing inflation data
Gold is flat today after Friday's jobs report took the wind out of its sails. The recovery trade was being fueled by the belief that data-dependency meant a slower pace of tightening but that's now clearly not the case (nor was it ever, in fairness). We may see some nervy trading in the yellow metal ahead of Wednesday's inflation report although it still seems to have an eye on $1,780-1,800 which is the next major test to the upside.
A swift recovery
Sentiment across the markets looks a little fragile this morning and yet crypto appears to have shrugged off Friday's shock much more quickly. Up more than 3% this morning and climbing once more with its sights set on $25,000 it seems. The momentum indicators will be fascinating here as the recovery appeared to be losing steam during the last ascent in late July.
When Good News is Bad News
On Friday, US Non-Farm Payrolls came in over twice what was expected. The unemployment rate dropped as well, if only by a decimal point. Yet US stocks (as measured by the S&P 500 and Nasdaq) dropped. Why would it be a "bad" thing for US businesses that more Americans have jobs, and have more disposable income?
This is a recurring phenomenon in financial markets that can disrupt trading strategies. It's not exclusive to the US. in Europe, indices have been responding differently, but that could change. Since there is a direct correlation between equities, commodities, and forex, this could affect us currency traders as well.
What's going on?
When central banks get involved in the economy, this changes the dynamic of the markets. Because most day-to-day trading is conducted on margin, the cost of credit plays an important role in trader decisions. And central banks try to influence the economy by manipulating the interest rate, which in turn manipulates financial markets.
Generally, central banks aren't interested in the short-term ups and downs of financial markets. They only care in terms of price fluctuations being a sign of liquidity in the markets, which could have broader economic effects. So, if the Fed, for example, raises rates, this could make it more expensive to invest on margin. Which in turn means traders will buy and sell less stocks. In general, that means the stock market goes down. The Fed doesn't really care about a slight drop in stock prices caused by less liquidity, because part of the reason for raising rates is to cut back on "excess" liquidity that could be driving inflation.
The markets are most sensitive
Inflation, of course, is rising prices and that concept also applies to the stock market. If stock prices are increasing above the valuations of the companies, then prices are getting "inflated". Last year, companies were reporting disappointing earnings because of the lockdowns, but stock prices were rising. Meaning that stock prices were getting inflated.
The Fed's move to raise rates is the driving force behind lower stock prices, and that's what the Fed is trying to achieve in the broader market. The stock market is simply the quickest to respond.
Interpreting the data
Better economic data is a sign that prices will keep rising, and more effort by central banks is necessary to control inflation. The stock market responds to that first, meaning that the good economic news ends up being bad news for the stock market. Even if companies themselves have good news, like Tesla's stock split, they could still be pushed down by the broader market. In turn, currencies get stronger, as the market behaves in a risk-off pattern.
As long as central banks are highly active, markets are likely to have an inverse news pattern. That bad news makes the market behave in a more risk-on way, and good news leads to a more risk-off behavior pattern. This might mean trading strategies need to be inverted. But traders need to be wary of when central banks will step back from intervening, and the usual "good news is good news" dynamic suddenly returns.