Sample Category Title
Australia Westpac consumer sentiment dropped to 81.2 in Aug
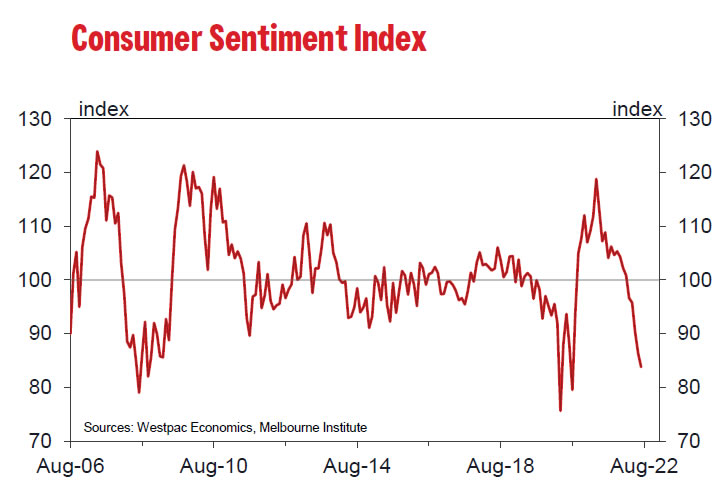
Australia Westpac Consumer Sentiment Index fell -3% to 81.2 in August. The reading was on par with the lows of the Covid and Global Financial Crisis. Also, there was a cumulative decrease of -22.9% from recent peak made in November 2021.
Economic conditions for the 12 months dropped from 80.3 to 73.9. Economic conditions for the next five years dropped from 91.6 to 90.7. Unemployment expectations index dropped from 109.8 to 103.4. House price expectations index dropped from 104.9 to 97.1.
Regarding RBA's next meeting on September 6, Westpac expects the central bank to hike by another 50bps to 2.35%, leaving the cash rate in "neutral range". It expects RBA to then scale back the increase to 25bps per meeting until February 2023.
GBP/USD Dips, Gold Price Eyes More Upsides
Key Highlights
- GBP/USD struggled near 1.2290 and corrected lower.
- It broke a key bullish trend line with support near 1.2160 on the 4-hours chart.
- Gold price is showing positive signs and eyes more upsides.
- EUR/USD is consolidating near the 1.0200 level.
GBP/USD Technical Analysis
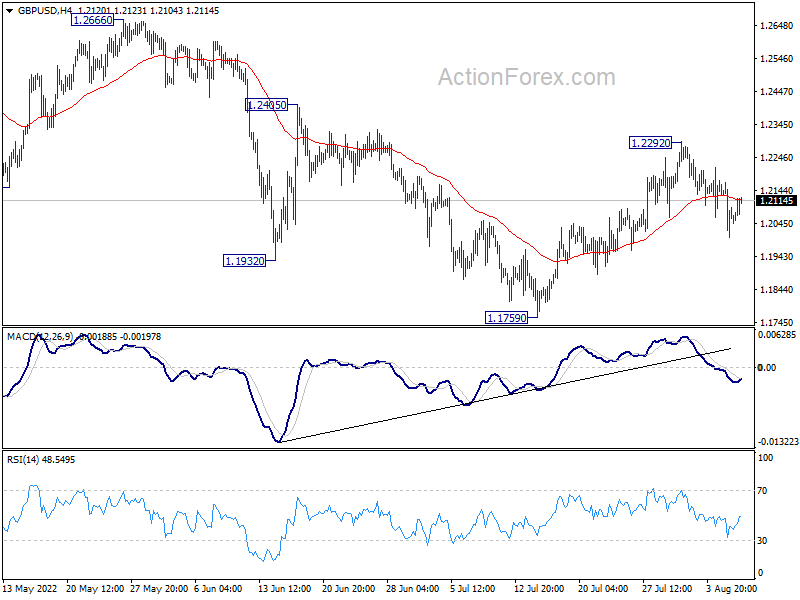
The British Pound attempted an upside break above the 1.2300 resistance against the US Dollar. GBP/USD failed to continue higher and formed a short-term top near 1.2293.
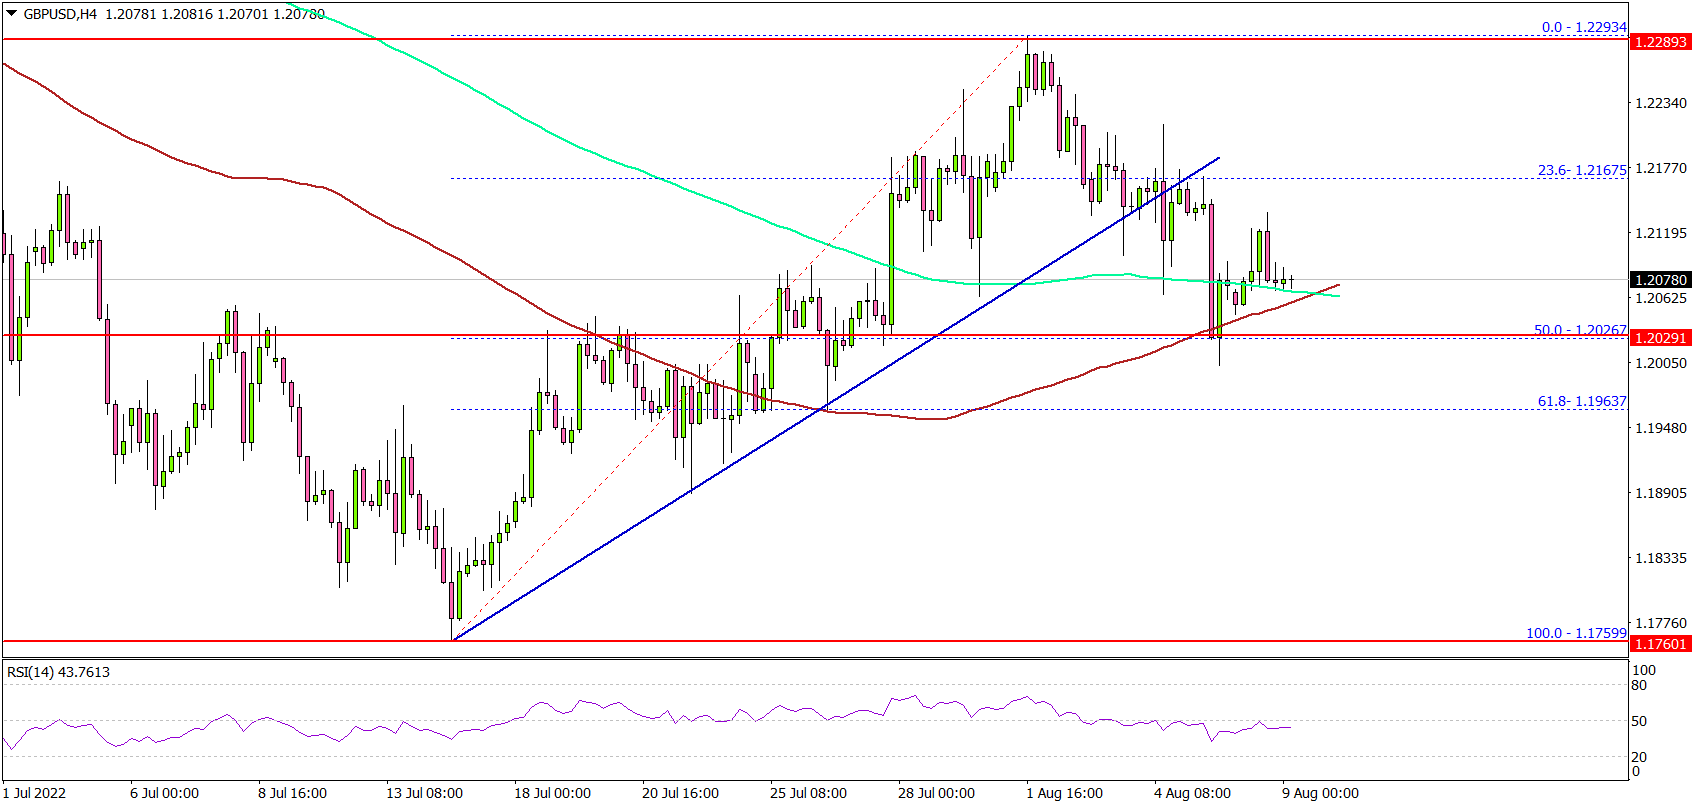
Looking at the 4-hours chart, the pair started a downside correction below the 1.2250 support level. There was a move below a key bullish trend line with support near 1.2160. The pair dipped below the 23.6% Fib retracement level of the upward move from the 1.1759 swing low to 1.2293 high.
It even spiked lower to test the 1.2000 level. It is now consolidating near the 100 simple moving average (red, 4-hours), and the 200 simple moving average (green, 4-hours).
The first major support is near the 1.2025 level. It is near the 50% Fib retracement level of the upward move from the 1.1759 swing low to 1.2293 high. A downside break below the 1.2000 support might spark more losses.
The next major support is near 1.1920. Any more losses might send the pair towards the 1.1850 zone. On the upside, the pair is facing resistance near the 1.2100 level.
The next major resistance is near the 1.2160 level, above which the pair could accelerate higher. In the stated case, the pair could rise towards the 1.2300 resistance zone in the near term.
Looking at gold price, there was a steady increase above the $1,780 level and seems like the bulls are eyeing more gains above the $1,800 resistance.
Economic Releases
- IBD/TIPP Economic Optimism Index for July 2022 – Forecast 36.55, versus 38.5 previous.
Eco Data 8/9/22
[php_everywhere instance="1"]
Brent is Stressed and Continues to Decline
The commodity market suffered another stress last week. On Monday, the situation reached stability, but it remains quite complicated; Brent is trading at $95.60.
The asset closed last trading week near its 5-month lows.
The key reason for these negative vibes is the same’ global expectations of a worldwide recession. Economic slumps all over the world will eventually lead to a decline in demand for fuel, hence a drop in energy prices.
Another local factor that puts pressure on is the USD strengthening.
Last Friday’s report from Baker Hughes showed that over the past week, the Oil Rig Count in the US lost 7 units, down to 598. In Canada, the indicator increased by 3 units, up to 140. Shale oil companies are in no hurry to invest more money in production.
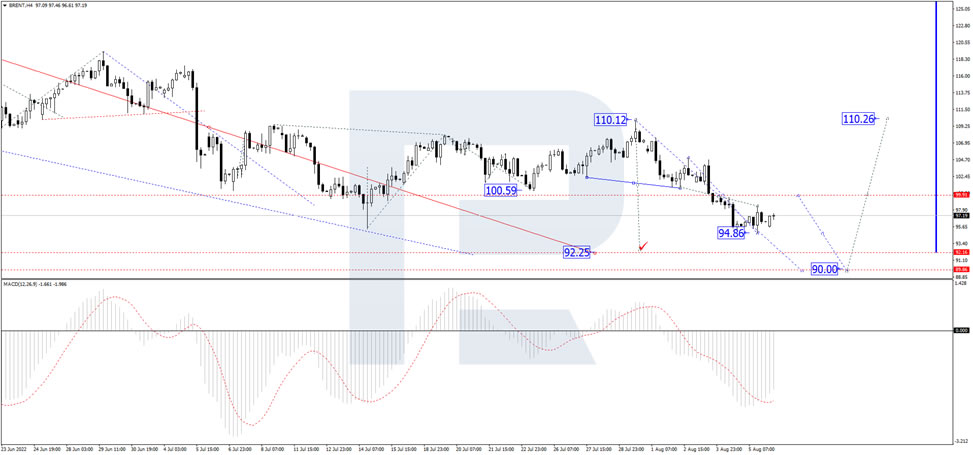
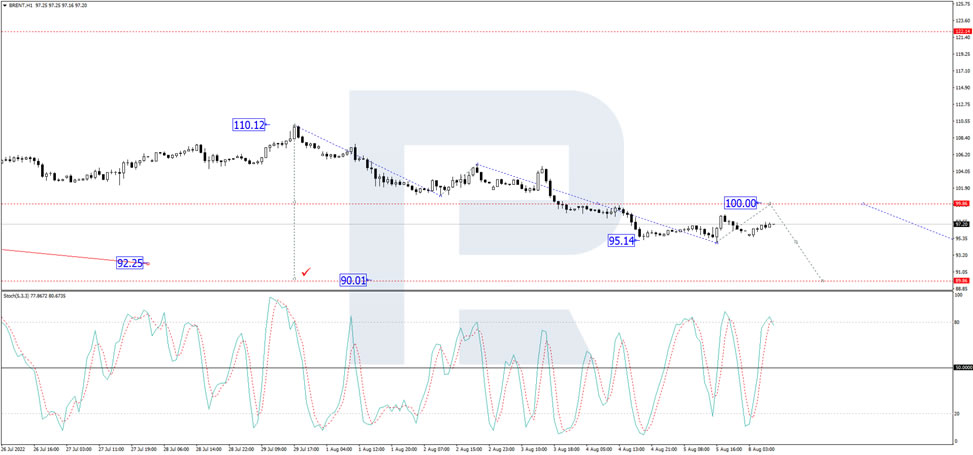
On the H4 chart, after breaking 100.00 downwards, Brent is still correcting and has already reached the short-term target at 94.80. Possibly, today the pair may form one more ascending structure to test 99.90 from below and then complete the descending wave by reaching 90.00. After that, the instrument may resume trading upwards with the target at 122.00. From the technical point of view, this scenario is confirmed by the MACD Oscillator: its signal line is moving near the lows outside the histogram area and may later grow to reach 0.
As we can see in the H1 chart, after finishing the descending correctional structure at 95.15, Brent is consolidating above this level. Possibly, the asset may break the range to the upside and start another growth with the target at 100.00. Later, the market may resume falling to reach 90.00. From the technical point of view, this idea is confirmed by the Stochastic Oscillator: its signal line is moving near the highs above 80. Later, the line may fall to break 50 and continue falling to reach 20.
Gold Price Moved into a Positive Zone above $1,765
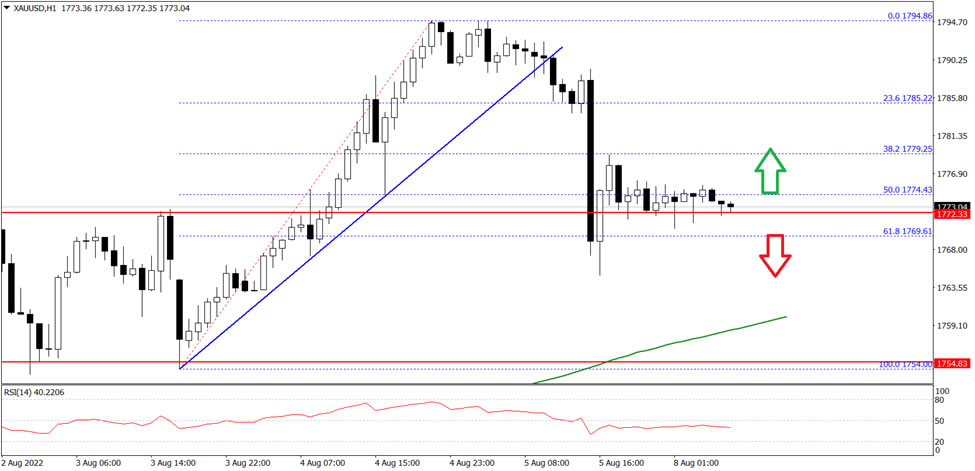
Gold price started a decent increase from the $1,750 zone against the US Dollar. The price traded above the $1,765 resistance to move into a positive zone.
It settled above the $1,780 level and the 50 hourly simple moving average. It traded as high as $1,794 before there was a downside correction. There was a move below the $1,785 level and a connecting bullish trend line.
On the downside, there is a key support near $1,770 on FXOpen. The next major support is near the $1,765 level, below which the price might decline towards the $1,750 support level in the near term.
An immediate resistance on the upside is near the $1,775 level. The first major resistance is near the $1,780 level. The next main resistance could be near the $1,795 level, above which the price could start another steady increase.
Data from Japan Helped the Yen Break Downtrend
Today is a quiet day regarding data from Europe and the USA, allowing a look at data from Asia. Statistics from Japan indicate that the worst for the Rising Sun country may be over, and the weakness in the yen has provided the necessary impetus for growth.
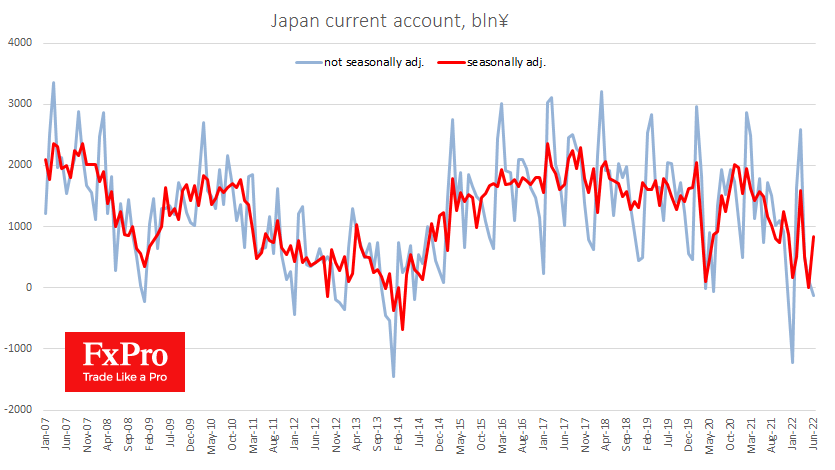
The seasonally adjusted current account closed with a surplus of 838 billion yen in June against an expected deficit of 30 billion yen – substantially better than predicted. The surplus reflects capital inflows into the country, which supports the yen after a 20% plunge against the dollar between March and July.
In addition, bank lending is recovering. Data for July showed an increase of 1.8% y/y against 1.2% a month earlier and 1.5% expected, and only +0.3% in February. The rebound in lending is an essential signal of business and household activity after years of stagnation. If the recovery continues, the Bank of Japan might decide to make a vital shift in its multi-year policy and change the parameters of QE.
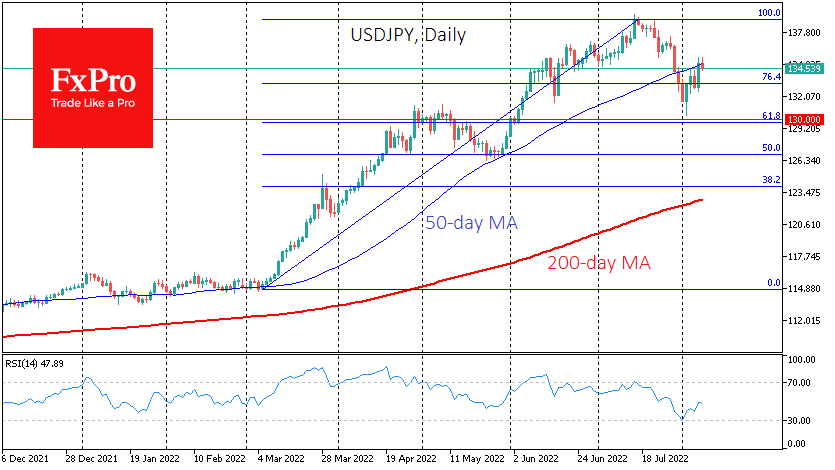
This data leveraged the technical picture by reversing the USDJPY from the 50-day MA line today. Today’s downside momentum reinforced the move of this curve from the support line into resistance. We should not be surprised if further downward momentum develops to 130 from the current 134.5.
Australian Dollar Roars Higher
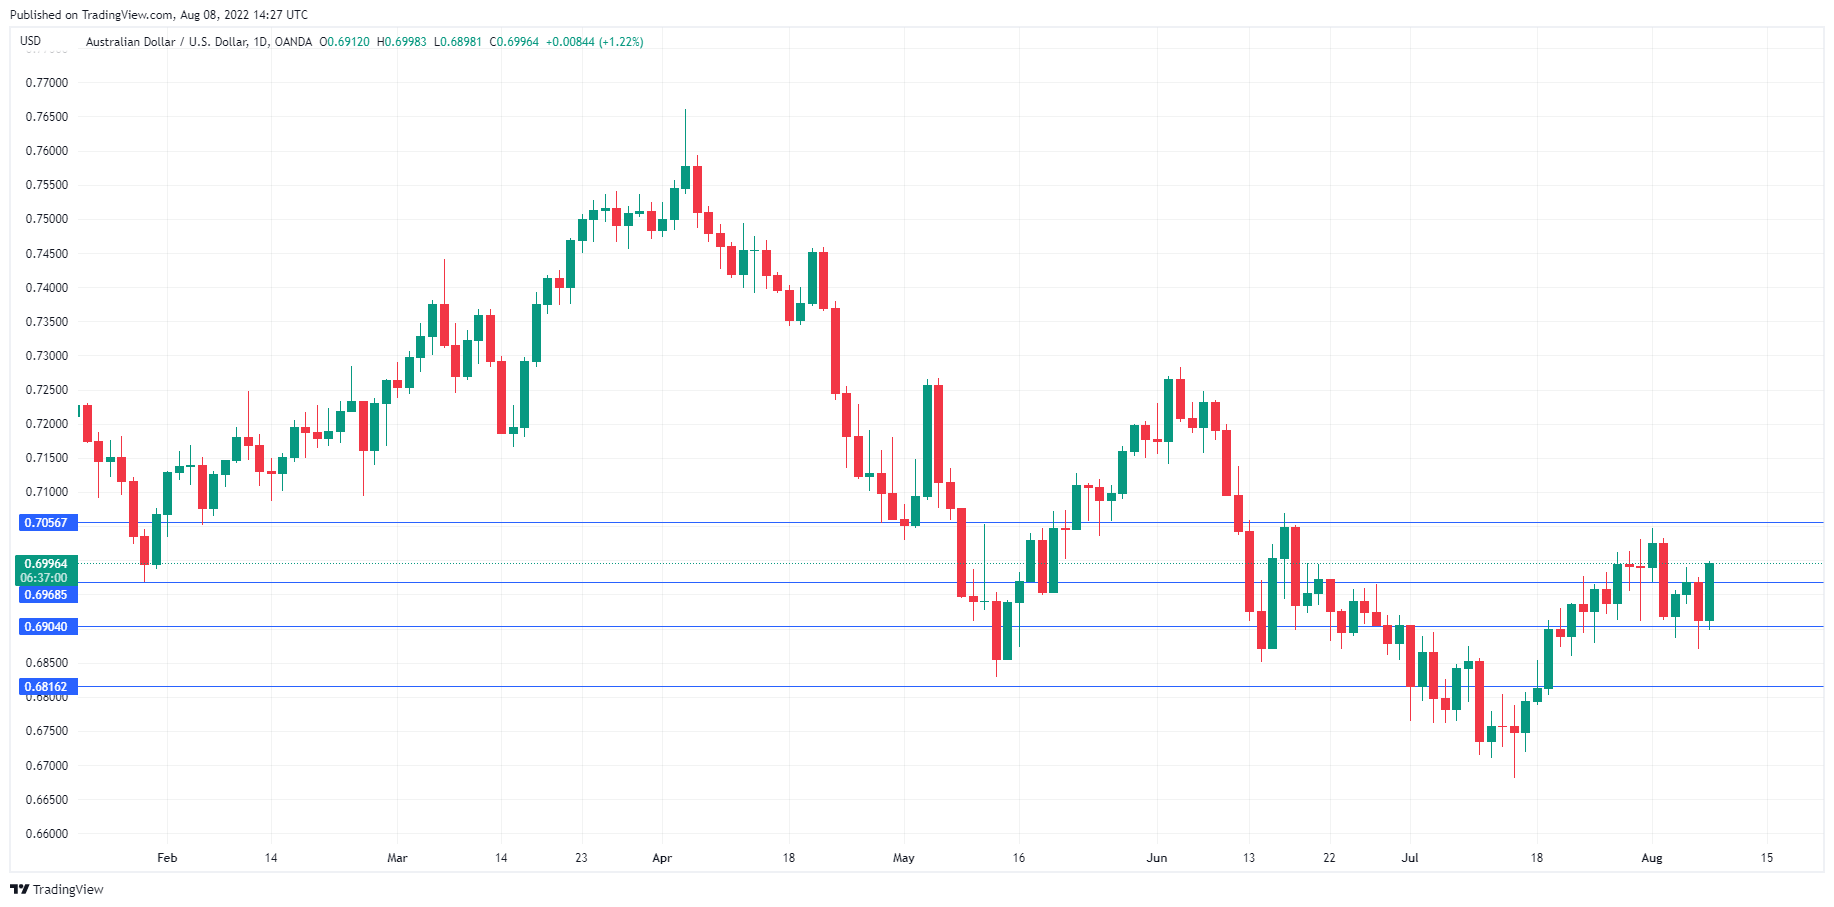
The Australian dollar continues to exhibit sharp volatility. AUD/USD declined by 0.82% on Friday but has bounced back today and soared 1.15%. Currently, the pair is trading at 0.6990.
Let’s take a look at the reasons that the Aussie was pummelled on Friday. First, a sparkling US nonfarm payrolls report on Friday sent the US dollar broadly higher. The July release showed the economy added a massive 528 thousand new jobs, crushing the estimate of 250 thousand and above the June gain of 398 thousand. Unemployment ticked down to 3.5% from 3.6%, and wage growth remained unchanged at 5.2%, ahead of the forecast of 4.9%. The data points to a robust, but tight US labour market. For the Fed, the strong gain in wages is well above the Fed’s inflation target of 2% and lends support to another supersize rate 0.75% hike come September.
The US labour market remains solid, but the sharp tightening of rates has reduced activity in other parts of the economy, especially manufacturing and goods and service. Still, the US does not appear to be in a recession despite all the noise after two straight negative quarters of GDP, which meets the technical definition of a recession. Another definition is significant activity across the economy, and that is clearly not the case in the US, with a red-hot labour market. After the home-run NFP on Friday, US recession fears have abated.
RBA revises inflation, growth forecasts
The Australian dollar also lost ground due to the RBA’s quarterly Monetary Policy Statement on Friday. The RBA warned that the economy will slow as inflation continues to accelerate. The statement started with a discussion about inflation, indicative of the importance with which the central bank views inflation. In the statement, the RBA revised its forecast for inflation peaking at 7.75%, up from the May forecast of 5.9%. Growth forecasts have been lowered, with the RBA now projecting 3.25% growth, down from 4.25%.
AUD/USD Technical
- AUD/USD is testing resistance at 0.6943, followed by resistance at 0.7016
- There is support at 0.6839 and 0.6766
EUR/USD Mid-Day Outlook
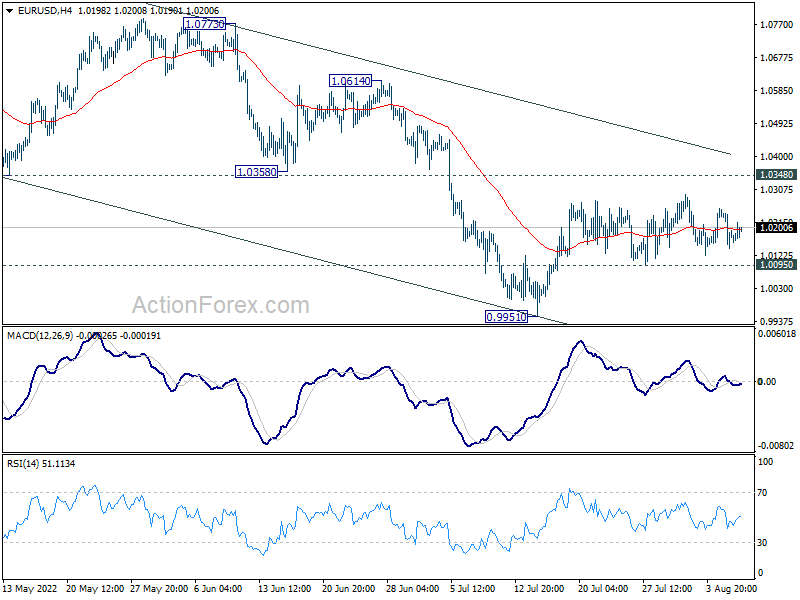
Daily Pivots: (S1) 1.0130; (P) 1.0191; (R1) 1.0240; More...
Intraday bias in EUR/USD remains neutral as sideway trading continues. On the downside, break of 1.0095 minor support will argue that larger down trend is ready to resume. Intraday bias will be back to the downside for retesting 0.9951 low first. For now, outlook will stay bearish as long as 1.0348 support turned resistance holds, even in case of another rise.
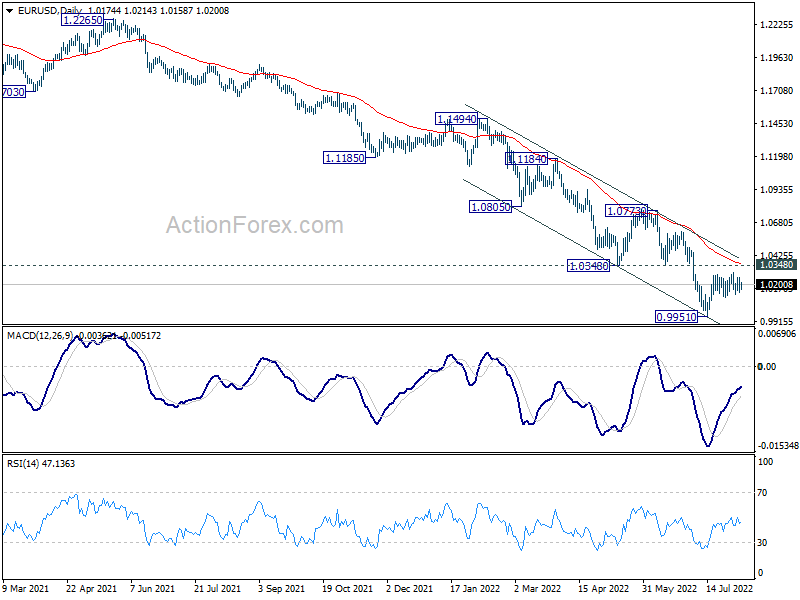
In the bigger picture, down trend from 1.6039 (2008 high) is still in progress. Next target is 100% projection of 1.3993 to 1.0339 from 1.2348 at 0.8694. In any case, outlook will stay bearish as long as 1.0773 resistance holds, in case of strong rebound.
GBP/USD Mid-Day Outlook
Daily Pivots: (S1) 1.1993; (P) 1.2081; (R1) 1.2158; More...
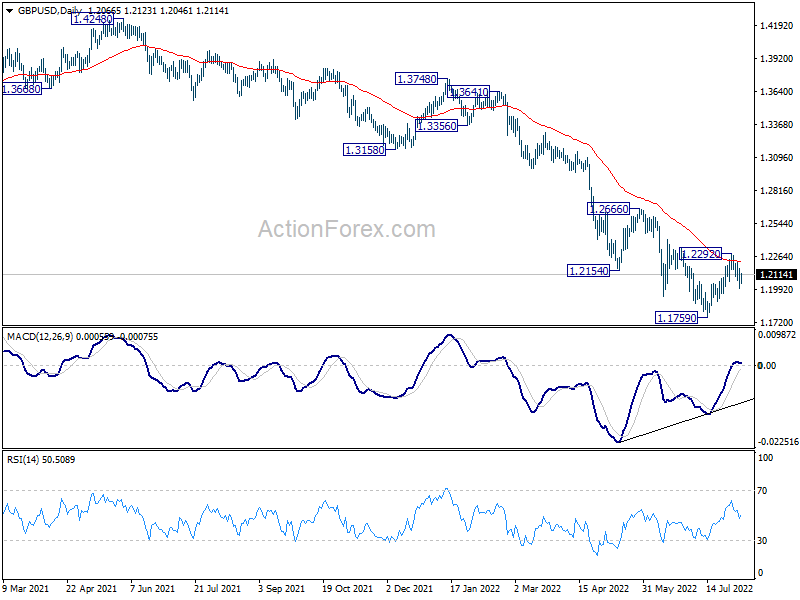
Outlook in GBP/USD is unchanged. Intraday bias remains mildly on the downside. Rebound from 1.1759 should have completed after hitting 55 day EMA. Deeper fall would be seen back to retest 1.1759 low. On the upside, break of 1.2292 will resume the rebound towards 1.2405 resistance instead.
In the bigger picture, fall from 1.4248 (2018 high) could be a leg inside the pattern from 1.1409 (2020 low), or resuming the longer term down trend. Deeper decline is expected as long as 1.2666 resistance holds. Next target is 1.1409 low. However, firm break of 1.2666 will bring stronger rise back to 55 week EMA (now at 1.2925).
USD/CHF Mid-Day Outlook
Daily Pivots: (S1) 0.9553; (P) 0.9602; (R1) 0.9665; More...
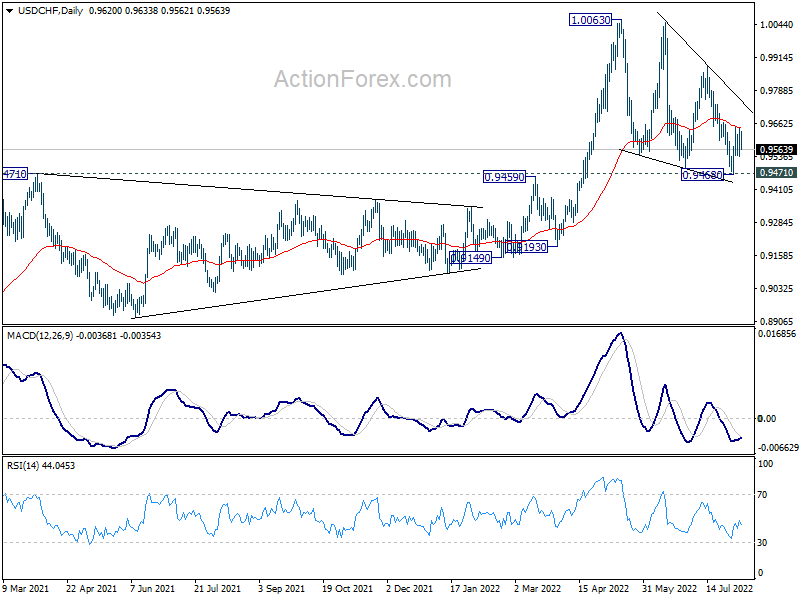
Intraday bias in USD/CHF remains neutral and outlook is unchanged. On the upside, break of 0.9650, and sustained trading above 55 day EMA (now at 0.9647) will raise the chance that corrective pattern from 1.0063 has completed. Further rally should then be seen to 0.9884 resistance next. However, decisive break of 0.9471 support will carry larger bearish implication.
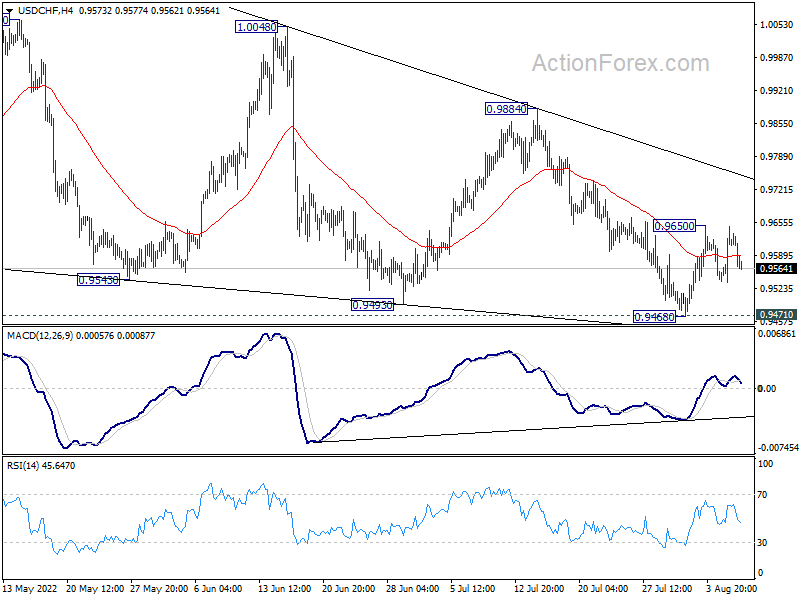
In the bigger picture, medium term up trend from 0.8756 (2021 low) is still in progress. On resumption, next target is 1.0342 (2016 high). Sustained break there will resume long term up trend from 0.7065 (2011 low). This will remain the favored case as long as 0.9471 resistance turned support holds. However, firm break of 0.9471 will raise the chance that such up trend is over.