Sample Category Title
EUR/USD: Euro Continues to Trend Lower; Key Support at 1.0340 in Focus Again
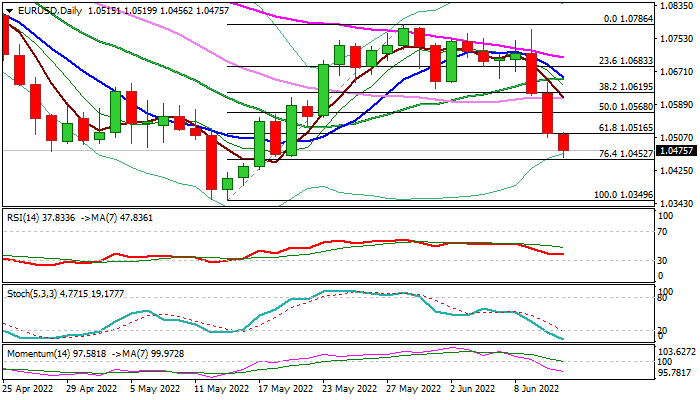
The Euro holds in red for the third straight day and retraced almost 76.4% of 1.0349/1.0786 corrective leg, signaling that larger downtrend is on track to complete its short corrective phase and threatening of renewed attack at key longer term support at 1.0340 (Jan 2017 low) after previous attempt last month stalled just ticks ahead of this level.
The single currency was pressured by ECB’s policy decision which lacked more hawkish tone and disappointed traders, while stronger dollar on risk aversion and soaring US inflation, adds pressure.
Early Monday’s fresh weakness cracked a minor higher base at 1.0459 and pressuring pivotal Fibo support at 1.0452 (76.4% of 1.0349/1.0786 upleg), with break here to open way for test of 1.0349/40 (2022 low / Jan 2017 low).
Falling and thickening daily cloud continues to weigh and adds to negative signals from rising bearish momentum, although oversold stochastic suggest that bears may take a breather before final push towards 1.0349/40 targets.
Upticks are expected to offer better selling opportunities while holding below 1.0568 (daily Kijun-sen / broken 50% retracement of 1.0349/1.0786 upleg).
Res: 1.0516; 1.0568; 1.0606; 1.0619
Sup: 1.0452; 1.0400; 1.0388; 1.0349
GBP/USD: Sterling Falls Further on Risk Aversion, Downbeat UK GDP Data
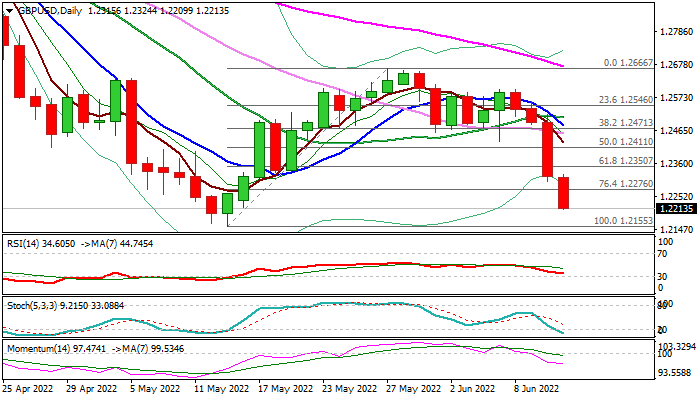
Cable dips to one-month low in early Monday, in extension of Friday’s post-US CPI 1.4% drop.
Risk aversion dominates at the start of the week and deflates sterling, while dollar was boosted by continuous rise in US inflation which reached new highest in four decades in May.
Unexpectedly weak UK GDP figure for April, added to pound’s negative near-term outlook.
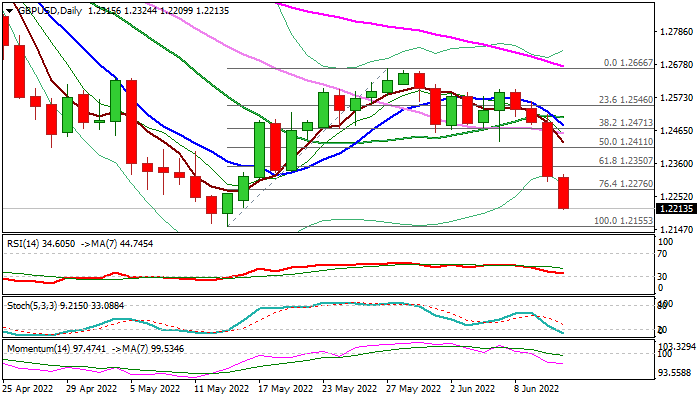
Rising negative momentum on daily chart and moving averages in full bearish configuration, support the action which pressures round-figure 1.22 support, the last obstacle on the way towards key support at 1.2155 (2022 low), violation of which would confirm full retracement of 1.2155/1.2667 corrective upleg and risk extension towards next key levels at 1.2080/00 (Fibo 76.4% of larger 1.1409/1.4249 Mar 2020/May 2021 rally / psychological).
Res: 1.2276; 1.2324; 1.2350; 1.2413
Sup: 1.2200; 1.2155; 1.2100; 1.2080
Pound Closing in on 2-Year Low
The British pound is down sharply at the start of the week, as US inflation and weak UK numbers are weighing on the pound. In the European session, GBP/USD is trading at 1.2174 down 1.16% on the day. The pound is perilously close to a 2-year low of 1.2155.
US CPI accelerates
The US dollar sprinted higher at the end of the week, as US inflation continued to climb in May. Headline inflation rose to 8.60 YoY, up from 8.30% in April. Core inflation dipped to 6.0%, down from 6.2%, but the slight drop did little to reassure investors that inflation is under control. For the record, the CPI reading marked another 40-year high.
The Fed will have to maintain an aggressive stance, which could mean more 50-bp hikes right through September. The markets have increased bets on a 75-bp hike at this week’s meeting, although it’s unlikely that the Fed will want to surprise the markets in this turbulent environment. If Fed Chair Powell is looking to send a hawkish message to the markets, he could hint at the meeting press conference that a 75-bp increase is on the table if inflation doesn’t ease. That kind of warning would certainly put some wind into the sails of the US dollar.
The US inflation release triggered a sharp rise in US yields which has boosted the US dollar. The dollar index has risen to 104.78, up 0.62% on the day. The index is closing on resistance at 105.00, with support at 1.03.00. The US yield curve continues to flatten, with 2-year and 10-year yields close to an inversion, which is a signal of a recession.
In the UK, today’s data dump left a sour taste. GDP fell by 0.3% MoM in April, after a decline of 0.1% in March. On an ominous note, manufacturing, services and construction all declined, the first time that has occurred since January 2021. As well, Manufacturing Production came in at -1.0% in April, its third straight decline.
GBP/USD Technical
- GBP/USD faces resistance at 1.2537 and 1.2614
- There is weak support at 1.2413, followed by support at 1.2336
Stocks Suffer, Gold and USD Rise as Inflation Surges
The US dollar index continued rallying on Monday morning as the strong inflation numbers pushed more people to worry about a recession. The numbers revealed that the country’s inflation jumped to the highest point since December 1981. This inflation trend happened as the cost of most items, including food and energy remained at elevated levels. Gasoline prices crossed the all-time high of $5 per gallon during the weekend. Therefore, a combination of high-interest rates, low unemployment rate, and high inflation signals that a recession could happen soon.
The British pound declined sharply ahead of key economic data from the UK. The ONS will publish the latest GDP numbers on Monday morning. Expectations are that the country’s economy continued weakening in April due to the rising cost of doing business. Analysts believe that the manufacturing and industrial production declined in April. The ONS will also publish the latest UK jobs this week. The most important catalyst for the pair will be the upcoming interest rate decision by the Bank of England. With inflation rising, analysts believe that the BOE will hike interest rates by another 0.25%.
US stock futures attempted to recover as concerns about the US economy remained. Futures tied to the Dow Jones and Nasdaq 100 rose slightly although they remain lower after they fell by 880 and 414 points on Friday. The key catalyst for these stocks will be the latest interest rate decision by the Federal Reserve. Analysts expect that the bank will hike interest rates and remain hawkish as it tries to fight inflation. The key companies to watch this week are Oracle, Kroger and Zebra Technologies.
EURUSD
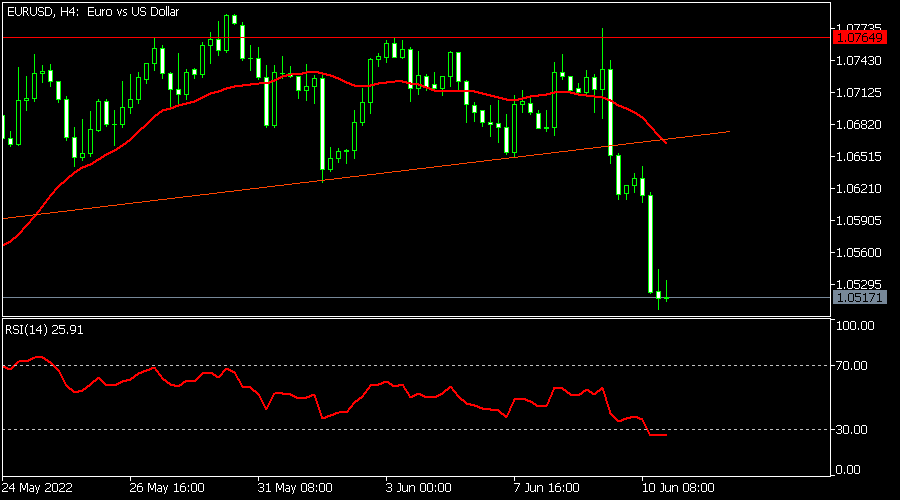
The EURUSD pair declined sharply after the ECB decision and strong US inflation data. It dropped to a low of 1.0517, which was the lowest point since May 20. It moved below the ascending trendline shown in red and the 38.2% Fibonacci retracement level. The Relative Strength Index (RSI) moved below the oversold level. Therefore, the pair will likely continue falling as sellers target the key support at 1.0450.
GBPUSD
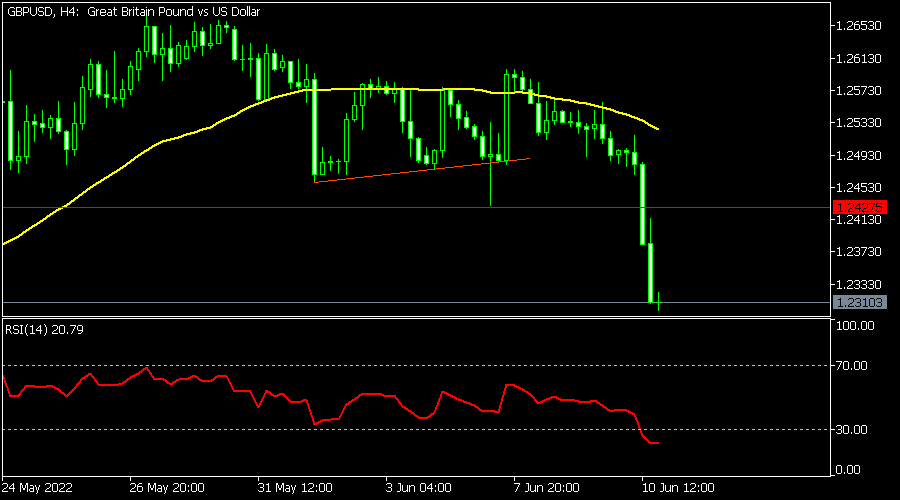
The GBP/USD pair declined sharply due to the strong US dollar. The pair declined to a low of 1.2310, which was the lowest level since May. It managed to move below the important support at 1.2427, which was the lowest level since June 7. The pair also declined below the 23.6% Fibonacci retracement level while the Relative Strength Index (RSI) fell below the oversold level. The pair will likely continue falling in the coming days.
XAUUSD
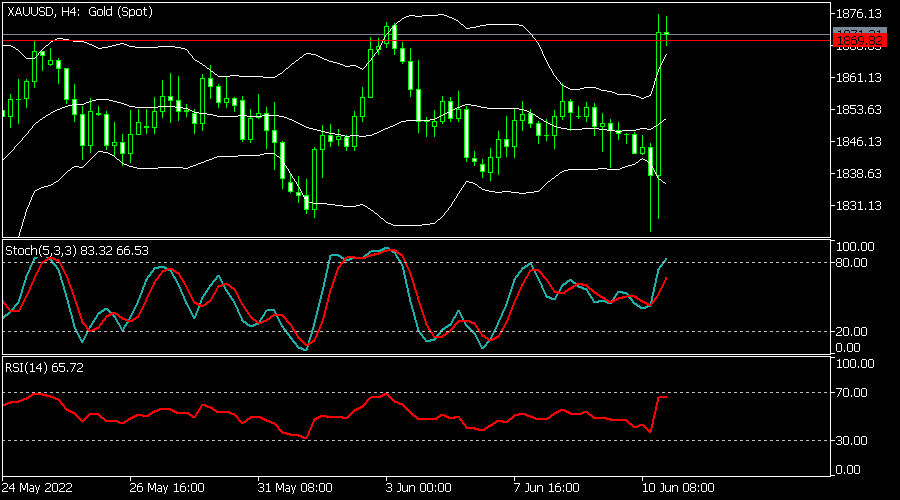
The XAUUSD pair rose to a high of 1,872, which was the highest level since June 6. It has moved along the upper side of the Bollinger Bands while the Stochastic Oscillator and the Relative Strength Index (RSI) are pointing upwards. The pair is also above the 25-day moving average. With inflation rising, the pair will likely keep rising as bulls target the key resistance at 1,900.
GBPUSD and FTSE100 Still Have Downside Potential
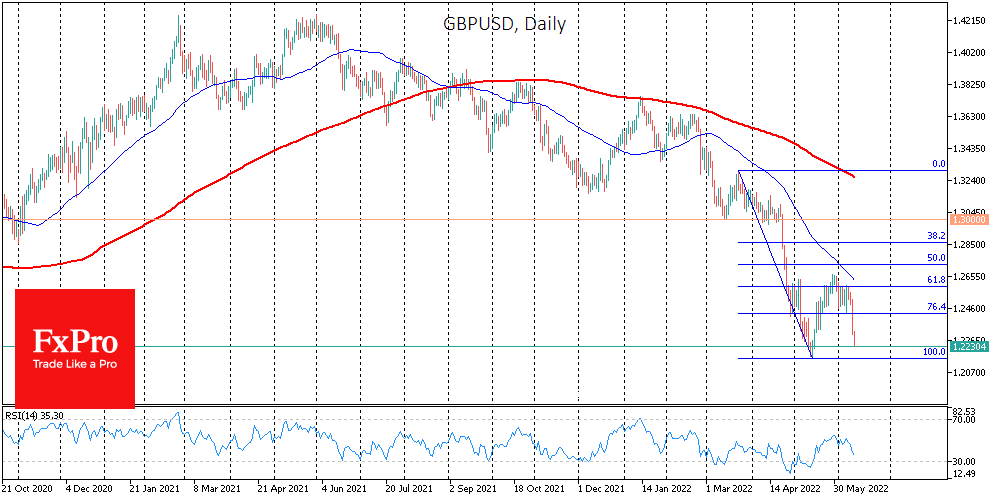
GBPUSD is trading near 1.2250, losing about 3% in the last four trading sessions. Pressure on the pound intensified on Monday, releasing a disappointing set of statistics. Monthly estimates showed the economy shrinking by 0.3% for April, contrary to expectations of a 0.1% growth. Industrial production data also fell short of expectations.
High employment levels do not promise a rapid expansion in the current environment. As we can see, manufacturers generally prefer to take a wait-and-see attitude, maintaining a 0.7% y/y gain.
For the UK economy, it will get worse before it gets better. And it is not very good news for the GBPUSD. Sterling is approaching the lows of mid-May. A move below 1.2150 would confirm that we have only seen a rebound in the bear market at the end of last month, and we shouldn’t be surprised by an intensified sell-off and possible failure with a potential target at 1.1500 (March 2020 lows and 161.8% of the March-May 2022 anti-rally).
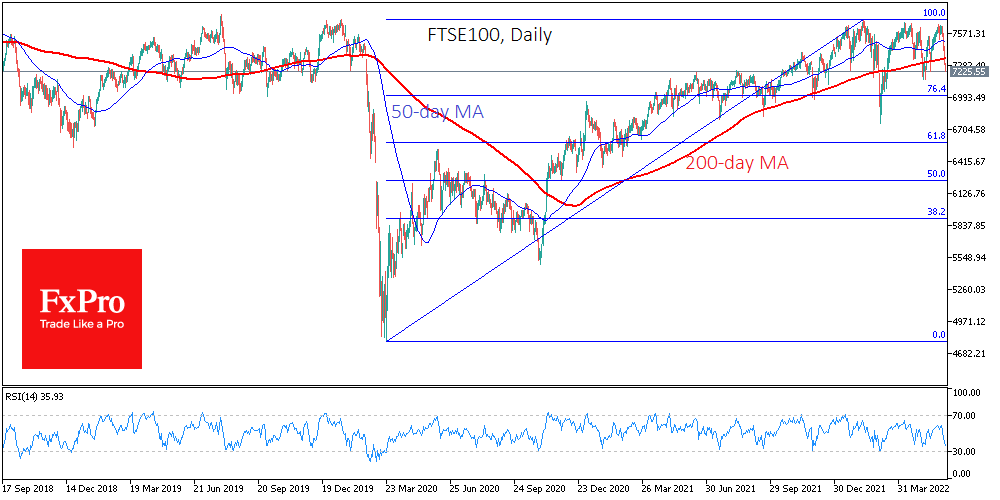
The FTSE100 has fallen sharply below its 200-day moving average due to pressure on global markets. This dip attracted buyers in March and May as volatility began to subside. The 7700 level from 2018 remains too attractive for long-term sellers. In February 2020 and two years later, we saw a furious sell-off as powerful fundamentals were on the bears’ side, as they are now. Correction targets for the FTSE100 could be levels of 7000 for a relatively soft landing and 6800 for a deeper correction.
GBP/USD Outlook: Sterling Falls Further on Risk Aversion, Downbeat UK GDP Data
Cable dips to one-month low in early Monday, in extension of Friday’s post-US CPI 1.4% drop.
Risk aversion dominates at the start of the week and deflates sterling, while dollar was boosted by continuous rise in US inflation which reached new highest in four decades in May.
Unexpectedly weak UK GDP figure for April, added to pound’s negative near-term outlook.
Rising negative momentum on daily chart and moving averages in full bearish configuration, support the action which pressures round-figure 1.22 support, the last obstacle on the way towards.
key support at 1.2155 (2022 low), violation of which would confirm full retracement of 1.2155/1.2667 corrective upleg and risk extension towards next key levels at 1.2080/00 (Fibo 76.4% of larger 1.1409/1.4249 Mar 2020/May 2021 rally / psychological).
Res: 1.2276; 1.2324; 1.2350; 1.2413.
Sup: 1.2200; 1.2155; 1.2100; 1.2080.
Bitcoin is Unlikely to Gain Support Before Falling to $20K
Bitcoin is losing for the seventh consecutive day, at one point on Monday morning, falling below $25K. The loss in seven days of selling is approaching 18%, bringing the rate to its lowest since December 2020. Ethereum has lost 28% in seven days. Altcoins in the top 10 fell in price from 14.5% (Tron) to 32% (Solana).
The total capitalisation of the crypto market, according to CoinMarketCap, sank 20% for the week, approaching the 1 trillion mark and crossing it at some point in the morning. As the price falls, so does trading volume, meaning we see investors fleeing the crypto market. However, the traditional market is suffering from the same symptoms.
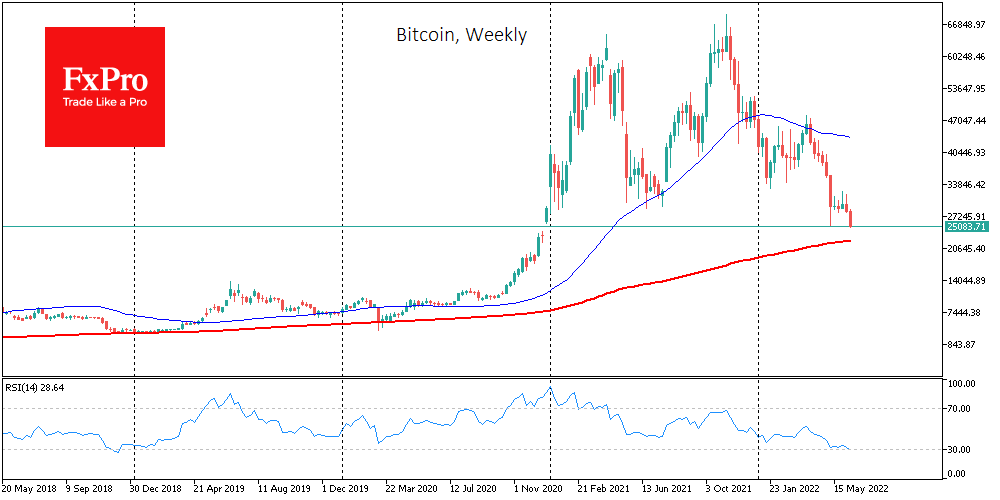
The cryptocurrency Fear and Greed Index dipped to 11 points by Monday. Two similarly prolonged swings of this index in the 10-20 range were in December 2018 and March 2020. In the first, it was the end of the crypto-winter; in the second, it was the final chord of the sell-off.
However, it may be too early to rush to redeem the drawdown. Bitcoin does not seem to have closed the gestalt yet, having not tested the 200-week moving average as it did in the previous two cases. It is now passing through 22K. A more ambitious target for the bears would be an attempt to push Bitcoin back to the 2017 highs region, above $19K.
US Treasury Secretary Janet Yellen called cryptocurrencies a ‘very risky’ option for retirement savings.
Galaxy Digital CEO Mike Novogratz warned investors of a prolonged phase of market consolidation amid tightening monetary policy by the US Federal Reserve.
Cardano blockchain founder Charles Hoskinson believes there are positives to be found even in the current market situation, as a bearish trend opens new opportunities for the crypto sphere.
The Central Bank of Canada reported that the share of its citizens owning BTC almost tripled to 13% in 2021. The Swedish Central Bank has called for a ban on bitcoin and other Proof-of-Work cryptocurrencies because of the environmental impact.
FTSE 100 Struggles for Bids
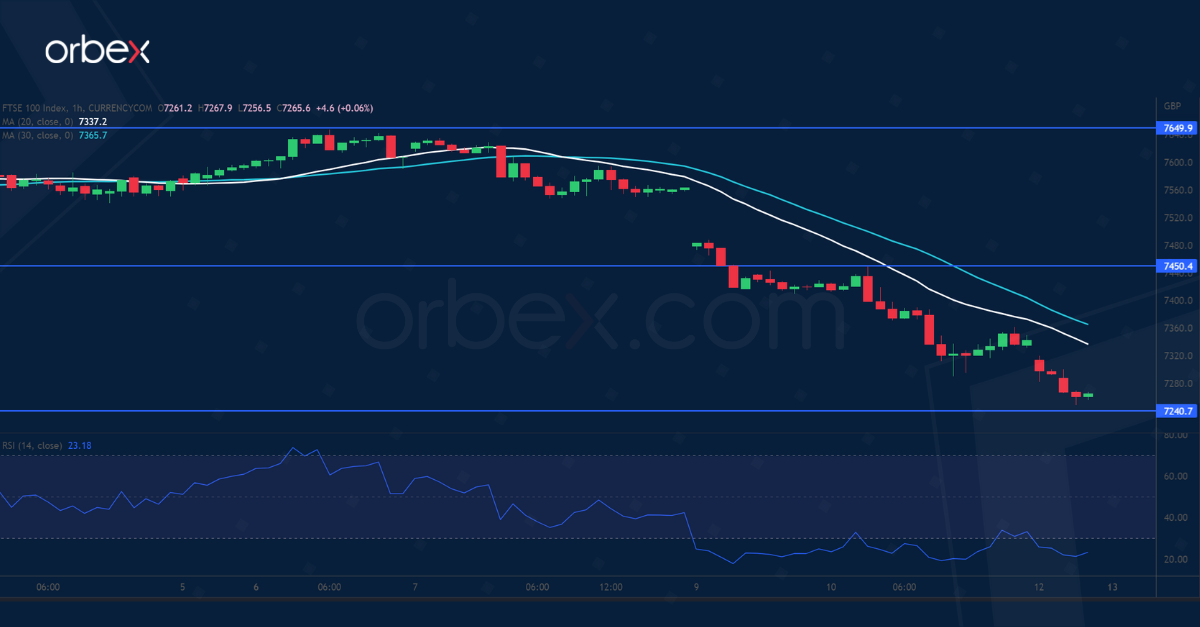
The FTSE 100 tumbles as risk appetite recedes amid growth concerns. On the daily chart, the index has met stiff selling pressure at the double top (7650). A fall below 7520 has triggered a round of liquidation which suggests a lack of commitment from the buy side. 7240 is the next support as the RSI sank into the oversold area. Further down, the daily support at 7160 is a critical floor to keep the index afloat. A bearish breakout could trigger a sell-off towards 7000. 7450 is the closest resistance in case of a rebound.
USD/CAD Breaks Higher
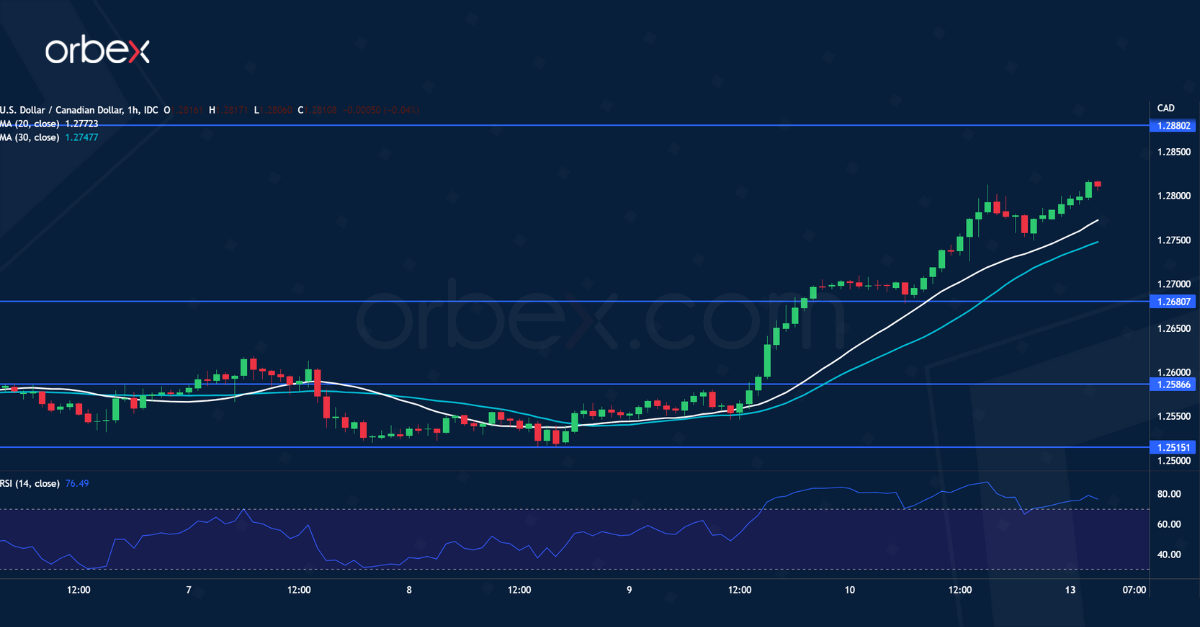
The Canadian dollar struggles against its US counterpart over red-hot US inflation. A break above the supply zone around 1.2680 has put the greenback on a reversal course. A combination of short-covering and momentum buying is sending the pair to the daily resistance at 1.2880. A bullish breakout could resume the rally in the medium-term. The RSI’s overbought situation may cause a temporary pullback as traders may refrain from chasing after bids. 1.2680 has turned into a support where the bulls may look to accumulate.
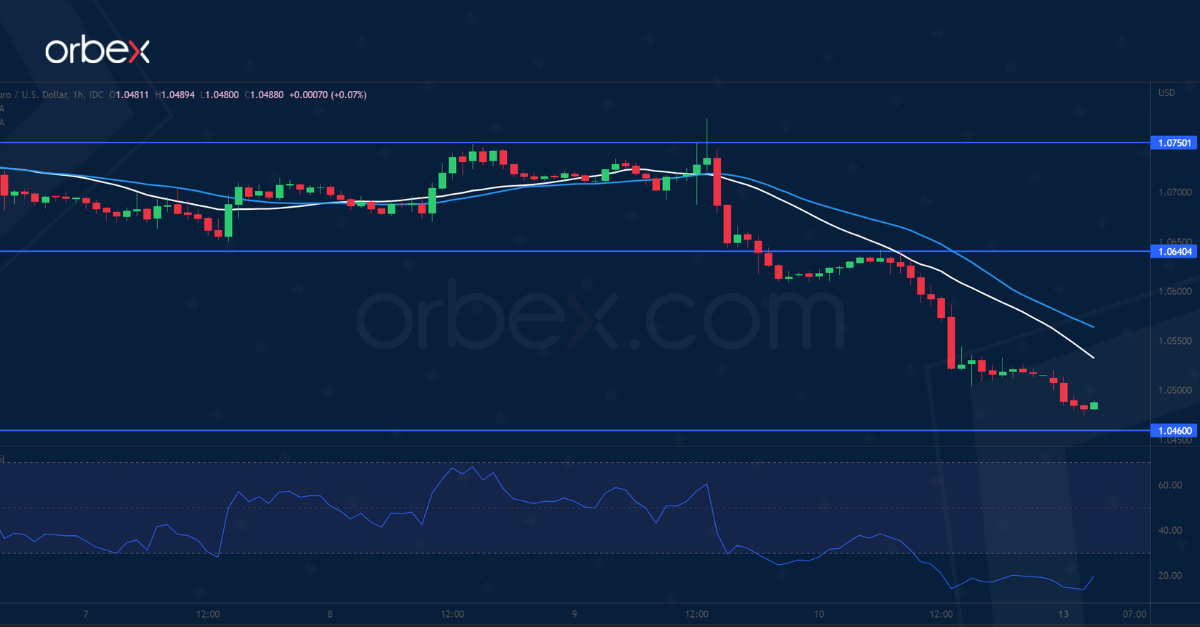
EUR/USD Seeks Support
The US dollar surged after May’s inflation beat expectations. The previous rebound’s failure to clear the supply area around 1.0760 indicates that the path of least resistance is down. A sharp drop below 1.0640 and 1.0540 forced the bulls to cut losses. The RSI’s oversold condition may cause a limited bounce. 1.0460 at the base of a bullish breakout is a key support. Its breach would invalidate the recovery and send the euro back into a downward trajectory. The bulls will need to lift 1.0640 before they could regain control.