Sample Category Title
Technical Outlook and Review
DXY:
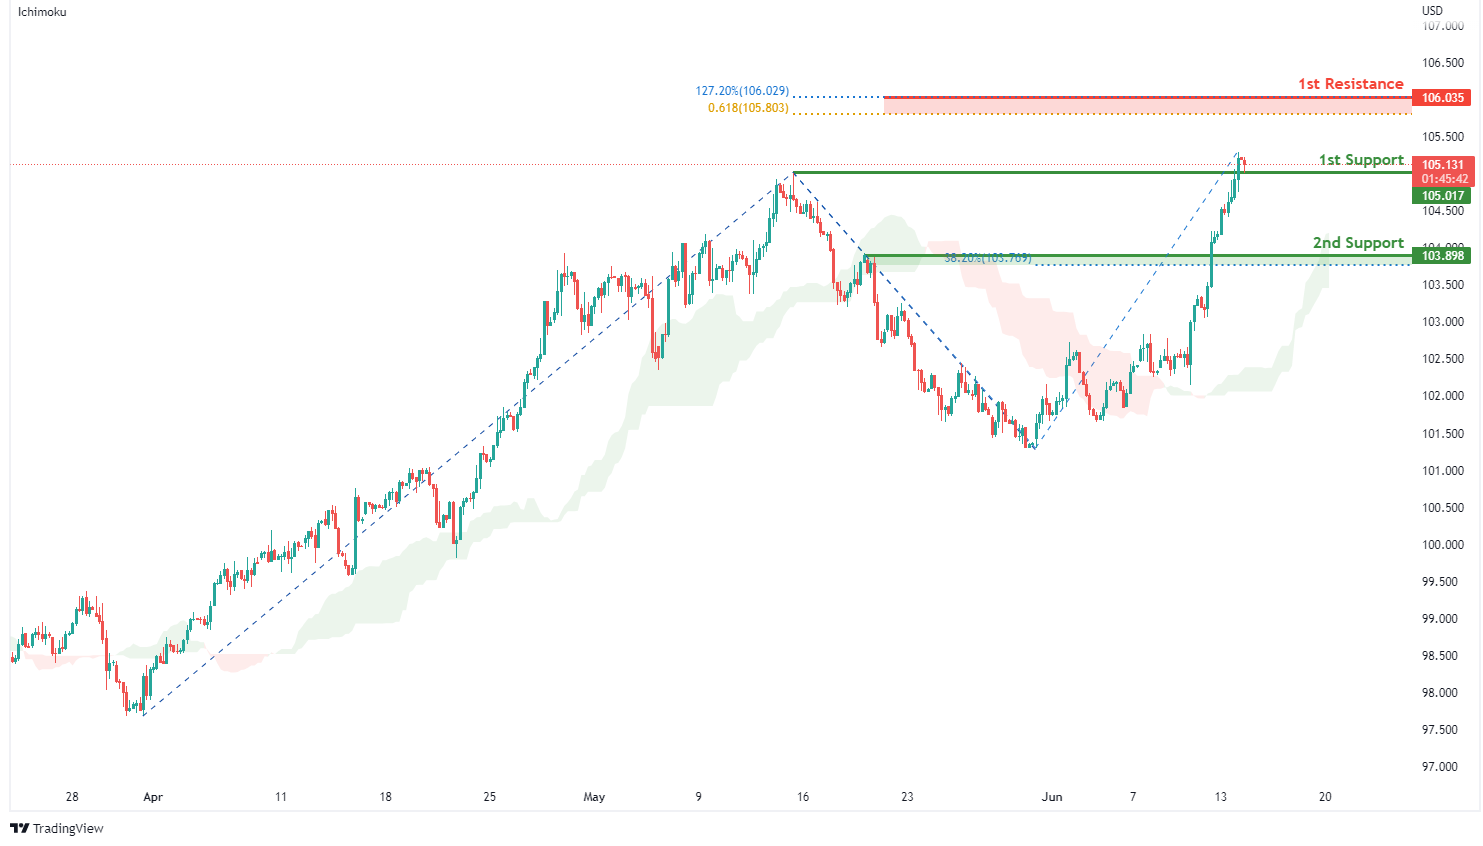
On the H4, with prices moving above the ichimoku indicator, we have a bullish bias that price will rise to our 1st resistance at 106.035 where the 127.2% fibonacci extension and 61.8% fibonacci projection are from our 1st support at 105.017 in line with the horizontal pullback support. Alternatively, price may break 1st support structure and head for 2nd support at 103.898 where the horizontal pullback support and 38.2% fibonacci retracement are.
Areas of consideration:
- H4 time frame, 1st resistance at 106.035
- H4 time frame, 1st support at 105.017
XAU/USD (GOLD):
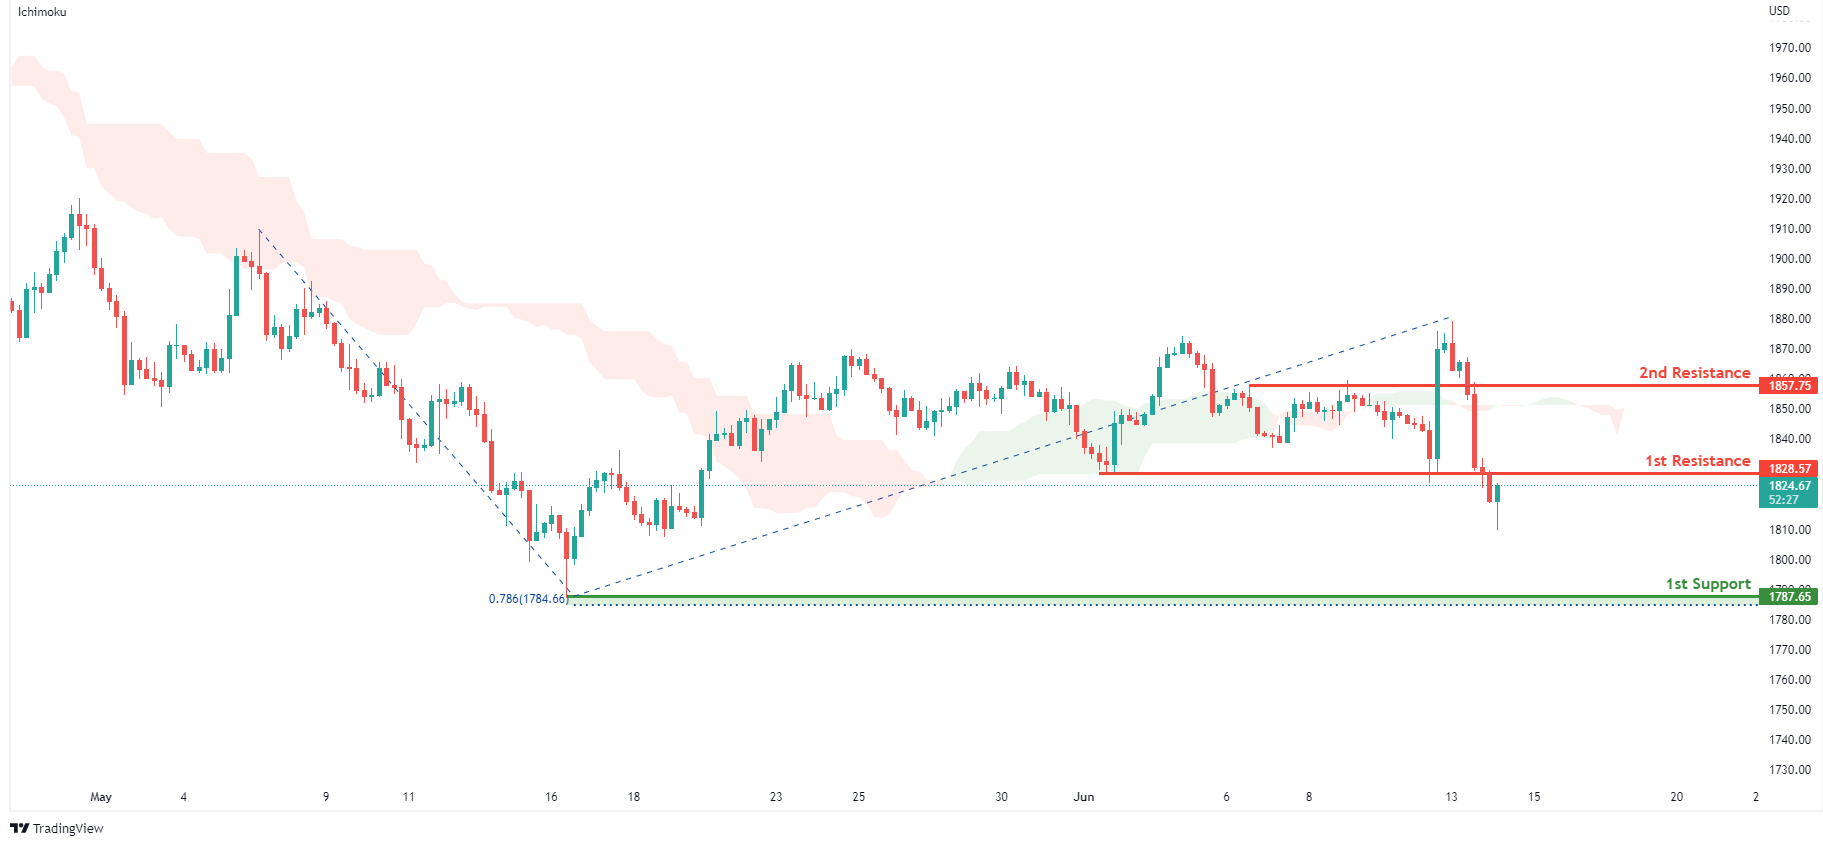
On the H4, with prices moving belowthe ichimoku indicator, we have a bearish bias that prices will drop from our 1st resistance at 1828.57 where the horizontal overlap resistance is to our 1st support at 1787.65 in line with swing low support and 78.6% fibonacci projection. Alternatively, price may break 1st resistance structure and head for 2nd resistance at 1857.75 in line with overlap resistance.
Areas of consideration:
- H4 time frame, 1st Resistance at 1828.57
- H4 time frame, 1st Support at 1787.65
GBP/USD:
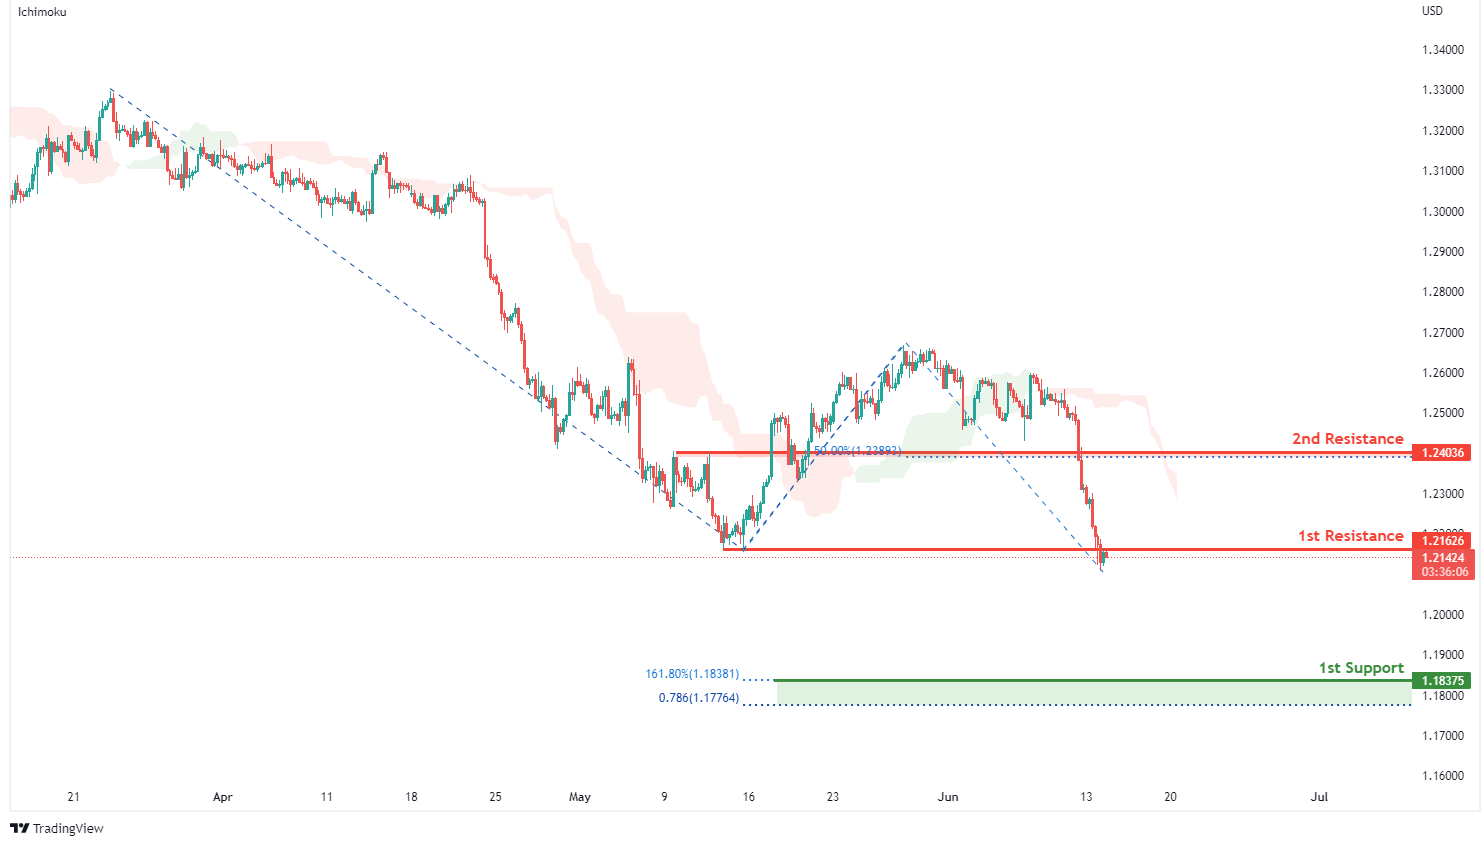
On the H4, with prices moving below the ichimoku indicator, we have a bearish bias that price will drop from our 1st resistance at 1.21626 where the horizontal pullback resistance is to our 1st support at 1.18375 in line with the 78.6% fibonacci projection and 161.8% fibonacci extension. Alternatively, price may break 1st resistance structure and head for 2nd resistance at 1.24036 where the horizontal overlap resistance and 50% fibonacci retracement are.
Areas of consideration:
- H4 1st resistance at 1.21626
- H4 1st support at 1.18375
USD/CHF:
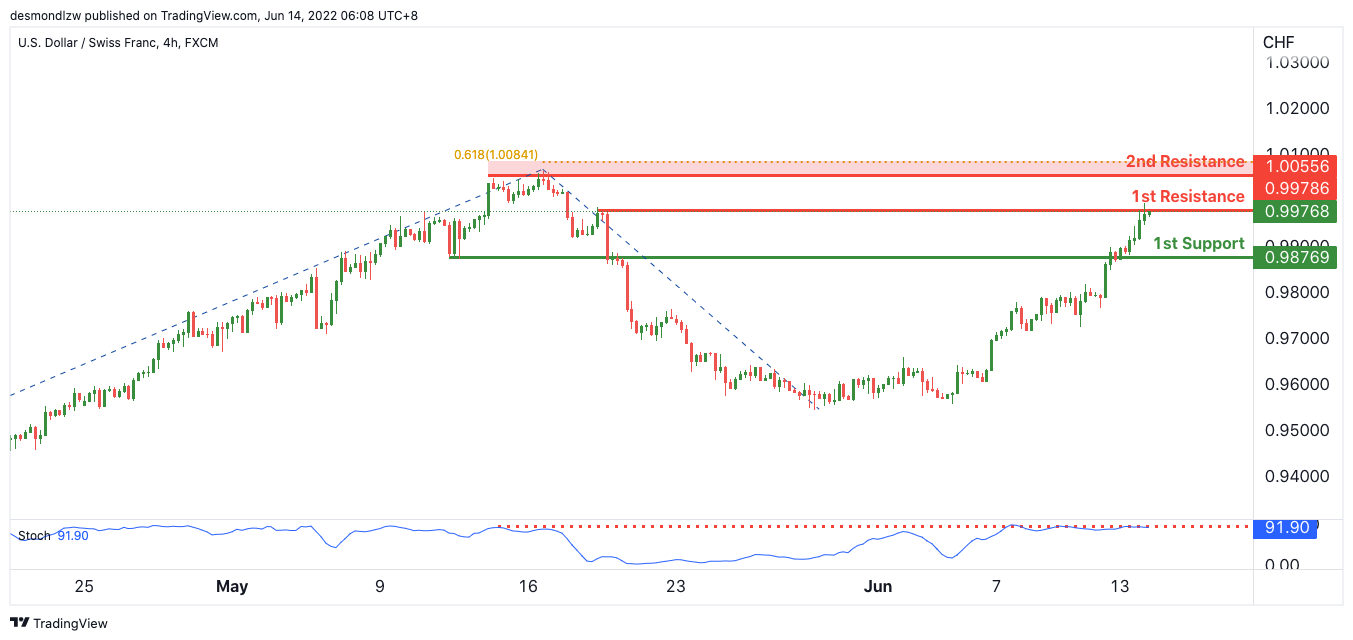
On the H4, with price expected to reverse off the stochastic indicator, we have a bearish bias that price will drop to our 1st support in line with the horizontal pullback support from our 1st resistance is where the pullback resistance is. Alternatively, price may break structure and head for our 2nd resistance in line with the horizontal swing high resistance and 61.8% Fibonacci projection.
Areas of consideration
- 1st support level at 0.98769
- 1st resistance level at 0.99786
EUR/USD :
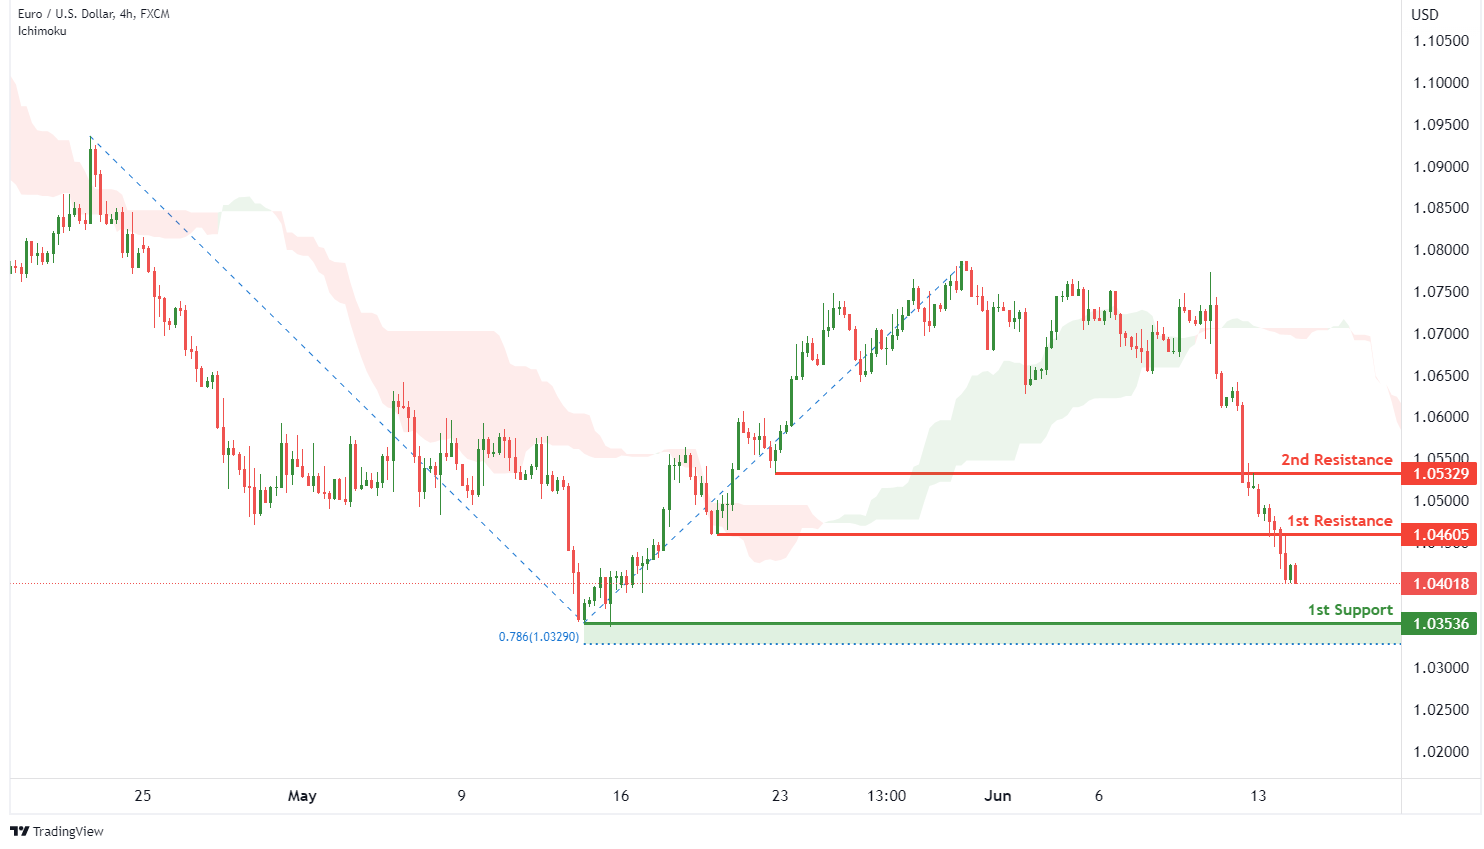
On the H4. with price moving below the ichimoku cloud, we have a bearish bias that price will continue to drop from our 1st resistance at 1.04605 in line with the pullback resistance to the 1st support at 1.03536 in line with the 78.6% fibonacci projection and horizontal swing low support. Alternatively, price may break the 1st resistance structure and rise to the 2nd resistance at 1.05329 in line with the pullback resistance.
Areas of consideration :
- H4 1st resistance at 1.04605
- H4 1st support at 1.03536
USD/JPY:
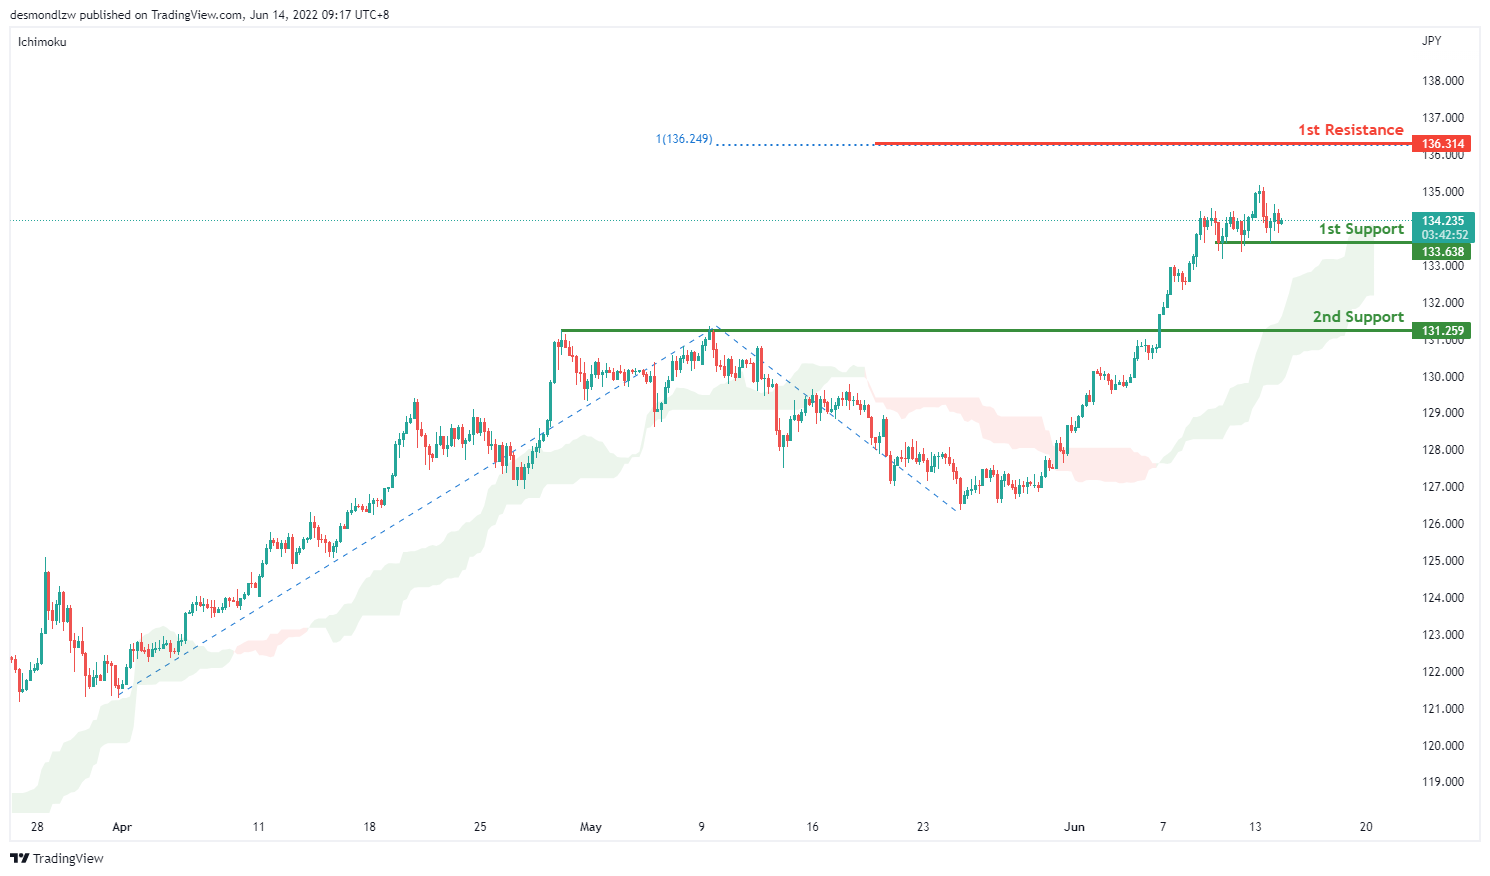
On the H4, with prices moving above the ichimoku indicator, we have a bullish bias that price will rise from our 1st support at 133.638 where the horizontal swing low support is to our 1st resistance at 136.314 in line with the 100% fibonacci projection. Alternatively, price may break 1st support structure and head for 2nd support at 131.259 where the horizontal overlap support is.
Areas of consideration:
- H4 time frame, 1st resistance at 136.314
- H4 time frame, 1st support at 133.020
AUD/USD:
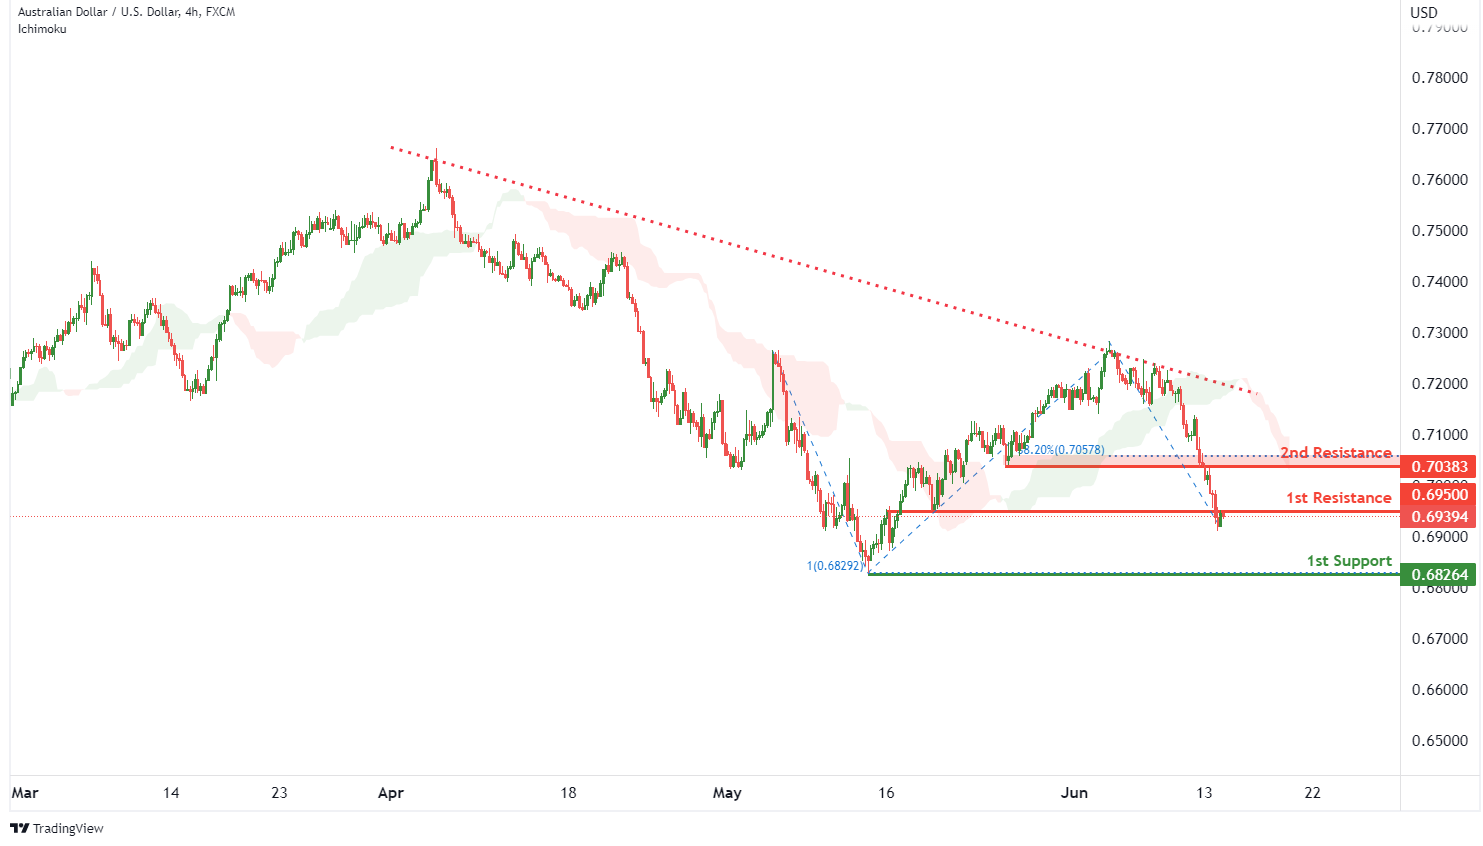
On the H4, with price moving below the ichimoku cloud, we have a bearish bias that price will continue to drop from the 1st resistance at 0.69500 in line with the overlap resistance to the 1st support at 0.68264 in line with the 100% fibonacci projection and swing low support. Alternatively, price may break the 1st resistance structure and rise to the 2nd resistance at 0.70383 at the pullback resistance and 38.2% fibonacci retracement.
Areas of consideration
- H4 1st resistance at 0.69500
- H4 1st support at 0.68264
NZD/USD:
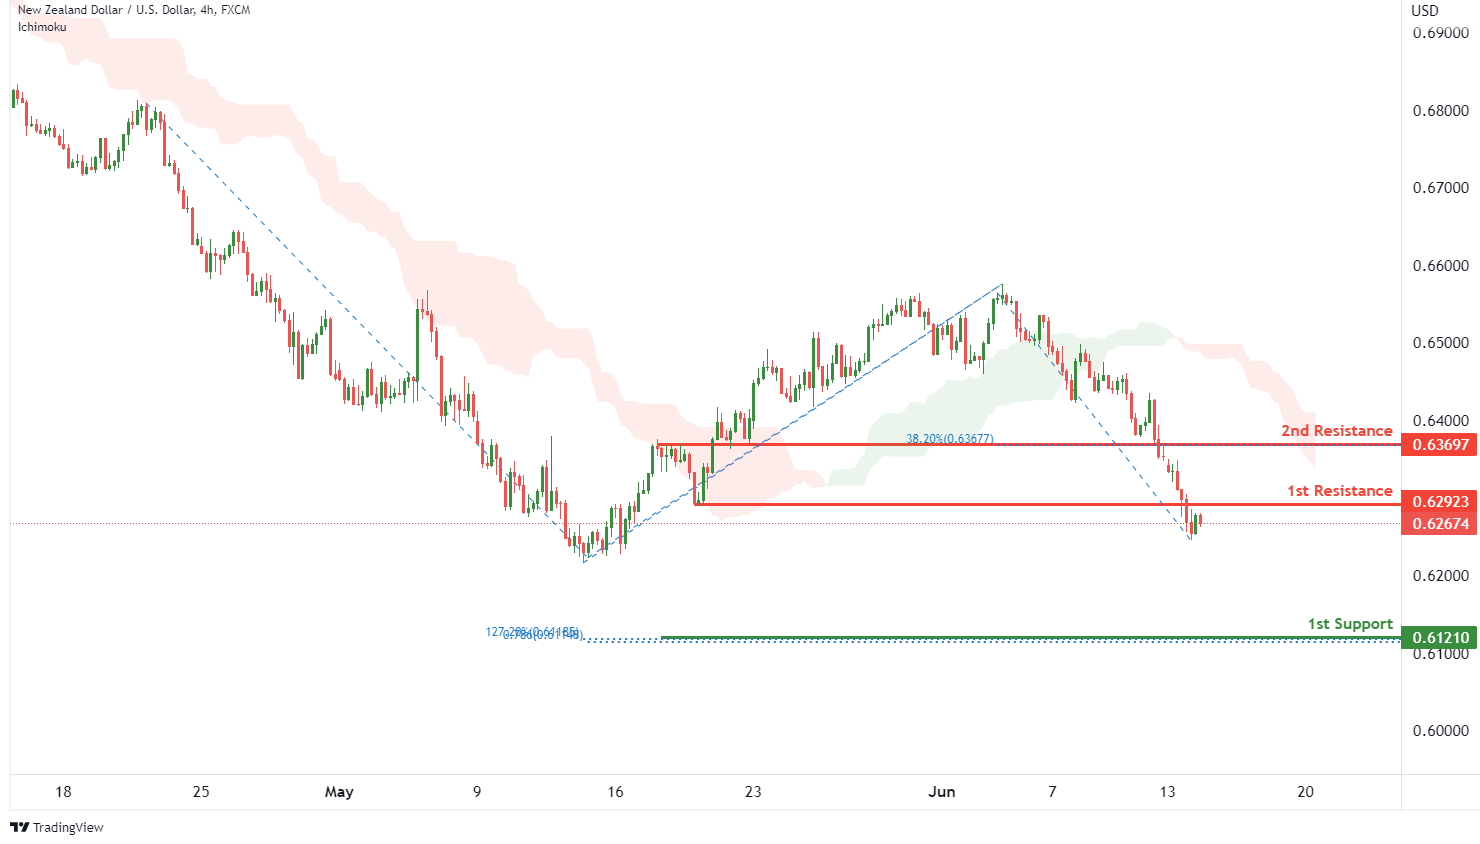
On the H4, with price moving below the ichimoku cloud, we have a bearish bias that price will drop from the 1st resistance at 0.62923 in line with the pullback resistance to the 1st support at 0.61210 in line with the 78.6% fibonacci projection and 127.2% fibonacci extension. Alternatively, price may break the 1st resistance structure and rise to the 2nd resistance at 0.63697 in line with the 38.2% fibonacci retracement and overlap resistance.
Areas of consideration:
- H4 time frame, 1st support at 0.61210
- H4 time frame, 1st resistance at 0.62923
USD/CAD:
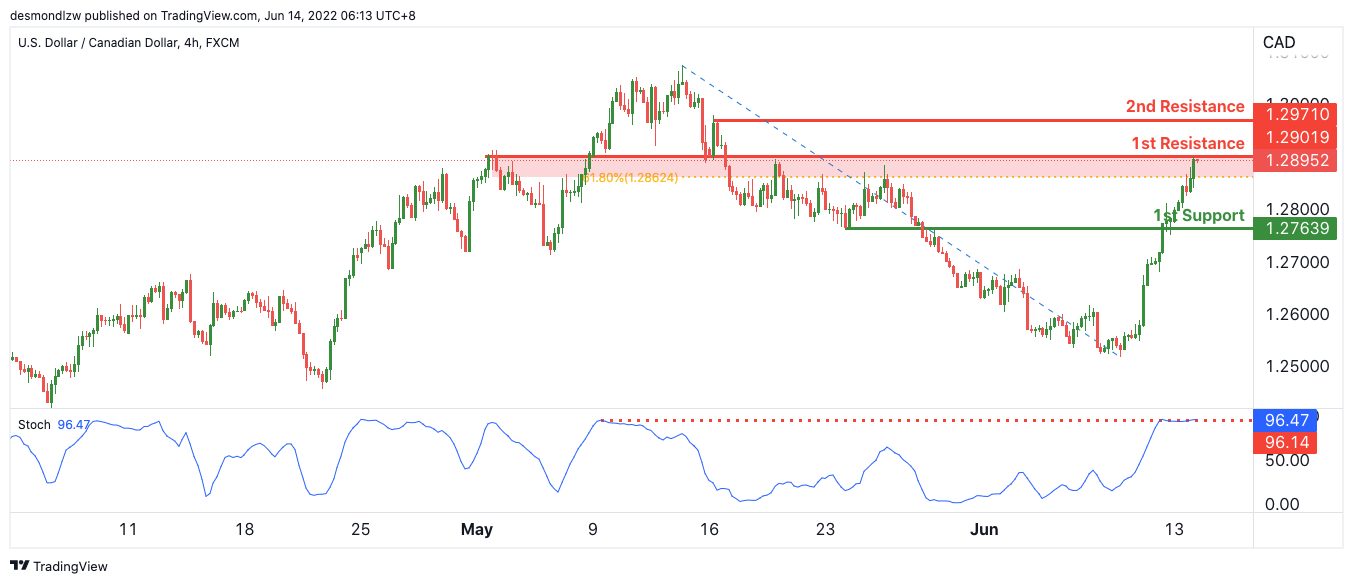
On the H4, with expected to reverse off the stochastics indicator, we have a bearish bias that price will drop to our 1st support at 1.27639 in line with the horizontal pullback support from our 1st resistance at 1.29019 where the pullback resistance and 61.8% Fibonacci retracement is. Alternatively, price may break structure and head for our 2nd resistance in line with the horizontal swing high resistance.
Areas of consideration:
- H4 time frame, 1st resistance at 1.29019
- H4 time frame, 1st support at 1.27639
OIL:
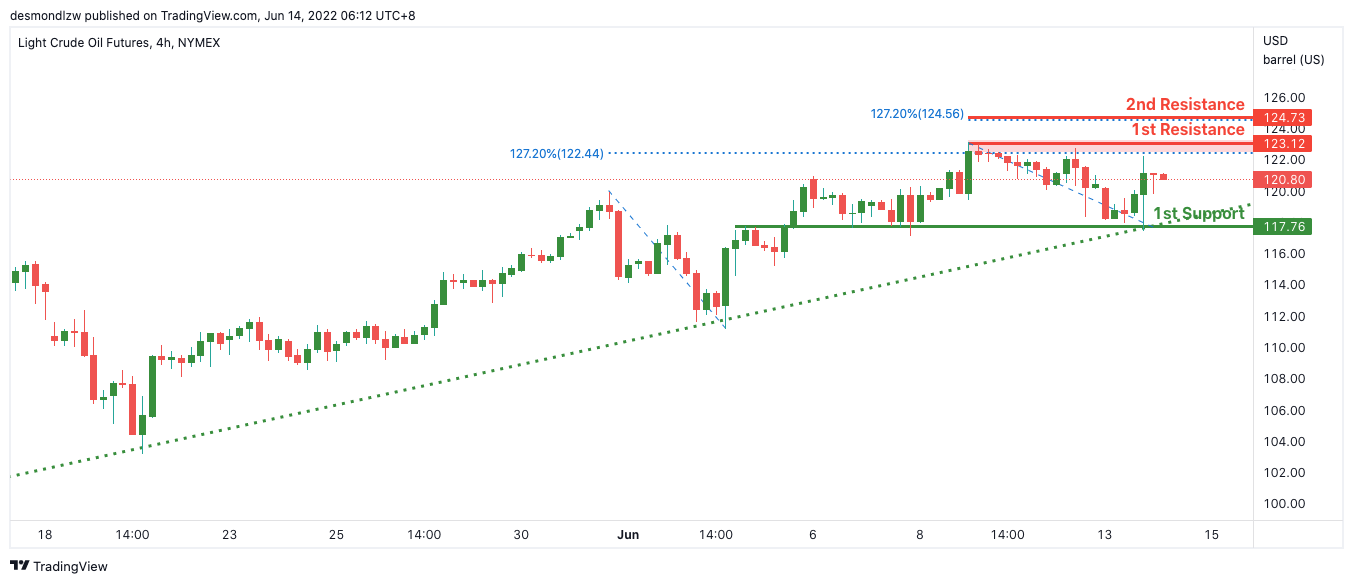
On the H4, with expetec to reverse off the stochastics indicator resistance, we have a bearish bias that price will drop to our 1st support at 117.76 in line with the horizontal pullback support from our 1st resistance at 123.12 where the horizontal swing high resistance and 127.2% Fibonacci extension is. Alternatively, price may break structure and head for our 2nd resistance in line with the 127.2% Fibonacci extension is.
Areas of consideration:
- H4 time frame, 1st resistance of 123.12
- H4 time frame, 1st support of 117.76
Dow Jones Industrial Average:
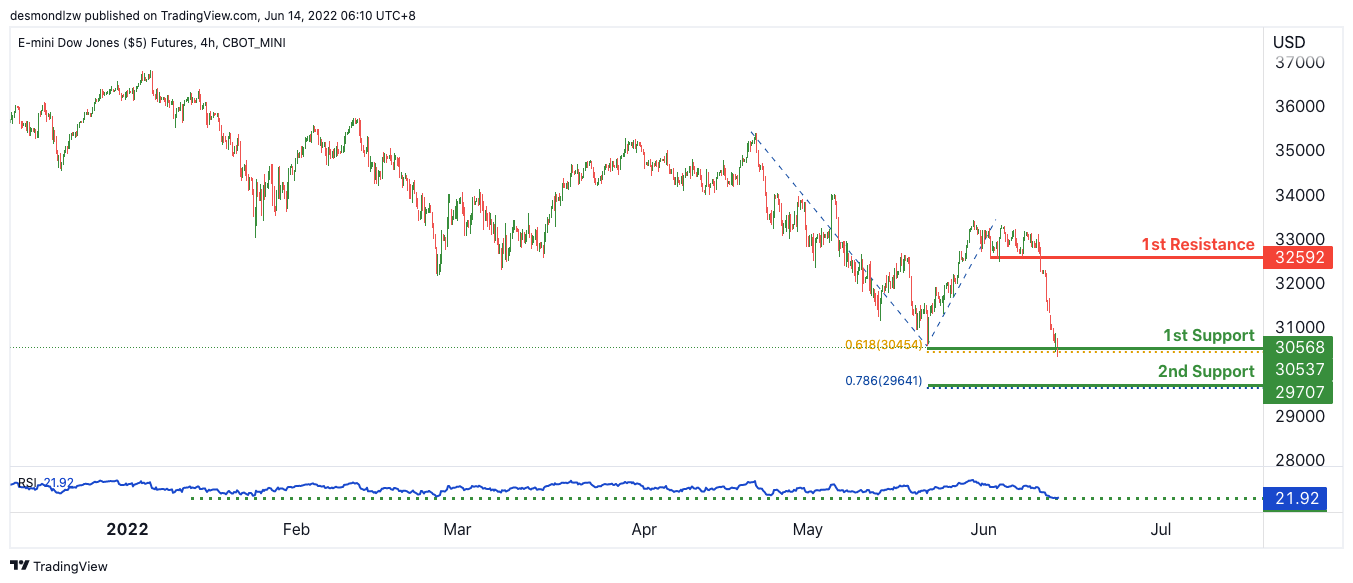
On the H4, with price expected to bounce off the stochastics indicator, we have a bullish bias that price will rise from our 1st support at 30568 where the horizontal swing low support and 61.8% Fibonacci projection is to our 1st resistance at 32592 in line with the horizontal pullback support. Alternatively, price may break structure and head for 2nd support where the 78.6% Fibonacci projection is.
Areas of consideration :
- H4 time frame, 1st resistance at 32592
- H4 time frame, 1st support at 30568
AUDJPY Wave Analysis
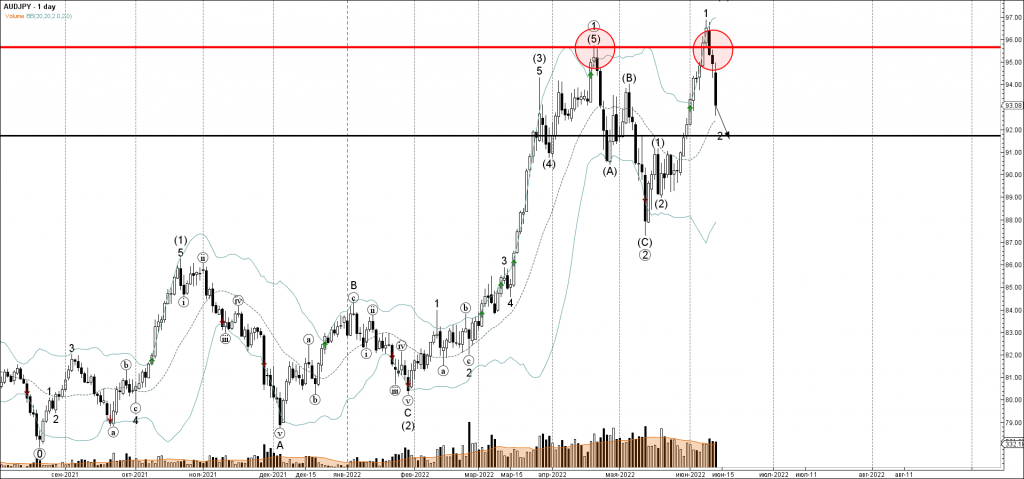
- AUDJPY reversed from resistance level 95.66
- Likely to fall to support level 92.00
AUDJPY currency pair recently reversed down from the strong resistance level 95.66 (which stopped the multi-month uptrend in April), coinciding with the upper daily Bollinger Band.
The downward reversal from the resistance level 95.66 created the daily Japanese candlesticks reversal pattern Bearish Engulfing.
AUDJPY can be expected to fall further toward the next support level 92.00 (target price for the completion of the active correction 2).
Eco Data 6/14/22
[php_everywhere instance="1"]
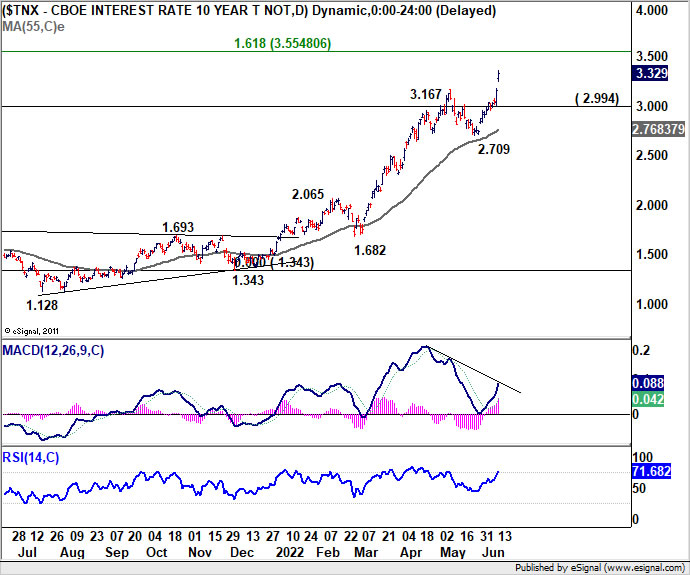
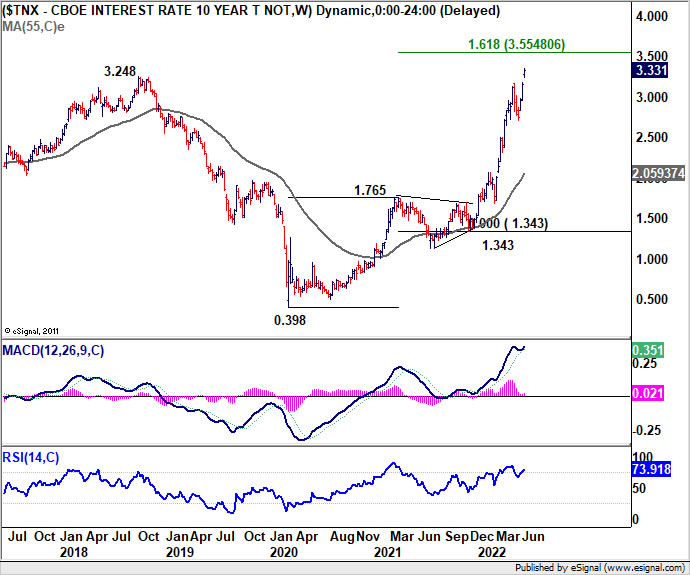
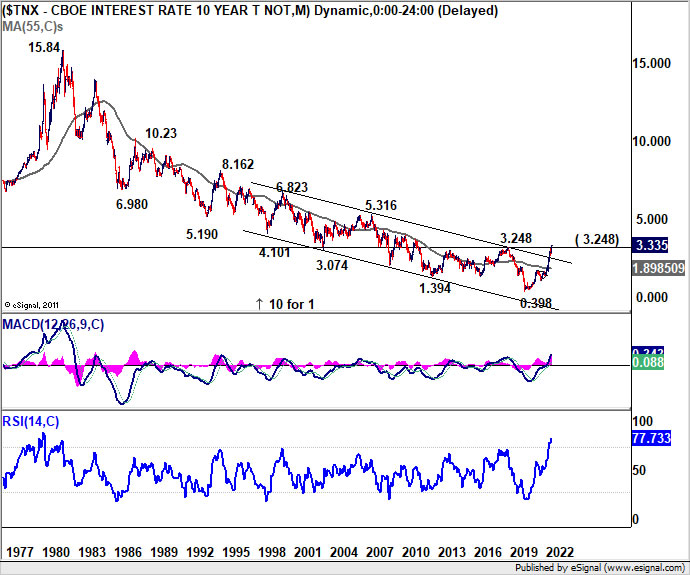
US 10-yr yield breaks 2018 high, next hurdle at 3.55
10-year yield gaps up today and hits as high as 3.356 so far, as the rout in bonds and stocks continue. TNX's power through 3.248 resistance (2018 high) is a surprise, and significant. It's finally breaking the lower-highs lower-lows pattern that started back in 1981.
For now further rally is expected as long as 2.994 support holds. Next target is 161.8% projection of 0.398 to 1.765 from 1.343 at 3.554. Overbought condition (in yields, and oversold in bonds) should limited upside there and bring a pull back. That, ideally, should come as the inflation situation stabilize and improve. However, sustained break of 3.554 would be another big warning on the economic outlook ahead.
Bank of England: Steady as She Goes?
The Bank of England is set to hike rates again on Thursday when it announces its latest policy decision at 11:00 GMT. But with many other central banks going into higher gear, will the BoE stick with 25-basis-point increments or will it join the 50-bps bandwagon? Given all the warnings of recession for the UK economy lately, a dovish tilt seems more likely than a hawkish one. Hence, there’s not much prospect of the selling pressure on sterling easing anytime soon, although what the Fed announces a day earlier will matter just as much.
Trying to read the economy
The Bank of England doesn’t mince its words. At its last meeting, it flagged the real danger of the British economy falling into recession by year-end as other central banks justified their rate hikes by arguing that their economies were too hot. But just how great are the risks of economic expansion in Britain going into reverse? GDP unexpectedly shrank by 0.3% m/m in April, though weaker government spending was to blame for most of the drop and there are still several bright spots.
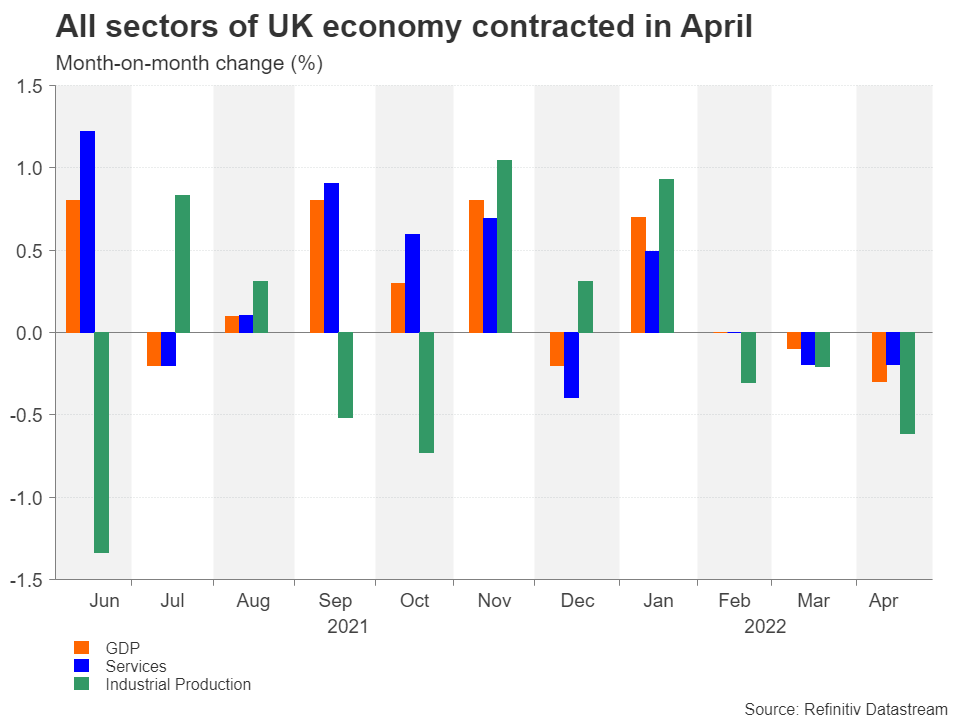
Retail sales were surprisingly strong in April, house prices continue to rise, albeit more slowly, and the jobless rate fell to a 48-year low of 3.7% in the first quarter. The next dose of labour market stats is due on Tuesday (06:00 GMT) and is predicted to show the unemployment rate falling further to 3.6% in the three months to April.
Is the consumer squeeze only just starting?
However, most of the hard data is rather outdated now and what happens from May onwards will be of more interest. The combined effects of higher energy bills and national insurance contributions only kicked in in April, so the considerable squeeze on household spending likely began in May. The survey data has already started to deteriorate. Growth in manufacturing and services both slowed down sharply in May according to the S&P Global PMIs.
Nonetheless, it is possible that the negative sentiment in business and consumer surveys is being inflamed by all the doom-mongering in the UK press. There is also the strong labour market to consider which should provide some kind of a cushion to the economy. Moreover, the extra-long Bank Holiday weekend for the Queen’s Platinum Jubilee celebrations probably boosted spending in June – a trend that could continue through the summer as consumers flock to restaurants and other hospitality and leisure venues after two years of pandemic restrictions.
Outlook is bleak
But even if growth momentum is sustained over the summer, the outlook for the Autumn and beyond looks grim unless there is a significant easing in energy prices, which is where the bulk of the pain for the economy is originating from. The UK’s energy regulator has already signalled another mammoth hike in electricity and gas bills in October, and once households have drawn down on the savings they accumulated during the lockdowns, the cost of living squeeze could get a lot worse. And if Brexit hasn’t already exacerbated some of the supply constraints for British businesses, there is the threat of an escalation of tensions with the EU hanging over them if the government pursues its plans to override parts of the Northern Ireland protocol.
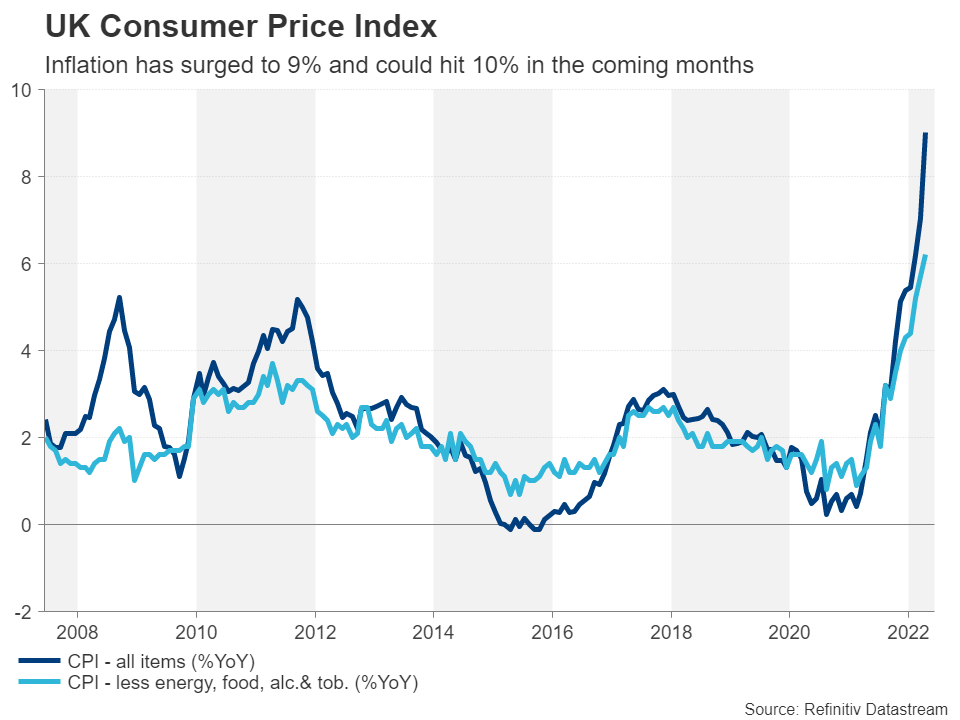
It's also worth remembering that the UK economy is very consumer driven, so the more inflation surges (currently the highest in the G7 at 9.0% y/y), the greater the downward pressure on demand will be. Paradoxically, this is what distinguishes the Bank of England from its peers as it can make a more convincing case that high inflation will partially do the job of dampening demand and thus interest rates don’t need to rise too steeply.
The BoE can be unpredictable
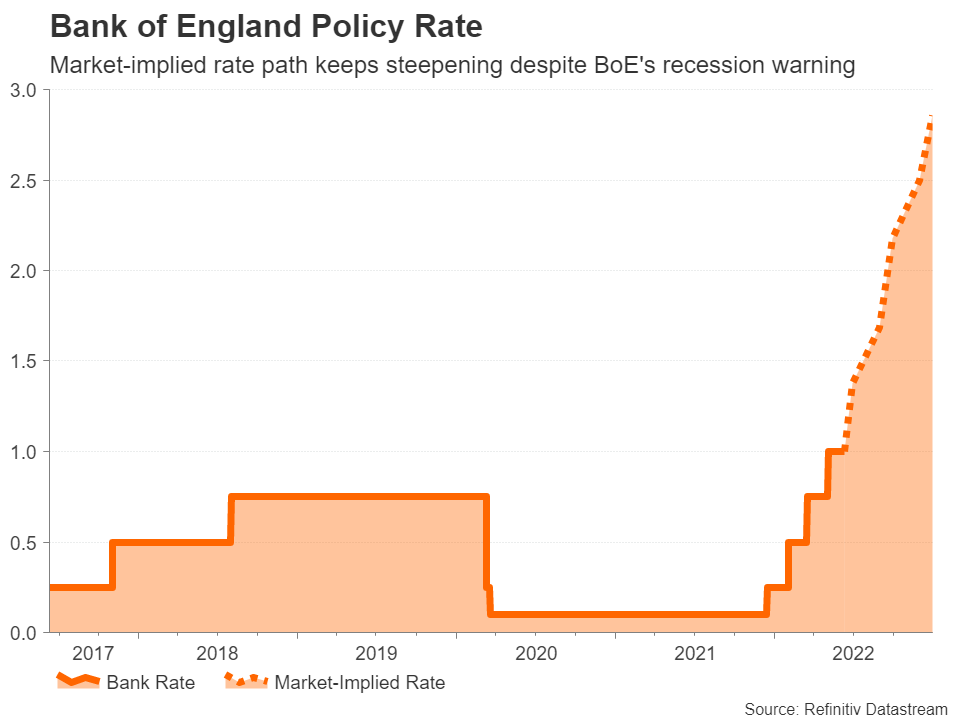
In May, most BoE policymakers agreed that “some degree of further tightening in monetary policy may still be appropriate in the coming months”. This is quite a contrast from the likes of the Fed, Bank of Canada, RBNZ and RBA who have hiked by 50 basis points and will likely do so again at their next meetings. Even the ECB is now contemplating increments of 50 bps.
However, there is a reason why the Bank of England has earned its reputation as “the unreliable boyfriend” and policymakers have a history of flip-flopping, including in the current tightening cycle. Hence, a 50-bps rate rise cannot be ruled out in June. Not only is it possible that other central banks’ aggressive actions might embolden the BoE, but this could also be the only time window that Governor Bailey would be able to push through a larger increase before growth completely stalls and it becomes inevitable to hit the pause button.
Pound is tumbling
Investors think there’s about a 50% probability of a 50-bps move and have priced in at least two double rate hikes this year. That leaves quite a lot of scope for disappointment if the BoE gets the jitters and turns even more cautious than it already has following the worrying April GDP numbers.
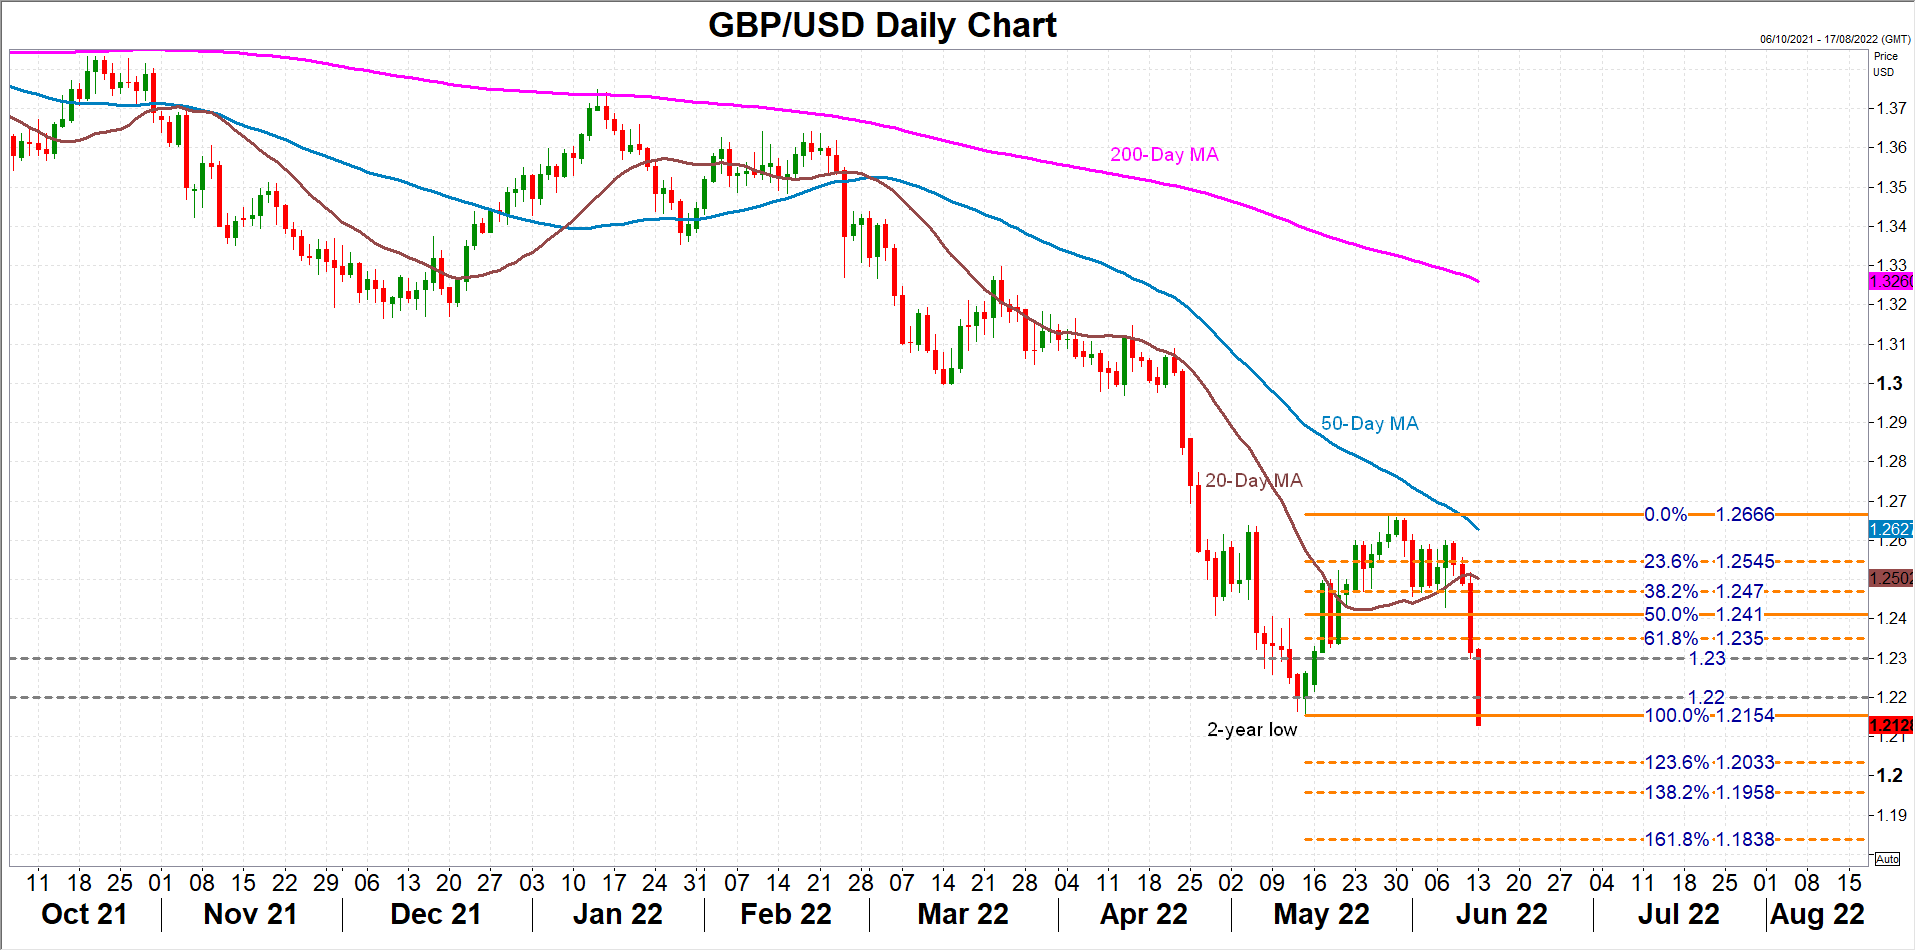
The pound has gotten off the week on the wrong foot, breaching the two-year trough of $1.2154 set in May, having flirted with the $1.26 level just a week ago. If the bears retain the upper hand, the $1.2033 mark might be targeted next as it’s the 123.6% Fibonacci extension of the May upleg. Further down, the 161.8% Fibonacci extension of $1.1838 could be another major support.
Are there any upsides?
In the event that the BoE doesn’t let down the hawkish market expectations, the pound could make its way up towards the 61.8% Fibonacci of $1.2350 before aiming for the 20-day moving average, currently at $1.25.
However, for a more meaningful rebound, investors would have to be positively surprised by the incoming UK economic indicators – something that potentially depends on whether the government decides to loosen the fiscal purse strings. Otherwise, a more hawkish BoE might be of little comfort to sterling if there's signs the economy is entering a recession just as inflation is hitting double digits.
Gold Drops 2.5% as Dollar Surges on Rising Expectations for More Aggressive Fed
Spot gold fell sharply on Monday, losing nearly 2.5% of its value until early US session, in the biggest daily drop since Mar 9.
Red-hot US inflation in May added to strong concerns about the negative impact on the economy, as price growth so far does not show any signs of easing that fueled expectations of more aggressive Fed in its June policy meeting, due later this week.
Although the metal is used as a hedge against inflation, strong rise of the US dollar on rally into safety against the signs of worsening global crisis and expectations that the US central bank would opt for stronger rate hike this time, keep the gold price in defensive.
Markets widely expect the Fed to raise interest rate by 0.5% to 1.5%, but the number of those who bet on 0.75% hike is rising and lifted the greenback to one-month high and pressuring 2022 high.
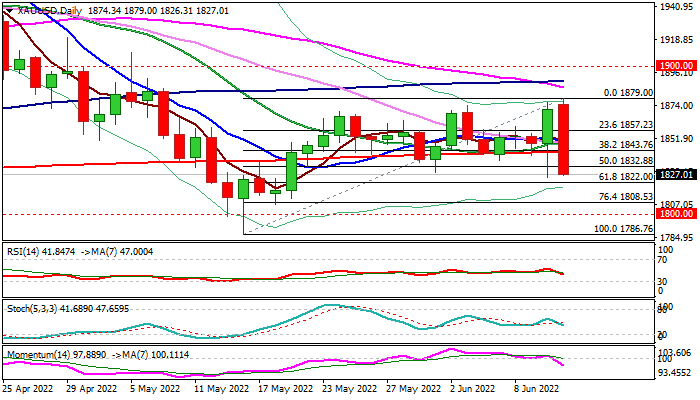
Fresh bearish acceleration weakened the technical picture on daily chart as 14-d momentum surged into negative territory and moving averages turned to bearish setup, while the action remains weighed down by falling and thickening daily Ichimoku cloud.
In addition, today’s action is on track to leave a bearish engulfing pattern on daily chart and generate another bearish signal.
Bears broke below 50% retracement of $1786/$1879 upleg, with daily close below this level to add to bearish near-term stance, as pivotal supports at $1825/22 (Friday’s low / Fibo 61.8%) are under pressure and break lower would signal an end of corrective phase.
Markets focus on US Producer prices and retail sales, ahead of key event this week – FOMC policy meeting.
Res: 1832; 1842; 1849; 1857
Sup: 1825; 1822; 1808; 1800
Oil May Have Started its Turn Down
Oil fell symbolically over the past week, losing 1.3% to $116.3 a barrel of WTI amid trading in Europe on Monday.
Locally oil looks like a solid defensive asset, with oil companies such as Exxon Mobil renewing record highs, attracting investor capital. While geopolitics and strong demand are behind the sector’s growth, the risks may outweigh the upside potential at current levels.
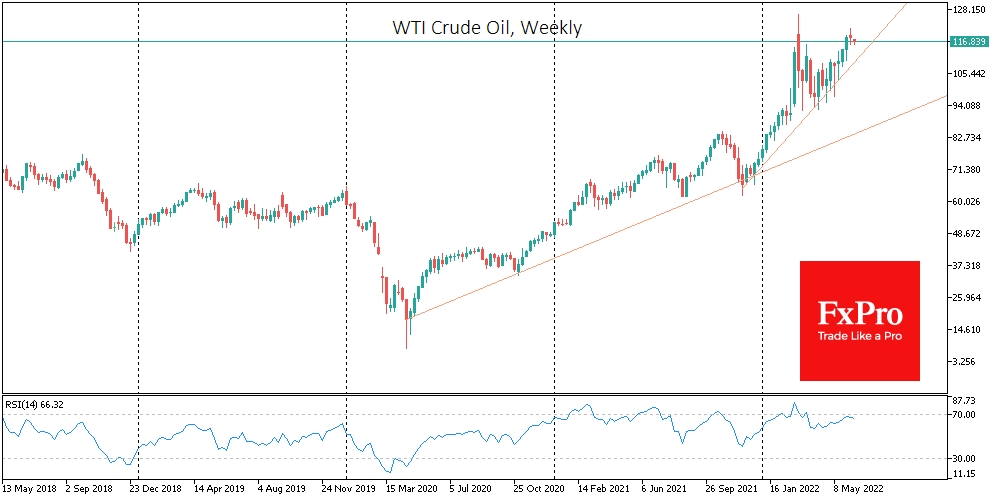
Technically, oil remains within the upward trend formed late last year. Intra-week price dips under this line have been instead actively bought out.
At the same time, on the weekly charts, WTI oil formed a double top, failing to close the week above $120. The red line for oil could be to consolidate below $110 at the end of this or next week.
On the same weekly timeframes that best fit commodity markets, the WTI has stalled at the overbought area of the RSI index. In the previous year and a half, we had a similar situation four times, all ending in a corrective pullback.
Among the fundamental factors is the increase in the number of working oil rigs in the USA last week to 733 in total, of which 580 were producing oil. Separately, US Treasury Secretary Yellen said late last week that production in the country is picking up, which we have yet to see in the reports.
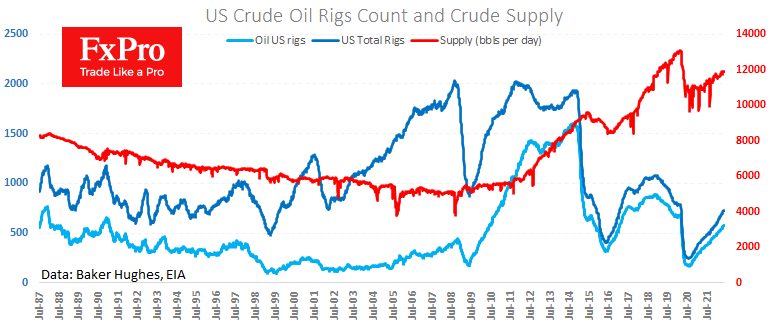
OPEC countries have also been increasing their production capacity, raising the quota target by 648K BPD in the last two months, instead of the previous step of 400K and later 432K BPD per month. So far, the cartel has not scooped up quotas, but high oil prices and a sustained rise in the cap will attract new investment, as it did in the last decade, which has caused oil prices to fall chronically.
There is also downward pressure on the bears’ side in the equity market. So far, oil has ignored the flight from risky assets, but history teaches us that such periods do not last, and oil could start catching up with the rest of the market very soon.
GBP/JPY Mid-Day Outlook
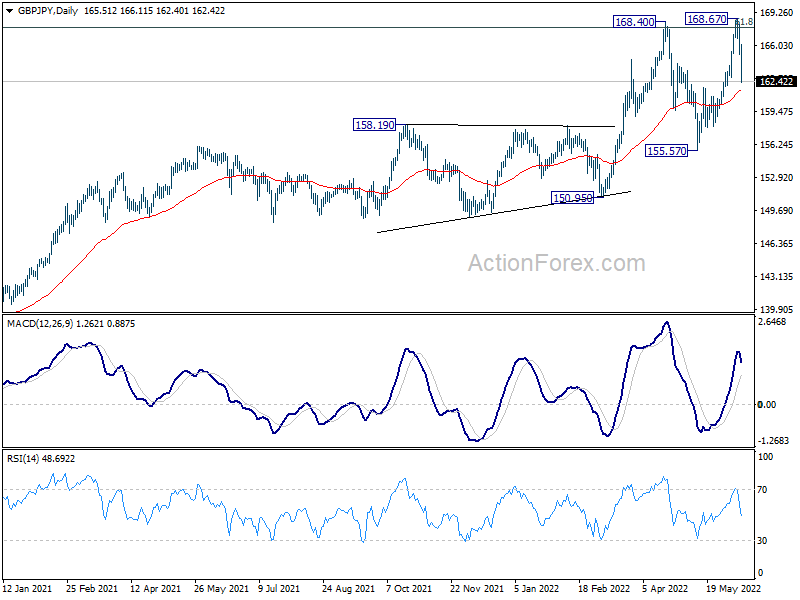
Daily Pivots: (S1) 164.36; (P) 166.24; (R1) 167.30; More...
GBP/JPY's break of 162.88 minor resistance suggests that deeper correction is underway. Intraday bias is now on the downside for 55 day EMA (now at 161.56). Sustained break there will target 155.57 support. On the upside, above 165.14 minor resistance will turn bias back to the upside for 168.67 again.
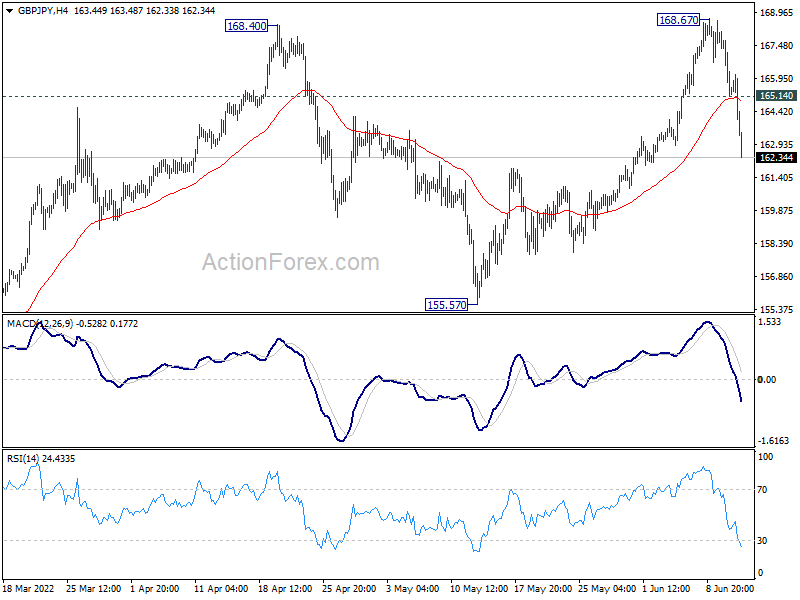
In the bigger picture, up trend from 123.94 (2020 low) is still in progress. Sustained break of 61.8% retracement of 195.86 (2015 high) to 122.75 (2016 low) at 167.93 will be a long term bullish signal, and could pave the way back to 195.86 high. This will now remain the favored case as long as 155.57 support holds, even in case of deep pull back.
EUR/JPY Mid-Day Outlook
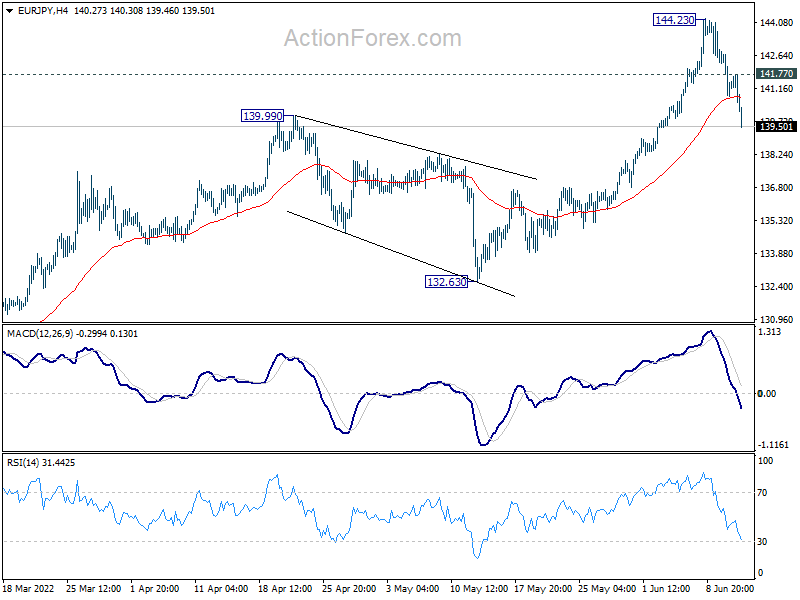
Daily Pivots: (S1) 140.52; (P) 141.66; (R1) 142.51; More....
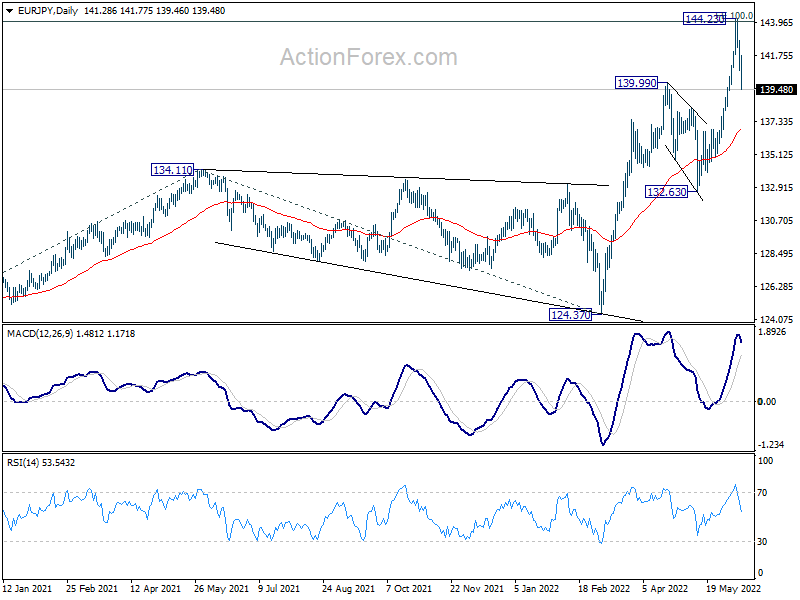
The break of 139.99 resistance turned support suggests that deeper correction is underway. Intraday bias is now on the downside for 55 day EMA (now at 136.85). Break there will bring further decline to 132.63 support. On the upside, above 141.77 minor resistance will turn bias back to the upside for 144.23 again.
In the bigger picture, up trend from 114.42 (2020 low) is in progress. Such rise is seen as the third leg of the pattern from 109.30 (2016 low). Sustained trading above 100% projection of 114.42 to 134.11 from 124.37 at 144.06 will indicate upside acceleration and target 149.76 long term resistance (2014 high). In any case, outlook will now remain bullish as long as 132.63 support holds, in case of deep pull back.
Canadian Dollar Extends Slide
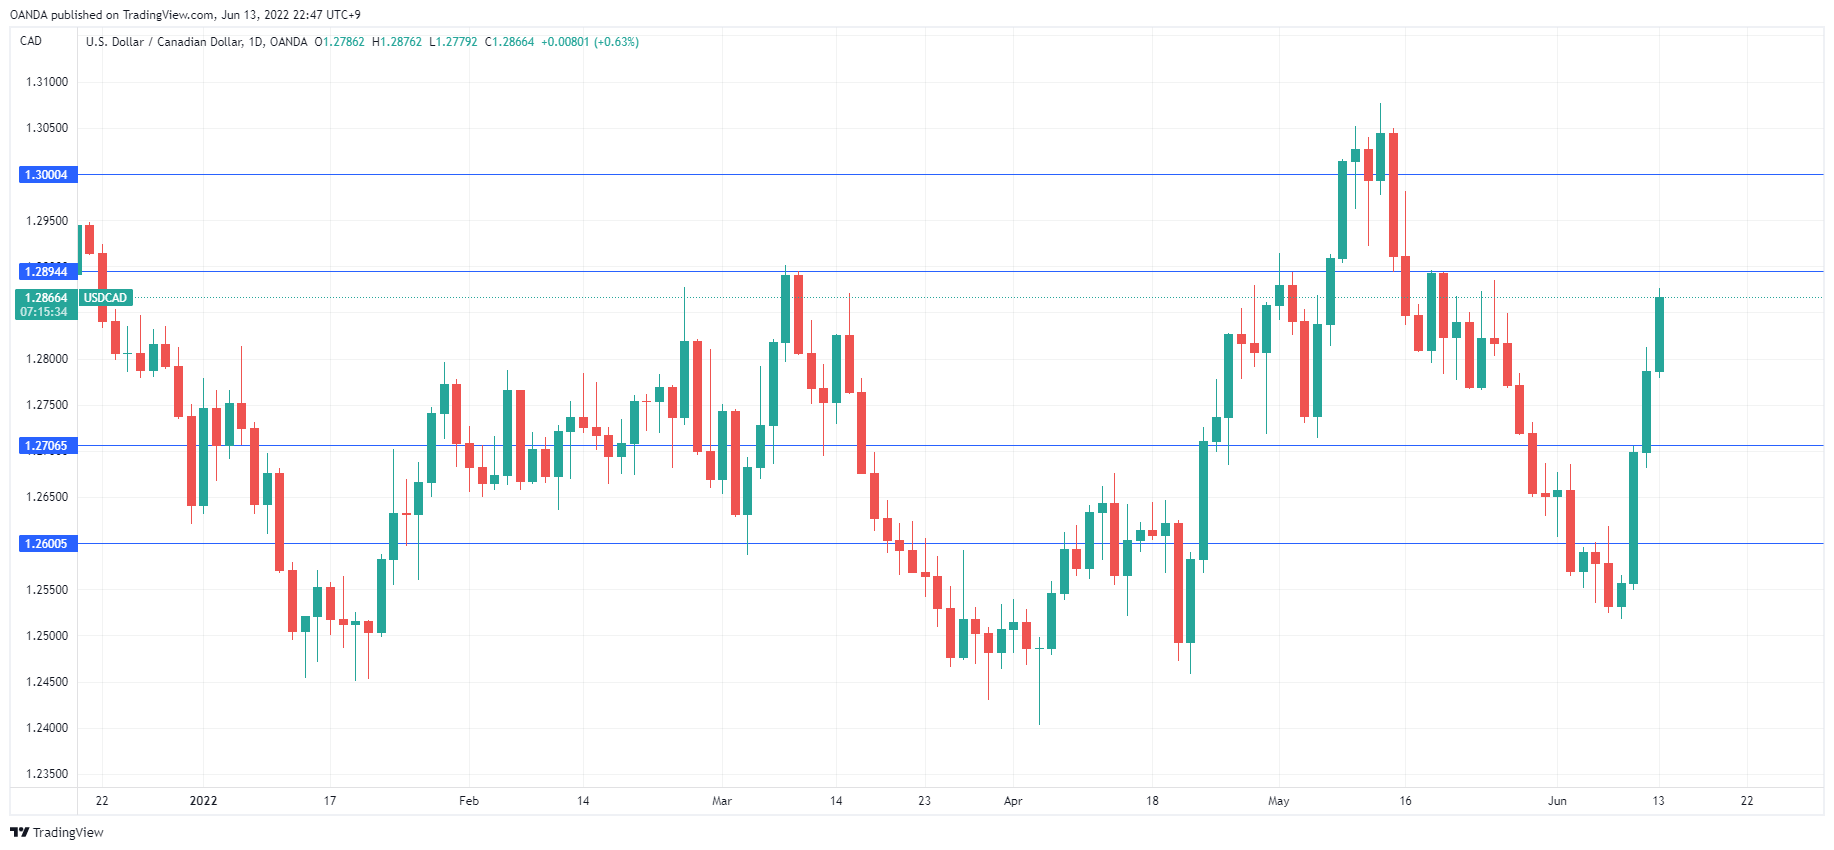
The Canadian dollar continues to lose ground, despite solid Canadian employment data on Friday. In the European session, USD/CAD is trading at 1.2845, up 0.47% on the day.
US dollar climbs after CPI rises
The US dollar posted strong gains on Friday, as US inflation continued to climb in May. Headline inflation rose to 8.6% YoY, up from 8.30% in April. Core inflation dipped to 6.0%, down from 6.2%, but that didn’t soothe investors, who were looking for an even stronger decline. The inflation data left the markets with a sour taste of entrenched inflation, which sent equities down and the US dollar higher.
The Fed will not be pleased with the latest inflation report, and it’s clear that it will have to keep its foot on the gas when setting interest rates. That could mean that we’ll see 50-bp hikes in June, July and September. Just a couple of weeks ago the Fed signalled it would take a break in September, but that now seems a luxury it can’t afford, given that inflation hasn’t eased.
There have been calls for the Fed to deliver a massive 75-bps salvo at Wednesday’s meeting, but such a shock move seems unlikely, especially in the current turbulent economic environment. If Fed Chair Powell is looking to send a hawkish message to the markets, he could hint at the meeting press conference that a 75-bp increase is on the table if inflation doesn’t ease. Such a warning would likely boost the US dollar.
Canadian job data ended the week on a strong note, as the economy created 39.8 thousand jobs in May, up from 15.3 thousand in April (30.0 thousand exp.). The unemployment rate ticked lower to 5.1%, down from 5.2% (5.2% exp.). Ordinarily, these numbers would have boosted the Canadian dollar, but they were overshadowed by US inflation, which dampened risk appetite and sent the Canadian dollar lower.
USD/CAD Technical
- USD/CAD faces resistance at 1.2894. Above, there is resistance at the round number of 1.3000
- There is support at 1.2706 and 1.2600