

Sample Category Title
EUR/USD Daily Outlook
Daily Pivots: (S1) 1.0763; (P) 1.0808 (R1) 1.0843; More...
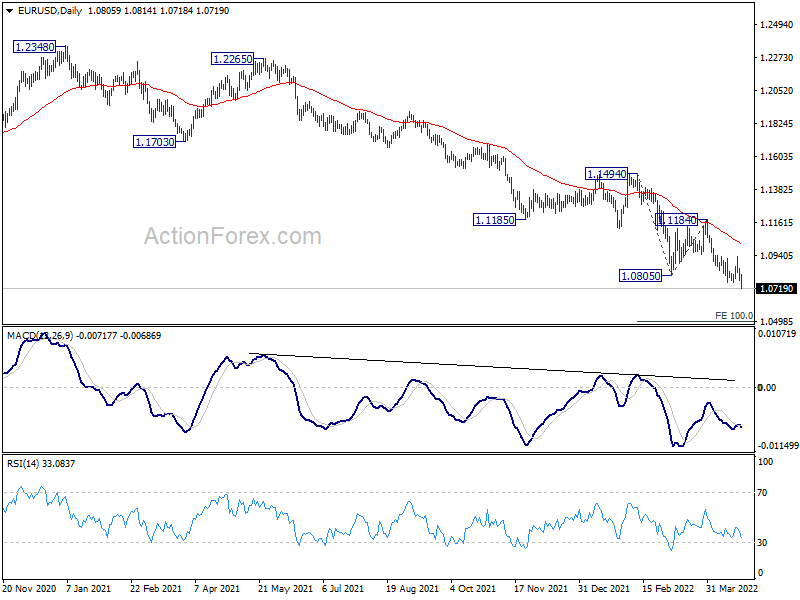
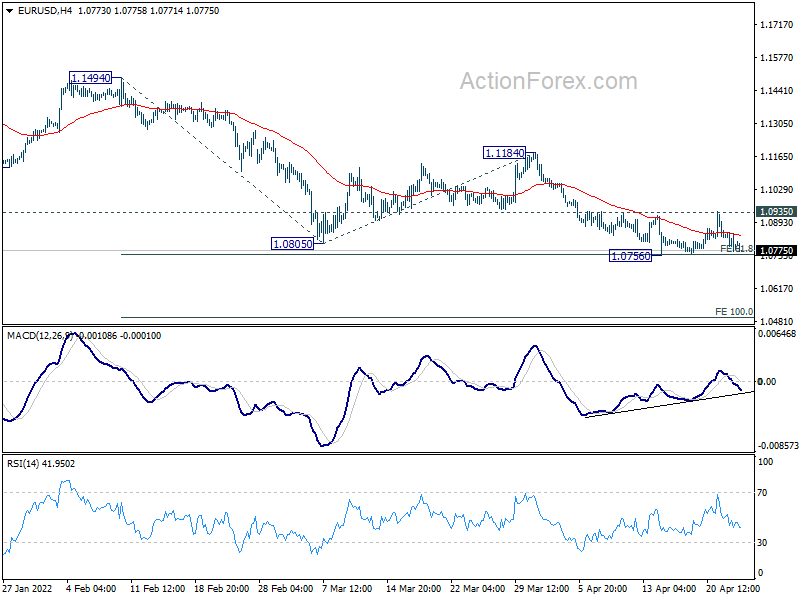
EUR/USD's down trend finally resumes by breaking 1.0756 today. Intraday bias is now back on the downside. Next target is 100% projection of 1.1494 to 1.0805 from 1.1184 at 1.0495. On the upside, break of 1.0935 resistance is needed to indicate short term bottoming. Otherwise, outlook will stay bearish in case of recovery.
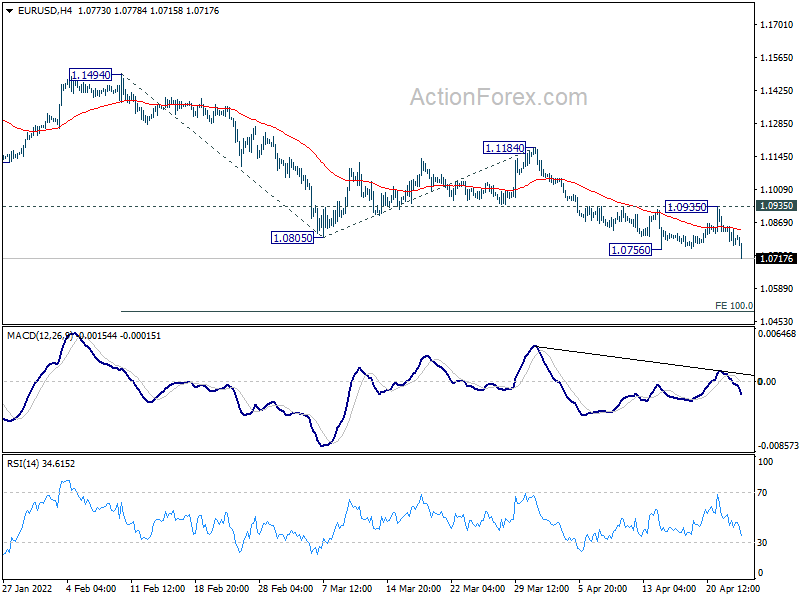
In the bigger picture, the decline from 1.2348 (2021 high) is expected to continue as long as 1.1185 support turned resistance holds. Firm break of 1.0635 (2020 low) will raise the chance of long term down trend resumption and target a retest on 1.0339 (2017 low) next. Nevertheless, break of 1.1185 will maintain medium term neutral outlook, and extending term range trading first.
GBP/USD Daily Outlook
Daily Pivots: (S1) 1.2763; (P) 1.2899; (R1) 1.2976; More...
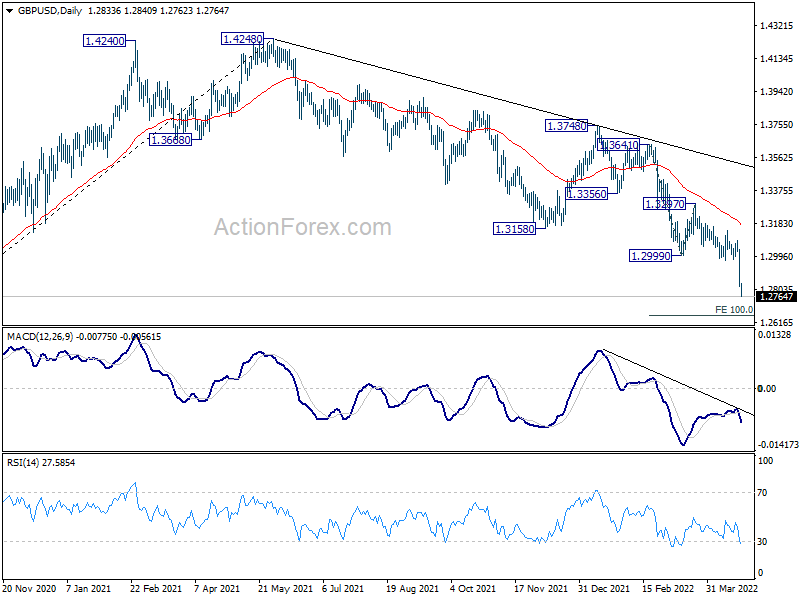
GBP/USD's down trend continues today and intraday bias stays on the downside. Next target is 100% projection of 1.3641 to 1.2999 from 1.3297 at 1.2655 On the upside, above 1.2861 minor resistance will turn intraday bias neutral and bring consolidation first, before staging another decline.
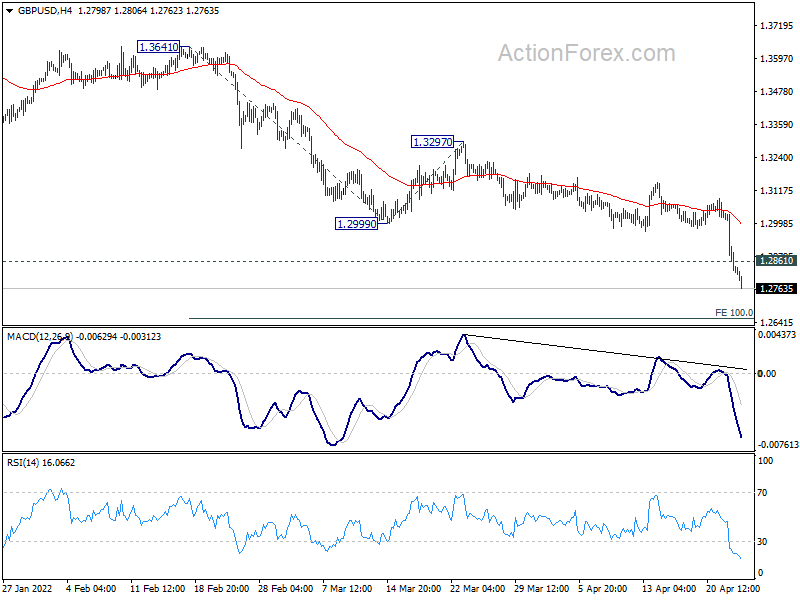
In the bigger picture, rise from 1.1409 (2020 low) has completed at 1.4248, ahead 1.4376 long term resistance (2018 high). Decline from 1.4248 could still be a corrective move, or it could be the start of a long term down trend. In either case, deeper decline would be seen back to 61.8% retracement of 2.1161 to 1.1409 at 1.2493. In any case, break of 1.3158 support turned resistance is needed to be the first sign of medium term bottoming. Otherwise, outlook will stay bearish in case of rebound.
USD/CHF Daily Outlook
Daily Pivots: (S1) 0.9534; (P) 0.9564; (R1) 0.9599; More....
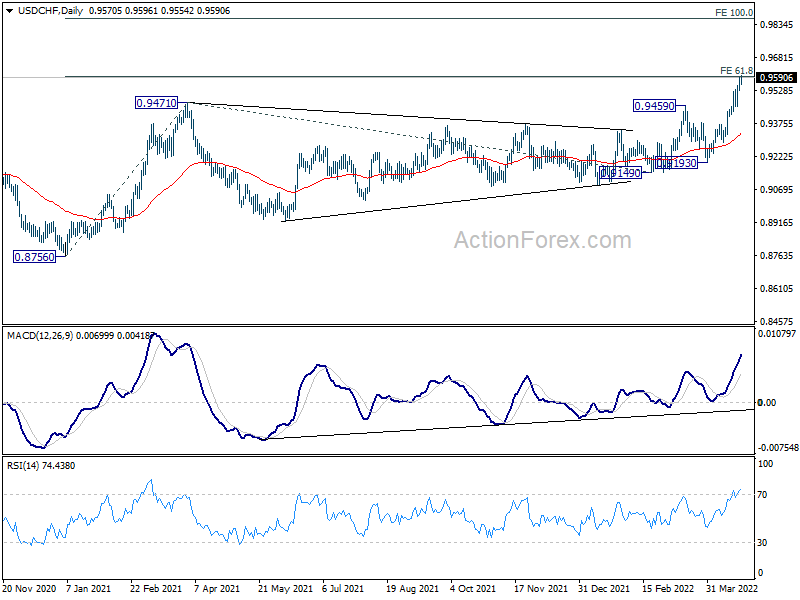
Intraday bias in USD/CHF remains on the upside for the moment. Sustained break of 0.9591 medium term projection level will pave the way to next at 0.9864. On the downside, break of 0.9453 support is needed to indicate short term topping. Otherwise, outlook will remain bullish in case of retreat.
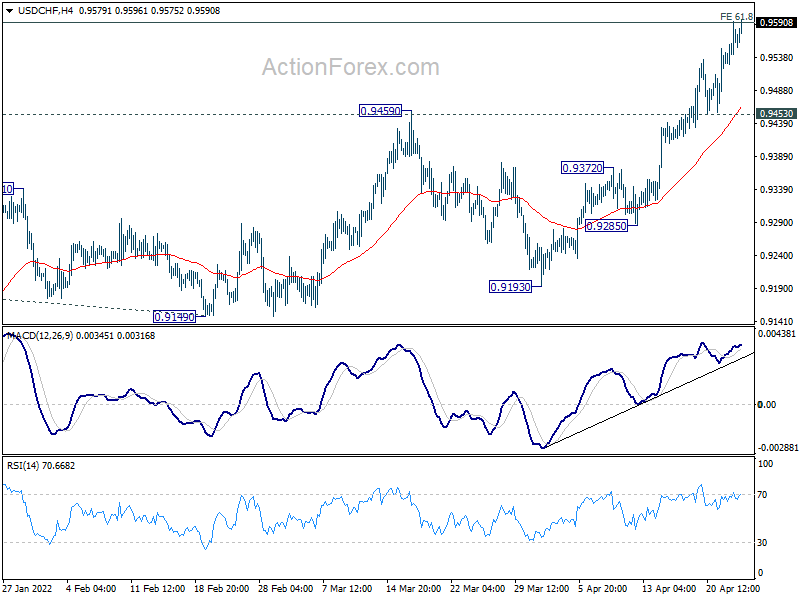
In the bigger picture, down trend from 1.0342 (2016 high) could have completed with three waves down to 0.8756 (2021 low) already. Rise from 0.8756 is likely a medium term up trend of its own. Sustained break of 61.8% projection of 0.8756 to 0.9471 from 0.9149 at 0.9591 will pave the way to 100% projection at 0.9864. This will now remain the favored case as long as 0.9193 support holds.
USD/JPY Daily Outlook
Daily Pivots: (S1) 127.83; (P) 128.47; (R1) 129.20; More...
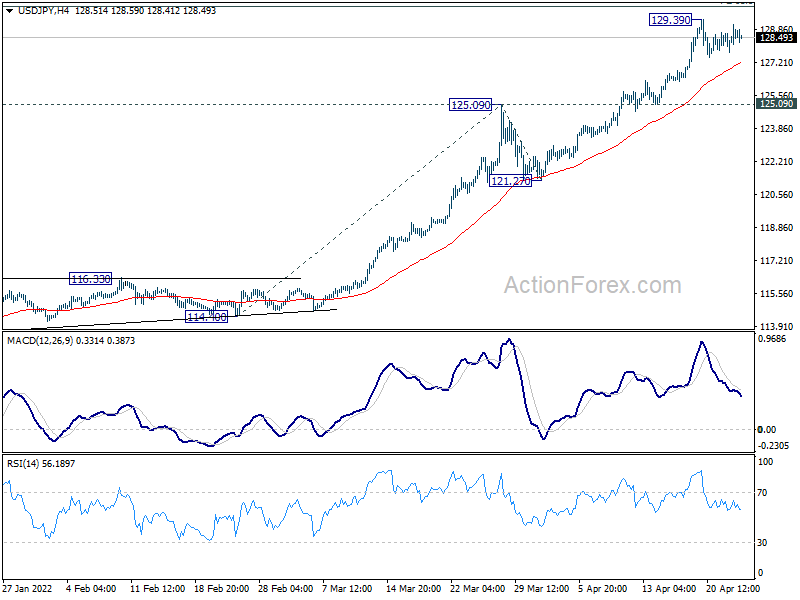
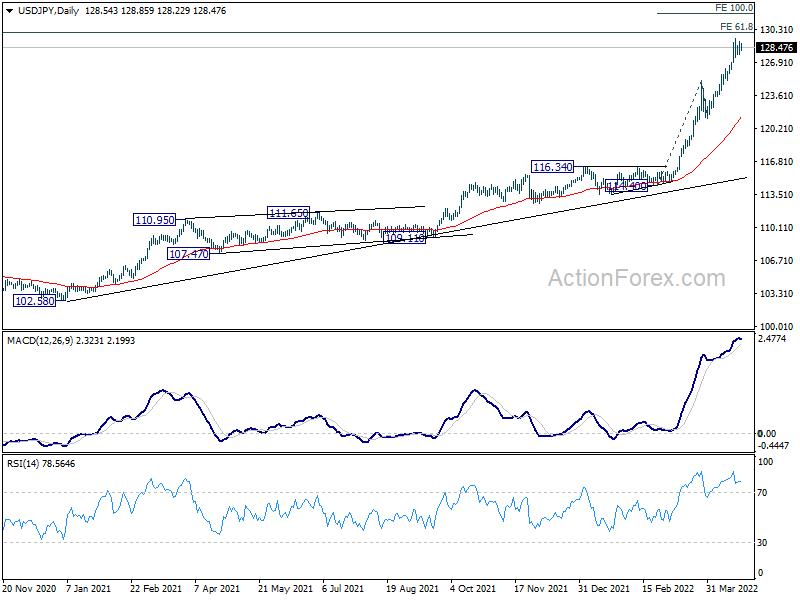
USD/JPY is extending the consolidation from 129.39 and intraday bias remains neutral. Deeper retreat cannot be ruled out, but downside should be contained above 125.09 resistance turned support to bring another rally. On the upside, above 129.39 will target 130.04 long term projection level next.
In the bigger picture, the break of 125.85 resistance (2015 high) suggests that whole up trend from 75.56 (2011 low) is resuming. Further rise should be seen to 61.8% projection of 75.56 (2011 low) to 125.85 (2015 high) from 98.97 at 130.04. Sustained break there wave the way to 147.68 (1998 high). For now, this will remain the favored case as long as 121.27 support holds.
USD/CAD Daily Outlook
Daily Pivots: (S1) 1.2610; (P) 1.2668; (R1) 1.2768; More...
Intraday bias in USD/CAD remains on the upside for the moment. Rebound from 1.2401 is still in progress and should target 1.2899 resistance next. On the downside, however, break of 1.2652 minor support will mix up the near term outlook and turn intraday bias neutral again.
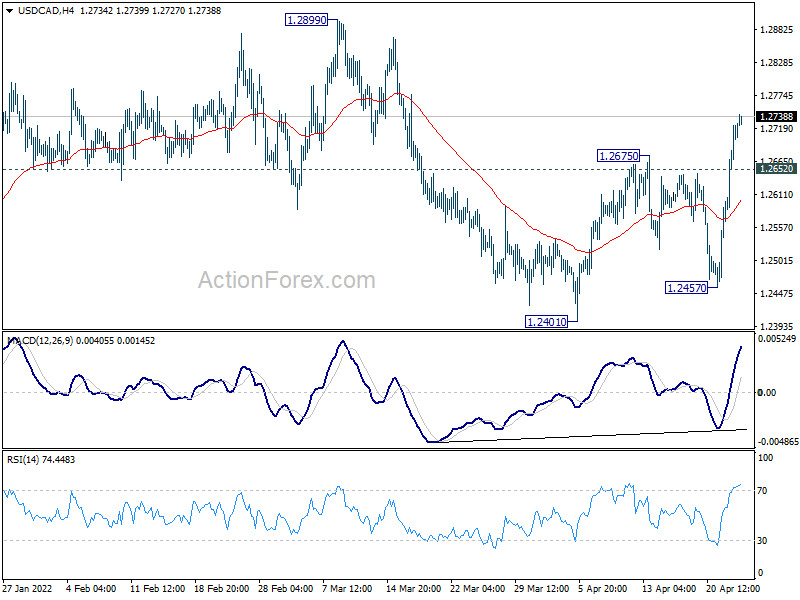
In the bigger picture, focus stays on 38.2% retracement of 1.4667 (2020 high) to 1.2005 (2021 low) at 1.3022. Sustained break there should confirm that the down trend from 1.4667 has completed after defending 1.2061 long term cluster support. Further rise would then be seen towards 61.8% retracement at 1.3650. However, rejection by 1.3022 will maintain medium term bearishness. Break of 1.2005 will resume the down trend from 1.4667 and that carries larger bearish implications too.
AUD/USD Daily Report
Daily Pivots: (S1) 0.7193; (P) 0.7286; (R1) 0.7338; More...
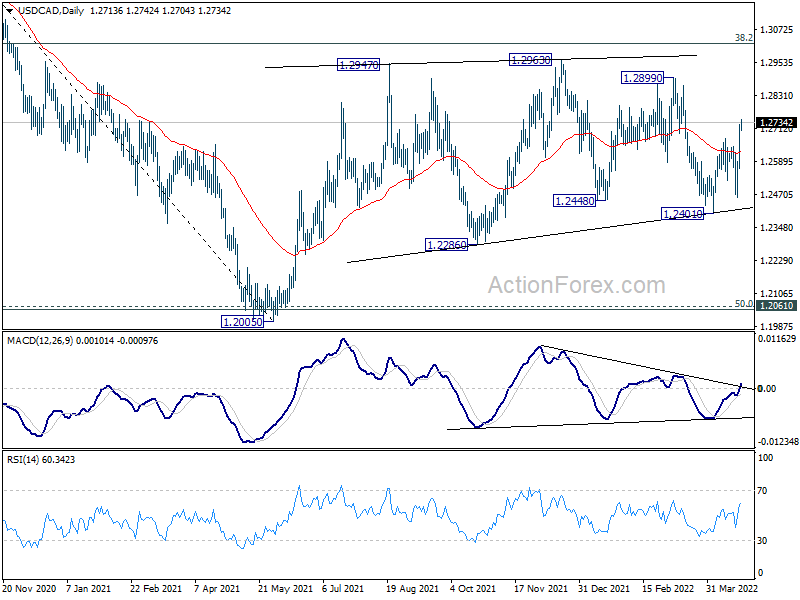
Intraday bias in AUD/USD remains on the downside with focus on 0.7164 support. Decisive break there will confirm that whole rebound from 0.6966 has completed at 0.7660. More importantly, such development will suggest that larger correction from 0.8006 has already started the third leg. Deeper decline would be seen back to retest 0.6966 low next. On the upside, break of 0.7342 support turned resistance is needed to indicate short term bottoming. Otherwise, further decline will remain in favor even in case of recovery.
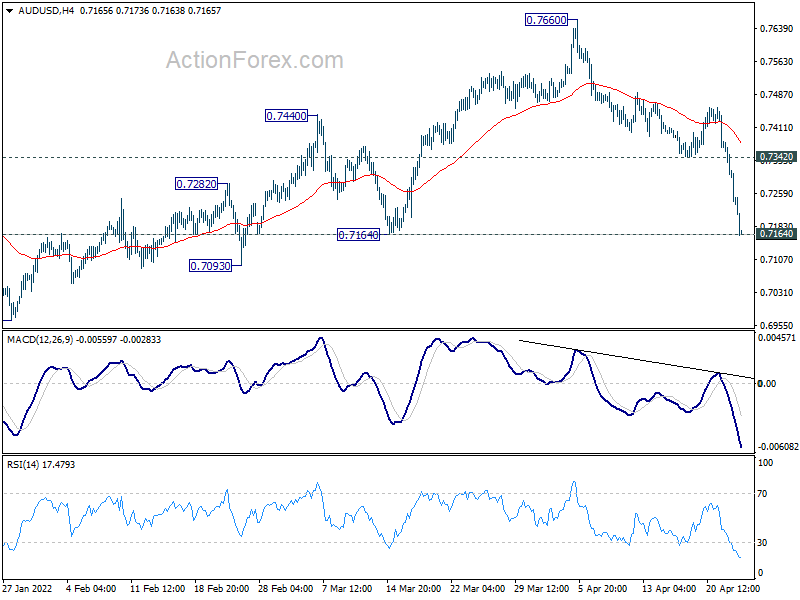
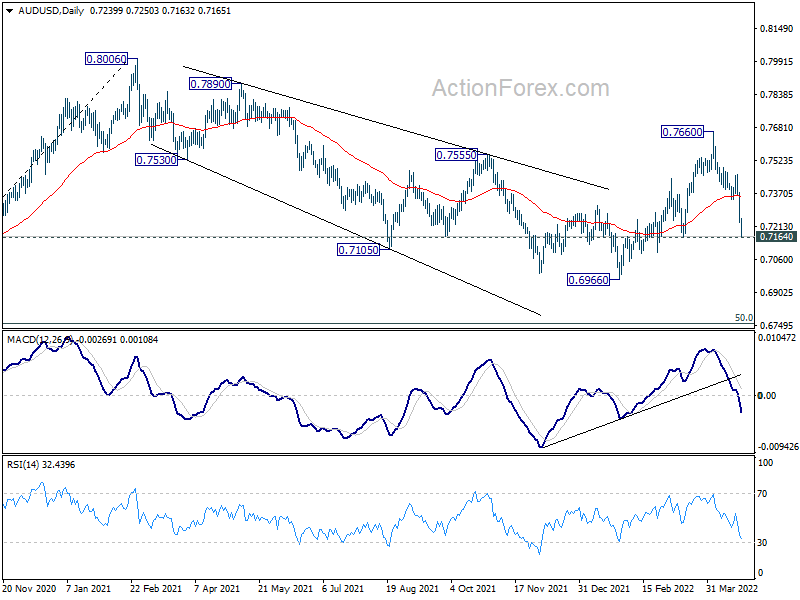
In the bigger picture, price actions from 0.8006 are seen as a corrective pattern to rise from 0.5506 (2020 low). Break of 0.7164 will suggest that such correction is still in progress, with fall from 0.7660 as the third leg. Next target will be 50% retracement of 0.5506 to 0.8006 at 0.6756. On the upside, break of 0.7660 will revive that case that the correction has already completed at 0.6966.
Dollar Rally Continues on Risk-Off Sentiment, Euro to Break Support?
Risk aversion dominates the markets in Asia with concerns on more tough lockdowns in China, including the capital city of Beijing. Dollar jumps broadly higher, with Yen and Swiss Franc as distant second and third. Aussie and Kiwi are extending last week's decline, trading as the worst ones for today so far. Euro is the next weakest, playing catch-up, with little support from new that Emmanuel Macron was re-elected for a second term as French President. Sterling is also looking vulnerable.
Technically, one major focus today is 1.0756 support in EUR/USD. Firm break there will resume larger down trend from 1.2348. That would align the bearish outlook with Sterling and Franc against the greenback. Such development should also seal the case for underlying bullish momentum in Dollar, probably for the medium term too.
In Asia, at the time of writing, Nikkei is down -1.84%. Hong Kong HSI is down -2.86%. China Shanghai SSE is down -2.62%. Singapore Strait Times is down -0.25%. Japan 10-year JGB yield is up 0.0020 at 0.252.
Ethereum breaking down, bitcoin to follow
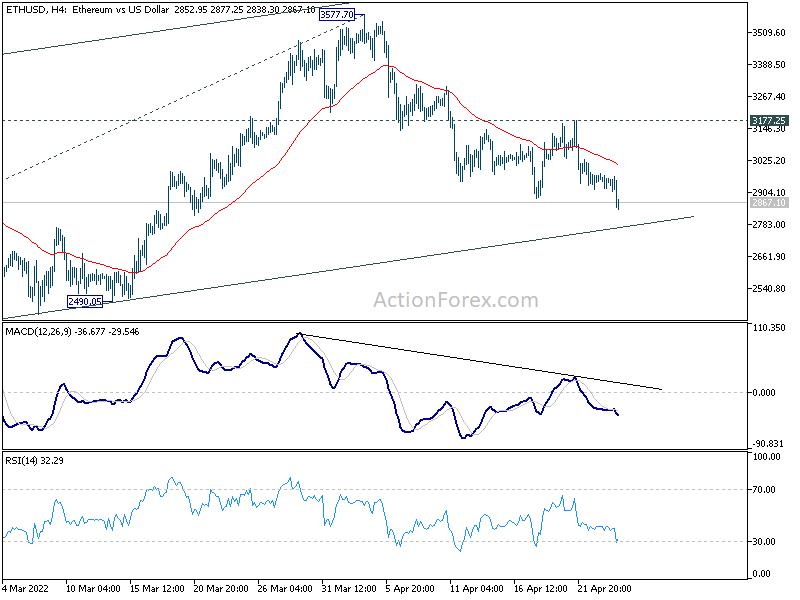
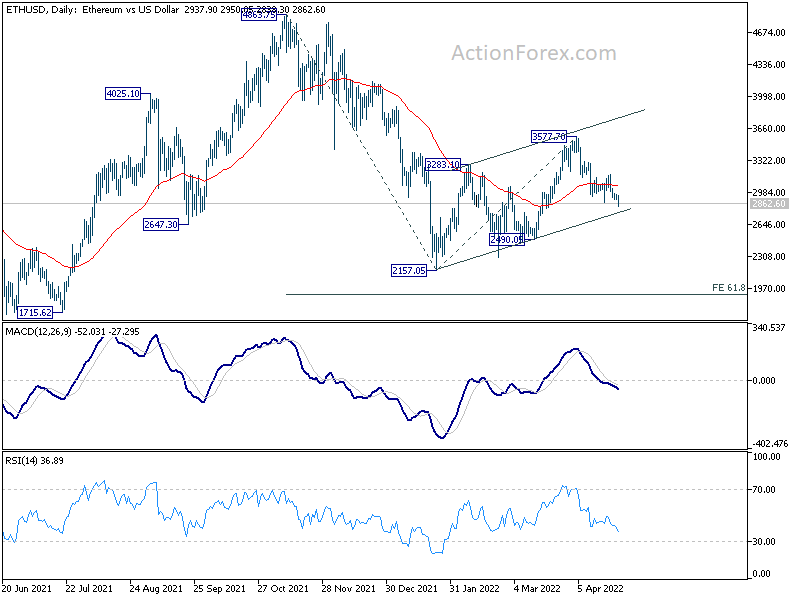
Ethereum follows broad based risk-off sentiment lower today and dips to as low as 2838.30 so far. The development is in-line with the view that corrective pattern from 2157.05 has completed with three waves up to 3577.70. Further decline is now expected as long as 3177.25 resistance holds.
Sustained break of near term channel support, and then 2490.05 support, should sent the stage for resumption of whole down trend form 4863.75. Next target is 61.8% projection of 4863.75 to 2157.04 from 3577.70 at 1804.95.
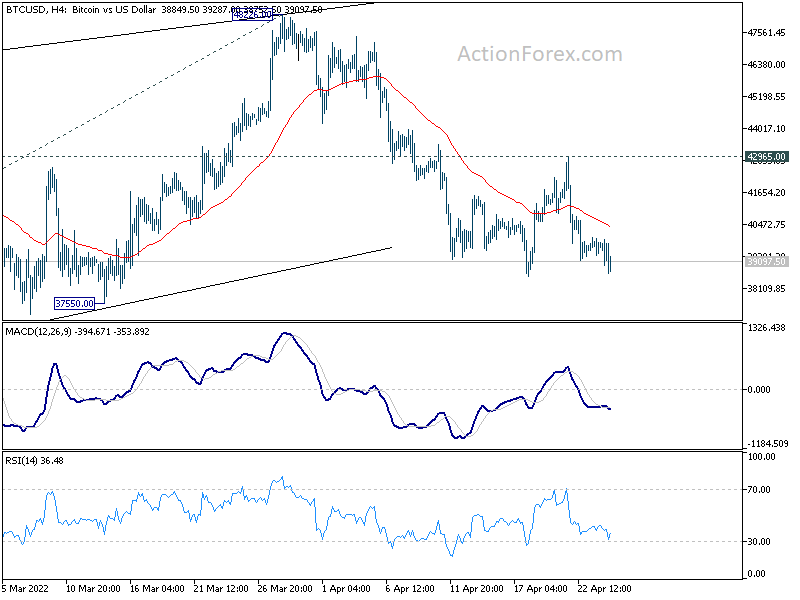
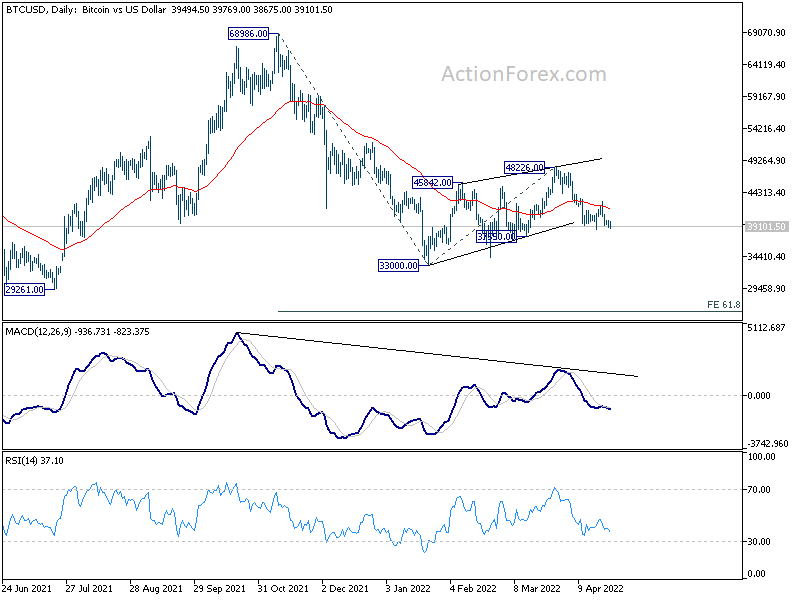
Similarly, bitcoin should follow and break through 38539 support soon, to resume the decline from 48226. Further break of 37550 support should set the stage for resumption of down trend from 68986. Next target is 61.8% projection of 68986 to 33000 from 48226 at 25986.
WTI crude oil falls on concern of Beijing lockdown
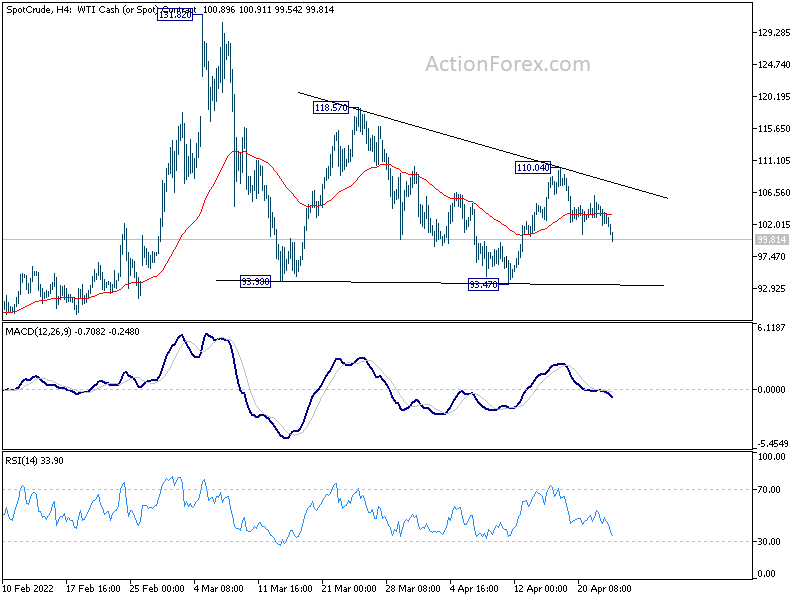
WTI crude oil falls notably in Asian session, following general risk-off sentiment. It's reported that more than a dozen of buildings are now also under lockdown the largest district of Chaoyang in Beijing, China's capital. That raised concerns that Beijing could be put under tough and continued lockdown like Shanghai soon, which would then weigh further on oil demand.
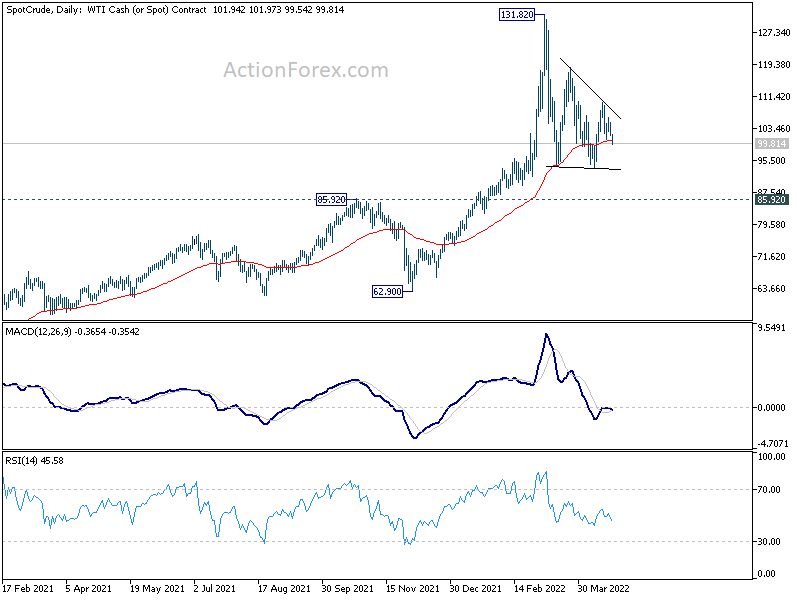
WTI crude oil is seen as in the fifth leg of a triangle corrective pattern which started at 131.82, back in early March. Deeper fall should be seen in the near term towards lower side of the pattern at 93.47. A breach of that level could be seen but it should be relatively brief, and contained above key support level at 85.92.
The main question is that after the corrective pattern completes, whether the next rally could break through 131.82 high. But in any case, the next rise should be the last in current up trend and should then set up a medium term corrective phase which lasts much longer.
ECB said to be keen on starting rate hike in Jul
According to a Reuters report, some unnamed ECB sources said ECB policymakers were keen to end the asset purchases in June, and start raising interest rate soon. Some expected interest hike to start as soon as in July. The main policy rate could be back to neutral at around 1.00-1.25% by the end of the year. That would also lift the deposit rate back into positive territory for the first time since 2014.
ECB President Christine Lagarde sounded more cautious with her comments, however. She just said last Friday, "If the situation continues as predicated at the moment, there is a strong likelihood that rates will be hiked before the end of the year. How much, now many times, remains to be seen and will be data dependent."
BoJ meeting, GDP and CPI data to highlight the week
BoJ will meet this week and it's clear that it will maintain the current ultra-loose monetary policy. Nevertheless, there is still some chance for the central bank to tweak the yield curve control parameters, by allowing the yield of 10-year JGB to "fluctuate more than +/- 0.25%". Or, a less likely change is to target yield with shorter maturity than 10 years. So, there is still some scope of post meeting volatility.
On the data front, GDP from the US, Eurozone and Canada will be mostly watched. US will also release durable goods orders, consumer confidence, and personal income and spending. Germany Ifo business climate and Eurozone CPI flash will be watched. Australia CPI is also important as that could set the stage for a June RBA rate hike, or even earlier.
Here are some highlights for the week:
- Monday: Japan corporate services prices; Germany Ifo business climate.
- Tuesday: Japan unemployment rate; Swiss Trade balance; UK public sector net borrowing; US durable goods orders, house price index, consumer confidence, new home sales.
- Wednesday: Australia CPI; Germany Gfk consumer climate; US goods trade balance, pending homes.
- Thursday: New Zealand trade balance; BoJ rate decision, Japan industrial production, retail sales, housing starts; Germany CPI flash; ECB monthly bulletin; US GDP, jobless claims.
- Friday: Australia PPI, private sector credit; Swiss retail sales, KOF economic barometer; France GDP; Germany GDP; Eurozone M3 money supply, GDP, CPI flash; Canada GDP; US personal income and spending, Chicago PMI.
AUD/USD Daily Report
Daily Pivots: (S1) 0.7193; (P) 0.7286; (R1) 0.7338; More...
Intraday bias in AUD/USD remains on the downside with focus on 0.7164 support. Decisive break there will confirm that whole rebound from 0.6966 has completed at 0.7660. More importantly, such development will suggest that larger correction from 0.8006 has already started the third leg. Deeper decline would be seen back to retest 0.6966 low next. On the upside, break of 0.7342 support turned resistance is needed to indicate short term bottoming. Otherwise, further decline will remain in favor even in case of recovery.
In the bigger picture, price actions from 0.8006 are seen as a corrective pattern to rise from 0.5506 (2020 low). Break of 0.7164 will suggest that such correction is still in progress, with fall from 0.7660 as the third leg. Next target will be 50% retracement of 0.5506 to 0.8006 at 0.6756. On the upside, break of 0.7660 will revive that case that the correction has already completed at 0.6966.
Economic Indicators Update
| GMT | Ccy | Events | Actual | Forecast | Previous | Revised |
|---|---|---|---|---|---|---|
| 23:50 | JPY | Corporate Service Price Index Y/Y Mar | 1.30% | 1.20% | 1.10% | |
| 08:00 | EUR | Germany IFO Business Climate Apr | 88.1 | 90.8 | ||
| 08:00 | EUR | Germany IFO Current Assessment Apr | 95 | 97 | ||
| 08:00 | EUR | Germany IFO Expectations Apr | 82.3 | 85.1 |
Technical Outlook and Review
DXY:
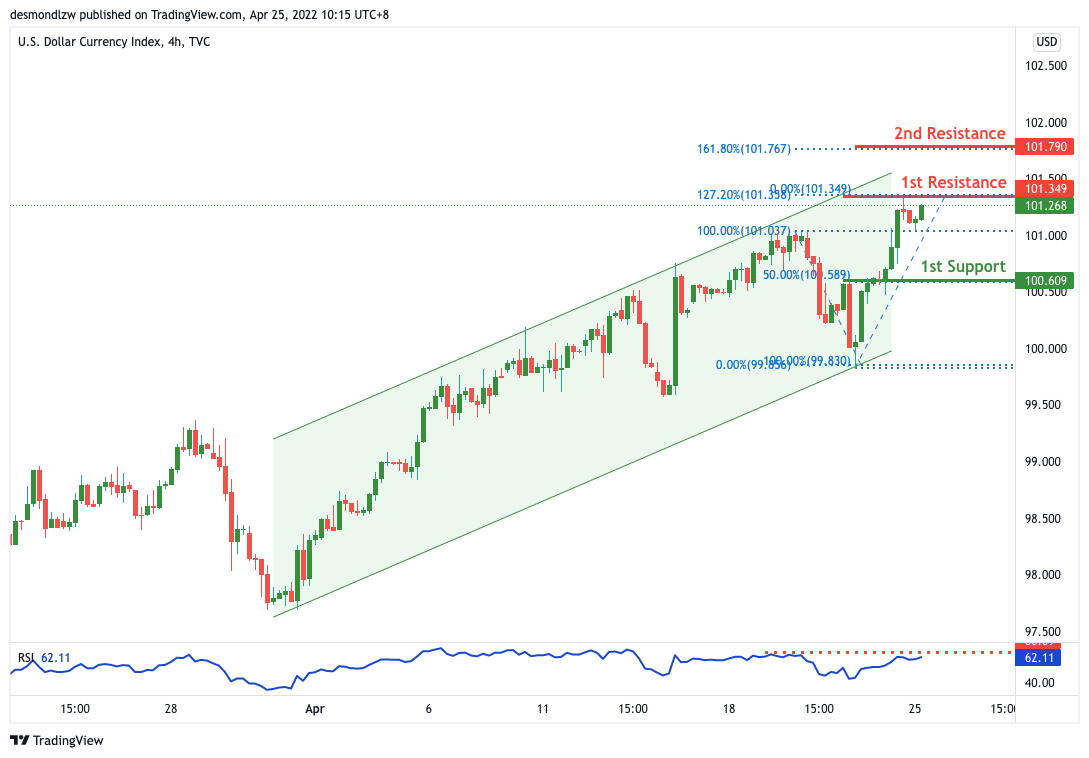
On the H4, with price expected to reverse off the stochastics indicator, we have a bearish bias that price will drop from our 1st resistance at 101.790 where the 127.2% Fibonacci extension and swing high resistance is to our 1st support at 100.609 in line with the horizontal pullback support and 50% Fibonacci retracement. Alternatively, price may break 1st resistance structure and head for 2nd resistance where the 161.8% Fibonacci extension is.
Areas of consideration:
- H4 time frame, 1st resistance at 101.790
- H4 time frame, 1st support at 100.609
XAU/USD (GOLD):
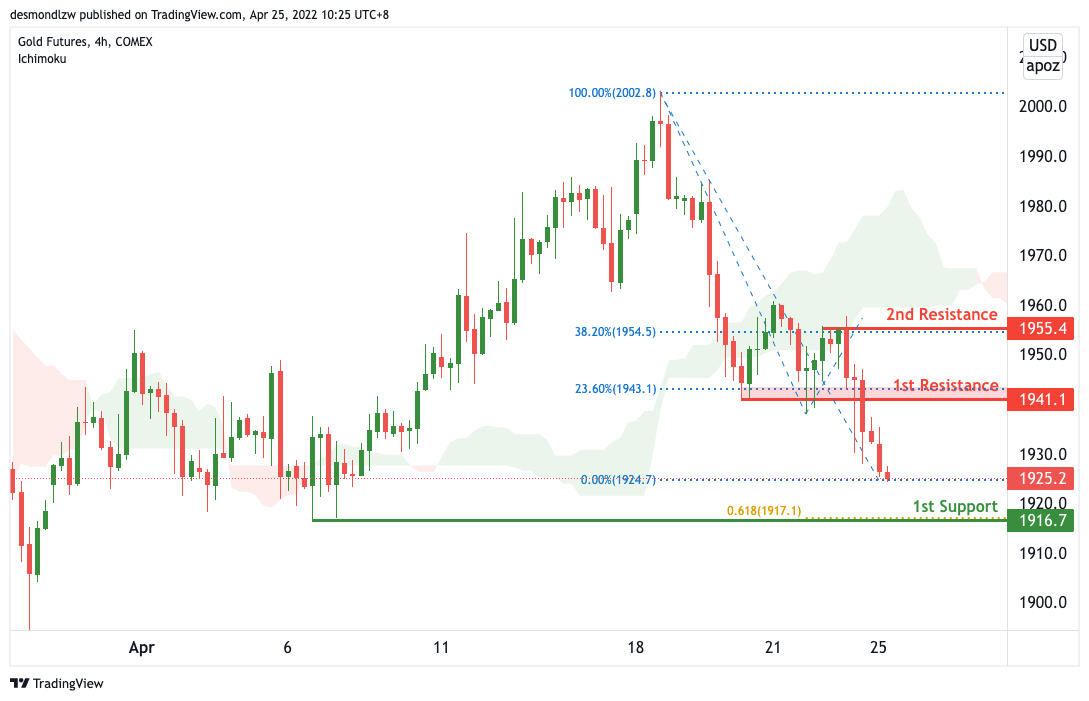
On the H4, with price moving below the ichimoku cloud, we are expecting price to potentially dip from 1st resistance level of 1941 which is line with 23.6% Fibonacci retracement, along with a graphical pullback resistance towards the 1st support level of 1916 in line with a horizontal swing low support and 61.8% Fibonacci retracement. Otherwise, price might break the 1st resistance level and head towards the 2nd resistance level of 1955 where the 38.2% Fibonacci retracement and swing high resistance is.
Areas of consideration:
- H4 time frame, 1st Resistance at 1941
- H4 time frame, 1st Support at 1916
GBP/USD:
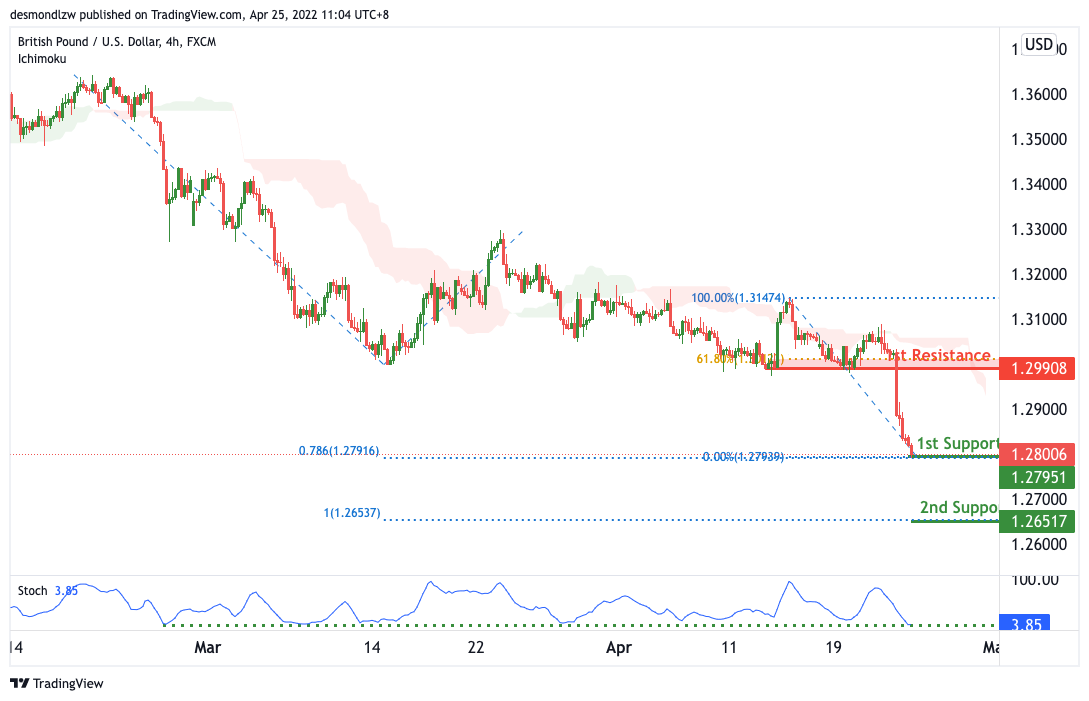
On the H4, with price expected to bounce off the stochastics indicator, we have a bullish bias that price will rise to our 1st resistance of 1.29908 in line with the 61.8% Fibonacci retracement and horizontal pullback resistance from our 1st support of 1.27951 in line with the 78.6% Fibonacci projection. Alternatively, price may break 1st support and head for 2nd support at 1.26517 in line with the 100% Fibonacci projection.
Areas of consideration:
- H4 1st resistance at 1.29908
- H4 1st support at 1.27951
USD/CHF:
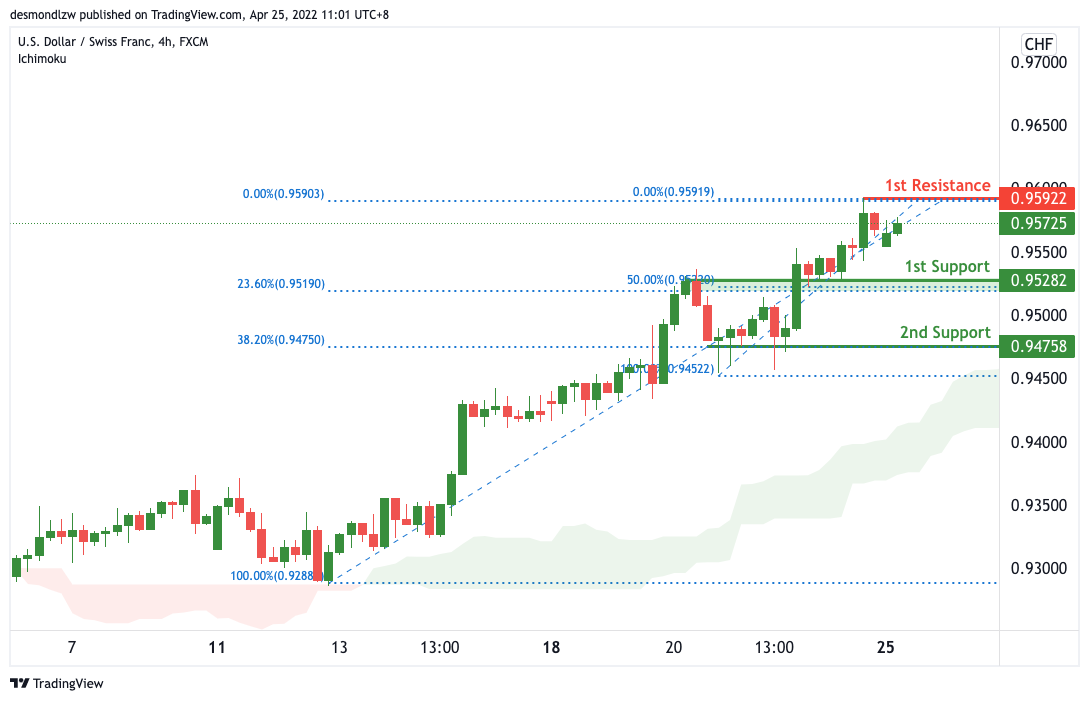
On the H4, with price moving above the ichimoku cloud, we have a bullish bias that price will rise to our 1st resistance of 0.95922 in line with the horizontal swing high resistance from our 1st support of 0.95282 in line with the 23.6% and 50% Fibonacci retracement. Alternatively, price may break 1st support and head for 2nd support at 0.94758 in line with the 38.2% Fibonacci retracement.
Areas of consideration
- 1st support level at 0.95282
- 1st resistance level at 0.95922
EUR/USD :
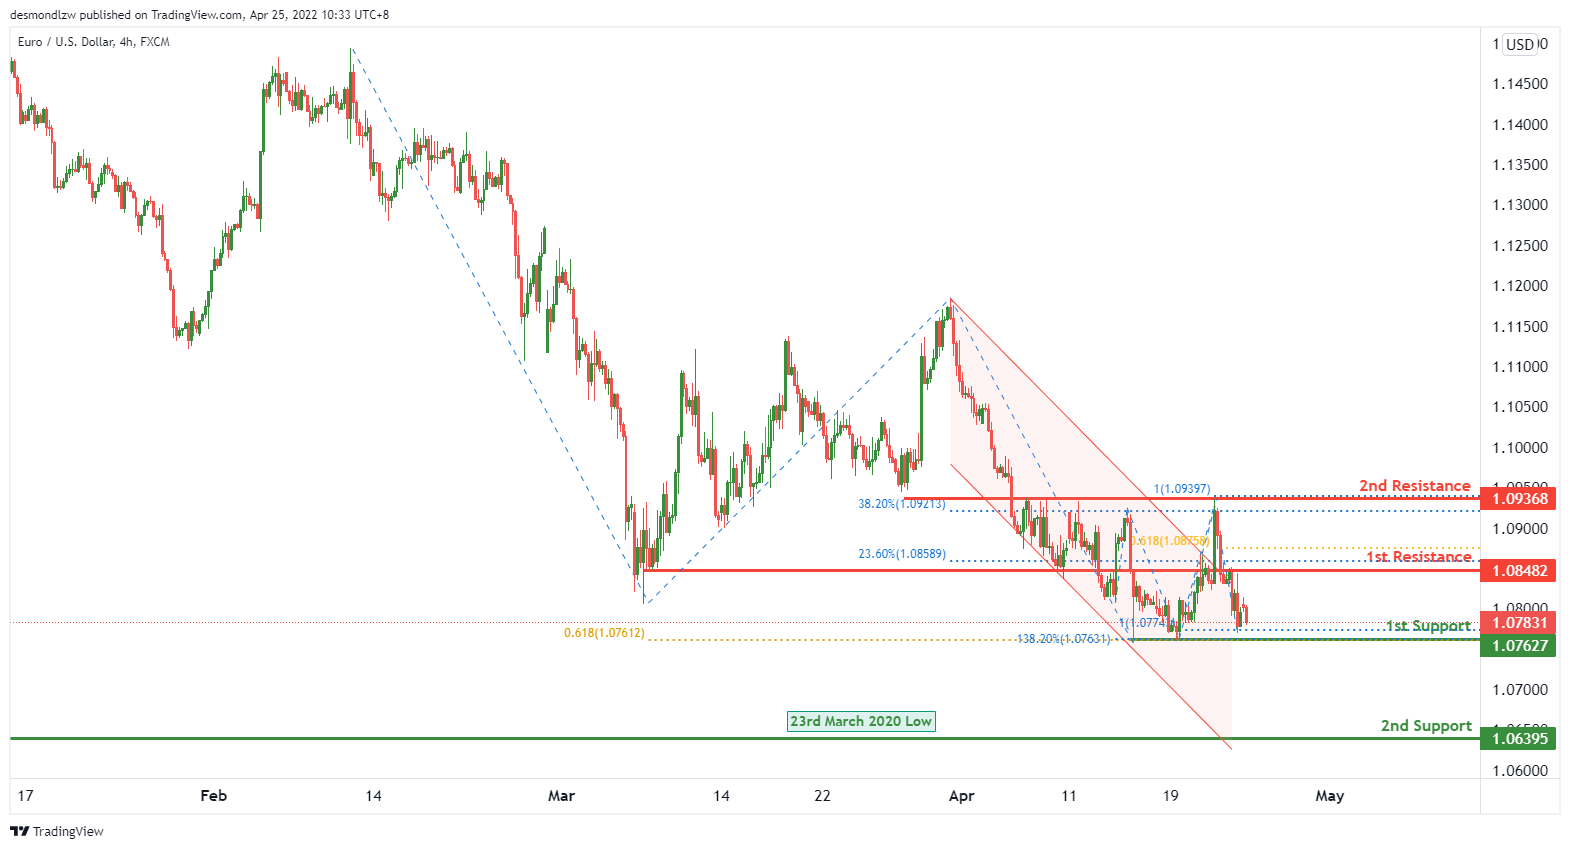
On the H4, price is near the pivot level. We expect price to potentially bounce from 1st support level of 1.07627 in line with 100% fibonacci projection and 138.2% fibonacci extension towards the 1st resistance level of 1.08482 in line with 23.6% fibonacci retracement and 61.8% fibonacci projection.
Areas of consideration :
- H4 1st resistance at 1.08482
- H4 2nd resistance at 1.09368
- H4 1st support at 1.07627
- H4 2nd support at 1.06395
USD/JPY:
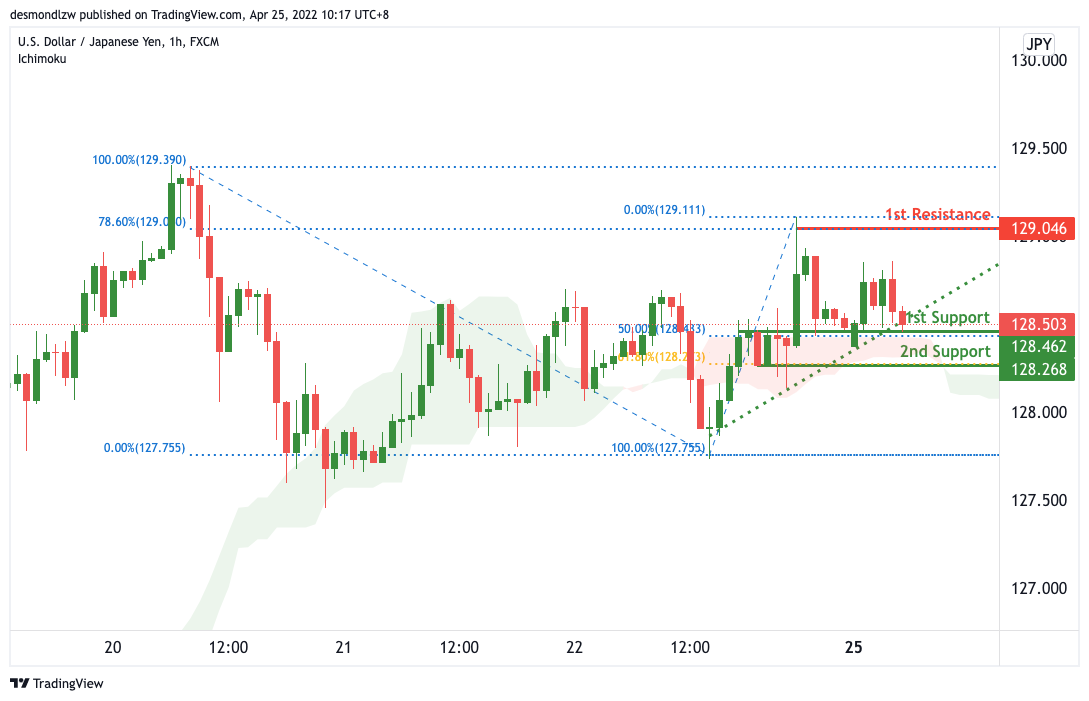
On the H4, with price moving above the ichimoku cloud and approaching the support of the ascending trend line, we have a bullish bias that price will rise to our 1st resistance at 129.046 where the swing high resistance and 78.6% Fibonacci retracement is from our 1st support at 128.462 in line with the horizontal pullback support and 50% Fibonacci retracement. Alternatively, price may break 1st support structure and head for 2nd support at 128.268 where the horizontal swing low support and 61.8% Fibonacci retracement is.
Areas of consideration:
- H4 time frame, 1st resistance at 129.046
- H4 time frame, 1st support at 128.462
AUD/USD:
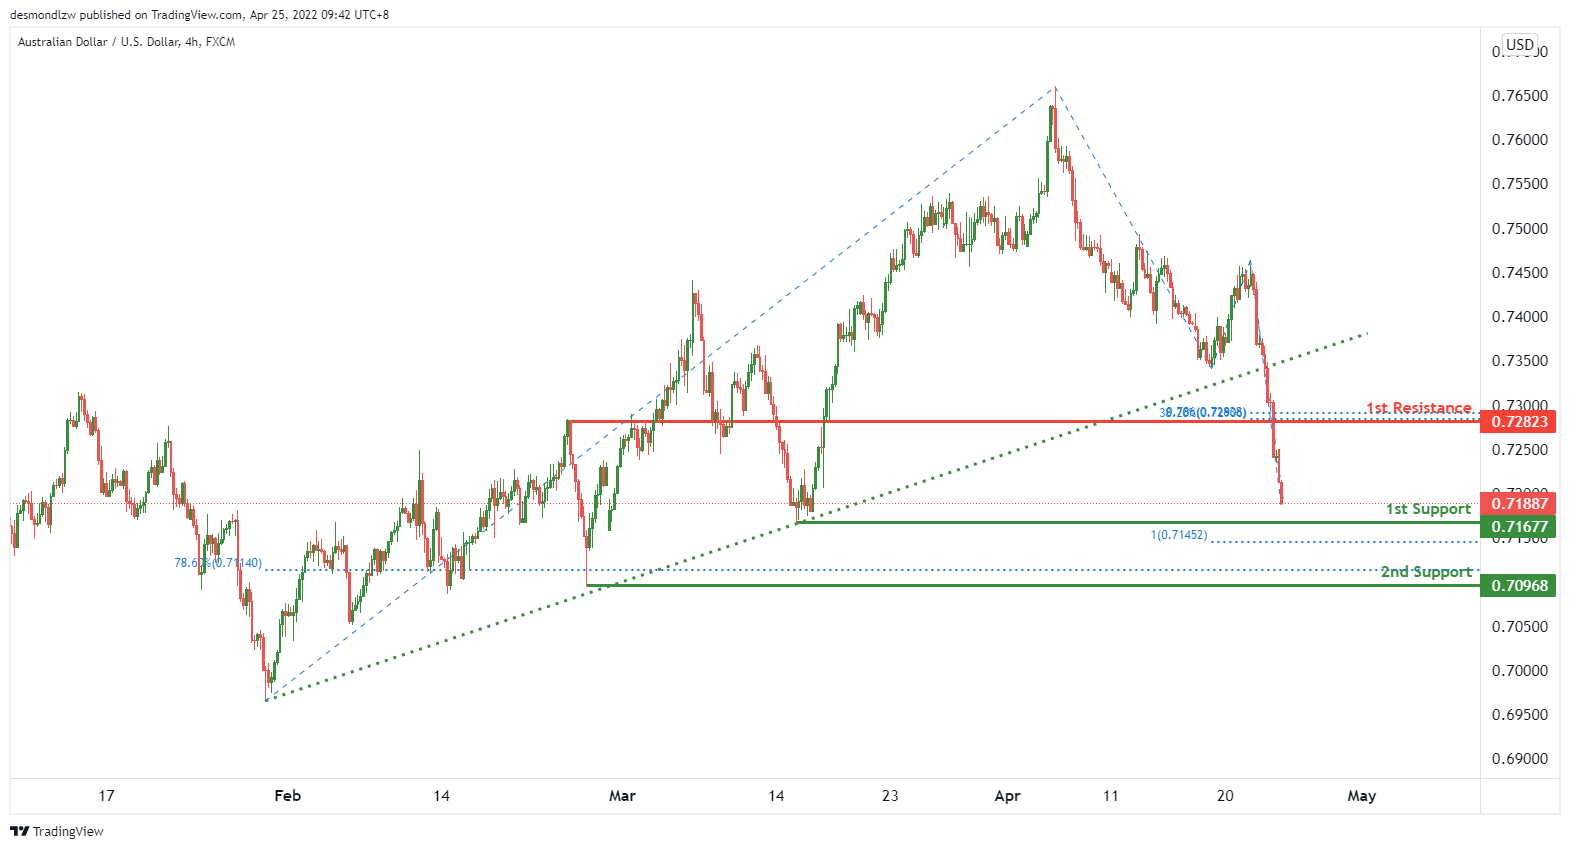
On the H4 timeframe, price is near the key support level, We see the potential of a bullish bounce from 1st support level of 0.71677 in line with 100% fibonacci projection towards the 1st resistance level of 0.72823 in line with 38.2% fibonacci retracement and 78.6% fibonacci projection. Otherwise, price might break the key support level to trigger a dip towards the 2nd support of 0.70968 which is in line with 78.6% fibonacci retracement.
Areas of consideration
- H4 1st resistance at 0.72823
- H4 1st support at 0.71677
- H4 2nd support at 0.70968
NZD/USD:
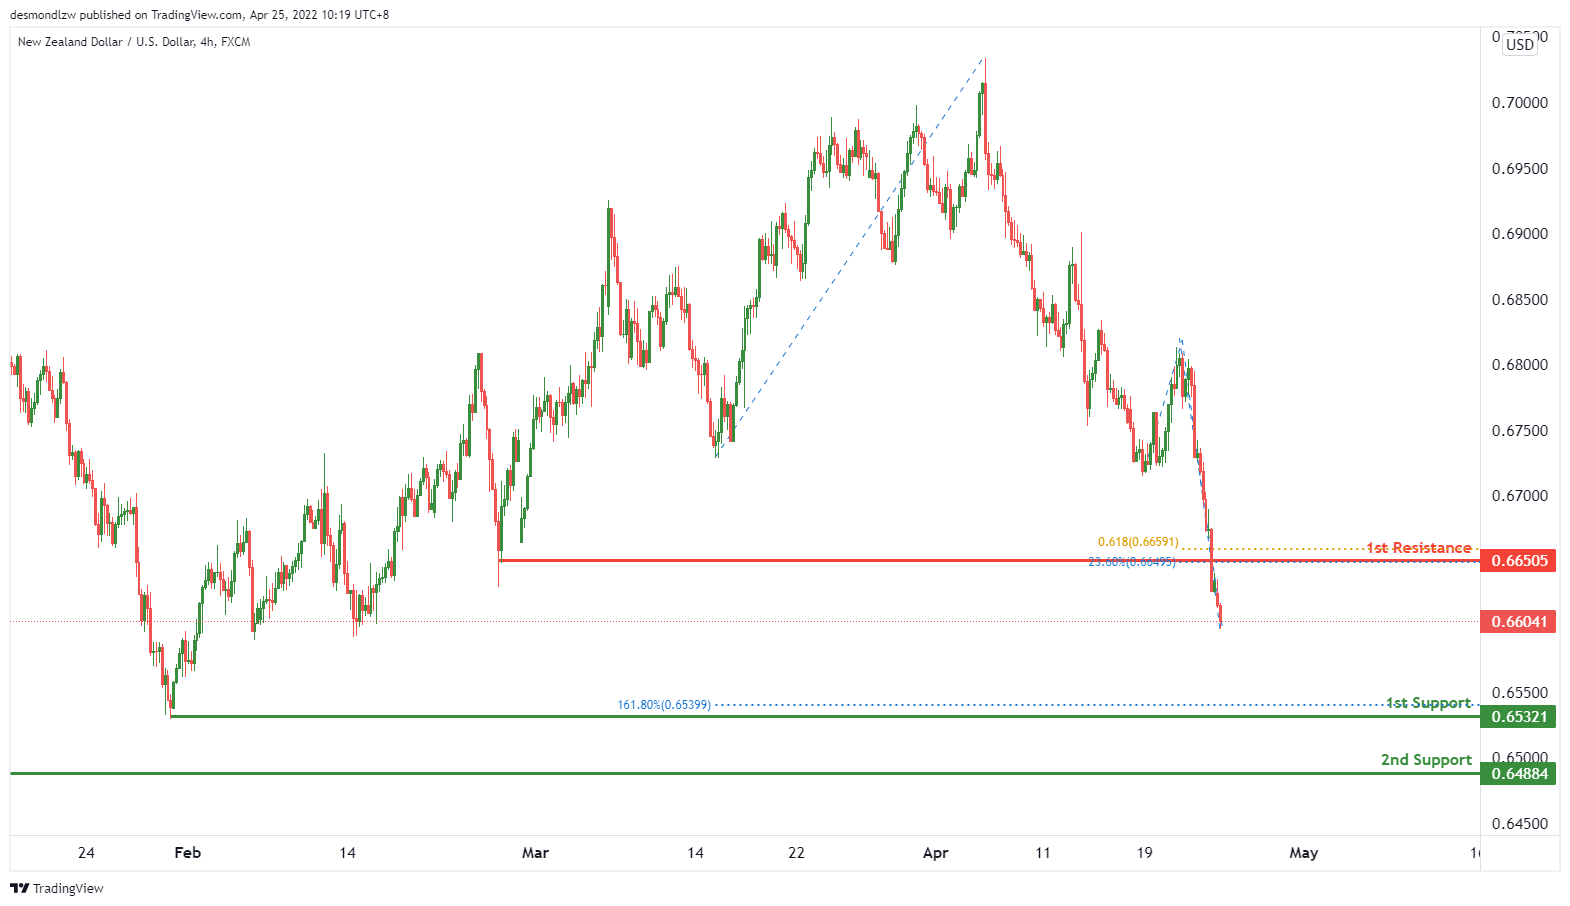
On the H4, we see the potential of bullish bounce from 1st support level of 0.65321 in line up with 161.8% fibonacci extension towards the 1st resistance level of 0.66505 in line with 23.6% fibonacci retracement and 61.8% fibonacci projection.
Areas of consideration:
- H4 time frame, 1st support at 0.65321
- H4 time frame, 1st resistance at 0.66505
- H4 time frame, 2nd support at 0.64884
USD/CAD:
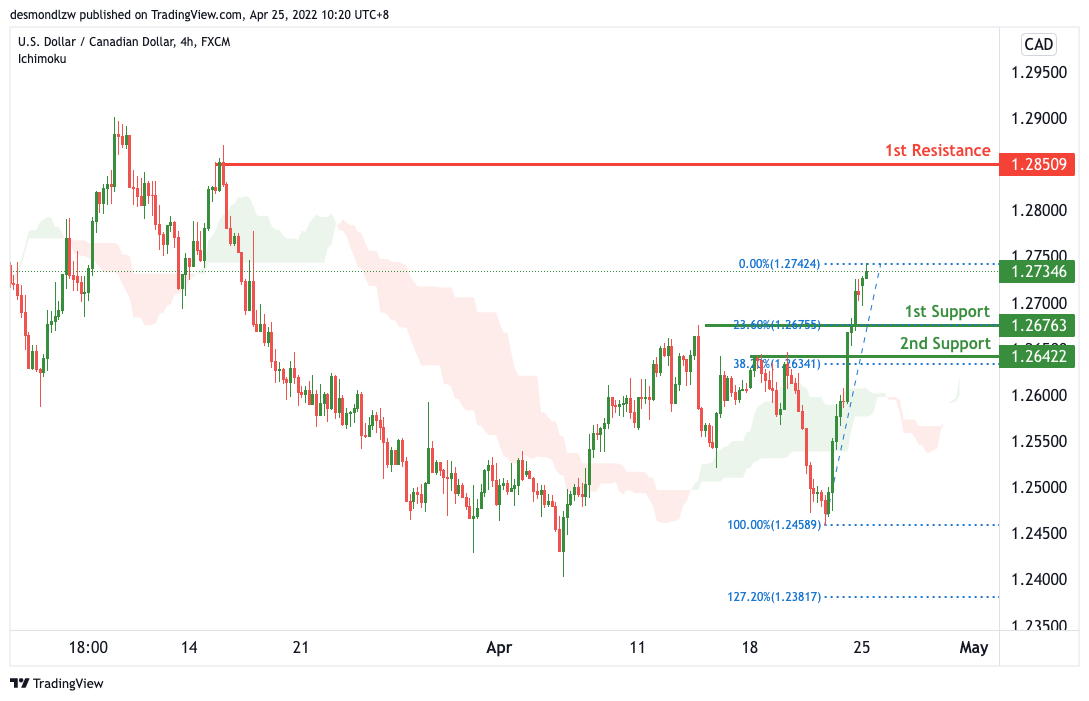
On the H4, with price moving above the ichimoku cloud, we have a bullish bias that price will rise to our 1st resistance at 1.28509 where the swing high resistance is from our 1st support at 1.26763 in line with the horizontal pullback support and 23.6% Fibonacci retracement. Alternatively, price may break 1st support structure and head for 2nd support where the horizontal pullback support and 38.2% Fibonacci retracement is.
Areas of consideration:
- H4 time frame, 1st resistance at 1.28509
- H4 time frame, 1st support at 1.26763
OIL:
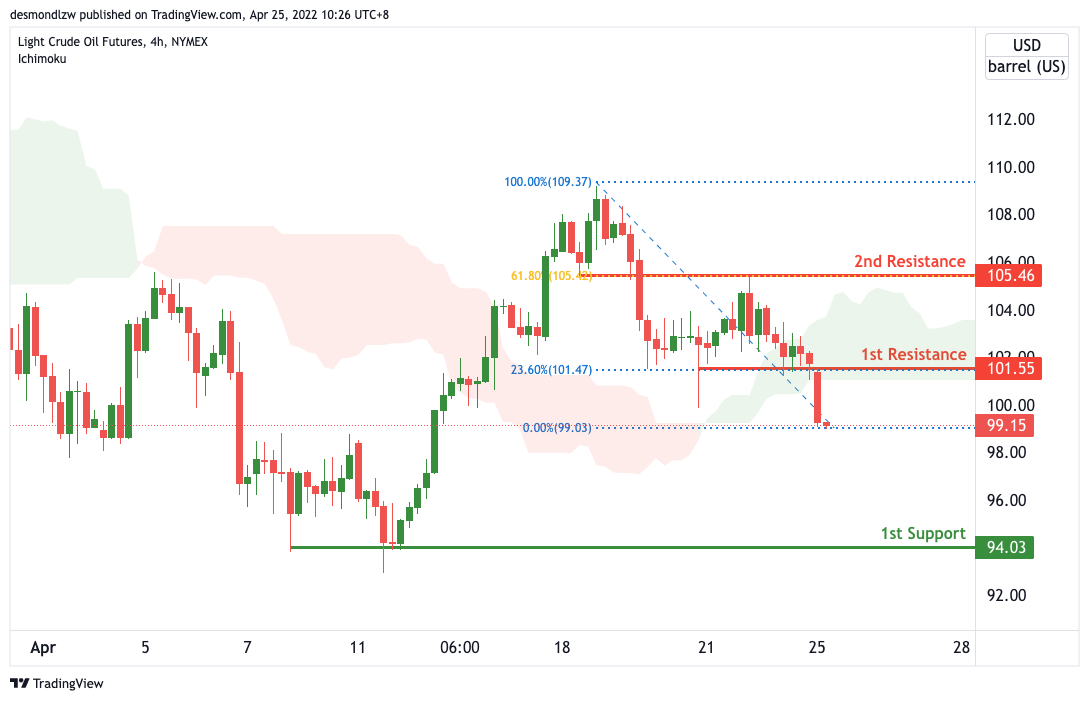
On the H4, with price moving below the ichimoku cloud, we have a bearish bias that price will drop from our 1st resistance at 101.55 where the pullback resistance and 23.6% Fibonacci retracement is to our 1st support at 94.03 in line with the horizontal swing low support. Alternatively, price may break 1st resistance structure and head for 2nd resistance where the horizontal pullback support and 61.8% Fibonacci retracement at 105.46.
Areas of consideration:
- H4 time frame, 1st resistance of 101.55
- H4 time frame, 1st support of 94.03
Dow Jones Industrial Average:
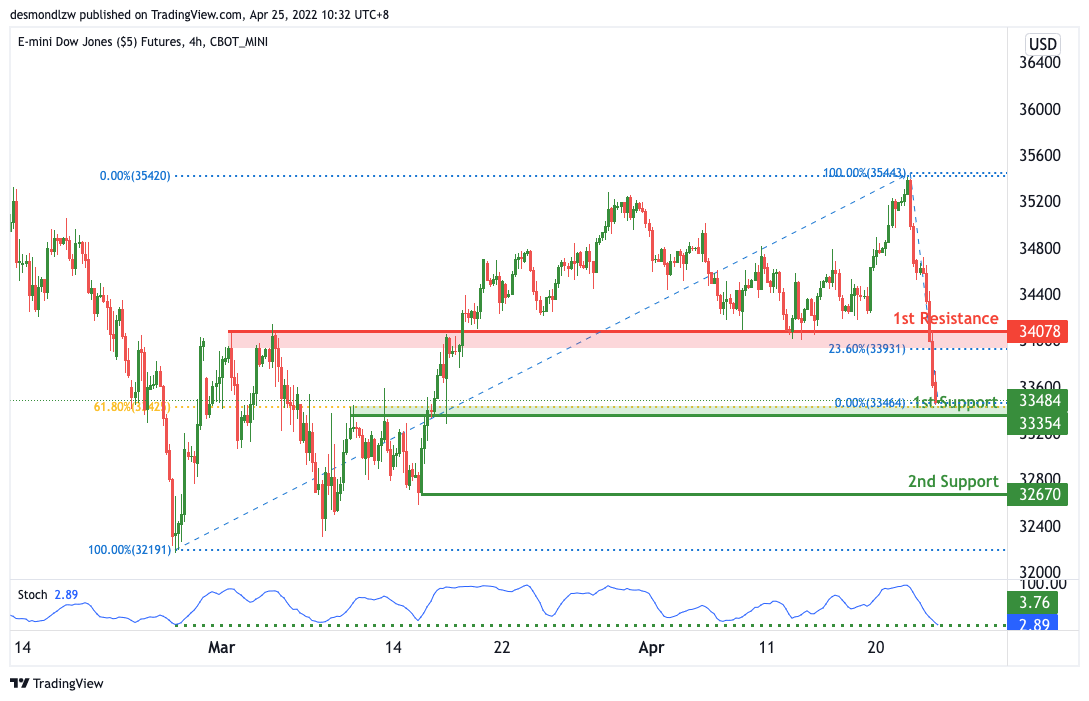
On the H4, with price moving above the ichimoku cloud, we have a bullish bias that price will rise to our 1st resistance at 34078 where the overlap resistance is from our 1st support at 33354 in line with the horizontal pullback support and 61.8% Fibonacci retracement. Alternatively, price may break 1st support structure and head for 2nd support where the horizontal swing low support is at 32670.
Areas of consideration :
- H4 time frame, 1st resistance at 34078
- H4 time frame, 1st support at 33354
Ethereum breaking down, bitcoin to follow
Ethereum follows broad based risk-off sentiment lower today and dips to as low as 2838.30 so far. The development is in-line with the view that corrective pattern from 2157.05 has completed with three waves up to 3577.70. Further decline is now expected as long as 3177.25 resistance holds.
Sustained break of near term channel support, and then 2490.05 support, should sent the stage for resumption of whole down trend form 4863.75. Next target is 61.8% projection of 4863.75 to 2157.04 from 3577.70 at 1804.95.
Similarly, bitcoin should follow and break through 38539 support soon, to resume the decline from 48226. Further break of 37550 support should set the stage for resumption of down trend from 68986. Next target is 61.8% projection of 68986 to 33000 from 48226 at 25986.
WTI crude oil falls on concern of Beijing lockdown
WTI crude oil falls notably in Asian session, following general risk-off sentiment. It's reported that more than a dozen of buildings are now also under lockdown the largest district of Chaoyang in Beijing, China's capital. That raised concerns that Beijing could be put under tough and continued lockdown like Shanghai soon, which would then weigh further on oil demand.
WTI crude oil is seen as in the fifth leg of a triangle corrective pattern which started at 131.82, back in early March. Deeper fall should be seen in the near term towards lower side of the pattern at 93.47. A breach of that level could be seen but it should be relatively brief, and contained above key support level at 85.92.
The main question is that after the corrective pattern completes, whether the next rally could break through 131.82 high. But in any case, the next rise should be the last in current up trend and should then set up a medium term corrective phase which lasts much longer.