

Sample Category Title
GBP/JPY Weekly Outlook
GBP/JPY rose further to 168.40 last week but formed a temporary top there and retreated. Initial bias remains neutral this week for consolidations. Downside of retreat should be contained above 159.02 support to bring another rally. On the upside, firm break of 168.40 will resume larger up trend.
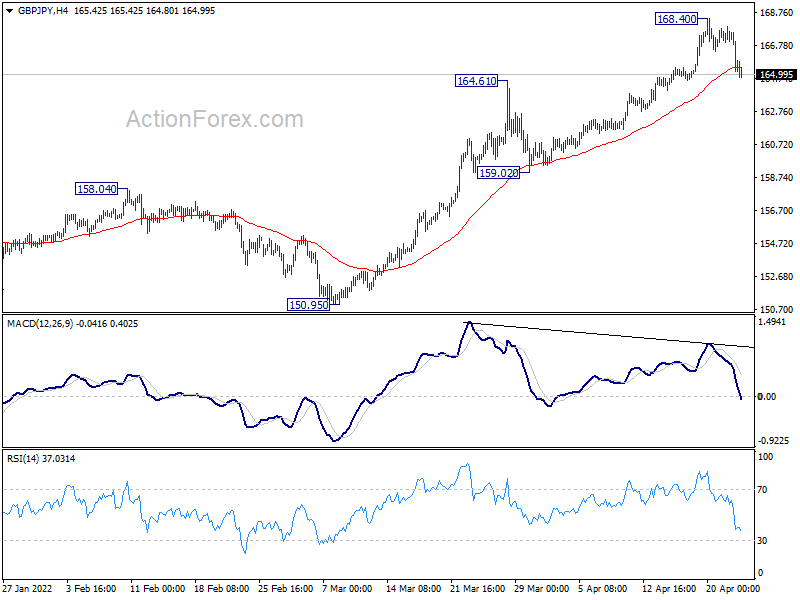
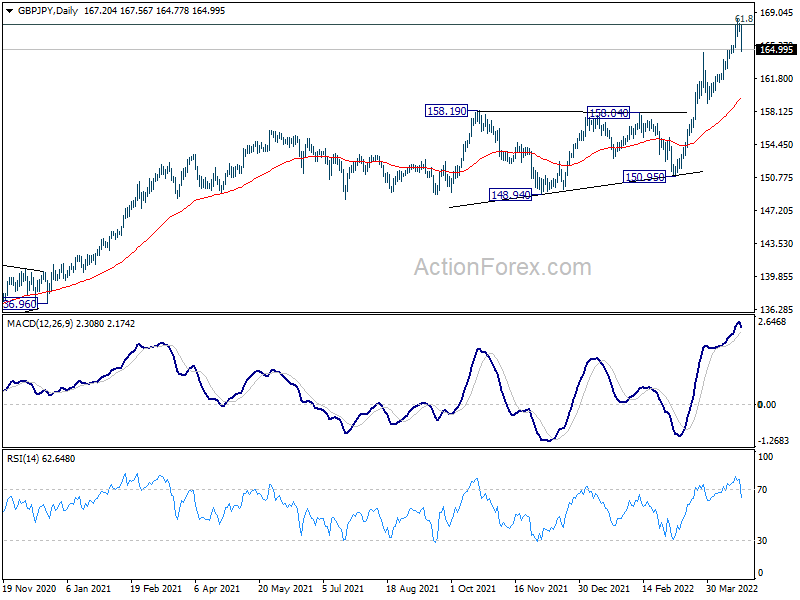
In the bigger picture, up trend from 123.94 (2020 low) is still in progress. Sustained break of 61.8% retracement of 195.86 (2015 high) to 122.75 (2016 low) at 167.93 will be a long term bullish signal, and could pave the way back to 195.86 high. This will now remain the favored case as long as 150.95 support holds, even in case of deep pull back.
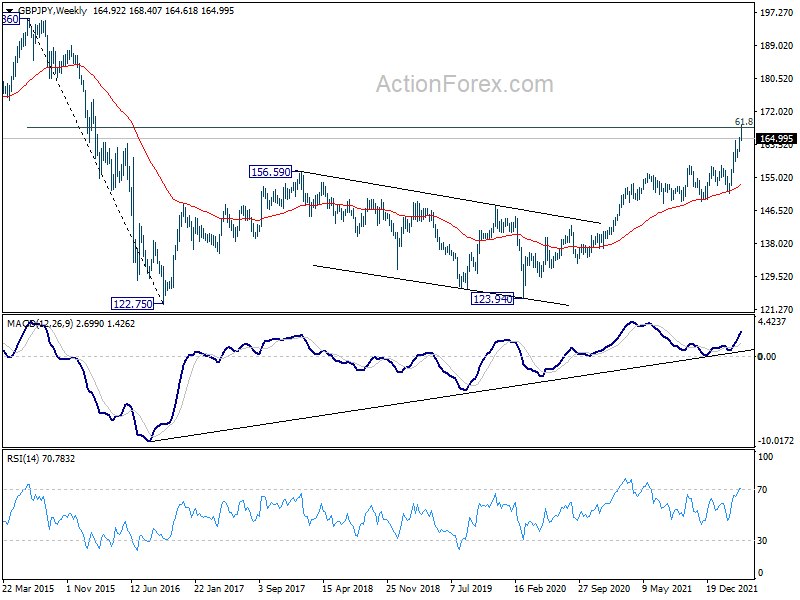
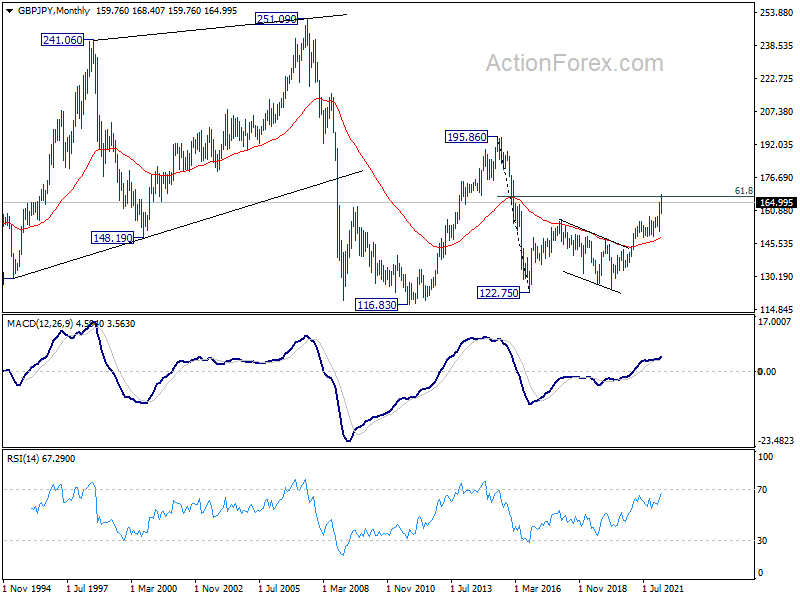
In the longer term picture, rise from 122.75 could be the third leg the the pattern from 116.83 (2011 low). Further rise will remain in favor as long as 55 month EMA (now at 148.31) holds. Sustained break of 61.8% retracement of 195.86 to 122.75 at 167.93. will pave the way to 195.86 (2015 high).
EUR/JPY Weekly Outlook
EUR/JPY rose further to as high as 139.99 last week, but formed a temporary top there and retreated. Initial bias is neutral this week for some consolidations. Downside of retreat should be contained above 134.33 support to bring another rally. On the upside, break of 139.99 will resume larger up trend to 144.06 projection level next.
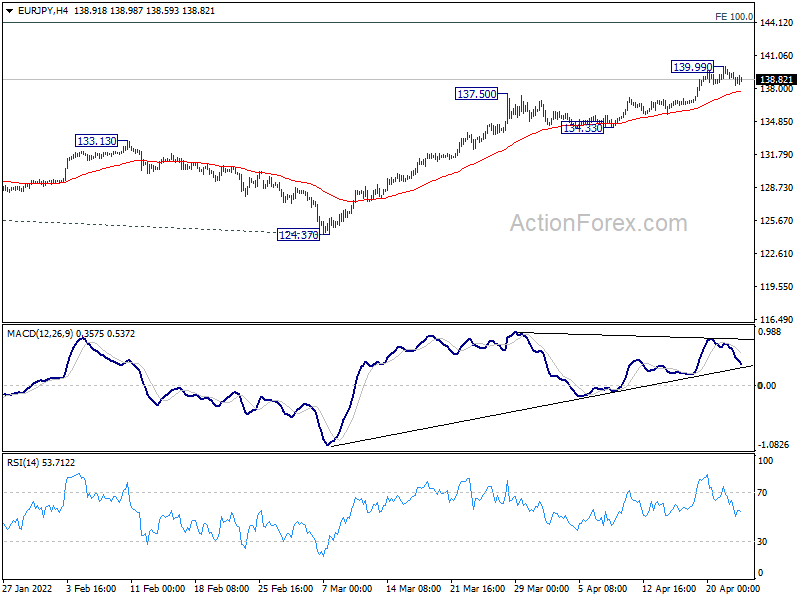
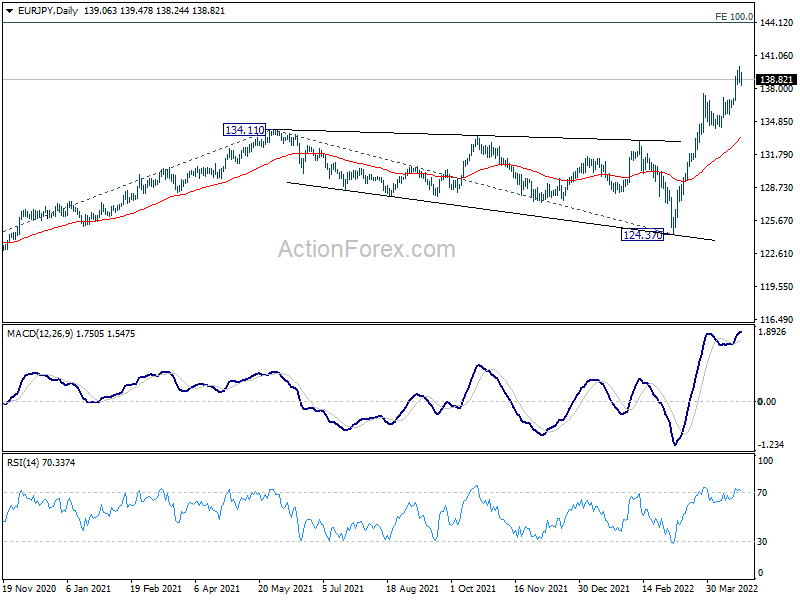
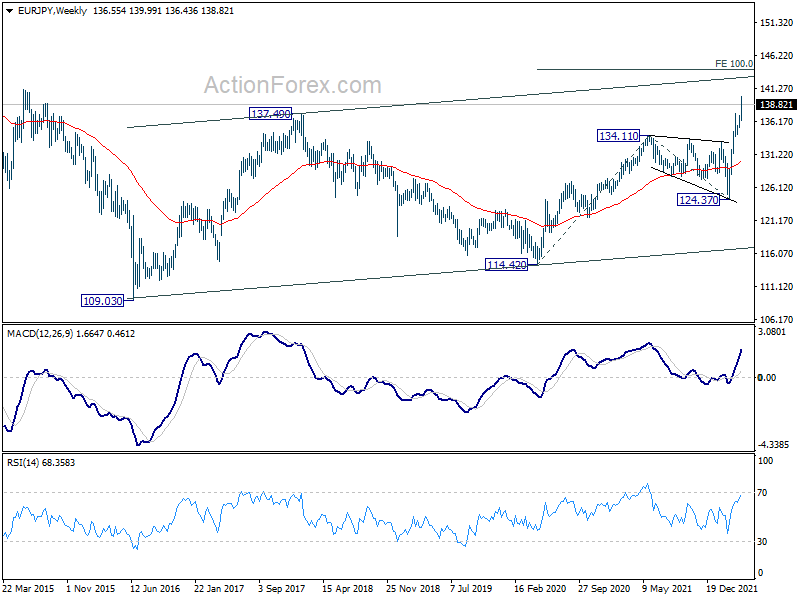
In the bigger picture, up trend from 114.42 (2020 low) is in progress. Such rise is seen as the third leg of the pattern from 109.30 (2016 low). Next target will be 100% projection of 114.42 to 134.11 from 124.37 at 144.06. In any case, outlook will now remain bullish as long as 124.37 support holds, in case of deep pull back.
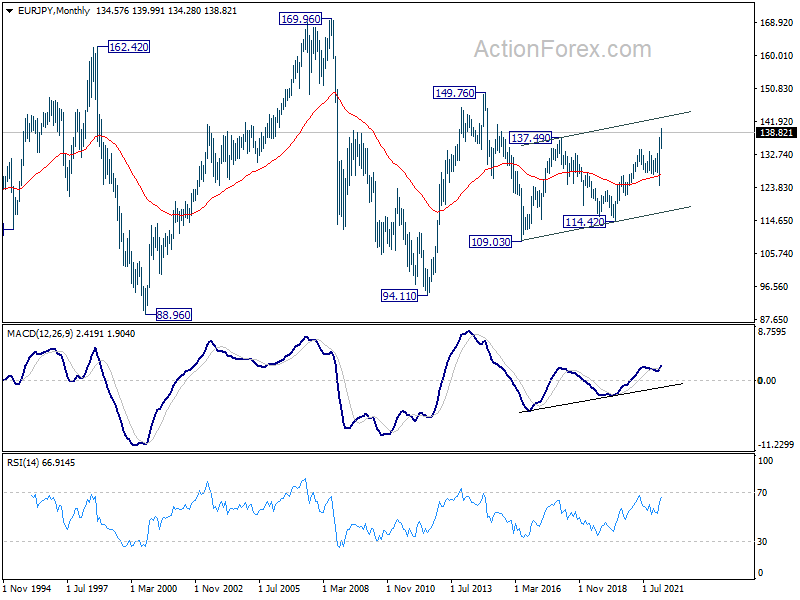
In the long term picture, focus stays on 137.49 resistance (2018 high). Sustained break there will raise the chance that whole rise from 94.11 (2012 low) is resuming through 149.76 resistance. This will be a slightly favored case for now, as long as 124.37 support holds.
EUR/GBP Weekly Outlook
EUR/GBP's strong rebound last week suggests that pull back from 0.8511 has completed at 0.8428 already. Initial bias is back on the upside this week for 0.8511 resistance. Further break of 0.8511 will reaffirm that 0.8201 is a medium term bottom, and target 0.8697 medium term fibonacci level next. On the downside, below 0.8307 will turn bias back to the downside for 0.8248 support instead.
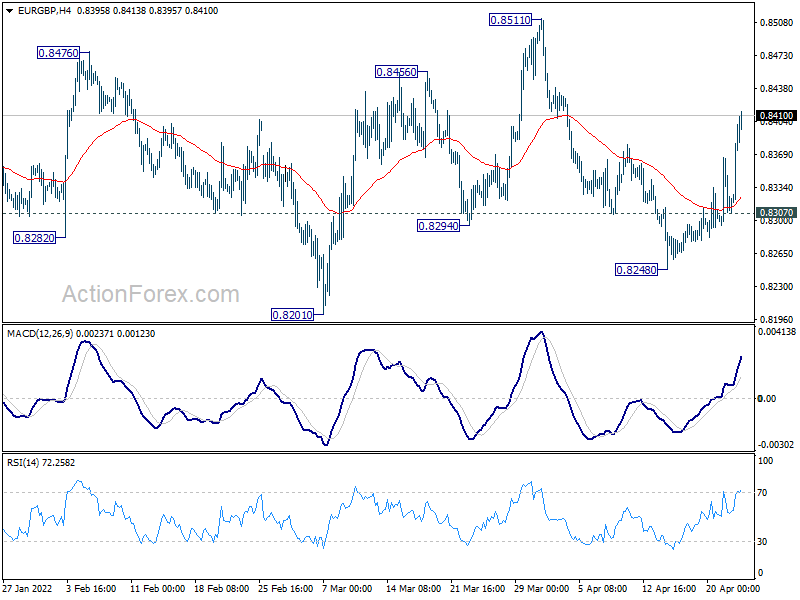
In the bigger picture, a medium term bottom could be in place at 0.8201, on bullish convergence condition in daily and weekly MACD. Rise from there could either be a correction to the down trend from 0.9499 (2020 high), or a medium term up trend itself. In either case, further rise should be seen to 38.2% retracement of 0.9499 to 0.8201 at 0.8697. Sustained break there will target 61.8% retracement at 0.9003.
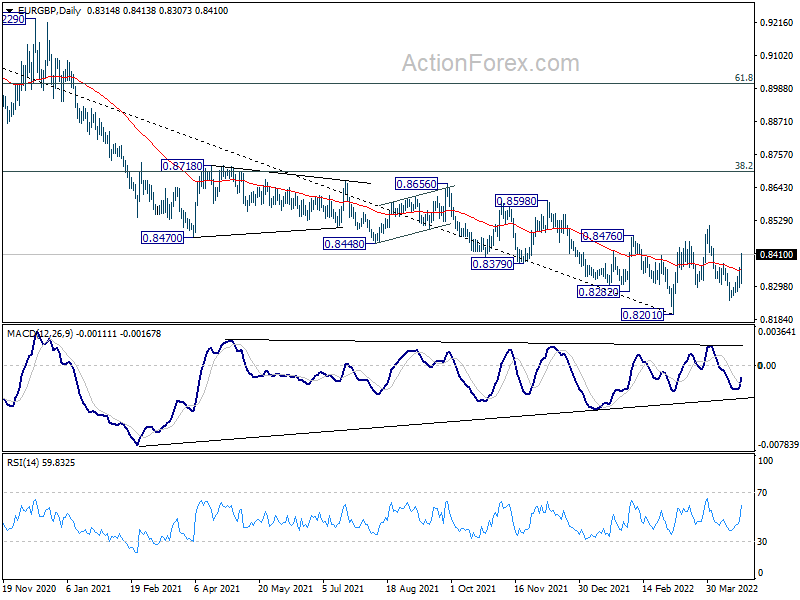
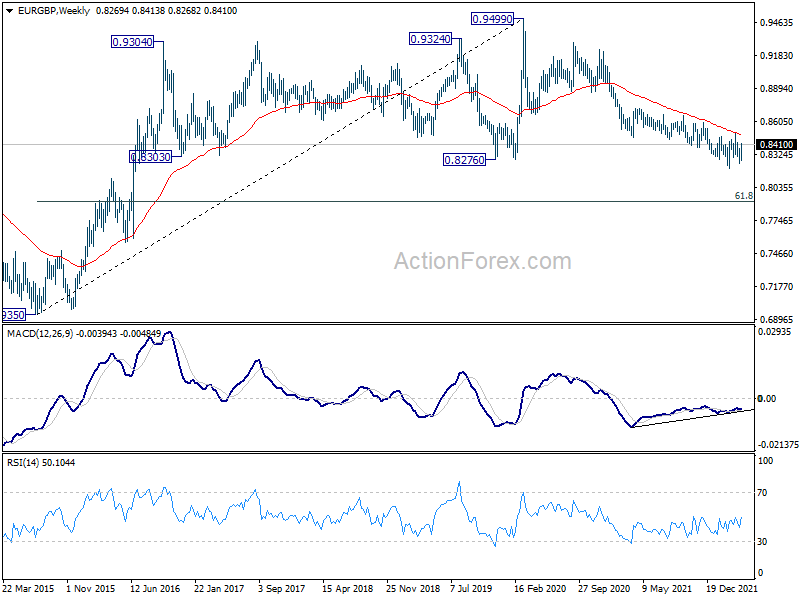
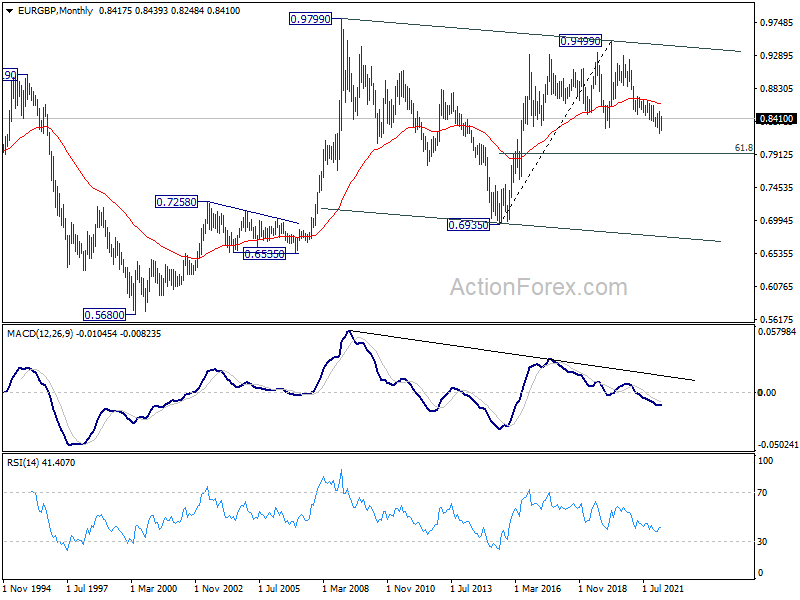
In the long term picture, current development argues that fall from 0.9499 is probably the third leg of the pattern from 0.9799 (2008 high). Sustained break of 61.8% retracement of 0.6935 to 0.9499 at 0.7917 will pave the way back to 0.6935 (2015 low) and probably below.
EUR/AUD Weekly Outlook
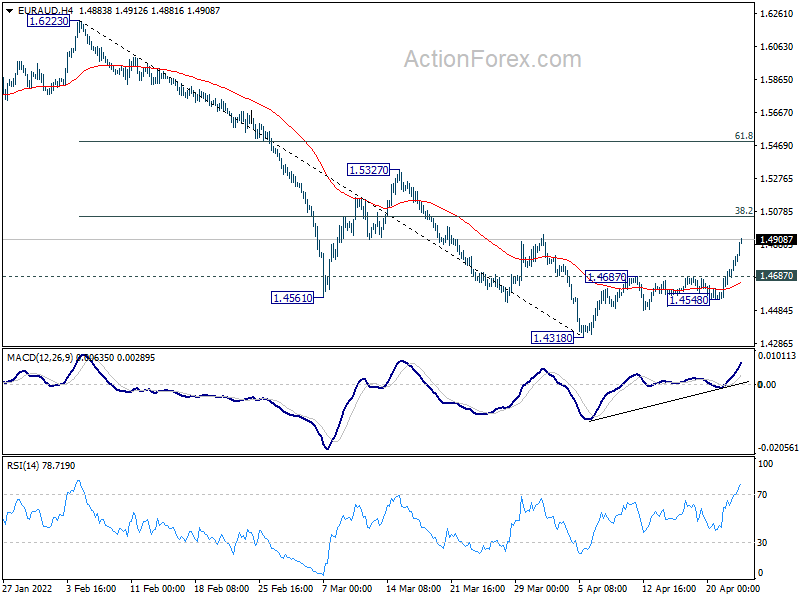
EUR/AUD's rebound from 1.4318 accelerated higher last week. The development suggests that it's now already corrective whole fall from 1.6223. Initial bias is mildly on the upside this week for 38.2% retracement of 1.6223 to 1.4318 at 1.5046. On the downside, below 1.4687 minor support will turn bias back to the downside for retesting 1.4318 instead.
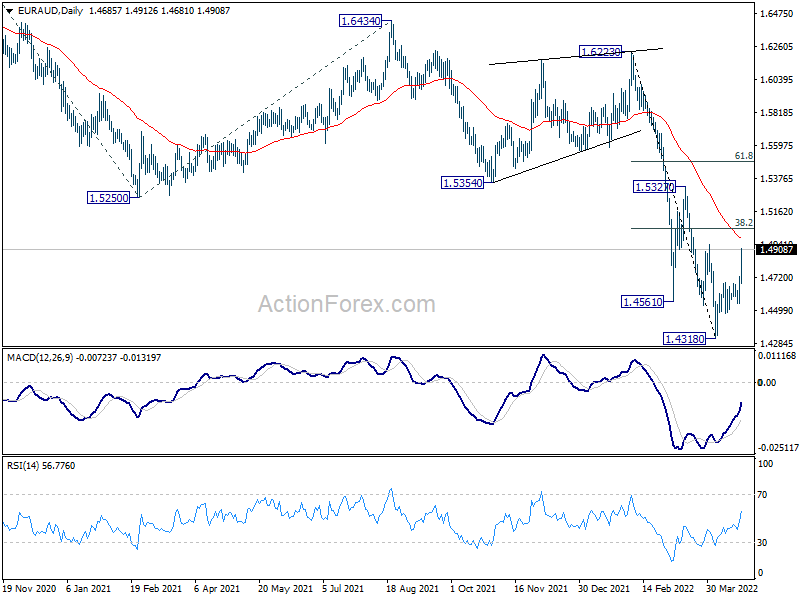
In the bigger picture, fall from 1.9799 is seen as a long term impulsive move. Next target is 61.8% projection of 1.9799 to 1.5250 from 1.6434 at 1.3623, which is close to 1.3624 long term support (2017 low). Some support could be seen there to bring interim rebound. But overall, break of 1.5354 support turned resistance is needed to be the first sign of medium term bottoming. Otherwise, outlook will stay bearish in case of recovery.
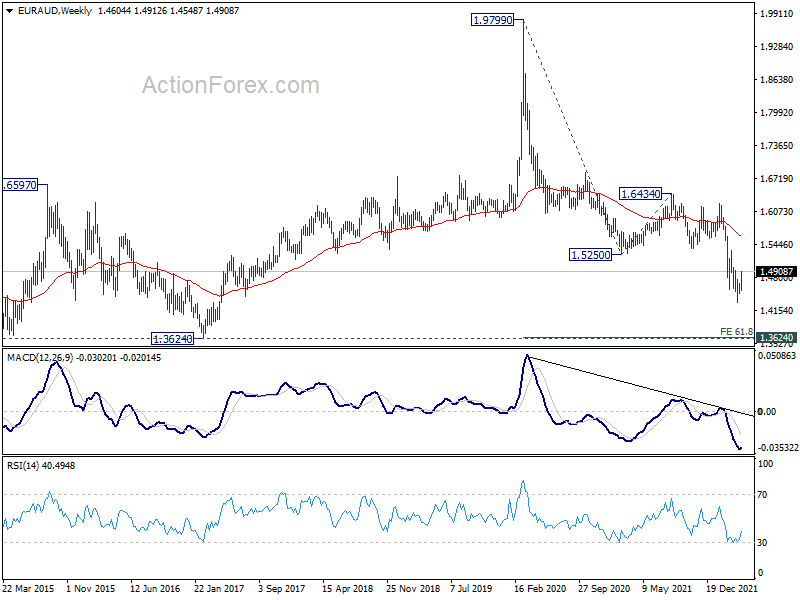
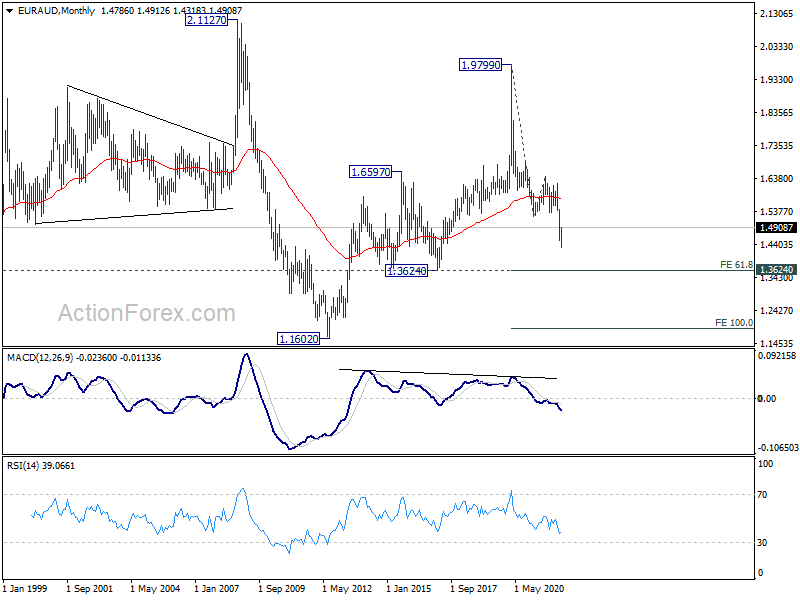
In the longer term picture, fall from 1.9799 (2020 high) is seen as the third leg of the pattern from 2.1127 (2008 high). Deeper fall should be seen to 1.3624 support. Decisive break there would pave the way back to 1.1602 (2012 low).
EUR/CHF Weekly Outlook
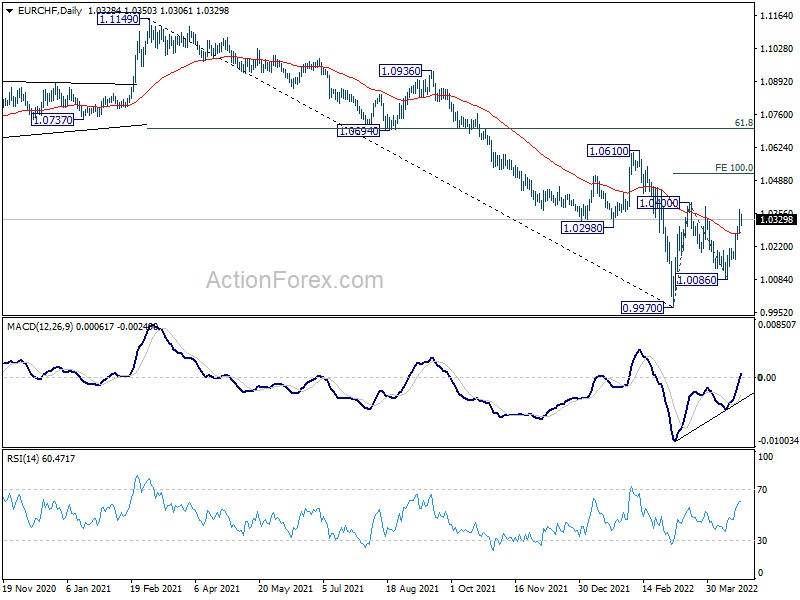
EUR/CHF's rebound from 1.0086 extended higher last week. The development suggests that pull back from 1.0400 has completed, and rise from 0.9970 is ready to resume. But as a temporary top was formed at 1.0369, initial bias is neutral this week first. On the upside, firm break of 1.0400 will target 100% projection of 0.9970 to 1.0400 from 1.0086 at 1.0516. On the downside, break of 1.0246 minor support will dampen this bullish view and turn bias back to the downside for 1.0086 support instead.
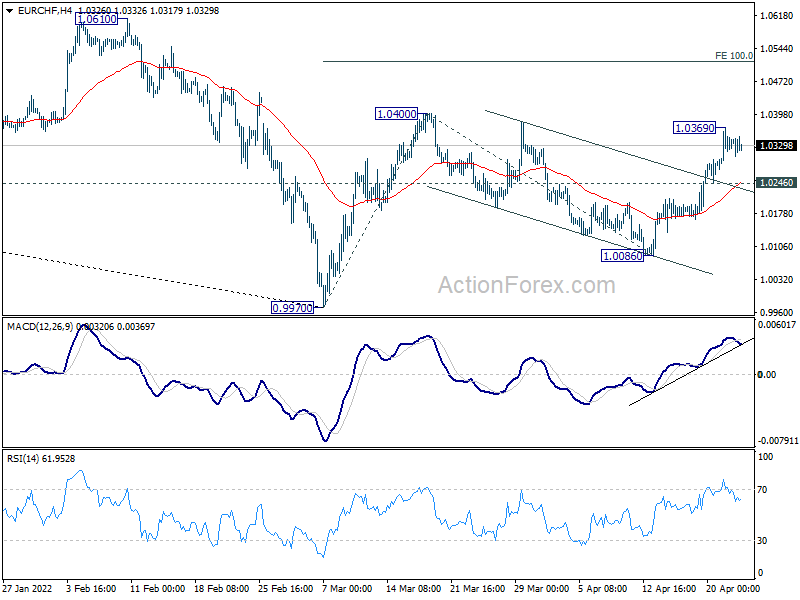
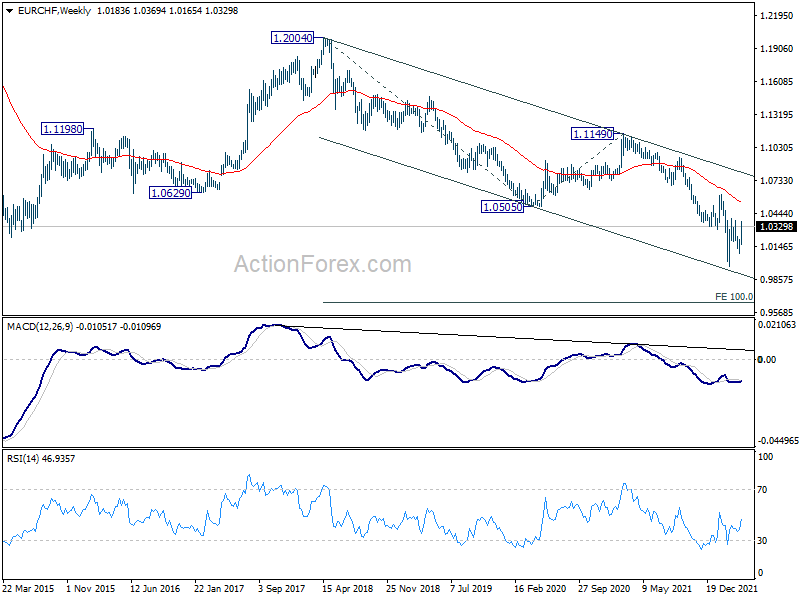
In the bigger picture, long term down trend from 1.2004 (2018 high) is still in progress. Next target is 100% projection of 1.2004 to 1.0505 to 1.1149 at 0.9650. In any case, sustained break of 1.0505 support turned resistance (2020 low) is needed to be the first sign of medium term bottoming. Otherwise, outlook will remain bearish.
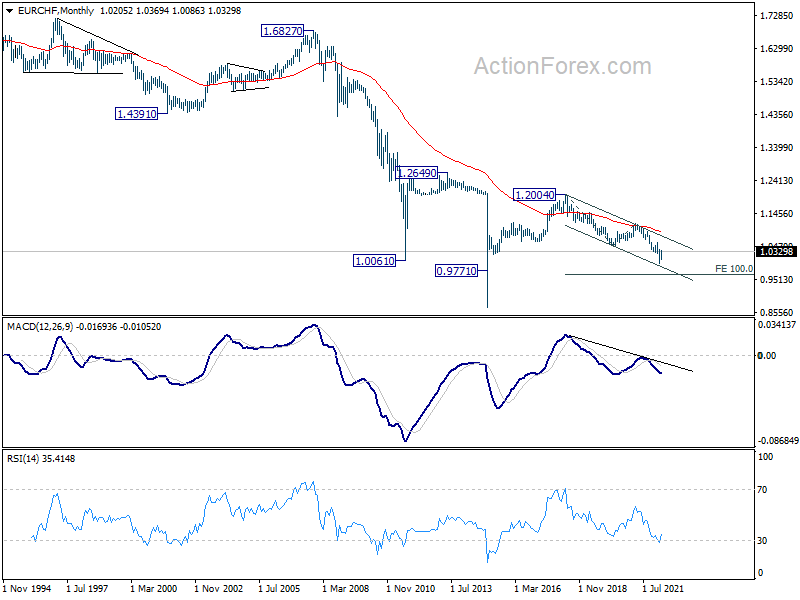
In the long term picture, capped below 55 month EMA, EUR/CHF is seen as extending the multi-decade down trend. There is no prospect of a bullish reversal until some sustained trading above the 55 month EMA (now at 1.0891).
Dollar Powered Up, Fed to Hike 50bps in May and 75bps in Jun?
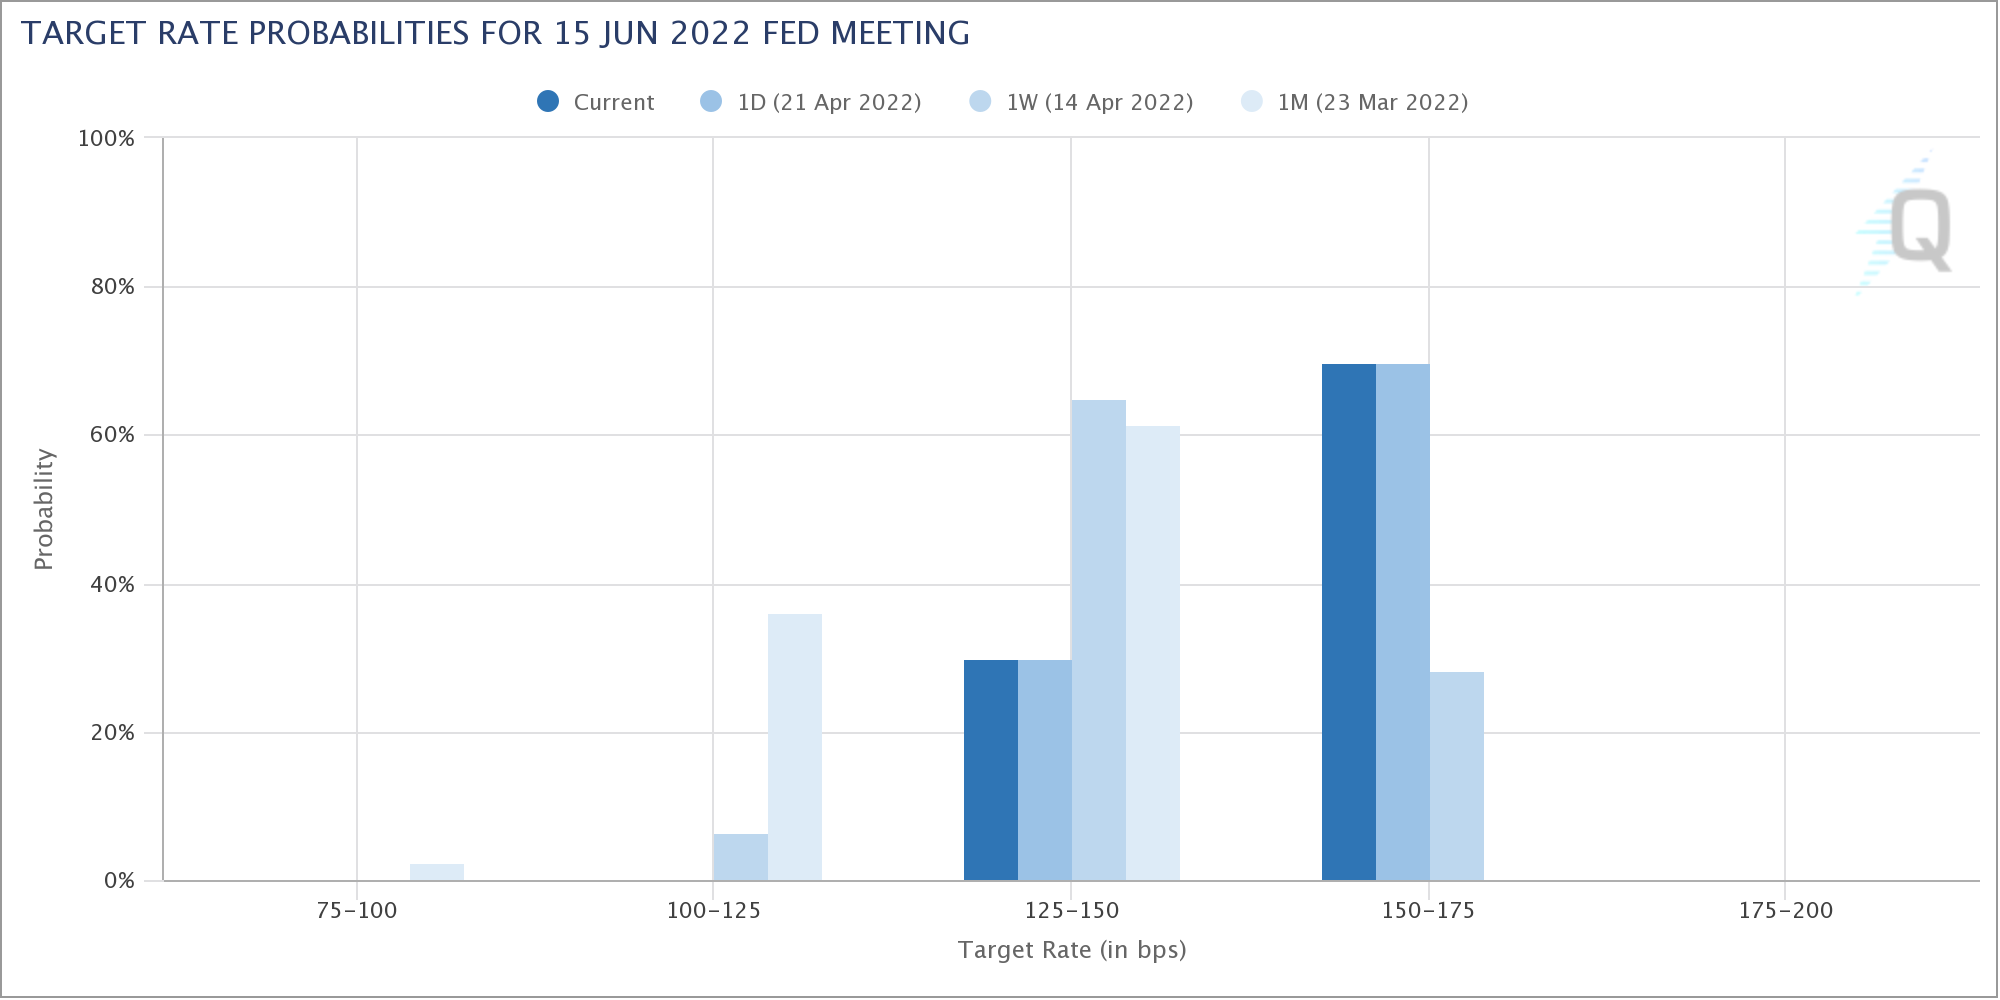
Speculations on aggressive Fed tightening intensified sharply last week after a chorus of hawkish comments from policy markets. Markets are indeed pricing in near 70% chance of federal funds rate at 1.50-1.75% by the end of first half, i.e., 125bps above current level. Stocks tumbled sharply towards the end, with DOW suffering the worst day since 2020 on Friday.
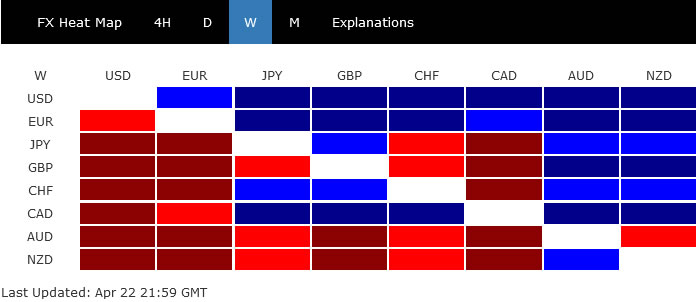
In the currency markets, Dollar ended broadly higher as the best performer, as supported by both Fed expectations and risk aversion. Euro was the second strongest after some ECB members talked up the chance of a July rate hike. Commodity Aussie and Kiwi ended as the biggest losers. Yen consolidated in tight range while European majors and Loonie were mixed.
Fed to hike 50bps in May, then 75bps in June?
There should be a consensus among Fed policymakers on the need to "front-load" some of the rate hikes, to "expedite" to neutral. Whether interest will end up at 2.50% or 3.50% by the end of the year will very much depends on incoming data and developments. But the rate hikes should come in faster and earlier.
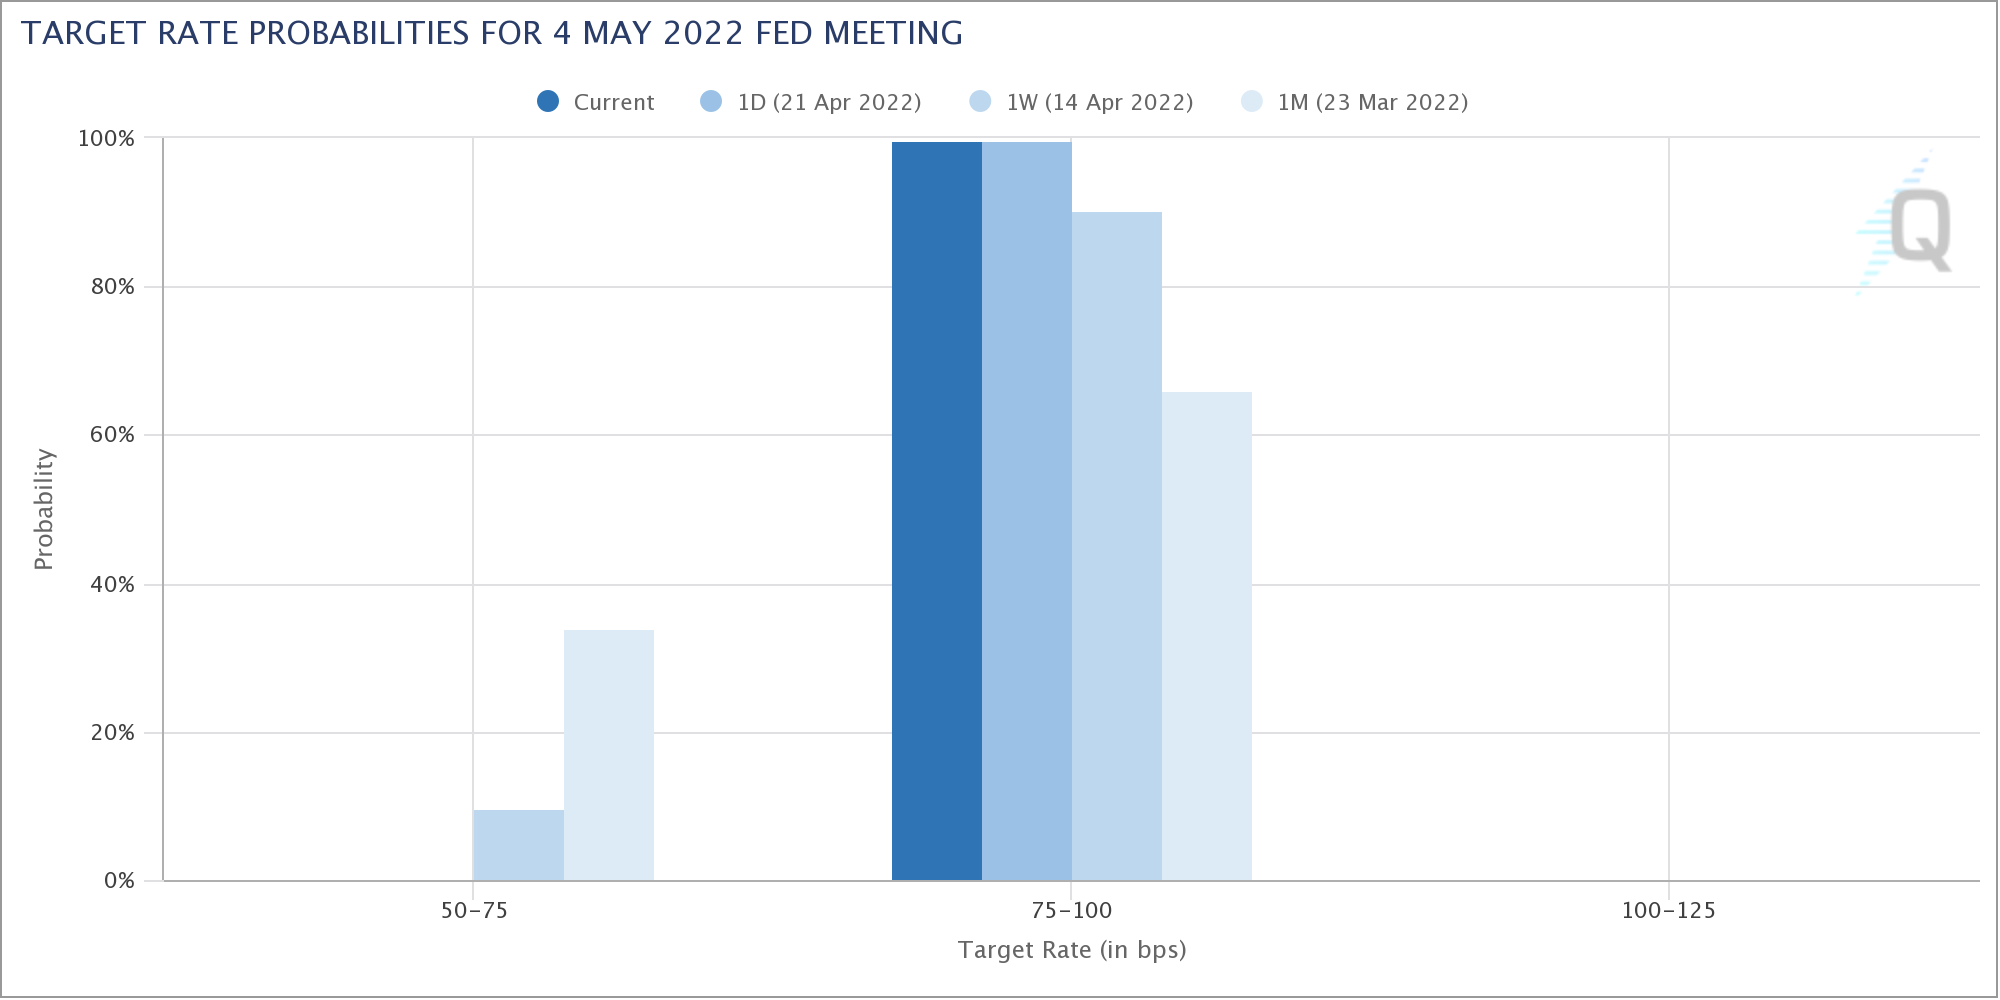
Traders added to their bets on a 50bps rate hike by Fed in May, after even Chair Jerome Powell said it's "on the table". Fed fund futures are now pricing in 99.6% chance of that, bring interest rate to 0.75-100%, comparing to 66% a month ago.
But more importantly, markets are pricing in near 70% chance of interest rate ending at 1.50-1.75% after June meeting (comparing to 0% a month ago). That is, traders are betting on a 75 bps rate hike at the June meeting. That's pretty aggressive.
S&P 500 to extend medium term correction through 4000 handle
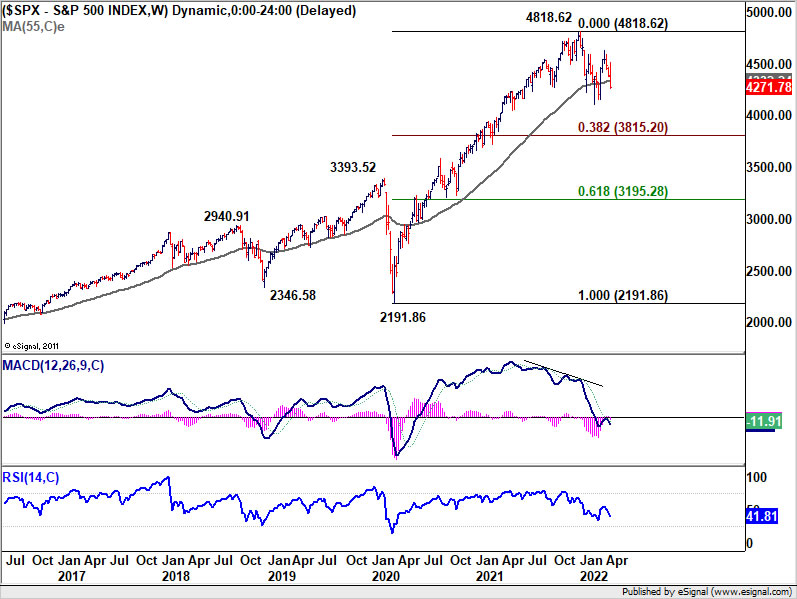
US stocks tumbled sharply towards the end of last week, as investors finally reacted to the speculations of aggressive Fed tightening. The development in S&P 500 suggest that rebound from 4115.65, as the second leg of the corrective pattern from 4818.62, has completed at 4637.30 already.
The corrective pattern is now in its third leg. Further decline should be seen through 4114.65 low to 100% protection of 4818.62 to 4114.65 from 4637.30 at 3933.32, i.e, slightly below 4000 handle. This will remain the favored case as long as 55 day EMA (now at 4449.41) holds.
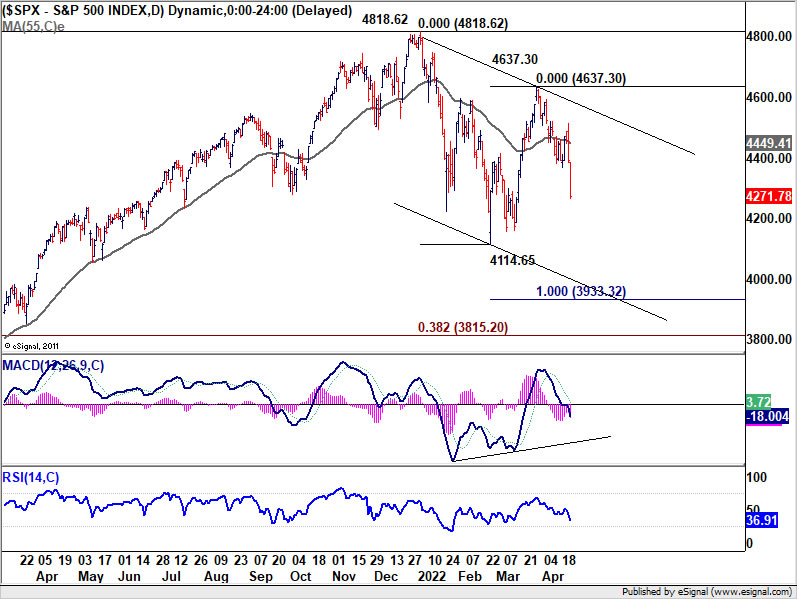
But it should be emphasized that overall outlook isn't too bearish. Price actions from 4818.62 are seen as correcting the up trend from 2191.86 (2020 low) only. As all the supply chain issues, war, inflation fade, and with monetary policy setting back to prepandemic levels (or a bit tighter), dusts will settle. Downside of SPX's correction should be contained by 38.2% retracement of 2191.86 to 4818.62 at 3815.20 to bring rebound.
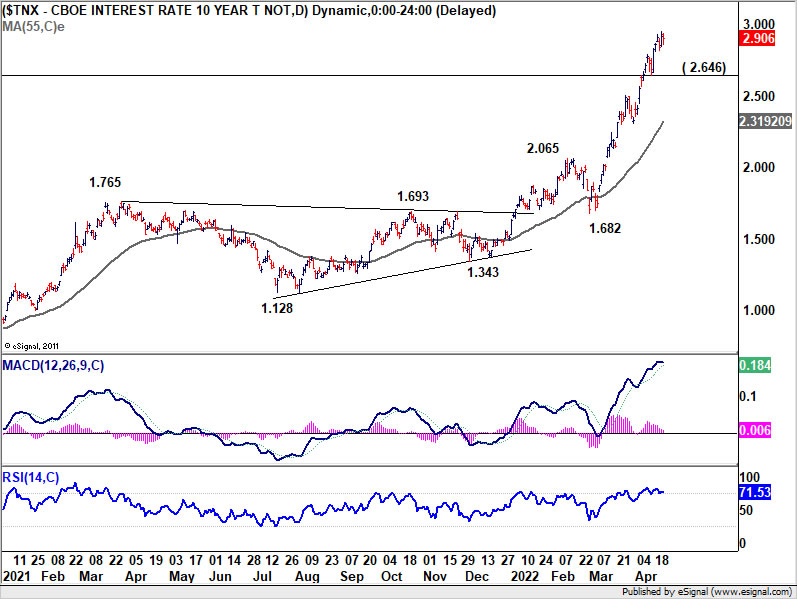
10-year yield might start to feel heavy above 3%
10-year yield extended recent up trend and closed above 2.9 handle at 2.906. While some volatility cannot be ruled out, in any case, near term outlook will remain bullish as long as 2.646 support holds. But TNX could start to feel heavy between 3.0 and 3.248 (2018 high), which could limit the upside until further development. That could, nonetheless, continue to provide support to Dollar, in particular against Yen.
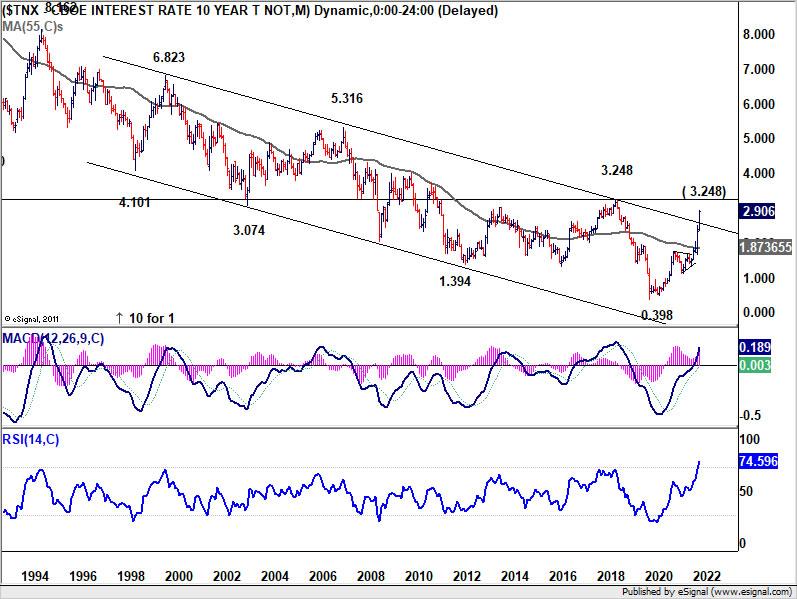
Also, it should noted again that the multi-decade channel resistance as seen in the monthly chart is considered decisive violated already. Focus is now on 3.248. Firm break there would confirm the start of a new era, of finally a long term trend of rising treasury yield and interest rates, probably accompanied by persistently strong inflation.
Dollar index done with 100 psychological level, extending up trend
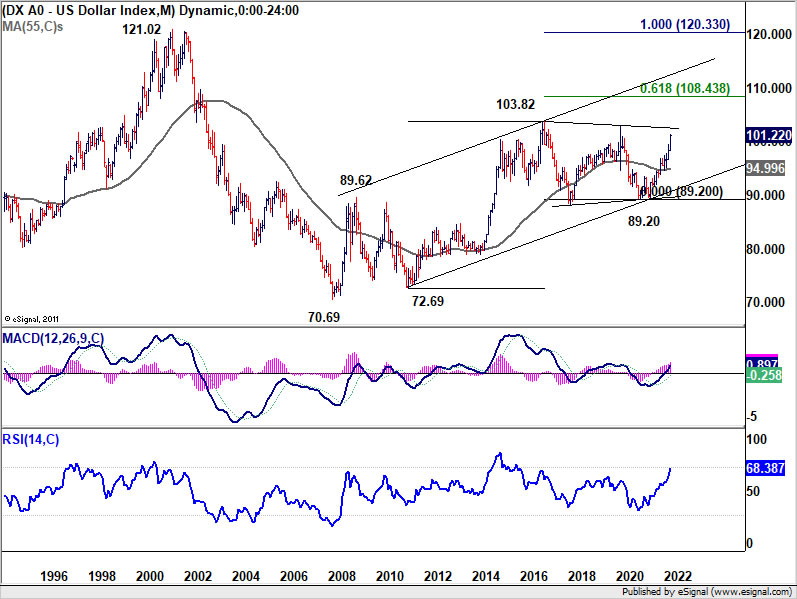
Dollar index rode on risk aversion and Fed expectations and resumed recent up trend last week. It's probably finally having the momentum to get rid of 100 handle with some conviction. In any case, outlook will stay bullish as long as 99.41 resistance turned support holds, next target is 102.99/103.82 long term resistance zone (2020 and 2016 highs respectively).
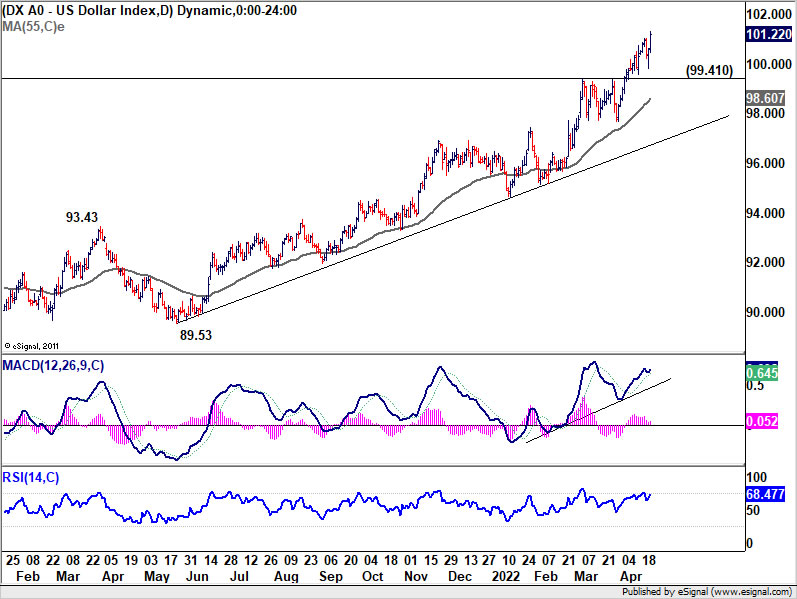
More importantly, the odds of resuming the long term up trend from 70.69 (2008 low) is building up. 102.99/103.82 could still prove to be too much for DXY for the first attempt, and a set back from there cannot be ruled out. Yet, it could be just a matter of time (from medium term perspective) that this resistance zone would be taken out. In that case, the next long term target will be 61.8% projection of 72.69 to 103.82 from 89.20 at 108.43.
NZD/USD and AUD/USD to extend medium term correction
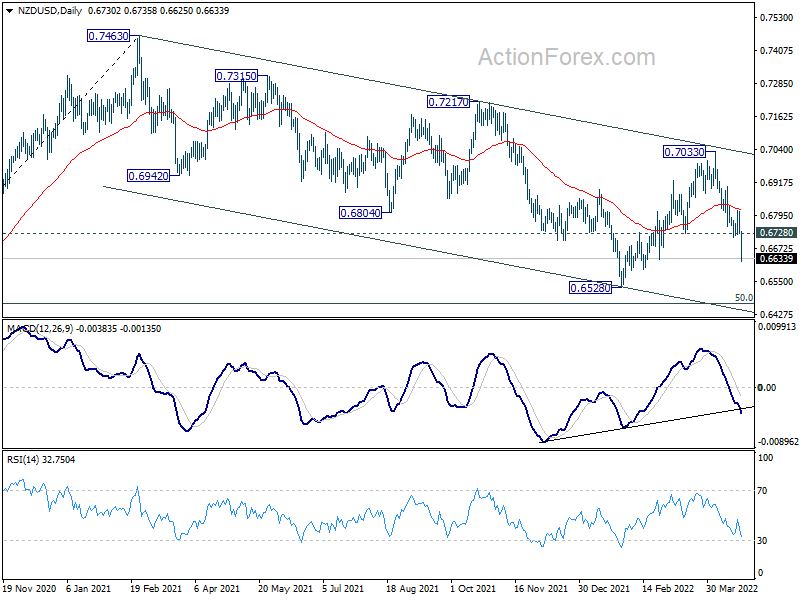
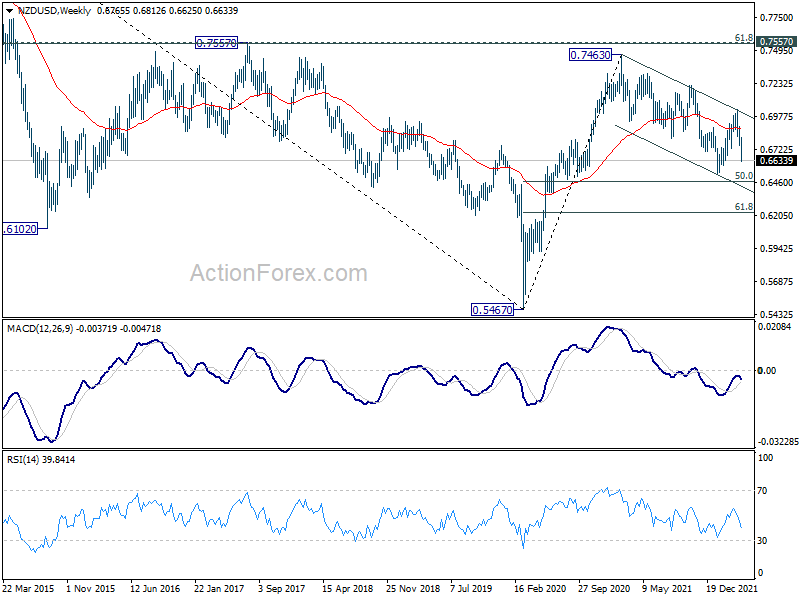
Aussie and Kiwi were the worst performers last week, suffering much from risk aversion. NZD/USD's strong break of 0.6728 support should confirm completion of rebound from 0.6528 at 0.7033, after failing medium term channel resistance. Deeper decline is expected through 0.6528 low to resume the whole decline from 0.7463.
The fall from 0.7463 is seen as a correction to up trend from 0.5467, and could complete only after breaking 50% retracement of 0.5467 to 0.7463 at 0.6465.
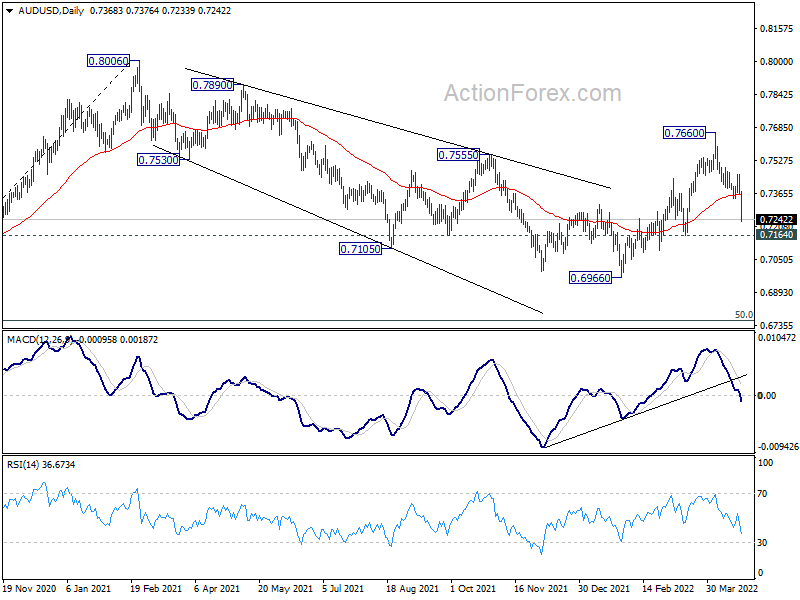
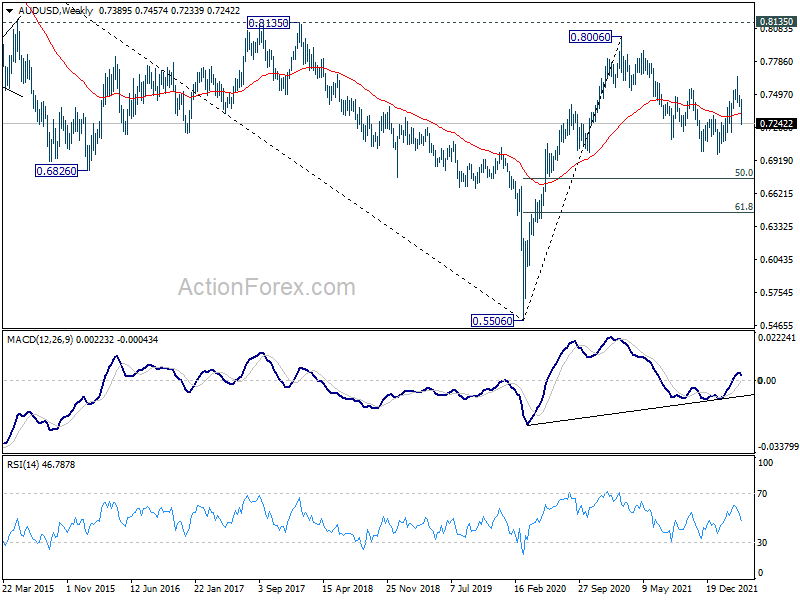
AUD/USD also tumbled sharply last week. 0.7164 structural support now looks rather shaky (considering that NZD/USD has broken corresponding level already). Break of 0.7164 will argue that the whole corrective decline from 0.8006 high is still in progress, and it's starting the third leg. Such correction could complete only after after a take on 50% retracement of 0.5506 to 0.8006 at 0.6756.
GBP/USD Weekly Outlook
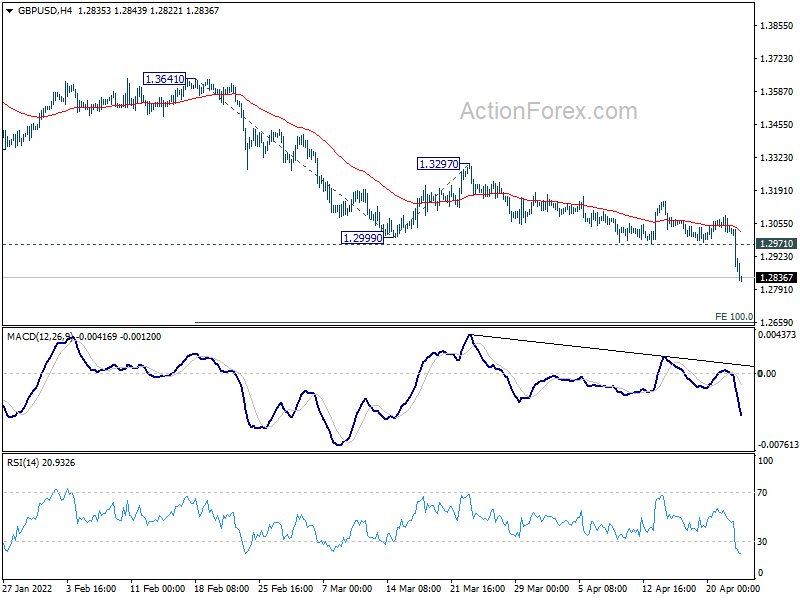
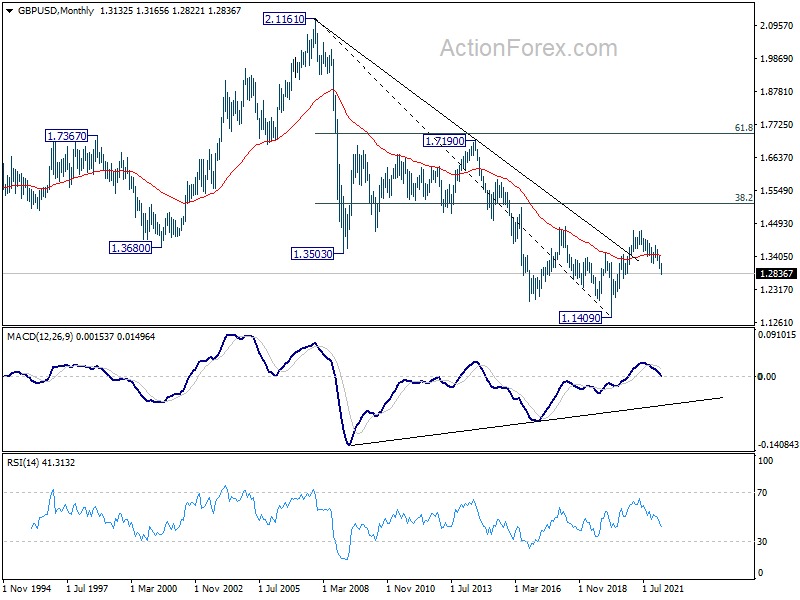
GBP/USD's down trend resumed last week and hit as low as 1.2822. Initial bias stays on the downside this week for 100% projection of 1.3641 to 1.2999 from 1.3297 at 1.2655 next. On the upside, above 1.2971 minor resistance will turn intraday bias neutral and bring consolidation first, before staging another decline.
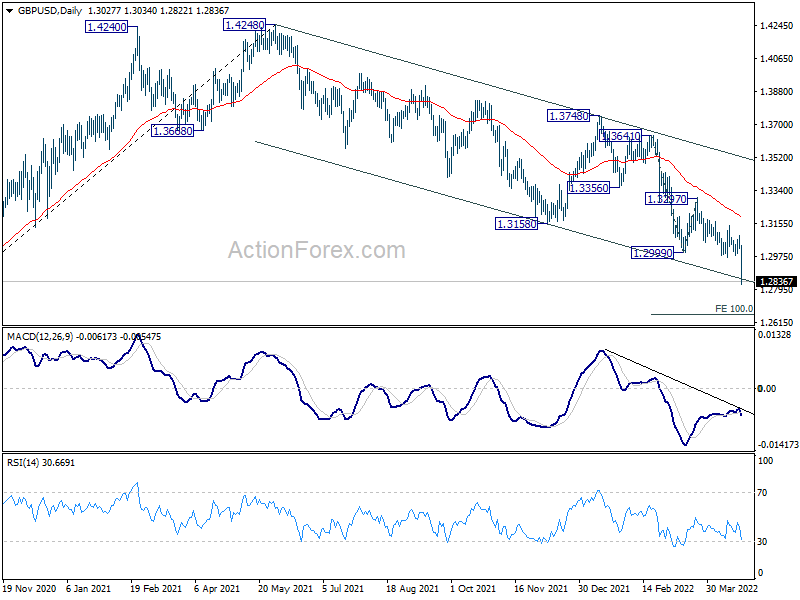
In the bigger picture, rise from 1.1409 (2020 low) has completed at 1.4248, ahead 1.4376 long term resistance (2018 high). Decline from 1.4248 could still be a corrective move, or it could be the start of a long term down trend. In either case, deeper decline would be seen back to 61.8% retracement of 2.1161 to 1.1409 at 1.2493. In any case, break of 1.3158 support turned resistance is needed to be the first sign of medium term bottoming. Otherwise, outlook will stay bearish in case of rebound.
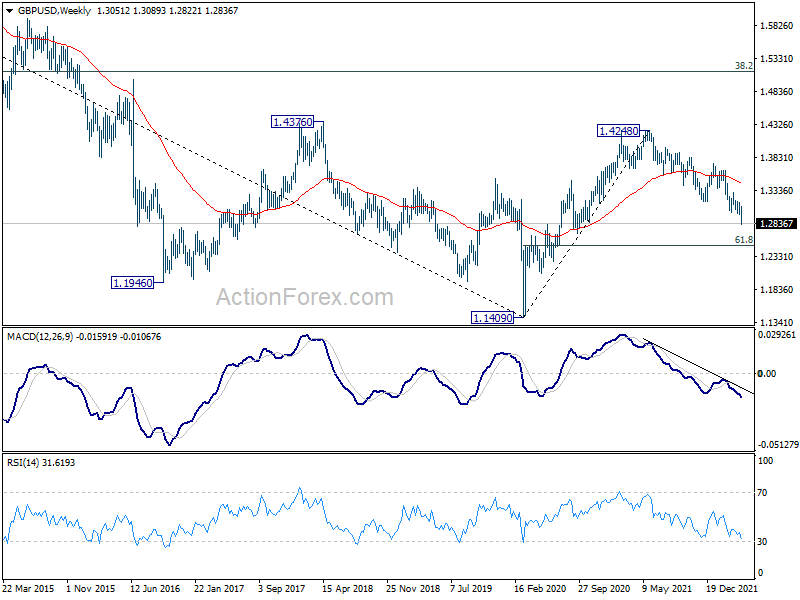
In the longer term picture, rebound from 1.1409 long term bottom could have completed at 1.4248 already, well ahead of 38.2% retracement of 2.1161 to 1.1409 at 1.5134. The development argues that price actions from 1.1409 are developing into a corrective pattern only. That is, long term bearishness is retained for resuming the downside from 2.1161 (2007 high) at a later stage.
Summary 4/25 – 4/29
Monday, Apr 25, 2022
[php_everywhere instance="1"]
Tuesday, Apr 26, 2022
[php_everywhere instance="2"]
Wednesday, Apr 27, 2022
[php_everywhere instance="3"]
Thursday, Apr 28 2022
[php_everywhere instance="4"]
Friday, Apr 29, 2022
[php_everywhere instance="5"]
The Weekly Bottom Line: Economic Outlook Dims
U.S. Highlights
- US yields continued to move higher this week, as Fed Chair Jerome Powell solidified the case for a 50-basis point rate hike at the Fed’s next meeting on May 4th. He also left the door open to additional 50 bps hikes at subsequent meetings, citing the importance of “front-loading” the removal of monetary accommodation.
- Existing home sales declined by 2.7% m/m to 5.77M (annualized) units in March, while housing starts surprised to the upside, rising by 0.3% m/m to 1.79M (annualized) units.
Canadian Highlights
- Inflation accelerated faster than expected in March, strengthening the case for another 50 basis-point rate hike in June.
- Housing data softened in March as rising interest rates and affordability weigh on demand. After months of strong construction numbers, some give-back may be in the cards amid rising financing costs.
Global Highlights
- The IMF has revised global growth projections lower as the ongoing war in Ukraine and COVID containment efforts in China dim economic prospects.
- Supply chains challenges continue to strain production due to an ongoing scarcity of inputs and rapidly rising costs.
U.S. - Appreciating the Fed Speak
Bond yields across the curve continued to move higher this week, as Fed officials have signaled a growing desire to move quickly in raising rates to quell inflation. This theme has been playing out across global financial markets since the beginning of the year and was echoed by Fed Chair Jerome Powell earlier this week. Speaking at an IMF event, Powell highlighted the importance of “front-loading” the removal of monetary accommodation, solidifying the case for a 50 basis-point rate hike.
The combination of firming rate hike expectations and heightened geopolitical tensions have led to a meaningful appreciation in the US dollar vis-à-vis other majors. Since the beginning of the year, the dollar index has appreciated by over 5%. It currently sits at a level not seen since the onset of the pandemic when heighten uncertainty drove significant safe haven flows into the US. With that in mind, it doesn’t seem like the dollar has much further to run. Longer-term yields are quickly closing in on peak levels not seen since the end of the last tightening cycle, and markets are already fully priced for an additional 200 basis points (bps) of tightening from the Fed this year alone. This is 25 bps higher than the FOMC’s median projection for the fed funds rate, suggesting there’s still some wiggle room for the Fed to adjust its outlook higher without meaningful moving the market. The wildcard remains on the geopolitical front. Further escalations in geopolitical tensions will only drive stronger demand for safe-haven investments, which would ultimately be dollar positive.
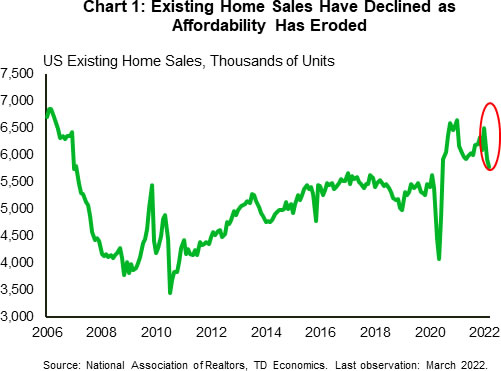
On the real economy, we’ve already started to see the impact of higher rates on some interest rate sensitive sectors. Existing home sales declined by 2.7% m/m in March – falling for the second consecutive month – to 5.77M units (Chart 1). However, higher rates aren’t telling the full story. Sales have also been restrained by exceptionally tight inventory, which currently sits at just a 2 months’ supply. For context, a balanced market typically runs anywhere between 4-6 months’ supply. While we are a long way from those levels, housing construction continues to surprise to the upside.
March housing starts rose by 0.3% month-on-month (m/m) to 1.79M (SAAR) units, marking yet another new cyclical high. Over the near-term, it would appear that starts have more room to run. The 3-month moving average of housing permits – a leading indicator for construction – continues to run well above the current level of starts, suggesting there is still plenty of projects in the pipeline.
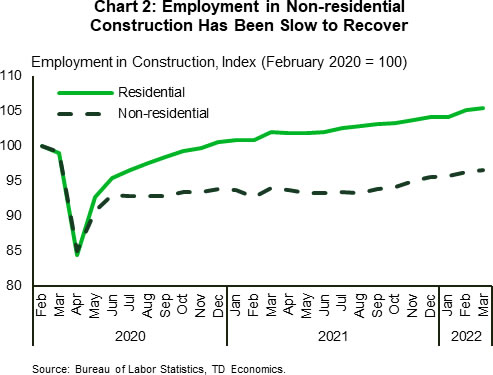
The sustained strength in housing construction provides evidence that at least some of the headwinds that builders had faced earlier in the pandemic are starting to abate. While sourcing of some materials remains an issue, labor constraints appear to be easing. Over the last year, the construction sector has added more than 200k jobs, and has now completely recouped all of its pandemic related losses. Interestingly, gains have not been spread evenly across the sector. Hiring in residential construction is 5.5% above February 2020 levels, while non-residential construction still has yet to recover from the pandemic. The shifting in employment composition shows that trades workers are going where the jobs are most plentiful, which bodes well for continued strength in residential construction, and should provide some relief to the supply constrained housing market.
Canada - Inflation Surprises as Housing Sales Slow
An upside inflation surprise and softening housing data made for a gloomy start to the week on the economic front. The Bank of Canada (BoC) looks set to hike rates another 50 basis points at its next meeting as concerns about engineering a 'soft landing' for inflation are sure to mount.
First up this week was the release of housing sales, starts and price data for March. Home sales pulled back, falling 5.4% month-over-month (m/m) to 55k units. While sales were lower in five provinces it was a 20% m/m collapse in the GTA that was the outlier. As sales cooled, so too did new listings – falling a similar 5.5% m/m – keeping the sales-to-new-listings ratio relatively unchanged, and firmly in seller's territory. That said, average home prices fell (-1.5% m/m) for the first time since July 2021, led lower by Alberta (-3.6%), B.C. (-2.4%), and Ontario (-2.3%). This likely reflected the make-up of March's sales, as the MLS home price index, which is a apples-to-apples measure (+1.0% m/m), single family prices (+0.6% m/m) and apartment prices (+2.3%) all advanced nationwide.
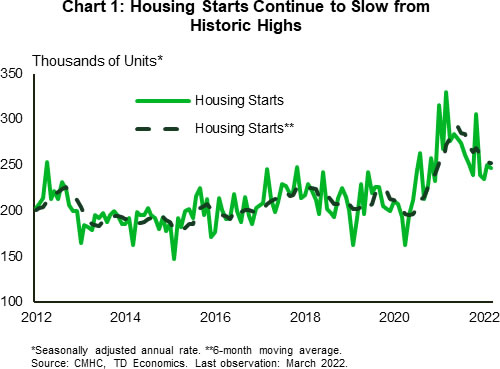
March's housing starts data also registered a decline from the month prior. Overall, first quarter housing starts were 7% below 2021Q4. However, the first quarter's drop came off a very strong fourth quarter number, and the six-month moving average of housing starts is still a solid 252.5k units.
With respect to both sales and starts activity, March is likely the start of a softer patch, as the effects of higher interest rates raise financing costs for builders and further stretch affordability for buyers.
And faster rate hikes are sure to come. March's CPI report surprised to the upside as total consumer prices rose 6.7% year-over-year, leaving the consensus expectation of a 6.1% gain in the dust. Price gains are increasingly broad based as prices excluding food and energy prices advanced 4.7%. Moreover, as the economic reopening continues, price pressures are spreading beyond goods to services as well, as the measure ticked up to 4.3% y/y from 3.8% in February. Indeed, from the BoC's perspective all three of its relevant core measures accelerated in March, and are well above the 2.0% target.
High inflation was reflected in February's retail sales data as well. Total sales edged up 0.1% for the month (7.4 % y/y), but in real terms sales were down 0.4% m/m. February's softness is likely to prove temporary, with March's flash estimate of a 1.4% m/m gain suggesting that even with the rapid acceleration in inflation, real volumes will have grown.
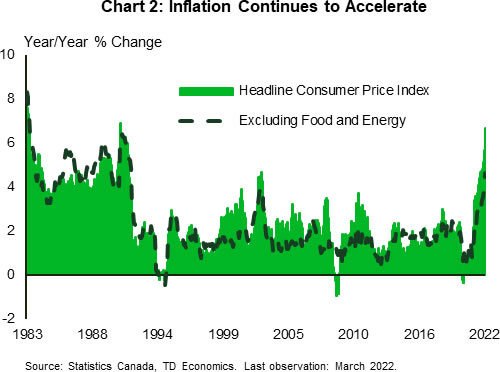
Another 50 basis-point rate hike by the BoC is likely in June, adding headwinds to the housing market while inflation is eroding real retail sales. The expansion continues as the labor market remains strong and the services sector ramps up, but headwinds are building and threaten to throw the economy off course.
Global- Economic Outlook Dims
This week the IMF and World Bank both released updated projections for the global economy. Both featured substantial markdowns in growth prospects largely due to the economic spillovers from the war in Ukraine, and the ongoing slowdown in the Chinese economy.
The IMF downgraded global growth from 4.2% in the January outlook to 3.6% for 2022. The largest markdowns were in Europe, and Asian nations exposed to rising energy import prices.
Importantly, the outlook incorporated European Union member states decision to end purchases of Russian coal. The policy will take effect later this summer, but the announcement raises questions about the downstream impacts to industry if oil and gas imports from Russia are curtailed. In scenario analysis presented along with the forecast a Russian energy embargo could result in a roughly 3 percent hit to E.U. GDP relative to the baseline projection through 2023.
Country level exposures to Russian energy products vary greatly. For instance, Russian supplies 90% (by value) of the energy product inputs in the coke and refined petroleum product industry in Slovakia and Bulgaria, but only 2% in Spain. More broadly, the E.U.'s largest refining operations (as of 2020) are in Germany, Italy, the Netherlands and Spain. Using the same measure, roughly a fifth of Dutch inputs are Russian sourced, with Italy and Germany not far behind at 17% and 16%, respectively. Germany's recent commitment to end Russian oil imports by the end of the year leaves domestic refiners looking to replace a key supplier.
Beyond the impact on commodity markets, the war has roiled supply chains once again. Moreover, the worsening COVID outbreaks in China compound the threat. With lockdowns in major cities ramping up in March, China's first quarter data shed some light on the situation. Despite first quarter GDP growth exceeding expectations by rising 4.8% year-over-year (y/y), the near-term trend is more indicative of mounting issues. Lockdowns proliferated in late-March, and their effect was reflected in March's 3.5% y/y contraction in retail sales. Due to the timing of restrictions, second quarter data will likely better reflect the impacts of the lockdowns. Moreover, current containment measures in China are hampering logistical networks as truck drivers are caught up in quarantines. Even factories operating under 'bubble' like conditions are dealing with reduced capacity and parts shortages, reflected in March's official PMI data indicating a fall in manufacturing output and a rise in supplier delivery times.
April's flash PMI readings reflected difficult conditions for European manufacturers (Chart 1). Euro zone supplier delivery times improved marginally, output growth stalled, and input cost inflation accelerated. That said, some cost relief on might be on the way as energy prices have fallen since March. Reassuringly, despite difficult conditions in Europe, U.S. manufacturers reported an improvement in output despite rising cost inflation and elongating supplier delivery times.
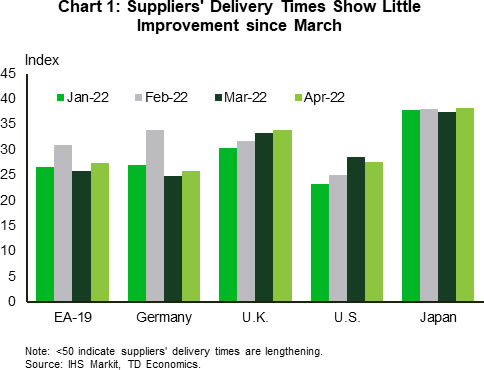
The global economic outlook is increasingly gloomy. Supply side factors continue to fuel inflation and risk shifting medium-term inflation expectations higher. The longer the supply side shocks persist, the greater the risk that central bankers may be forced to raise interest rates to re-anchor inflation expectations, regardless of the macroeconomic circumstances.
Week Ahead – A Bumper Start to the Week
Big events keep coming
It could be an interesting start to the week depending on who wins the second round of elections in France on Sunday. Marine Le Pen has made significant progress over the last five years and the race for the Presidency is expected to be much closer this time as a result. Emmanuel Macron saw his lead widen in the polls over the last week but as we’ve seen so often in recent years, they often can’t be relied upon.
If that proves to be the case this time around, the markets could be in for a nasty shock on the open next week; at least initially. A Le Pen victory has been assumed to be a negative for equities and the euro, and if there has been some complacency setting in this week as Macron’s lead has been extended, that could cause quite a stir at the start of trading.
The blackout period means there’ll be no commentary from the Federal Reserve next week. Earnings season is well underway though and there’s plenty of economic data to help fill the void. There’ll also be a number of central bank interest rate decisions, including the Bank of Japan, which has spent recent weeks stopping yields from rising above the upper bound of its Yield Curve Control (YCC) target.
US
The pre-FOMC communications blackout starts this weekend, likely to the relief of equity markets. With no Fed speakers yelling 0.50% and 0.75% rate hikes from the rooftops, there is an opportunity for equity markets to stage relief rallies in the week ahead, as well as for the US Dollar to retrace some of its recent gains.
The data calendar is fairly thin at the start of the week, with just durable goods on Monday, and pending home sales Wednesday. The latter could weigh on markets if a weak print spurs US slowdown fears. Thursday GDP could be a non-event ahead of Friday’s personal income and spending and PCE data. Closely watched by the Fed, high prints could lock and load multiple 0.50% hikes and potential weigh on equities.
EU
The second round of the French presidential election takes place on Sunday and Emmanuel Macron is the favourite to win the run-off. His lead in the polls has lengthened over the last week with Marine Le Pen failing to make up ground in the live TV debate. Still, if we’ve learned anything in recent years it’s that voting can surprise us. Especially when there’s a populist option on the ticket. Markets are fairly calm which could result in quite a knee-jerk response on the open next week if Le Pen can pull off an unlikely victory.
The war in Ukraine continues to be a key driver in the markets, with the EU now considering a ban on imports of Russian oil. This is likely to be phased in over time though which could limit the shock in the markets.
There’s a lot of data from Europe over the next week including GDP, unemployment and surveys but inflation is undoubtedly the headline. The releases from euro area countries earlier in the week should tell us whether we’re in for a surprise when the eurozone flash inflation data is released on Friday. With pressure ramping up on the ECB to join the tightening club this year, the data could make for uncomfortable reading.
UK
A quiet week for the UK with only tier three economic data being released.
Russia
The CBR meeting on Friday could see the Key Rate cut again after hints this week. The central bank lowered the rate to 17% from 20% at an inter-meeting decision a couple of weeks ago, having sharply increased it in the aftermath of the sanctions from the West in order to stabilise the currency which was in freefall. Inflation has lept to 17.62% but Governor Elvira Nabiullina suggested it could be lowered again next week during her reappointment proceedings on Thursday.
Unemployment data on Wednesday is expected to confirm it rose to 4.5% in April, up from 4.1% a month earlier.
South Africa
PPI inflation data is eyed next week after CPI in March rose to the upper end of the SARBs target range (3-6%) at 5.9%. Inflation is continuing to build which means further rate hikes are likely in store.
Turkey
Mostly tier two and three data next week with the quarterly inflation report on Thursday the most notable release. That said, it may not offer much insight into the roadmap for monetary policy from the CBRT given its disregard for inflation and the markets. For that, we’ll have to wait for the monetary policy review to be published.
China
Chinese markets remain under heavy pressure on fears of slowing growth, Covid-zero, the Shanghai lockdown, and US delisting uncertainty. The PBOC had refrained from cutting the MLF or LPR rates. Meanwhile, USD/CNH and USD/CNY exploded through 1-year resistance lines. The PBOC appears to be letting the currency weaken rather than go all out on stimulus domestically. If US yields rise next week, downward pressure on the currency and equities could intensify, prompting more offshore outflows.
Data is light until Friday with the release of Caixin manufacturing PMI. They then release the official manufacturing and services PMIs over the weekend. All have downside risks and a potentially negative impact on local equities.
India
The INR and Sensex have been resilient in the past week; perhaps benefitting from investor inflows leaving China as in times past. That could continue in the week ahead with Chinese markets looking to remain weak. An RBI slowly moving towards tightening is supportive of the currency.
It is a light data week with holidays at the week’s end.
Australia
Australia is on holiday Monday. Wednesday’s Inflation data has upside risks and could squeeze the RBA’s dovish positioning and be supportive of AUD, but negative for local equities.
AUD/USD has broken two-month technical support as sentiment internationally sours on higher US yields and the worsening outlook for China.
New Zealand
New Zealand is closed on Monday. The New Zealand dollar has broken multi-month support and has traded lower since, finishing the week more than 2% down. Soaring mortgage rates, a softening property market and a Reserve Bank far behind the inflation curve are all weighing on New Zealand markets.
Japan
Japan is on holiday Friday ahead of the Golden Week holidays in the week following. Attention remains entirely focused on the US/Japan rate differential which has pushed USD/JPY to near 130.00 during the week. The Bank of Japan has conducted extensive operations to cap 10-year JGB yields at 0.25%.
A rise through 130.00 could follow, especially as the Bank of Japan on Thursday, will remain in its current 25-year ultra-dovish stance. Expect the MOF/BOJ rhetoric about the currency to ramp up if 130.00 breaks. That leaves USD/JPY vulnerable to aggressive short-term pullbacks in the weeks ahead.
Japan equities are chasing the Nasdaq up and down but overall the picture remains challenging. A lower yen is not supporting exporters and concerns over soaring energy bills, rising US rates and a Chinese slowdown will be a risk to equity rallies. Japanese retail sales and industrial production on Thursday ahead of the BOJ, have significant downside risks.
Singapore
Rather surprisingly, SGD has weakened significantly after the MAS tightened policy. Both SGD and local equities are catching a cold from a weaker yuan and Mainland Chinese equities. Unemployment on Thursday will have no significant impact, sitting at record lows of 2.40%.
Weekly Economic & Financial Commentary: The Beige Book Paints a Clouded Outlook
Summary
United States: Higher Mortgage Rates Begin to Bite
- The sharp rise in mortgage rates appears to be slowing residential activity. Existing home sales fell 2.7% during March. Housing starts inched up 0.3% during March. However, single-family starts declined 1.7% during the month and single-family permits dropped 4.8%. The NAHB index fell two points to 77 in April. The Leading Economic Index (LEI) expanded 0.3% in March, reflecting slower-but-still positive economic growth.
- Next week: Durable Goods (Tue), New Home Sales (Tue), GDP (Thu)
International: China's Still Stumbling Economic Momentum
- China's economy started 2022 on a reasonable note as Q1 GDP rose 1.3% quarter-over-quarter, with manufacturing activity holding up quite well and services activity somewhat softer. However, March retail sales fell particularly sharply, while the ongoing impact of COVID lockdowns suggests April activity data could be even weaker. We forecast Chinese GDP growth of 4.9% for full-year 2022, but see the risk around that outlook as tilted to the downside.
- Next week: Australia CPI (Wed), Sweden Policy Rate (Thu), Eurozone CPI (Fri)
Credit Market Insights: Student Loan Developments Are a Boost to Young Adult Balance Sheets
- On Tuesday, the Department of Education announced another policy designed to bring student loan borrowers closer to debt forgiveness and ease their ability to pay off debts, affecting an estimated 3.6 million borrowers.
Topic of the Week: The Beige Book Paints a Clouded Outlook
- The Fed's Beige Book, released eight times per year, qualitatively reports on regional economic conditions. Although activity was generally solid over the survey period, this week's report underscores a growing sense of uncertainty about the economy's path in the coming months.