
Sample Category Title
AUD/USD And NZD/USD Advance As Risk Appetite Accelerates
AUD/USD started a fresh increase above 0.6850 and 0.6880. NZD/USD is also rising and might aim for more gains above 0.6000.
Important Takeaways for AUD USD and NZD USD Analysis Today
- The Aussie Dollar started a decent increase above 0.6850 against the US Dollar.
- There is a short-term bullish trend line forming with support at 0.6880 on the hourly chart of AUD/USD at FXOpen.
- NZD/USD is consolidating gains above the 0.5950 pivot zone.
- There is a key bullish trend line forming with support at 0.5935 on the hourly chart of NZD/USD at FXOpen.
AUD/USD Technical Analysis
On the hourly chart of AUD/USD at FXOpen, the pair started a fresh increase from 0.6725. The Aussie Dollar was able to clear 0.6800 to move into a positive zone against the US Dollar.
There was a close above 0.6880 and the 50-hour simple moving average. Finally, the pair tested 0.6930. A high was formed near 0.6930 and the pair recently started a consolidation phase. There was a minor decline below 0.6920.
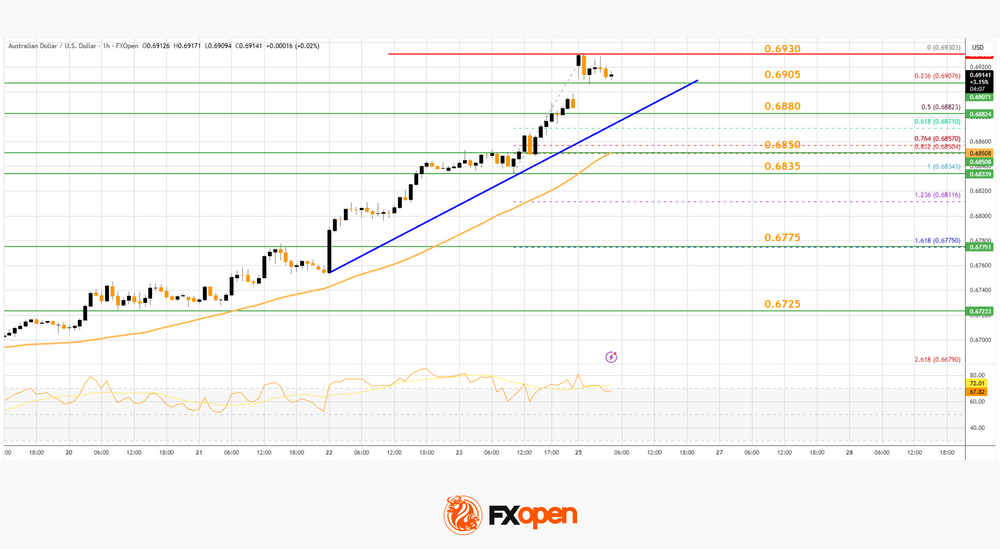
On the downside, initial support is near the 23.6% Fib retracement level of the upward move from the 0.6834 swing low to the 0.6930 high. The next area of interest could be near a short-term bullish trend line at 0.6880 and the 50% Fib retracement.
If there is a downside break below 0.6880, the pair could extend its decline toward the 0.6850 zone and the 50-hour simple moving average. Any more losses might signal a move toward 0.6755.
On the upside, the AUD/USD chart indicates that the pair is now facing resistance near 0.6930. The first major hurdle for the bulls might be 0.6950. An upside break above 0.6950 might send the pair further higher. The next stop is near 0.7000. Any more gains could clear the path for a move toward 0.7085.
NZD/USD Technical Analysis
On the hourly chart of NZD/USD on FXOpen, the pair started a fresh increase from 0.5820. The New Zealand Dollar broke the 0.5900 barrier to start the recent rally against the US Dollar.
The pair settled above 0.5920 and the 50-hour simple moving average. It tested 0.5975 and is currently consolidating gains. There was a minor pullback below 0.5960. The NZD/USD chart suggests that the RSI is now just above 70.
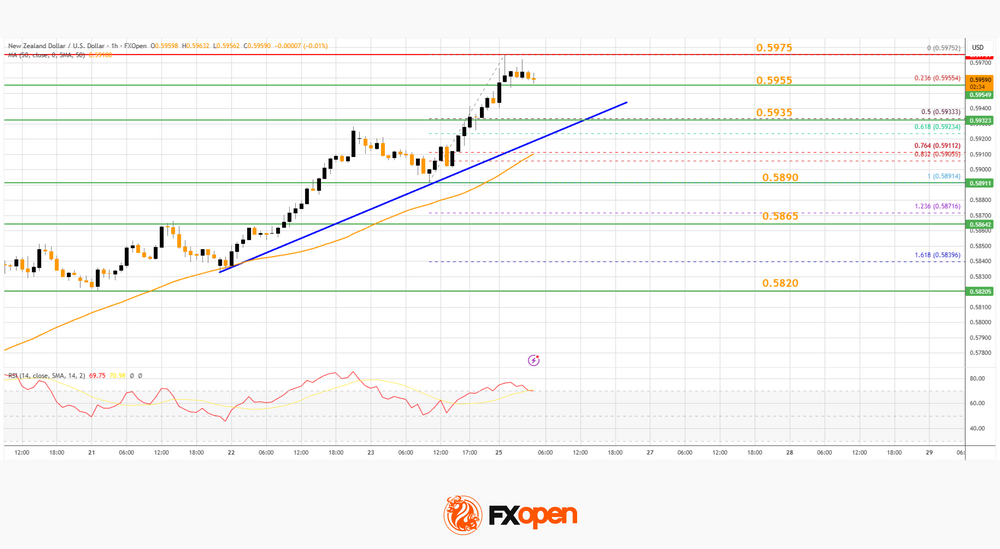
On the downside, immediate support is near the 0.5955 level and the 23.6% Fib retracement level of the upward move from the 0.5891 swing low to the 0.5975 high.
The first key zone for the bulls sits at 0.5935, a key bullish trend line, and the 50% Fib retracement. The next key level is 0.5890. If there is a downside break below 0.5890, the pair might slide toward 0.5865. Any more losses could lead NZD/USD into a bearish zone to 0.5820.
On the upside, the pair might struggle near 0.5975. The next major resistance is near the 0.6000 handle. A clear move above 0.6000 might even push the pair toward 0.6050. Any more gains might clear the path for a move toward the 0.6120 zone in the coming days.
Trade over 50 forex markets 24 hours a day with FXOpen. Take advantage of low commissions, deep liquidity, and spreads from 0.0 pips (additional fees may apply). Open your FXOpen account now or learn more about trading forex with FXOpen.
This article represents the opinion of the Companies operating under the FXOpen brand only. It is not to be construed as an offer, solicitation, or recommendation with respect to products and services provided by the Companies operating under the FXOpen brand, nor is it to be considered financial advice.
USD/JPY Daily Outlook
Daily Pivots: (S1) 154.48; (P) 156.86; (R1) 158.09; More...
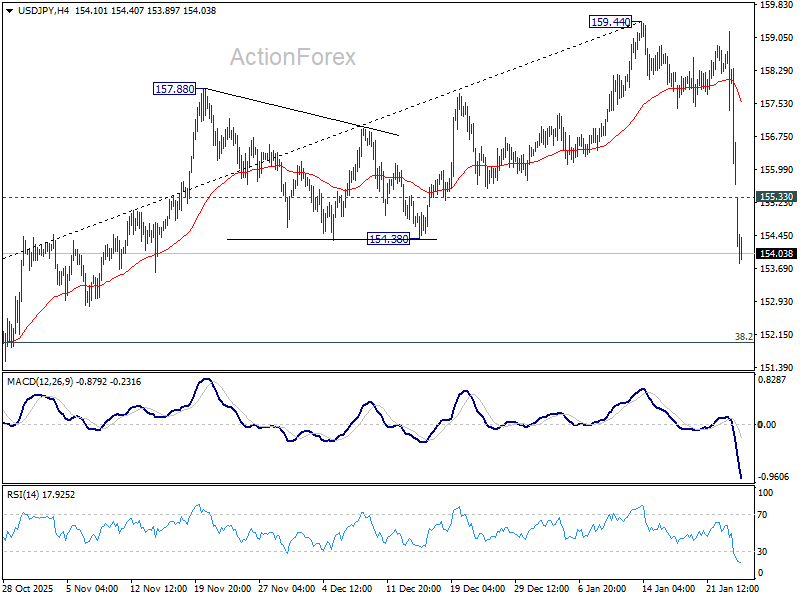
USD/JPY gaps lower today and fall from 159.44 accelerates. Intraday bias stays on the downside for 38.2% retracement of 139.87 to 159.44 at 151.96. Strong support should be seen there to bring rebound, at least on first attempt. On the upside above 155.33 minor resistance will turn intraday bias neutral and bring consolidations first. However, decisive break of 151.96 will argue that fall from 159.44 is not a correction, be reversing whole rise from 139.87. Deeper decline would then be seen to 61.8% retracement at 147.34.
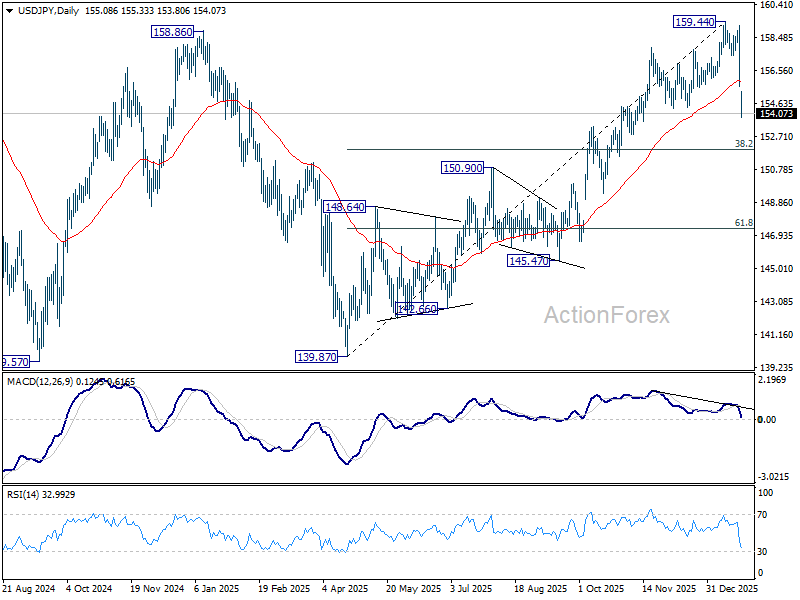
In the bigger picture, outlook is unchanged that corrective pattern from 161.94 (2024 high) should have completed with three waves at 139.87. Larger up trend from 102.58 (2021 low) could be ready to resume through 161.94. This will remain the favored case as long as 55 W EMA (now at 151.35) holds. However, sustained break of 55 W EMA will argue that the pattern from 161.94 is extending with another falling leg.
Yen Roars on Takaichi’s Blunt Warnings, Dollar Selling Intensifies
Yen once again took center stage, staging a broad-based rally that gathered pace through the Asian session. USD/JPY dived below 154, a sharp reversal from last week’s run toward 160 — a level widely perceived by markets as Japan’s informal line in the sand. The move gained traction as Japanese assets reacted in tandem. Nikkei opened sharply lower and finished the session down around -1.8%, reinforcing a classic domestic risk-aversion loop. Equity weakness in turn strengthened Yen further, lending durability to the rebound rather than leaving it vulnerable to quick retracement.
Momentum was reinforced by unusually direct political messaging over the weekend. Japanese Prime Minister Sanae Takaichi warned that authorities would take “all necessary measures” to counter speculative and highly abnormal market movements. While she did not specify whether she was referring to currency markets or bond yields, traders interpreted the comments as a clear signal that tolerance for renewed instability is limited.
As a result, caution has crept back into positioning. There is a growing sense that authorities could eventually step in if volatility resurfaces. Yet the irony is clear: as markets move in line with the government’s preference for a stronger Yen, the immediate risk of intervention diminishes rather than intensifies.
Politics remain an important undercurrent in Japan too. Takaichi is heading into a snap election in early February, seeking to solidify her mandate. Recent polling shows her approval has slipped modestly but remains elevated. A Nikkei survey released Monday showed support falling to 67% from 75% in December, while a Kyodo poll placed approval at 63%, down from 68%. A separate Mainichi survey painted a more cautious picture, showing approval dropping ten points to 57%. While still high by historical standards, the trend has attracted attention as the campaign approaches, particularly given the compressed political timetable.
The challenge for Takaichi lies in the gap between her personal popularity and that of her party. The LDP continues to poll near only 30% in several surveys, far below the prime minister’s own ratings. With the ruling coalition holding only a one-seat majority, the election is widely viewed as one of the most unpredictable in years.
Beyond Japan, Yen’s rally is unfolding against a backdrop of broad-based Dollar weakness. The greenback is under pressure across the board, with losses against Yen acting as a focal point but not the sole driver. Investors are increasingly uneasy about the direction of US policy and its implications for capital flows.
That unease goes beyond trade disputes. Markets are beginning to price the risk of capital friction alongside tariff conflict. When geopolitical tensions escalate, even allies become less inclined to hold each other’s debt, preferring hard currencies and perceived safe havens instead — a dynamic that has repeated itself throughout history.
This broader tone is clearly reflected in FX performance. Yen is currently the strongest major currency, followed closely by Swiss Franc, highlighting defensive positioning. Dollar sits at the bottom of the performance table, trailed by Loonie and Sterling, while Euro, Aussie and Kiwi occupy the middle ground.
In Asia, Nikkei fell -1.79%. Hong Kong HSI fell -0.00%. China Shanghai SSE fell -0.09%. Singapore Strait Times is down -0.60%. Japan 10-year JGB yield fell -0.027 to 2.237.
Metals mania continues as gold eyes 5,500, silver targets 118
Safe-haven flows have poured into precious metals again as global risk sentiment deteriorated at the start of the week, driving Gold to a fresh all-time high above 5,100 an ounce and sending Silver decisively through the 100 mark. The move reflects widespread investor anxiety amid escalating geopolitical and trade tensions, including renewed tariff threats and broad policy uncertainty that have weakened confidence in traditional risk assets and more importantly, Dollar.
The latest trigger has been a sharp escalation in tensions between the US and Canada. US President Donald Trump warned over the weekend that Canada could face 100% tariffs on its exports if Ottawa proceeds with trade agreement that he believes would allow China to flood the US market. Treasury Secretary Scott Bessent amplified the message on Sunday, warning that the US could not allow Canada to function as a backdoor for Chinese goods. The hardline comments land against a broader backdrop of tariff disputes and market skepticism about predictable policy direction.
Although Canada’s leadership quickly sought to dial down tensions, markets remained unsettled. Prime Minister Mark Carney sought to ease immediate fears, emphasizing its commitment to existing obligations under the United States–Mexico–Canada Agreement and clarifying that recent tariff reductions with China do not constitute a comprehensive free trade pact. Despite the diplomatic pushback, markets remain sensitive to even the threat of wider trade escalation, amplifying safe-haven bid dynamics.
In the background, underlying both rallies in Gold and Silver is a broader deterioration in risk appetite, with concerns spanning not just North American trade friction but also lingering uncertainty over NATO relations, Greenland disputes, and Middle East flashpoints. Markets are pricing this backdrop as a structural premium for haven assets rather than transient headline shocks.
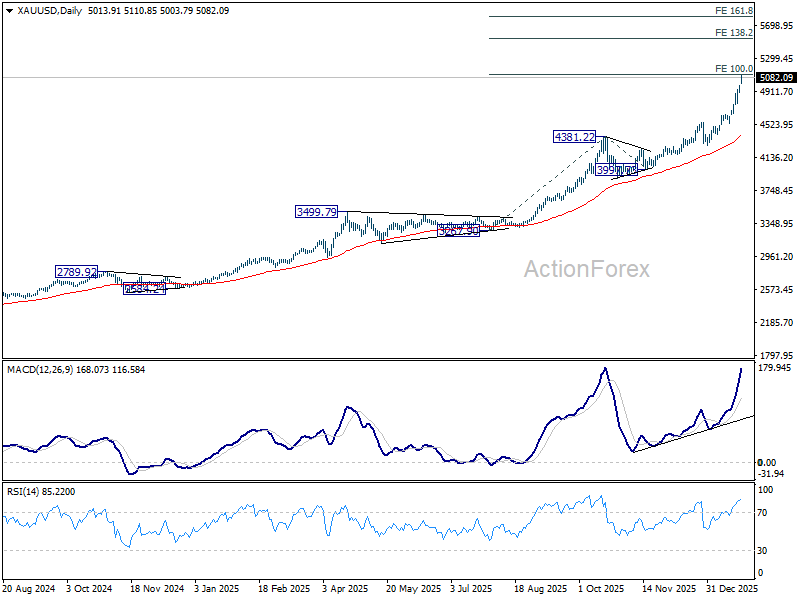
Technically, Gold has already met 100% projection of 3267.90 to 4,381.22 from 3,997.73 at 5,111.05 and momentum still looks strong in both 4H and D MACD. There is no sign of topping yet. Sustained trading above 5,111.05 will pave the way to 138.2% projection at 5,536.33 next. On the downside, break of 4,899.23 support will indicate short term topping, and bring consolidations first.
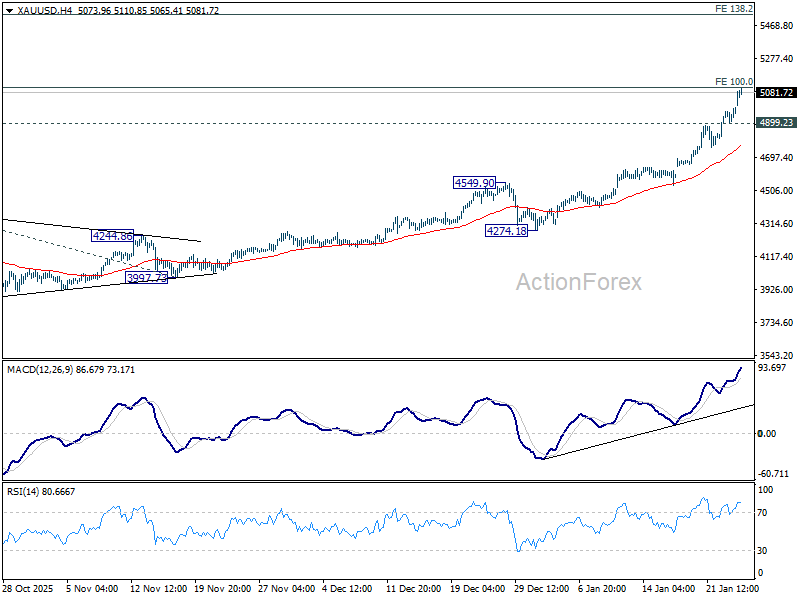
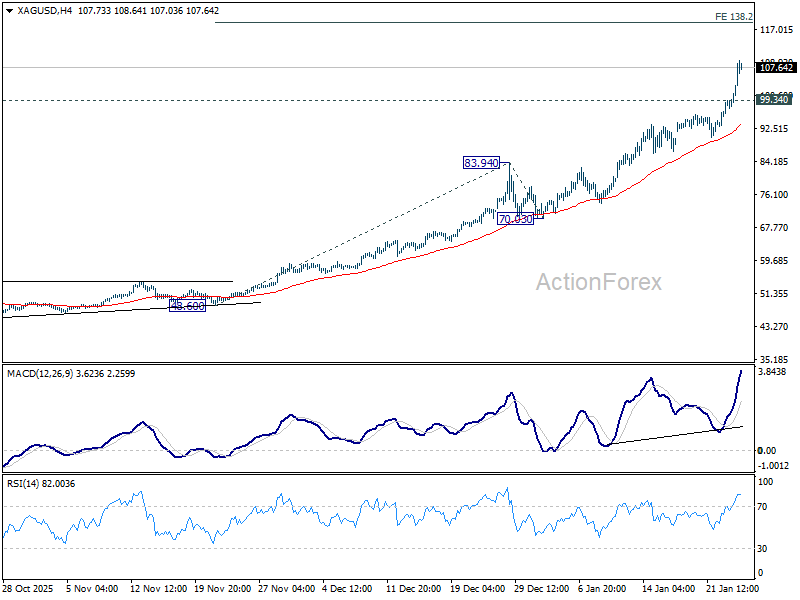
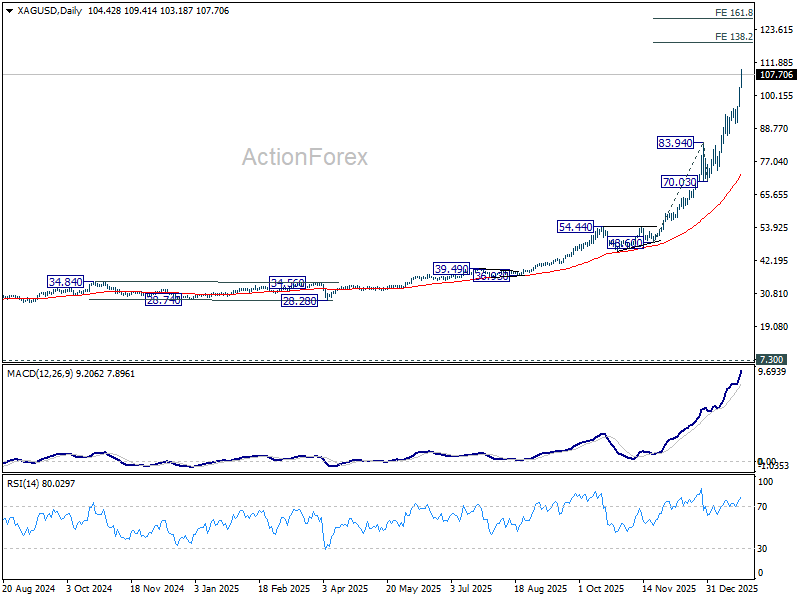
Silver's parabolic rise continues today without any hesitation above 100 psychological level. Near term outlook will stay bullish as long as 99.34 support holds. Next target is 138.2% projection of 48.60 to 83.94 from 70.03 at 118.86. On the downside, break of 99.34 will indicate short term topping and bring consolidations first.
Fed and BoC hold expected, while Australia CPI raises stakes
The week ahead places central banks back at the center of market attention, with the Fed and BoC emerging as the dual policy risks. Both are widely expected to keep interest rates unchanged, but neither meeting is likely to be treated as routine, given heightened political and trade uncertainty shaping global macro expectations.
The Fed is expected to hold rates steady at 3.50–3.75% at Wednesday’s decision, an outcome that is firmly priced in. Fed funds futures imply roughly 96% probability of no change. Economists show unanimity: all 100 respondents in the latest Reuters poll forecast a hold. Beyond the meeting itself, markets are aligned around a prolonged pause. Futures pricing assigns only about a 15% chance of a March rate cut, while 58% of economists surveyed expect policy to remain unchanged throughout the first quarter. The Fed, for now, appears set to sit tight as it assesses incoming data.
Nevertheless, that confidence fades further out the curve. By the end of June, futures price roughly a 60% chance of one rate cut, reflecting a more divided outlook on growth and inflation as the year progresses. Economic developments remain a wild card, particularly given the erratic policy environment from Washington since the start of the year. Shifting trade threats and diplomatic tension complicate forecasts for both activity and inflation.
Leadership in Fed uncertainty adds to the mix. The question of who replaces Jerome Powell as Fed chair has real policy implications, with successors like Kevin Warsh and Kevin Hassett offering contrasting approaches. A more dovish tilt under Hassett would mark a meaningful shift in tone.
For now, the base case remains intact: at least one rate cut later this year, but with timing highly conditional. Markets are increasingly wary of extrapolating too far ahead in an environment where political risk can override macro signals.
In Canada, the policy outlook appears a little bit more settled. The BoC is expected to hold rates at 2.25%, as its easing cycle has effectively run its course. In a recent Reuters poll, all 35 economists surveyed expected a hold this month, while nearly three-quarters forecast rates to remain unchanged through 2026, highlighting confidence in a prolonged pause.
That said, trade risks loom large. As long as Canada maintains preferential access to US markets—either through agreements or prolonged negotiations—the BoC can afford patience. But the balance of risks still leans dovish. Should tariffs expand to a broader range of industries, growth would likely weaken, forcing the BoC into additional rate cuts despite its current inclination to stay on hold.
Also, markets are approaching Australia’s CPI release with heightened sensitivity, as the data now sits at the center of the debate over whether the RBA can afford continued restraint. The past two months have seen a dramatic turnaround in expectations, with rate-cut assumptions replaced by a credible risk that policy may need to tighten further, and sooner.
The latest catalyst came from December’s strong employment report, which reinforced concerns that domestic demand and wage pressures remain inconsistent with a smooth return of inflation to target. While the RBA’s base case remains one of patience, officials have made clear they are unwilling to tolerate a renewed inflation drift, particularly if it threatens to entrench expectations.
The focus this time will particularly be on trimmed mean CPI, where any upside surprise would be especially problematic for policymakers. A further move away from the top of the target band would significantly raise the odds of pre-emptive tightening, forcing the RBA to act earlier than intended to preserve credibility.
Also, markets will closely watch US consumer confidence, Germany’s Ifo survey, Eurozone GDP, and Canada’s GDP.
Here are some highlights for the week:
- Monday: Germany Ifo business climate; US durable goods orders.
- Tuesday: Japan corporate services prices; Australia NAB business confidence; US house price index, consumer confidence.
- Wednesday: Japan BoJ minutes; Australia CPI; Germany Gfk consumer sentiment; BoC rate decision; Fed rate decision.
- Thursday: New Zealand trade balance, ANZ business confidence; Canada trade balance; US jobless claims, trade balance, factory orders.
- Friday: Japan Tokyo CPI, retail sales, industrial production, unemployment rate; Australia PPI; Germany CPI flash, unemployment, GDP; Swiss KOF economic barometer; Eurozone GDP, unemployment rate; Canada GDP; US PPI, Chicago PMI.
USD/JPY Daily Outlook
Daily Pivots: (S1) 154.48; (P) 156.86; (R1) 158.09; More...
USD/JPY gaps lower today and fall from 159.44 accelerates. Intraday bias stays on the downside for 38.2% retracement of 139.87 to 159.44 at 151.96. Strong support should be seen there to bring rebound, at least on first attempt. On the upside above 155.33 minor resistance will turn intraday bias neutral and bring consolidations first. However, decisive break of 151.96 will argue that fall from 159.44 is not a correction, be reversing whole rise from 139.87. Deeper decline would then be seen to 61.8% retracement at 147.34.
In the bigger picture, outlook is unchanged that corrective pattern from 161.94 (2024 high) should have completed with three waves at 139.87. Larger up trend from 102.58 (2021 low) could be ready to resume through 161.94. This will remain the favored case as long as 55 W EMA (now at 151.35) holds. However, sustained break of 55 W EMA will argue that the pattern from 161.94 is extending with another falling leg.
JPY Goes Through the Roof Against All Global Peers
Markets
The Japanese yen hijacks all market attention. JPY goes through the roof against all global peers, in particular the US dollar. USD/JPY fell off a cliff Friday, from an intraday high of 159.23 to 155.7 in the close. The sharp decline continues at the start of the new week with the pair trading at 154.4 currently, breaking below the 154.83 support (23.6% retracement on the USD/JPY April-Jan rally). Support between 154.35 (December lows) and around 154 (big figure, 100 dMA) appears to hold for the time being. JPY strength originated after Bank of Japan governor Ueda concluded its presser. Ueda disappointed JPY bulls with its agonizingly slow hiking cycle even as inflation remains well north of the 2% target. That prompted the intraday high in USD/JPY. But then rumours began swirling that financial institutions had been asked to check on the yen’s exchange rate. This is typically the last stage before actual FX interventions. This time around, though, it weren’t just Japanese authorities doing the rate check, but the NY Fed. That suggests a possible coordinated FX market response in which one party (the US) essentially has unlimited firepower to buy JPY and sell USD. Japanese authorities have been frustrated over JPY weakness for quite some time and have since 2022 stepped unilaterally a couple of times. The last such coordinated JPY buying operation was in 1998. Japanese PM Takaichi, finance minister Katayama and other high-ranking officials over the weekend and today have all added fuel to the already wildly raging speculation fire. The topic will remain top of mind today. USD/JPY moves have spilled and are spilling over to other USD pairs. EUR/USD on Friday pierced through resistance at around 1.1775 coming from a downward sloping trendline connecting the Sep and Dec highs, smashed the 1.18 big fig and came just shy of the 1.19 level this morning. Key resistance is located at 1.1919, the September multiyear high. GBP/USD (cable) shot up to a 5-month high of 1.3664. The broader DXY index tumbled to 97.11 with the 96.22 lows looming. Commodities, metals in particular, are surging too. Gold hits a new high north of the symbolical 5k barrier, silver leaped beyond the $100 mark already on Friday. It’s suggestive of general dollar weakness, which we still see as a consequence of rising US risk premia tied to the administration’s unpredictable policies, domestic and foreign. The Senate Democrats are threatening with a partial shutdown over the Minnesota incident (see below) and serves as a case in point. Core bonds gain slightly this morning after a fairly uneventful session on Friday, when PMIs failed to inspire. The move lacks strength though and could be capped, especially in Europe, by another huge 10% jump in gas prices. In focus later this week are the Fed policy meeting along with some other smaller central banks (Hungary, Canada, Sweden, EU member states’ inflation and GDP numbers and some high-profile company earnings (Microsoft, Tesla, Meta, Apple …).
News and views
Democratic Senate Minority leader Schumer calls for changes to the Department of Homeland Security’s funding bill which he finds woefully inadequate to rein in the abuses of ICE (Immigration and Customs Enforcement). The Democratic move came after a second protestor died in Minnesota where the US administration sent huge numbers of federal officers to conduct a sweeping immigration crackdown and respond to escalating protests. Schumer wants to isolate the DHS bill from five other funding bills which the House last week voted in favor of (in one package). Any such proposed changes by the Senate would require a new vote in the House which is on recess this coming week. Unfortunately, the clock is ticking against Congress with a January 31 deadline looming. That’s when they run out of funding for much of the federal government. Passing the deadline without a deal in place risks triggering a partial government shutdown.
US president Trump reacted to the trade deal reached between Canada and China last week. It’s a wide-ranging agreement to lower trade barriers and rebuild ties. It includes lower tariffs on Canadian rapeseed, on Chinese EV’s, but also visa-free travel to Canadians. Trump now threatens Canada with 100% of tariffs against all goods and products coming into the US if Canada pushes through with its resolution on several important tariff issues. The Loonie isn’t impressed and holds its ground against an overall weak USD. USD/CAD (1.3675) slides towards the 1.36 support area.
Gold Spikes Past $5,000
Last week was marked by the escalation — and partial de-escalation — of geopolitical and trade tensions between the US and the EU, Macron’s now-famous glasses that grabbed headlines at the World Economic Forum, and renewed stress around Japan’s swelling public debt. The latter triggered a sharp sell-off in Japanese government bonds, pushing some long-dated JGB yields to multi-decade — and in some cases record — highs, while also weighing on the yen.
All’s well that ends well — or almost. Last week ended on a better note than it began. US and European equities rebounded following the de-escalation, though the recovery remains limited and fragile: the next shock is a matter of when, not where.
The global order is shifting, and trust is gone. Restoring it will take time.
Against this backdrop, investors continue to flock to precious metals. Gold surged past the $5’000 mark early Monday — a clear signal that risk appetite has not returned. Silver, which had already broken through the $100 level on Friday, continues to push higher. US and European equity futures are lower this morning, while FTSE futures outperform — holding roughly flat — as sustained inflows into precious metals support mining stocks.
What’s striking is that this renewed flight to safe havens is unfolding without any major geopolitical headline this morning. There has been no new escalation over the weekend — no fresh breach of international law, no invasion, no immediate military threat. The US did, however, threaten Canada with 100% tariffs, after Mark Carney approached China last week, defying the White House — a reminder that trade tensions remain alive and well. Beyond that, the news flow is thin. Yet the bid for precious metals suggests that market stress is far from over.
Even South Korea’s Kospi — which had been rallying as if insulated from global turmoil — is lower this morning. Still, this week’s packed economic and corporate calendar should redirect some attention toward more conventional market drivers: you know, economic data, central-bank decisions and corporate earnings.
On the policy front, both the Bank of Canada (BoC) and the Federal Reserve (Fed) are due to announce their latest decisions. Both are widely expected to keep rates unchanged, but the Fed’s statement will be closely scrutinised amid growing pressure from the White House. While markets are hungry for drama, Chair Powell is likely to downplay political noise and reiterate the Fed’s data-dependent stance. For now, strong economic growth, inflation still above target, and a cooling — but not collapsing — labour market argue for patience. Fed funds futures price the next rate cut no earlier than June, with a probability just above 40%.
Until then, investors can take comfort in the fact that the Fed’s balance sheet is expanding again, helping to inject liquidity — potentially offsetting some of the drain created by rising Japanese yields and the risk of Japanese capital repatriation.
Speaking of Japan, while easing pressure on JGBs failed to halt yen selling when USDJPY traded above 159, intervention chatter did the trick. Since Friday, the yen has staged a sharp rebound on expectations that Japanese authorities — possibly with US coordination — would step in. The story is that reports that the New York Fed contacted financial institutions to gauge FX conditions added fuel to the move. The USDJPY has since retreated toward 154, alongside explicit warnings from Japanese officials that they stand ready to intervene.
Good news: once positioning is flushed out, yen shorts are likely to rebuild, potentially pushing the USDJPY back toward the 160 area — the line in the sand for policymakers.
Elsewhere, dollar weakness is the dominant theme. The EURUSD flirted with the 1.19 level this morning, while sterling traded above 1.36 — its highest levels since last September. Everything points to broad-based dollar selling.
A softer dollar should, in theory, support US equities: it makes US assets cheaper for foreign investors and boosts overseas earnings when translated back into dollars. Whether that will be enough to draw buyers back in remains to be seen.
This week marks a deeper dive into earnings season. In the US, Meta, Microsoft and Tesla report on Wednesday; Apple, Visa and Mastercard on Thursday; Exxon, Chevron and American Express on Friday. In Europe, ASML, SAP and LVMH will be in focus.
US big tech started the year on a cautious note, weighed down by persistent concerns:
The circularity of the AI deals, too much spending, too much debt, and not convincing return on investment so far. So, earnings will be important to reset sentiment among investors on whether the things are going toward the right direction, or will this earnings seasons be another disillusion and heightened scrutiny despite impressive headline numbers, partly boosted by circular deals. It’s hard to tell, but what’s sure is that the US companies must do the heavy lifting and make investors forget about the geopolitical and trade unease. If they can’t do so, markets look vulnerable to a deeper pullback.
Historically, when we’re at ATH levels, we tend to see price pullbacks of around 10–20%, with the severity depending on unpredictable factors. But the past years’ clear pattern is rapid dip-buying and V-shaped corrections.
So, let it fall, let it fall, let it fall.
Risk of Intervention in JPY Increases
In focus today
In Germany, the Ifo indicator for January is released. The PMI report released on Friday rebounded more than expected so it will be interesting to see if the Ifo index shows the same picture of the economy.
The key events for the remainder of the week include rate decisions in the US, Sweden, and Canada on Thursday. On Friday, the focus will shift to European inflation, with preliminary data for January from Spain and Germany.
Economic and market news
What happened over the weekend
US-brokered talks between Russia and Ukraine concluded on Saturday without any agreements, as reflected in statements from all three parties. Despite the lack of a deal, both Moscow and Kyiv expressed openness to continued dialogue, with a new round of discussions scheduled for next Sunday. The talks took place amid ongoing hostilities, including Russian airstrikes that left over a million Ukrainians without power in freezing winter conditions.
In Japan, PM Takaichi vowed to counter speculative market activity following Friday's sharp yen strengthening, warning of potential intervention if volatility escalates. The yen's rally, driven by intervention risk, has had spillover effects on the broader USD, which may find some support from the Federal Reserve's cautiously hawkish stance and resilient economic data.
In the US, domestic political tensions escalated after several Democratic senators threatened to block a Department of Homeland Security funding bill over calls for reforms and accountability within agencies like ICE. This move, triggered by public safety concerns following a fatal shooting involving a Border Patrol agent, raises the likelihood of a partial government shutdown as funding deadlines approach.
What happened Friday
In the euro area, January PMIs surprised to the downside. The composite PMI remained steady at 51.5, falling short of the consensus estimate of 51.9. The weaker-than-expected figure was primarily driven by a decline in the services PMI, which dropped to 51.9 from 52.4, against market expectations of a rise to 52.6. Meanwhile, manufacturing PMI showed a slight improvement, rising to 49.4 from 48.8, but it remains in contraction territory.
French PMIs highlighted diverging trends, with the services PMI falling to 47.9, signalling contraction, while manufacturing PMI surprised to the upside at 51.0. Although the services sector has been volatile, its current level aligns with earlier quarters when the economy still managed to grow. Germany's PMIs provided a positive surprise, with the composite PMI rising to 52.5, driven by gains in both services and manufacturing. However, a sharp drop in the services employment index raises concerns, making labour market developments key to watch.
In the US, January flash PMIs were in line with expectations, with composite PMI at 52.8 (prior: 52.7). Services price indices continued to moderate, with little change in employment indices. Manufacturing showed a modest improvement in new orders (50.8 from 49.1), though export orders weakened further (47.3 from 49.1).
The final University of Michigan consumer survey indicated that 1-year inflation expectations softened to 4.0% in January, down from the preliminary estimate of 4.2%. While this represents the lowest level since January 2025, it remains significantly higher than the 3.3% recorded at that time. Additionally, consumer confidence improved further in the final January release. The combination of higher confidence and slightly lower inflation expectations is likely to be viewed positively by the Fed.
In Sweden, employment grew more than expected in Q4, rising by 0.6% q/q. However, unemployment remains elevated and rose unexpectedly to 9.1% in Q4, driven by a higher-than-anticipated number of individuals entering the labour market. Indicators suggest that labour demand continues to improve, pointing to potential significant progress for the labour market this year. While the strong employment growth underscores ongoing improvements, Friday's high unemployment figures could prompt the Riksbank to adopt a cautious stance on labour market prospects in its upcoming announcement.
Equities: The tariff relief proved short-lived in equity markets, with most indices fading to unchanged closes on Friday. As a result, the earlier tariff-driven sell-off has not yet been fully retraced. Value cyclicals like industrials and financials that would typically bounce as politics de-risk, declined ~1% on Friday. Global small caps, which have performed strongly year-to-date, surprisingly lost momentum on Friday, with the Russell 2000 slipping nearly 2% on Friday. Meanwhile, US mega-cap technology stocks were mostly higher ahead of this week's earnings releases, reversing the recent small caps versus big tech trade.
FI and FX: Broad USD posted its largest weekly decline since May last week. USD/JPY starts the week around 154 following Friday's possible intervention by Japanese authorities, and EUR/USD looks to have 1.19 in sight. Scandies continues to benefit from the broad USD weakness, but strategy-wise we still view the latest declines in EUR/SEK and EUR/NOK both as temporary. US yields ended the week more or less unchanged, whereas European rates closed higher. This week's main event is the Federal Reserve meeting on Wednesday, where the FOMC is widely expected to take a pause in the easing cycle, which is also our call.
Metals mania continues as gold eyes 5,500, silver targets 118
Safe-haven flows have poured into precious metals again as global risk sentiment deteriorated at the start of the week, driving Gold to a fresh all-time high above 5,100 an ounce and sending Silver decisively through the 100 mark. The move reflects widespread investor anxiety amid escalating geopolitical and trade tensions, including renewed tariff threats and broad policy uncertainty that have weakened confidence in traditional risk assets and more importantly, Dollar.
The latest trigger has been a sharp escalation in tensions between the US and Canada. US President Donald Trump warned over the weekend that Canada could face 100% tariffs on its exports if Ottawa proceeds with trade agreement that he believes would allow China to flood the US market. Treasury Secretary Scott Bessent amplified the message on Sunday, warning that the US could not allow Canada to function as a backdoor for Chinese goods. The hardline comments land against a broader backdrop of tariff disputes and market skepticism about predictable policy direction.
Although Canada’s leadership quickly sought to dial down tensions, markets remained unsettled. Prime Minister Mark Carney sought to ease immediate fears, emphasizing its commitment to existing obligations under the United States–Mexico–Canada Agreement and clarifying that recent tariff reductions with China do not constitute a comprehensive free trade pact. Despite the diplomatic pushback, markets remain sensitive to even the threat of wider trade escalation, amplifying safe-haven bid dynamics.
In the background, underlying both rallies in Gold and Silver is a broader deterioration in risk appetite, with concerns spanning not just North American trade friction but also lingering uncertainty over NATO relations, Greenland disputes, and Middle East flashpoints. Markets are pricing this backdrop as a structural premium for haven assets rather than transient headline shocks.
Technically, Gold has already met 100% projection of 3267.90 to 4,381.22 from 3,997.73 at 5,111.05 and momentum still looks strong in both 4H and D MACD. There is no sign of topping yet. Sustained trading above 5,111.05 will pave the way to 138.2% projection at 5,536.33 next. On the downside, break of 4,899.23 support will indicate short term topping, and bring consolidations first.
Silver's parabolic rise continues today without any hesitation above 100 psychological level. Near term outlook will stay bullish as long as 99.34 support holds. Next target is 138.2% projection of 48.60 to 83.94 from 70.03 at 118.86. On the downside, break of 99.34 will indicate short term topping and bring consolidations first.
EURUSD Elliott Wave : Calling the Rally After Double Three Pattern
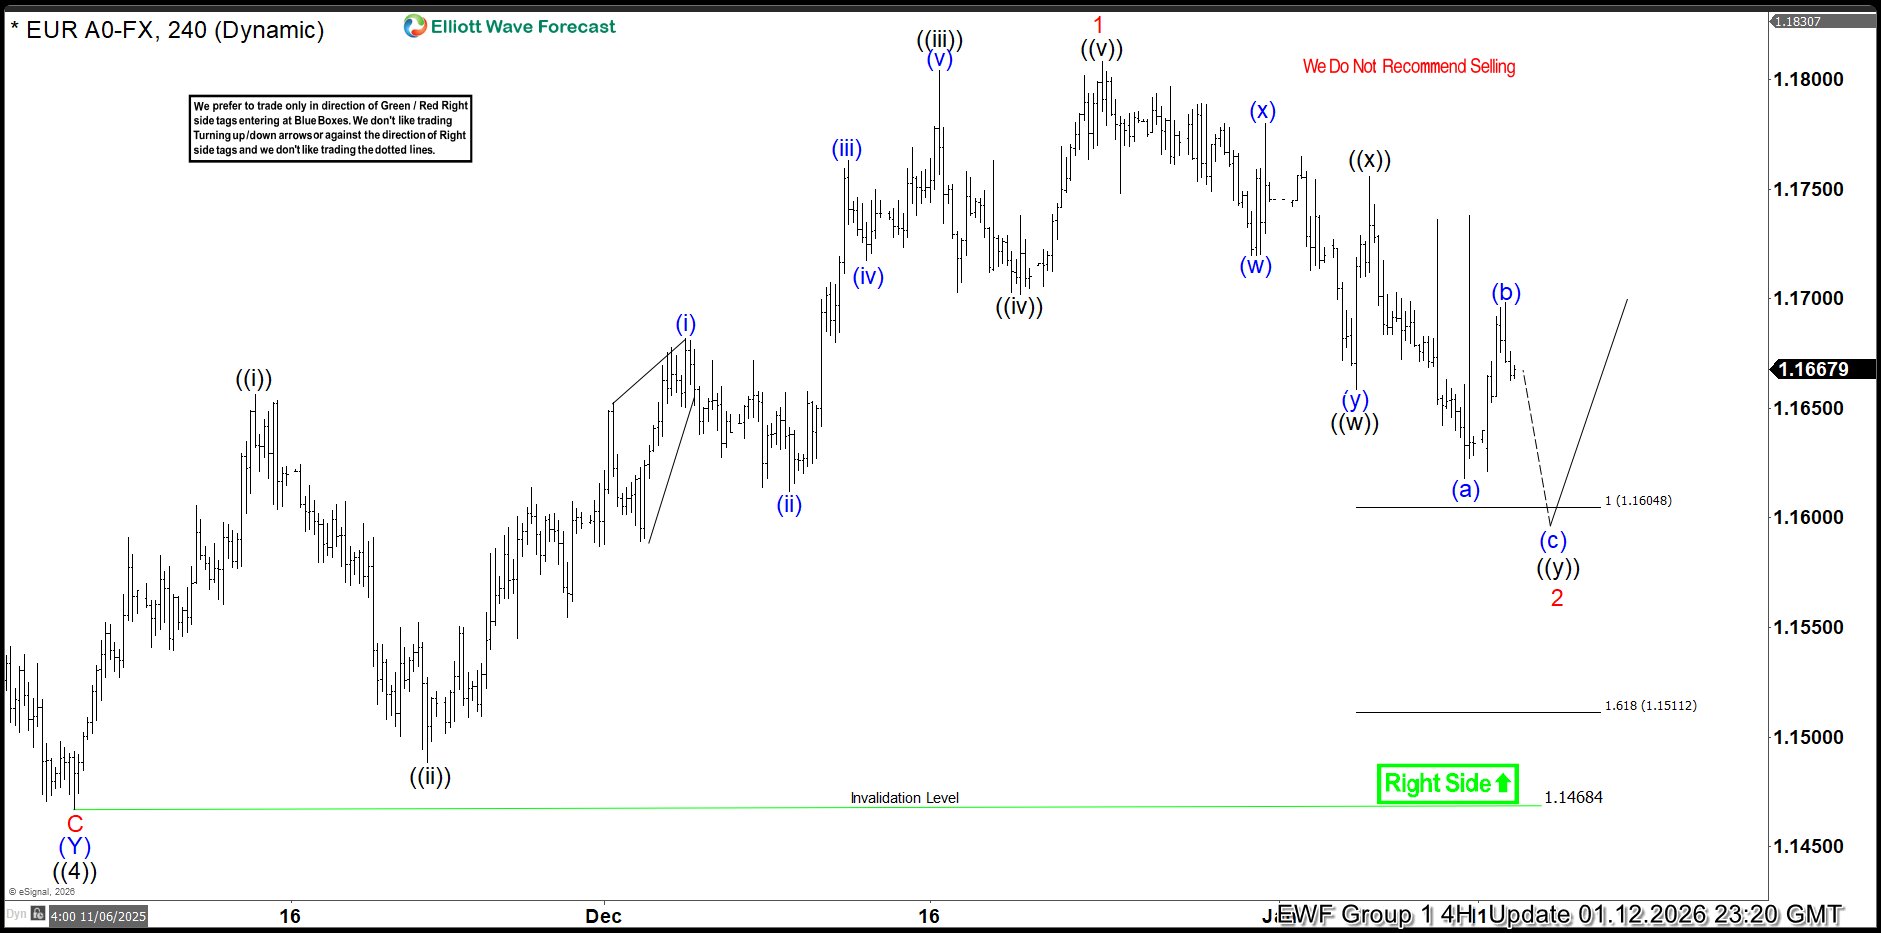
Hello fellow traders. In this technical article we’re going to look at the Elliott Wave charts of EURUSD forex pair published in members area of the website. The pair has recently given us Double Three pull back and found buyers again precisely at the equal legs area as we expected. In the following text, we’ll explain the Elliott Wave count.
EURUSD Elliott Wave 4 Hour Chart 01.12.2026
EURUSD is currently forming an intraday three-wave pullback from recent highs. We identified a buying zone by measuring the Equal Legs area using the Fibonacci extension tool, with ((w)) projected relative to ((x)). The ideal support area comes in at 1.16048–1.15112. The correction is not complete yet, and the pair could see more downside in the near term toward the marked buying zone. As long as price holds within this region, we expect buyers to step in and the rally to resume toward new highs.
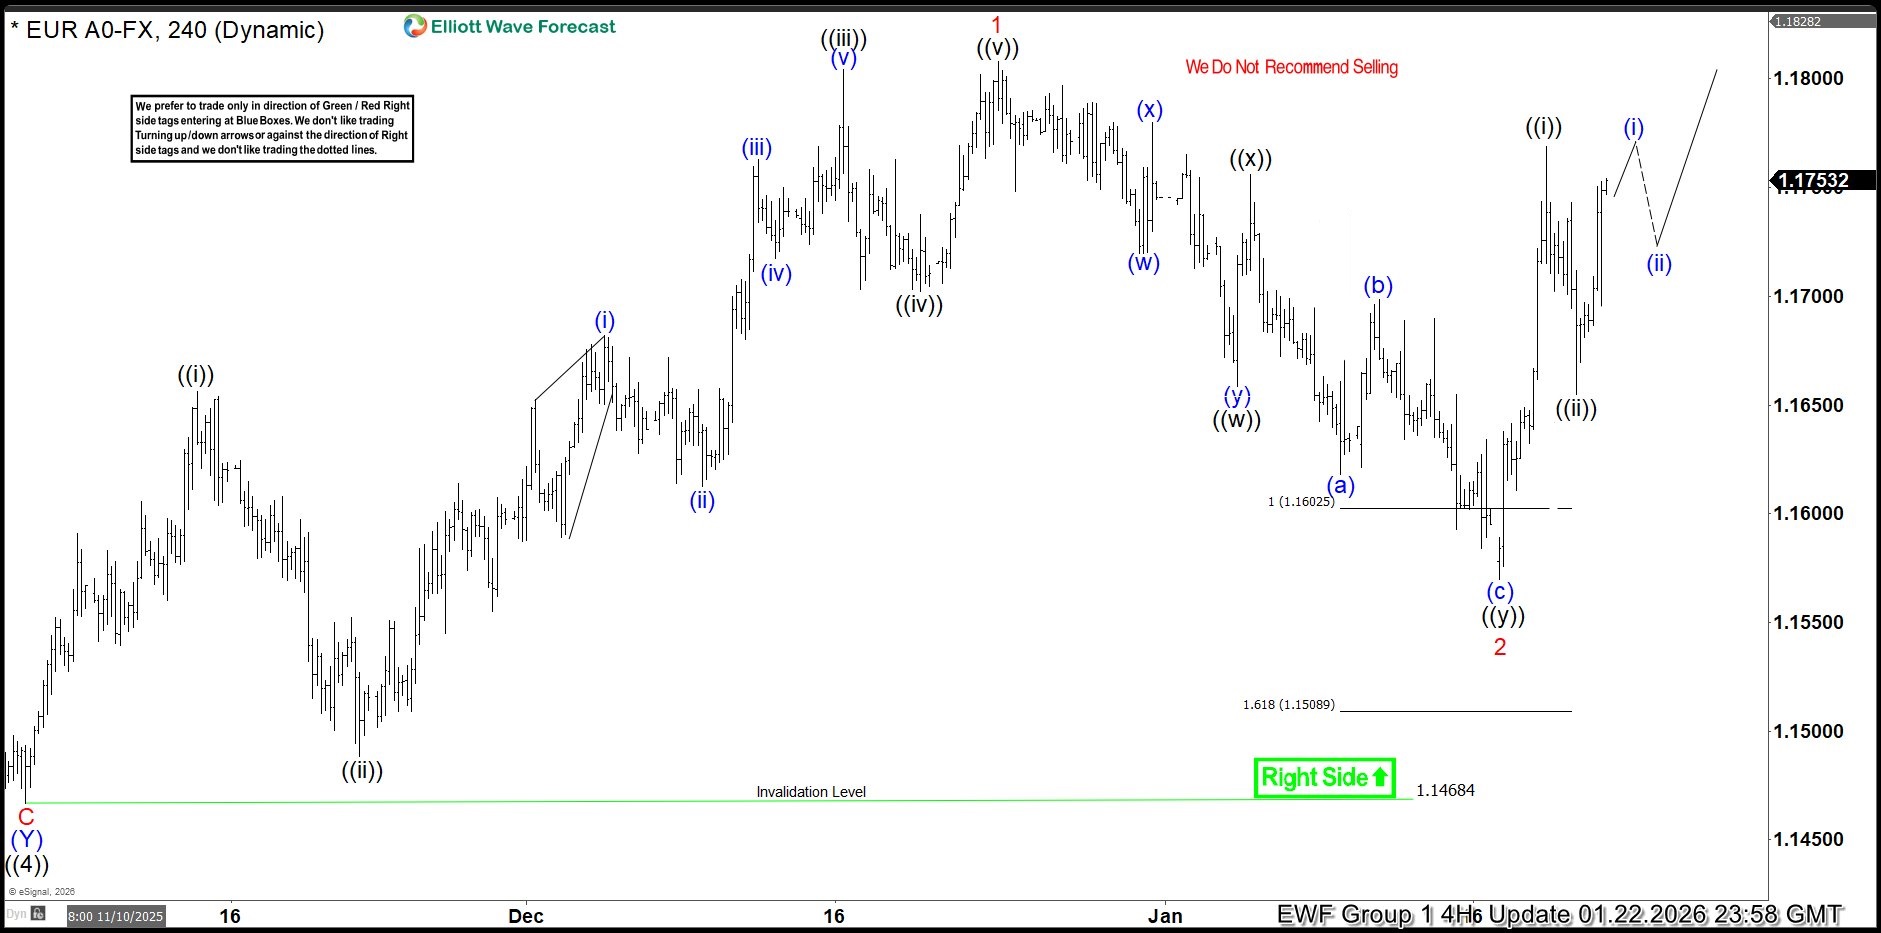
EURUSD Elliott Wave 4 Hour Chart 01.12.2026
The pair has found buyers at the Equal Legs zone , just as expected. The correction ended at the 1.15709 low, and since then, EURUSD is giving us a rally. As a result, any long positions from the equal legs zone are now risk-free.
EUR/USD Builds Upside Case As Bullish Signals Multiply
Key Highlights
- EUR/USD started a strong increase above 1.1800 and 1.1850.
- A few key supports are forming near 1.1810 and 1.1755 on the 4-hour chart.
- GBP/USD rallied above 1.3550 and 1.3620.
- Gold extended its surge to a new record high above $4,980.
EUR/USD Technical Analysis
The Euro found support near 1.1670 against the US Dollar. EUR/USD started a major increase after it cleared 1.1750 and 1.1800.
Looking at the 4-hour chart, the pair settled above 1.1800, the 200 simple moving average (green, 4-hour), and the 100 simple moving average (red, 4-hour). The bulls even pumped the pair above 1.1850.
The current price action suggests that the bulls could aim for more gains. Immediate resistance sits near 1.1900. A close above 1.1900 could open the doors for a move toward 1.1920. Any more gains could set the pace for a steady increase toward 1.1950.
If there is no move above 1.1900, there could be a pullback. On the downside, immediate support is near the 1.1850 level. The first major area for the bulls might be near 1.1800.
The main support sits at 1.1755, below which the pair could accelerate lower. The next support could be 1.1700 and the 200 simple moving average (green, 4-hour). Any more losses might call for a test of the 100 simple moving average (red, 4-hour) at 1.1680.
Looking at GBP/USD, the pair gained bullish momentum after it cleared 1.3550 and might continue to rise toward 1.3720.
Upcoming Key Economic Events:
- US Durable Goods Orders for Nov 2025 – Forecast +0.5% versus -2.2% previous.
- US Durable Goods Orders Ex Transportation for Noc 2025 – Forecast +0.3% versus +0.2% previous.
Volatility Rises as Gold Surges and Yen Intervention Speculation Grows
Gold continued to set new record highs last week, surging as volatility increased following comments from President Trump. His remarks about taking control of Greenland initially triggered a sharp sell-off in U.S. stocks, which later reversed after threats of tariffs on Europe were withdrawn. The U.S. dollar erased all of its gains from the start of the year, falling sharply as concerns grew about the direction of U.S. policy, even though U.S. GDP came in above expectations.
In Japan, the Prime Minister announced on Monday that an early parliamentary election would be held on February 8 to seek a fresh mandate for her new coalition. The government also proposed cutting the consumption tax on food (currently 8%) to 0% for two years, which unsettled investors and pushed bond yields higher. The Bank of Japan kept interest rates unchanged, and the yen weakened as markets priced in a slower pace of future rate hikes. Shortly afterward, USD/JPY fell sharply on reports that the BoJ was checking market rates ahead of possible intervention, prompting speculators to sell the pair.
Equities in the U.S. and Japan were under pressure for most of the week but managed to close with only modest losses.
Markets This Week
U.S. Stocks
Volatility increased in U.S. stocks last week after a sharp early sell-off triggered by fears over U.S. tariffs. The market recovered quickly, however, after President Trump backtracked on his comments. While the broader trend remains range-bound, price action is showing some signs of weakness. For now, the better short-term approach is to take advantage of the volatility by selling into strength and buying on dips until a clearer trend develops. Resistance is seen at 49,500 and 50,000, while support is located at 48,500, 48,000, 47,500, and 47,000.
Japanese Stocks
Concerns over Japan’s government finances ahead of next month’s election weighed on the Nikkei last week. The Bank of Japan meeting had little market impact, but rumors of possible currency intervention strengthened the yen and pushed the Nikkei lower by the end of the week. With the yen firming, the index may struggle to make new record highs in the near term, suggesting more sideways to slightly lower price action in the coming week. Resistance is seen at 54,000円, 54,500円, and 55,000円, while support is located at 52,500円, 51,500円, and 51,000円.
USD/JPY
USD/JPY rose for most of the week as concerns that the Japanese government may expand fiscal spending pushed bond yields higher. The Bank of Japan kept interest rates unchanged and offered little clarity on the timing of future hikes, allowing USD/JPY to climb above 159. Late on Friday, however, rumors that the BoJ was checking market rates ahead of possible yen-buying intervention triggered a sharp sell-off during London trading, with heavy speculative selling into the close. In the short term, the pair looks oversold, suggesting a potential recovery at the start of the week as markets look for confirmation of any intervention. However, confirmed action by the BoJ could send USD/JPY sharply lower. Resistance is seen at 157.5, 158, 159, 159.5, and 160, while support is located at 155.5, 155, 154.5, and 154.
Gold
Gold had a very strong week as a weaker U.S. dollar and President Trump’s comments increased geopolitical risks and boosted buying. Prices are now close to the $5,000 level, which could lead to short-term profit-taking. However, a clear break above $5,000 could trigger another sharp move higher. Over the medium term, the trend remains bullish, and buying pullbacks—especially toward the 10-day moving average—still looks like the better approach. Resistance is seen at $5,000, $5,500, and $6,000, while support is located at $4,900, $4,800, $4,750, and $4,700.
Crude Oil
WTI crude held recent gains above $60, supported by ongoing unrest in Iran and an improving technical picture, with the 10-day moving average now turning higher and providing support. As long as prices remain above $59, the outlook favors further upside. Resistance is seen at $65, $66.50, $70, and $75, while support is located at $59, $55, and $50.
Bitcoin
Bitcoin had a disappointing week, failing to test resistance at $100,000 as weaker risk appetite led to a pullback. The short-term outlook has turned bearish, but support near $85,000 is close and may hold in the coming week. Resistance is seen at $95,000, $100,000, and $105,000, while support is located at $85,000 and $80,000.
This Week’s Focus
- Monday: U.S. Durable Goods Orders
- Tuesday: Japan BoJ Core CPI, U.S. CB Consumer Confidence
- Wednesday: Japan Monetary Policy Meeting Minutes, Australia CPI, U.S. Fed Interest Rate Decision
- Thursday: U.S. Trade Balance and Factory Orders
- Friday: Japan Tokyo Core CPI and Industrial Production, Australia PPI, E.U. GDP, U.S. PPI and Chicago PMI
Volatility is expected to increase in the week ahead as gold challenges the $5,000 level and markets speculate on the timing of potential yen intervention by the Bank of Japan. Equities are likely to remain cautious amid the risk of renewed selling. The upcoming FOMC meeting will be in focus, with interest rates expected to remain unchanged, while U.S. Durable Goods Orders data on Monday could provide an early signal on economic momentum.