Sample Category Title
The Weekly Bottom Line: Davos De-escalation Supports Market Recovery
Canadian Highlights
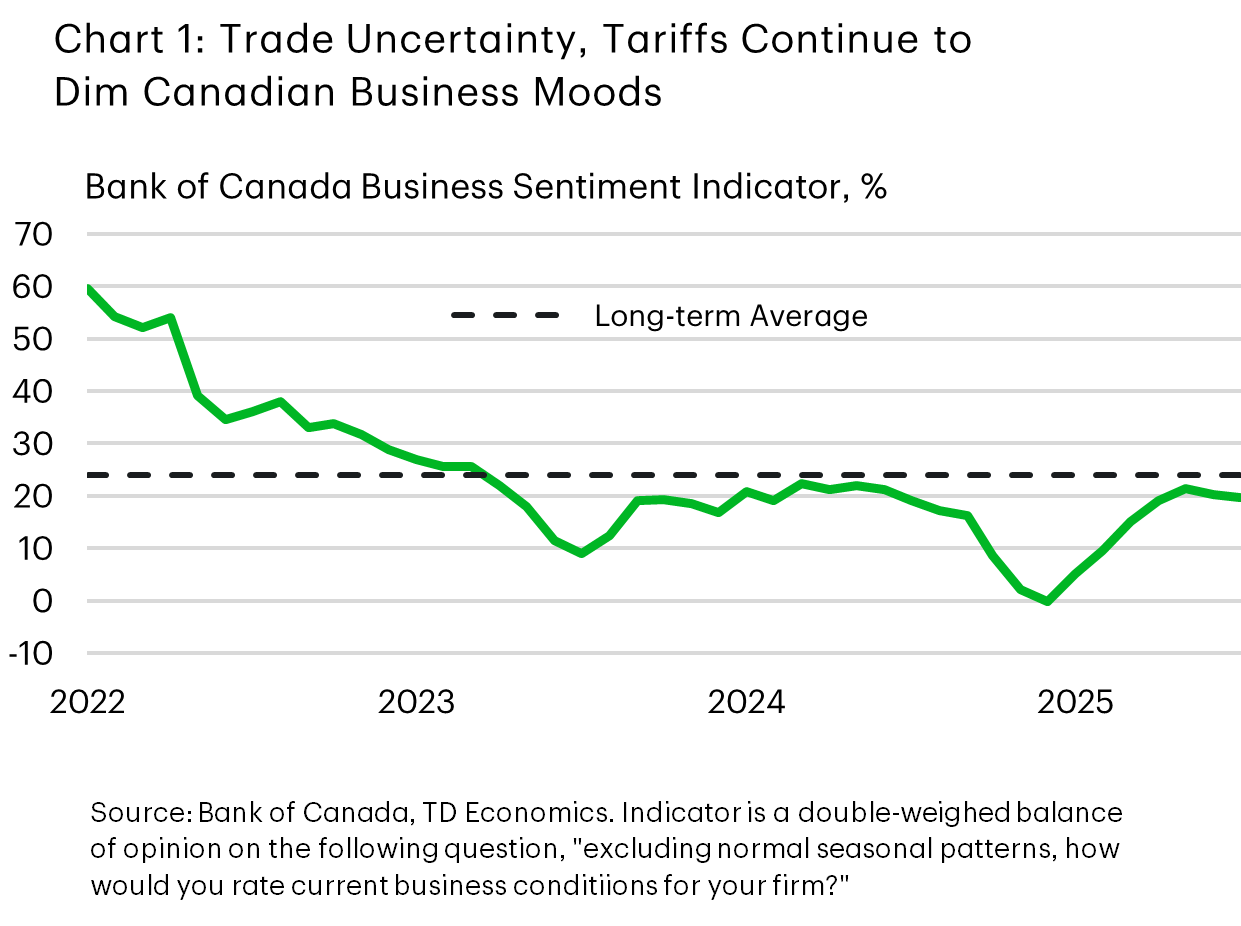
- The Bank of Canada’s business and consumer sentiment surveys continued to point to subdued moods amid economic uncertainty.
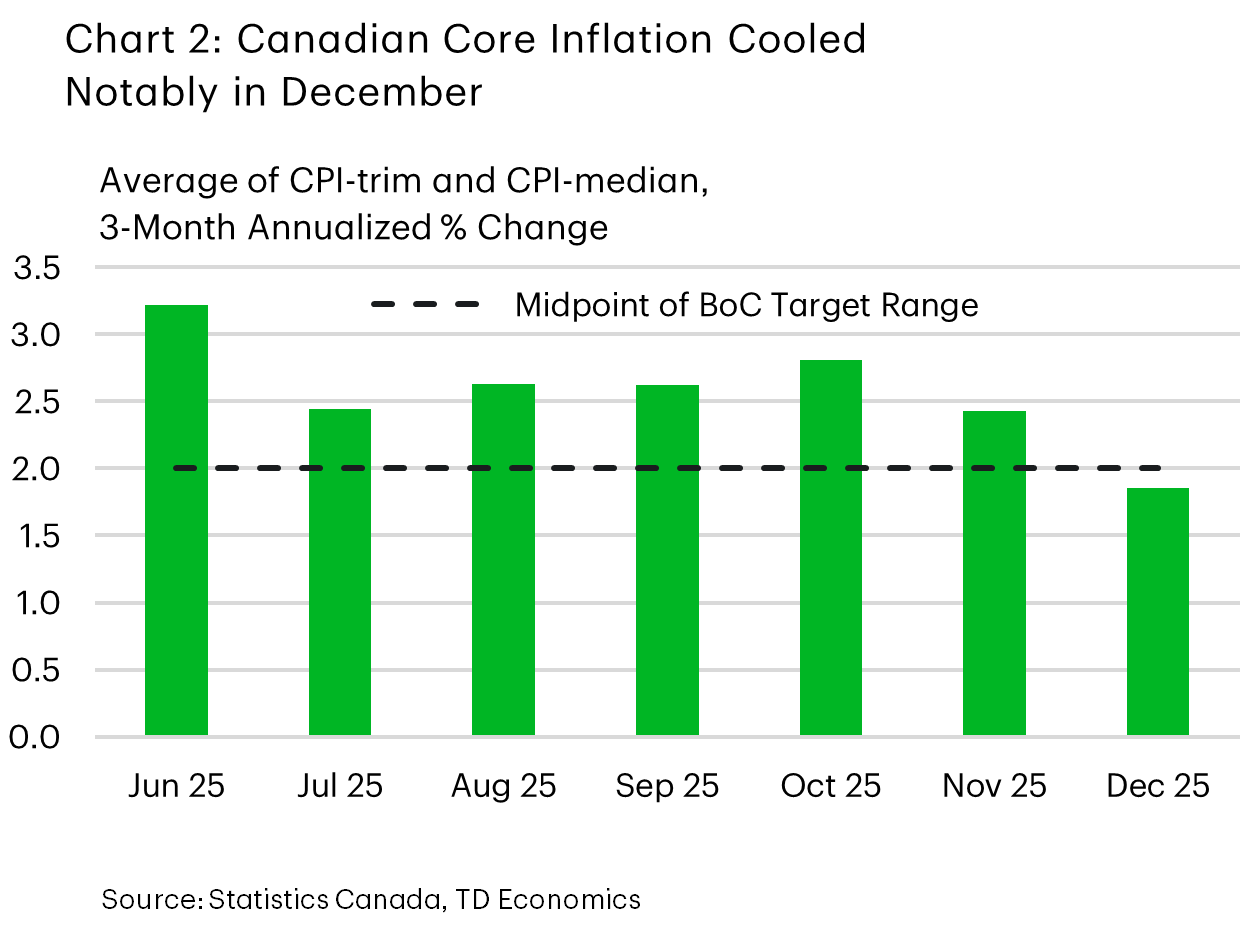
- Cooling core inflation metrics in December 2025 were likely well received by policymakers, even with an acceleration in overall inflation.
- Even with the headwind of uncertainty, Canadian consumer spending is holding up, with November retail trade volumes up 1% month-on-month.
U.S. Highlights
- Financial markets declined sharply on rising trade and geopolitical tensions but clawed earlier losses as cooler heads prevailed at the World Economic Forum in Davos.
- Consumer resilience carried into the fourth quarter, despite around 650,000 federal workers being furloughed without pay throughout the six-week long government shutdown.
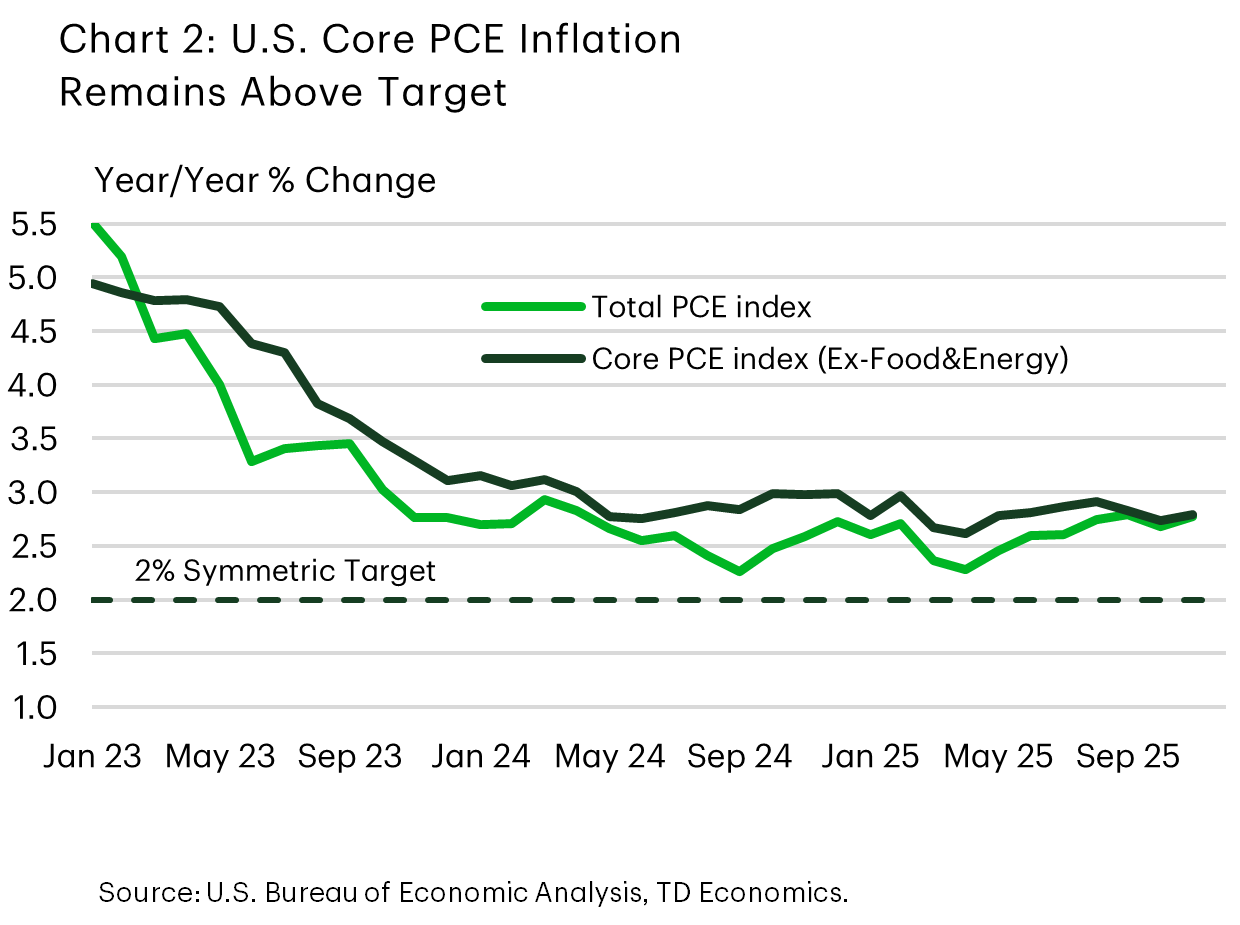
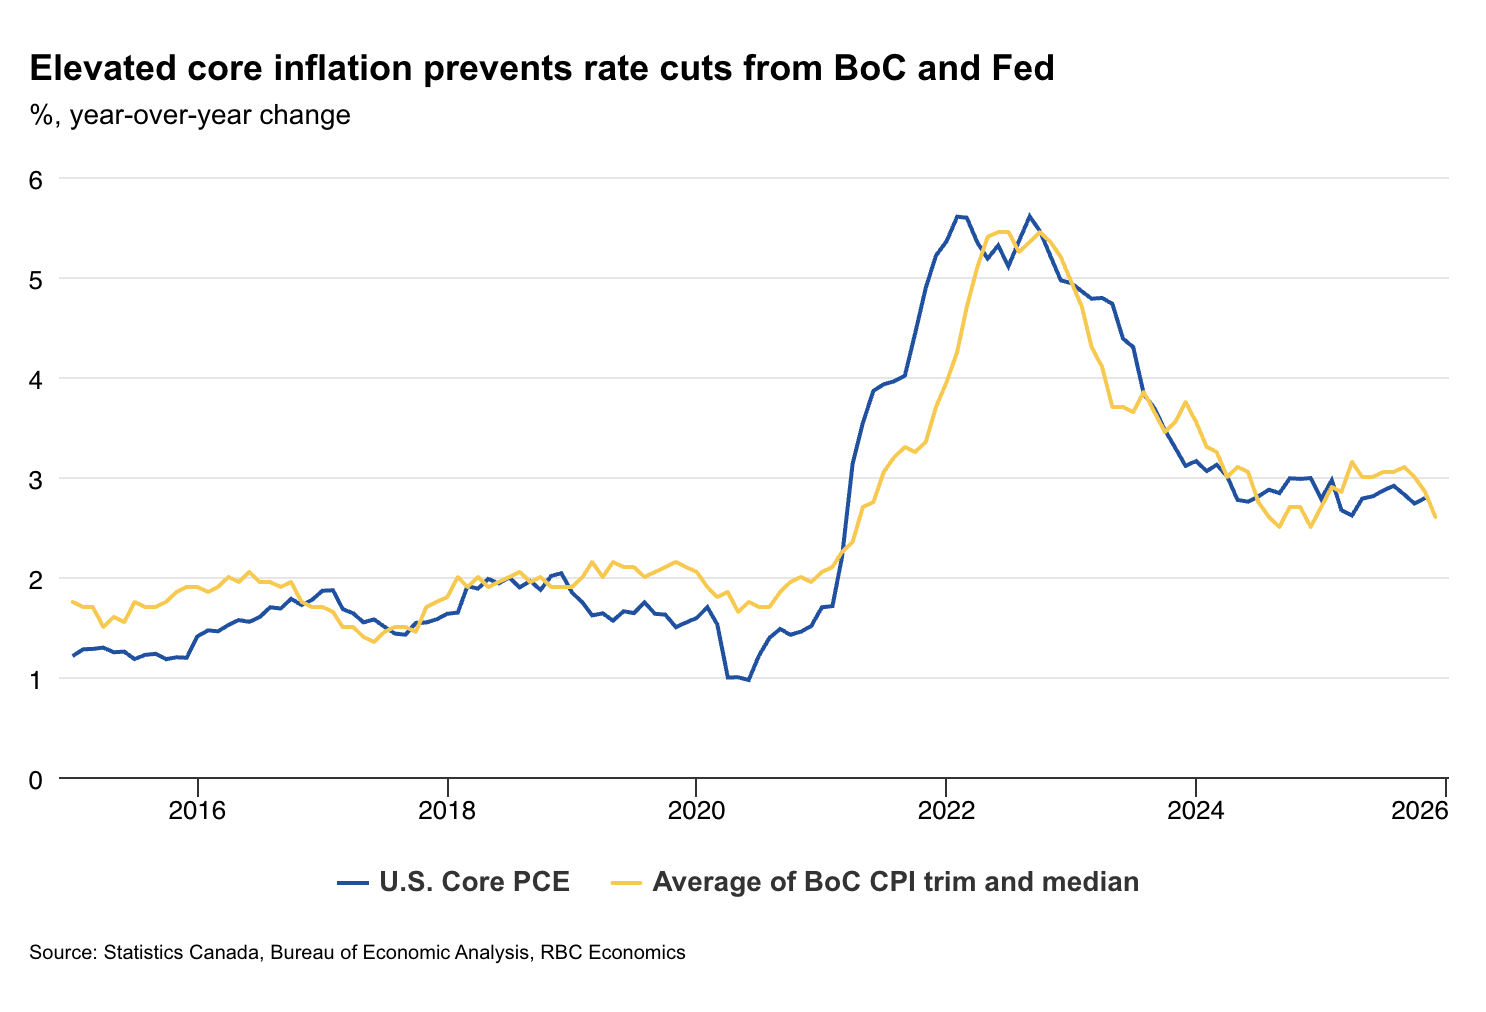
- Core PCE inflation rose to 2.8% year-over-year in November, a light acceleration form 2.7% in October.
Canada – Transatlantic Tensions Unsettle Markets
For financial markets this week, an appropriate statement may have been “what a year this week was”. The TSX, for instance, plunged early in the week on tensions between Europe and the U.S. over Greenland. It then staged a relief rally, more-than-fully recouping those losses after President Trump eased fears of military action in the region and a renewed trade war with Europe. Canadian bond yields were also volatile, flaring higher alongside the spike in Japanese bond yields and geopolitical tensions, before pulling back a touch, as cooler heads prevailed on the Greenland issue.
These events reinforced that Canada continues to deal in an uncertain economic backdrop, and this will likely be a factor restraining economic activity in 2026. This uneasiness has certainly been weighing on consumer and business moods, and we received fresh evidence of this impact this week with the latest Bank of Canada surveys on business and consumer confidence. Although showing some improvement relative to early 2025, business sentiment continues to be “subdued” (Chart 1). The uncertainty caused by the trade war continues to weigh on investment intentions, consistent with the pullback that we are seeing in the hard data. Consumers are also concerned about trade uncertainty, though actual spending remains decent. This week’s retail spending report showed a healthy 1% monthly gain in volumes. And, although retail sales are tracking flat for Q4 overall, we see some upside risk to our fourth quarter consumption forecast, on the back of stronger services spending.
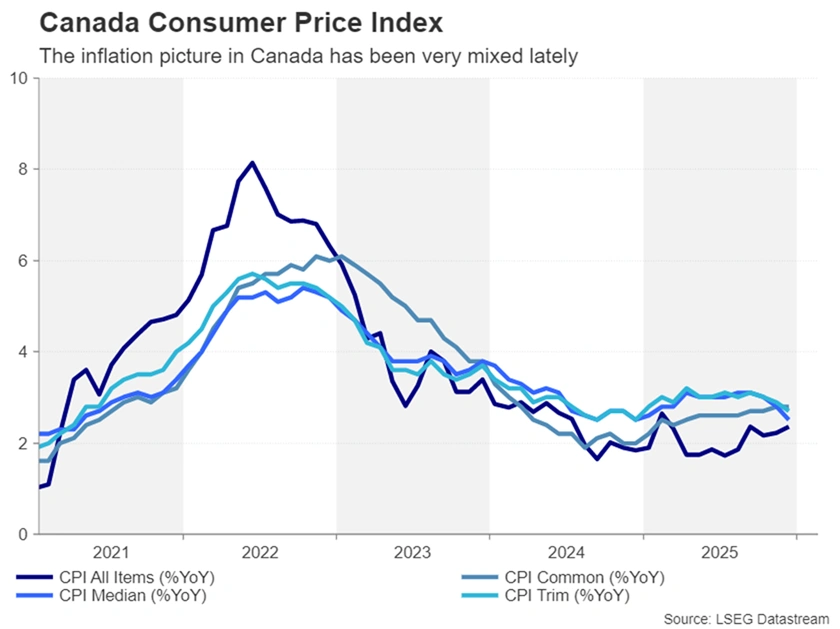
High prices were also a top concern for consumers in the Bank’s latest survey. However, there was some good news on this front this week. The Bank’s preferred core inflation metrics cooled in December (Chart 2), with the 3-month annualized percent change for the CPI-trim and CPI-median both ducking under 2%. What’s more, the share of items whose prices grew at 3% or more dropped (when measured on the same basis) - signaling a narrowing breadth of inflation across categories. However, the report wasn’t a complete slam dunk, as overall inflation increased by more than expected on the back of stronger food prices.
Tying these threads together, this week painted a picture of a soft underlying Canadian economy with moderating inflation pressures that still faces significant uncertainty. While this was enough for markets to slightly pare back their expectations of a rate hike later this year, we don’t think it was enough to meaningfully shift the policy dial. The Bank has repeatedly said that they are happy with the current policy stance, provided the economy evolves broadly in line with expectations. And, at 2.8%, core inflation landed almost bang-on the Bank’s expectation for 2025Q4. Indeed, it would take a significant undershooting of economic growth or meaningful softening in the labour market to force policymakers off the sidelines.
U.S. – Davos De-escalation Supports Market Recovery
Financial markets experienced considerable volatility this week amid resurgent geopolitical and trade frictions. President Trump ramped up the pressure to ‘acquire’ Greenland ahead of the annual World Economic Forum in Davos. He announced tariffs on eight European countries that resisted these efforts. This set into motion retaliatory efforts, with the EU suspending the ratification of the U.S.-EU trade agreement. Global financial markets fell sharply, as did the trade-weighted U.S. dollar and Treasury prices. Relief emerged during the Davos meetings. During his speech, President Trump ruled out military action on Greenland. He subsequently announced that a “framework on a future deal” had been reached and dropped earlier tariff threats. Markets responded strongly, with the S&P 500 recovering nearly all its intra-week declines.
Stepping back from market swings, the episode reveals deeper geopolitical and economic implications. While tensions have eased, significant uncertainties remain. Details on the proposed framework on Greenland are limited, appearing to center on mineral rights extraction and potential integration into the planned Golden Dome missile defense system. Denmark and its allies firmly oppose any outcome that compromises territorial sovereignty, raising the risk of future bouts of escalation. Additionally, this week’s events bring into question the stability of the trade deals that have been negotiated thus far. The sudden announcement of tariff threats undermined recently negotiated agreements with the U.K. and the EU, chipping away at the predictability these pacts were meant to secure. Such policy volatility undermines business and investor confidence, which underpins forecasts for improved U.S. growth in 2026.
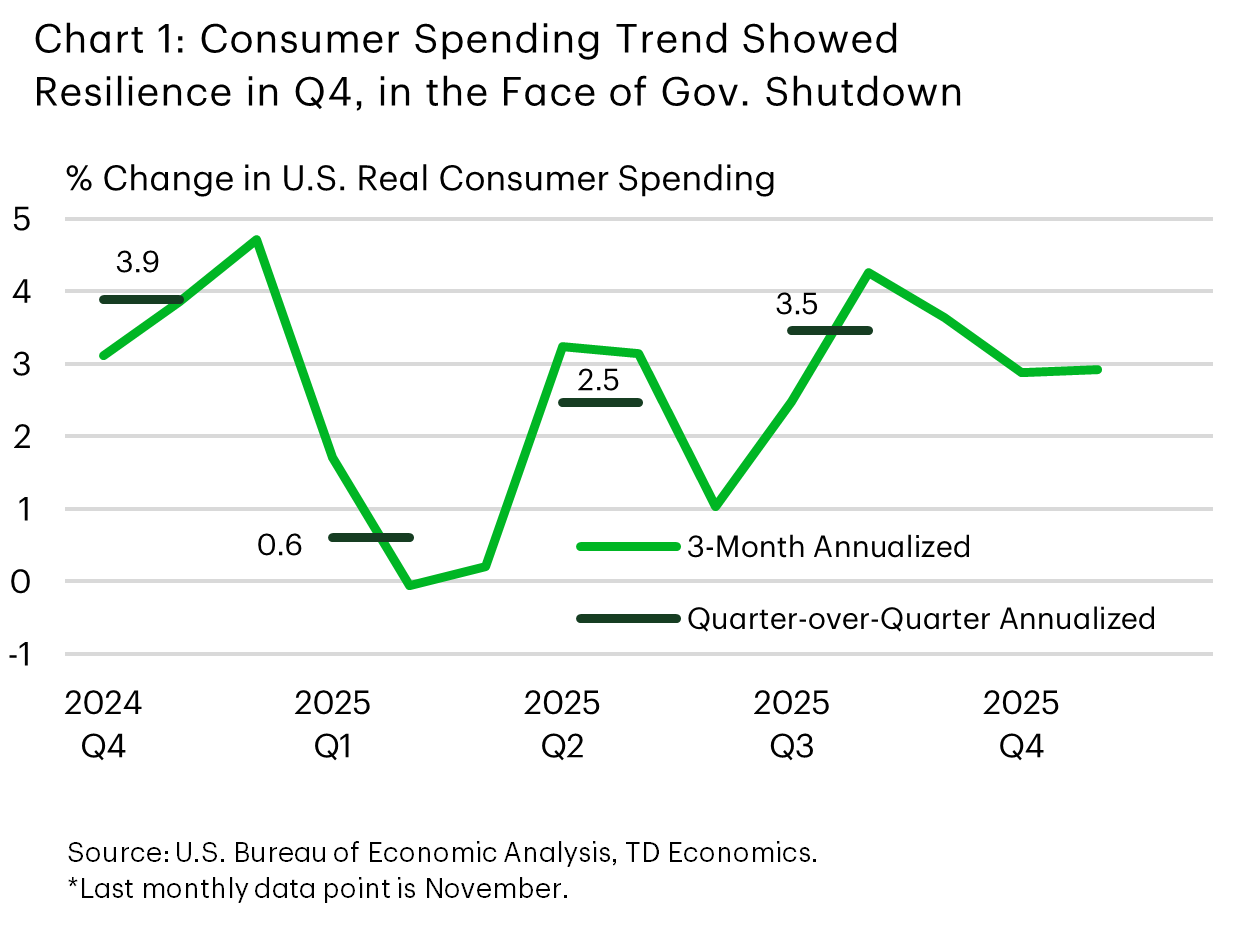
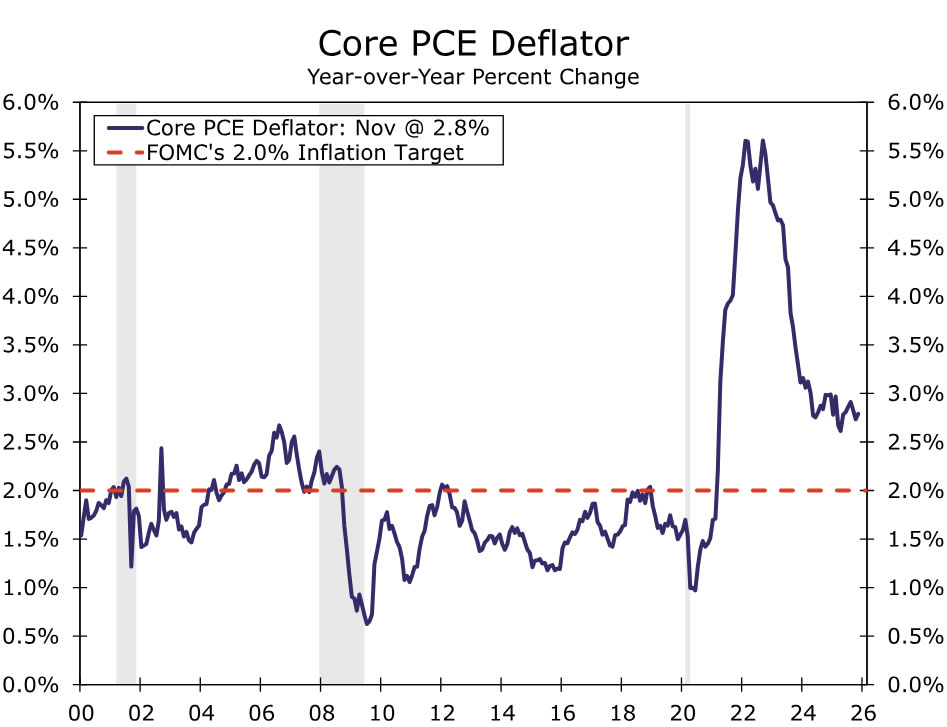
A light U.S. economic data calendar took a backseat to Greenland developments, yet the released figures highlighted resilience. The first revision to third-quarter GDP lifted annualized growth to 4.4% from 4.3%, reflecting upward adjustments in exports and business fixed investment. Consumer spending remained unchanged at 3.5%, but the trend in the fourth quarter appeared to remain healthy. The delayed October and November PCE reports pointed to greater household endurance through the extended government shutdown than initially anticipated (Chart 1). This recent data brings our tracking for consumption in the fourth quarter to 3% – stronger than previously expected. Inflation, however, tempered the positive tone. Core PCE inflation – the Fed’s preferred inflation gauge – rose to 2.8% year-over-year in November from 2.7% in October, remaining firmly above the 2% target (Chart 2).
Overall, the U.S. economy enters 2026 on firmer ground than previously expected, bolstered by upward growth revisions and a resilient consumer. Yet this week’s swift escalation and de-escalation raise a fundamental question: can trade agreements be considered truly settled when they remain vulnerable to unilateral changes? Trade frictions – previously expected to fade and support growth – may persist longer than anticipated, with this week’s events a clear reminder of that.
Weekly Economic & Financial Commentary: Economic Growth Sturdy Ahead of the January FOMC
Summary
United States: Economic Growth Sturdy Ahead of the January FOMC
- Davos delivered news of cooling trade tensions thanks to a deal for the U.S. to gain greater access to Greenland. Meanwhile, solid consumer spending during October and November despite slower income growth suggests economic growth remains on a positive trajectory.
- Next week: Durable Goods (Mon.), FOMC Meeting (Wed.), Trade Balance (Thu.)
International: Cross-Currents Emerge in China's Economy
- December activity put a brighter spotlight on how sluggish consumer activity has been, yet industrial production and manufacturing remain resilient across China’s economy. As these cross-currents persist and authorities offer little in terms of policy support, we expect the Chinese economy to soften relative to last year and for growth prospects to dwindle over time.
- Next week: Bank of Canada Policy Rate (Wed.), Brazil Selic Rate (Wed.), Central Bank of Colombia Rate (Fri.)
Fed Preview: Temporary Pause on Rate Cuts
- We expect the Federal Reserve to maintain its monetary policy unchanged next week, in line with broad consensus and market pricing.
- The Fed will not publish updated projections, so the focus is strictly on Powell's remarks. We do not expect new guidance on the reserve management purchases or other balance sheet considerations.
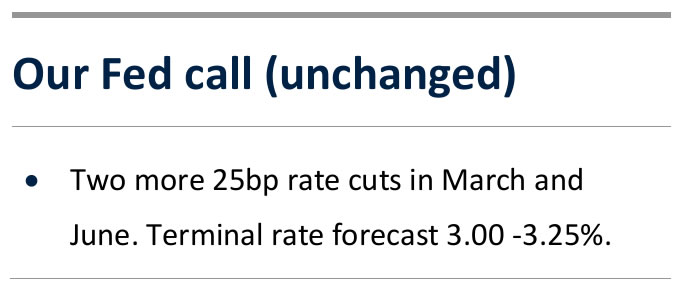
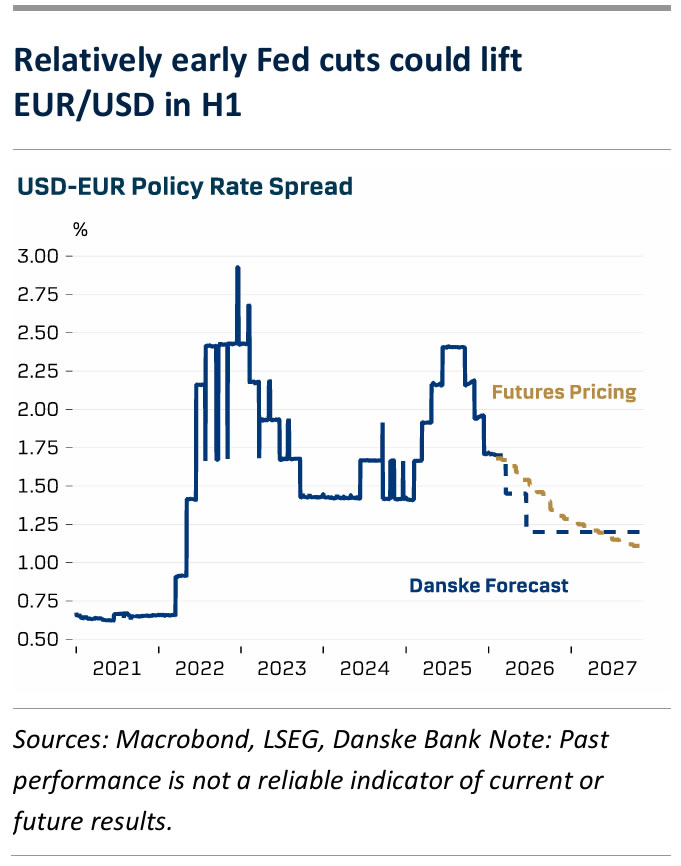
- We maintain our forecast for two more Fed cuts, in March and June, slightly ahead of market pricing. We continue to expect steeper UST yield curve and higher EUR/USD over the course of 2026.
Despite the recent geopolitical volatility, the Fed's January decision looks like a fairly clear-cut case. Powell communicated well in advance that unless warranted by significant macro surprises (which we have not seen), the Fed would be taking a pause in its rate cutting cycle in January - and we have no reason to doubt that.
In our view, the Fed has room for cutting rates later in H1 due to the ongoing cooling in labour market balance. The ratio of job openings to the number of unemployed fell to 0.92 in November - the weakest level since March 2021. The cooling has weighed on workers' bargaining power, which is clearly visible in job switchers earning no higher salary increases than those staying in their jobs. Inflation pressures from firms' unit labour cost have eased significantly, and instead, higher unemployment and weaker wage growth could pose downside risks to growth forecasts.
We still forecast a solid 1.8% increase in real GDP for 2026 in comparable Q4/Q4 basis (the Fed's Dec median projection: 2.3%, Reuters Dec consensus: 2.2%). But even so, we think the balance of risks favours continuing the cuts sooner rather than later. The latest comments from FOMC participants remain highly divided in their risk assessment. Bowman (voter) said that she remains 'concerned about labour market fragility' and that firms could start 'shedding workers unless there is a demand improvement'. On the other hand, last year's most hawkish voter, Jeffrey Schmid (non-voter in 2026), warned that the Fed has 'no room to be complacent on inflation'.
Market pricing, which also signals 1-2 rate cuts but only from summer onwards, could naturally reflect the new Fed chair starting in May. But with regional Fed nominations already confirmed, and the risk of Supreme Court allowing Trump to fire Lisa Cook declining after this week's hearing (see WSJ), we do not expect the upcoming nomination(s) to have a significant impact on the balance of power in the committee.
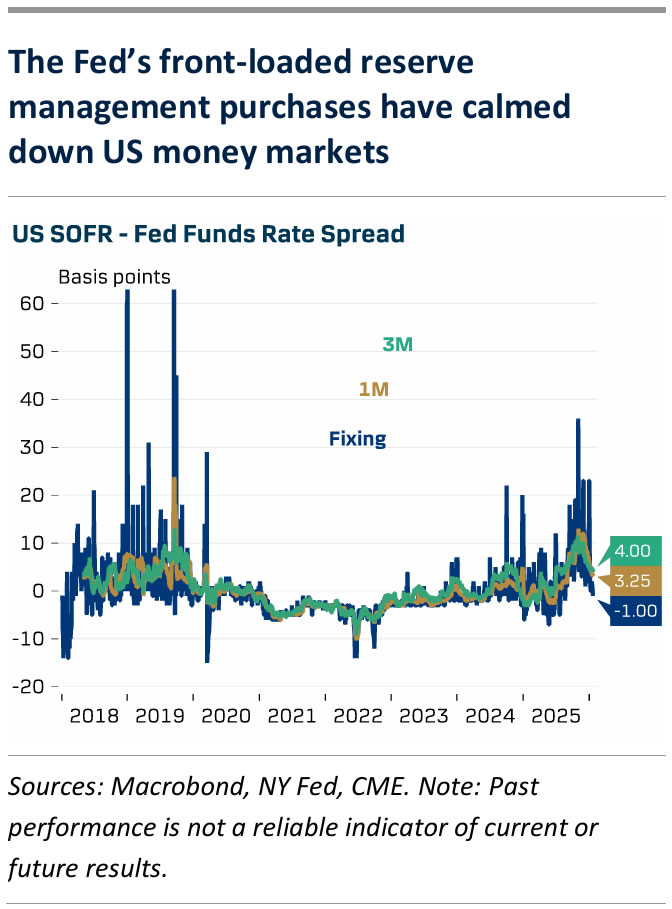
In our view, the voter rotation for 2026 can still have a marginally hawkish impact with Beth Hammack, Neel Kashkari and Lorie Logan now entering as new voters. We do not expect the Fed to announce new changes to its liquidity policies after the front-loaded reserve management purchases have calmed down US money market rates. We expect the Fed to continue T-bill purchases at a pace of USD40-50bn/month until April, after which the pace will be slowed down substantially.
FOMC Preview: On Hold Until When?
Summary
The FOMC is widely expected to leave the fed funds rate unchanged at its January meeting. There will be no update to the SEP at this meeting, and we expect the post-meeting statement and press conference to signal maximum flexibility as the Committee strives to keep its options open. Our forecast remains for two 25 bps rate cuts at the March and June meetings, but the risks to our forecast look increasingly skewed toward later and possibly less easing this year. In fact, given our view on how economic growth will evolve this year, there is a sound argument that the longer the FOMC waits to cut, the higher the hurdle becomes to justify on economic grounds the need to ease further.
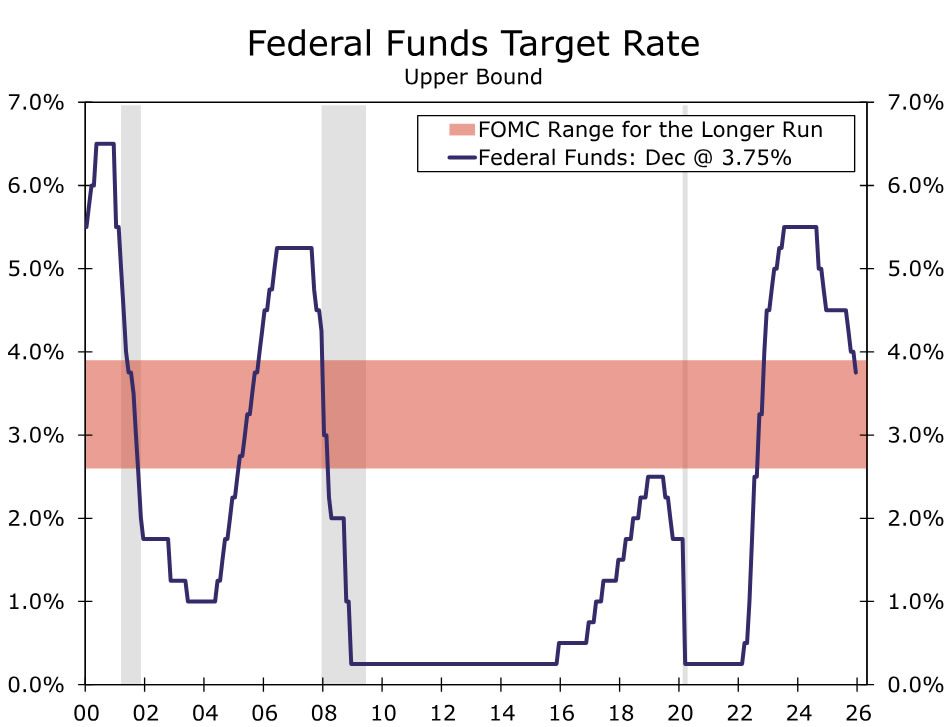
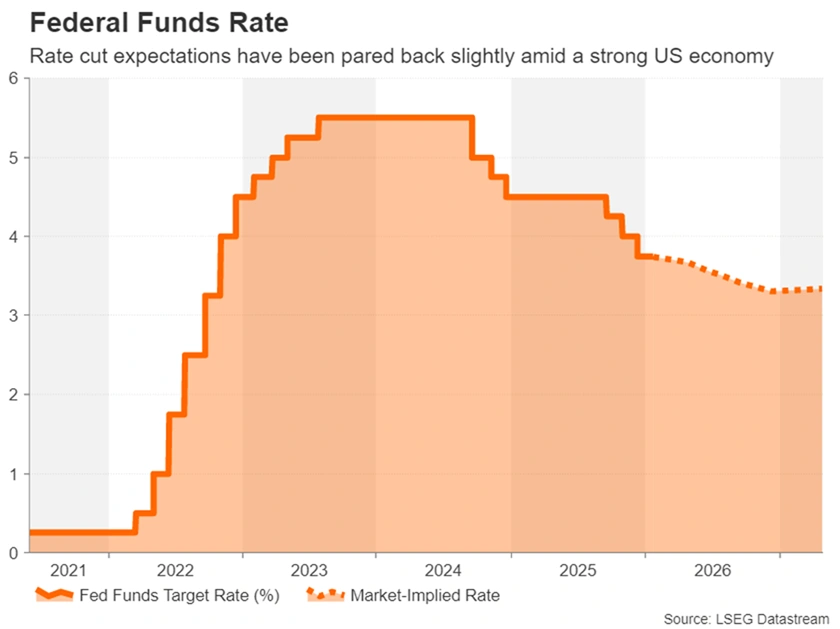
We anticipate the FOMC will leave its policy rate unchanged at 3.50%-3.75% on January 28. The FOMC's prior meeting in December concluded with the Committee's third consecutive 25 bps cut. In a relatively close decision—the dot plot revealed six policymakers would have preferred to hold the policy rate steady—the FOMC also signaled the bar for additional easing would be higher going forward.
The higher bar for additional easing comes as the fed funds rate is now back in the vicinity of neutral, i.e., the policy rate that is neither restrictive nor accommodative (Figure 1). Disagreement over the neutral rate is one key factor driving divergent views on the FOMC about the appropriate path of policy.
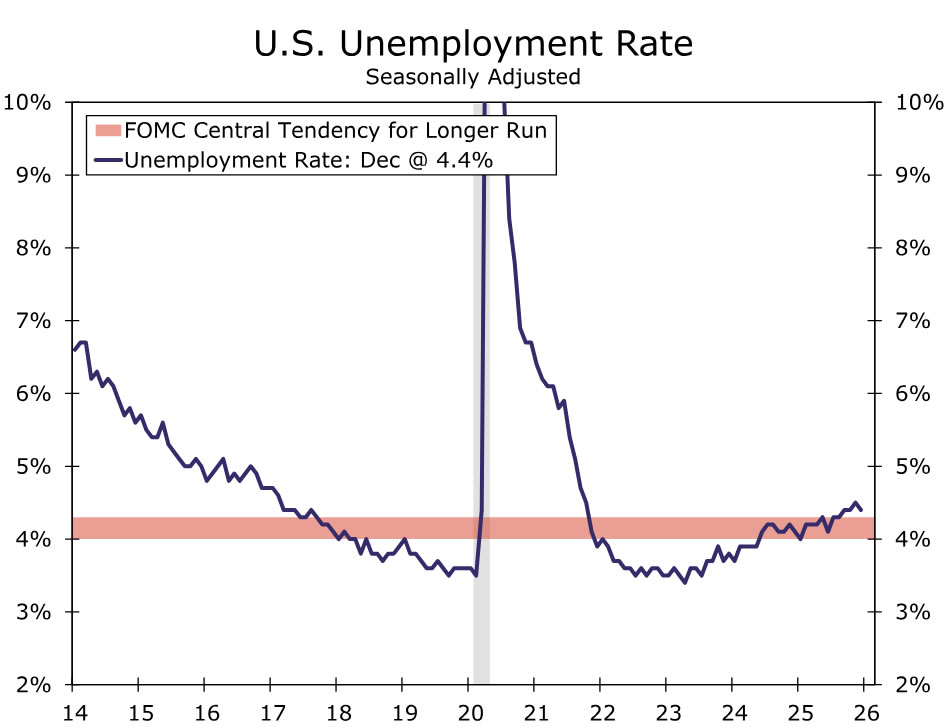
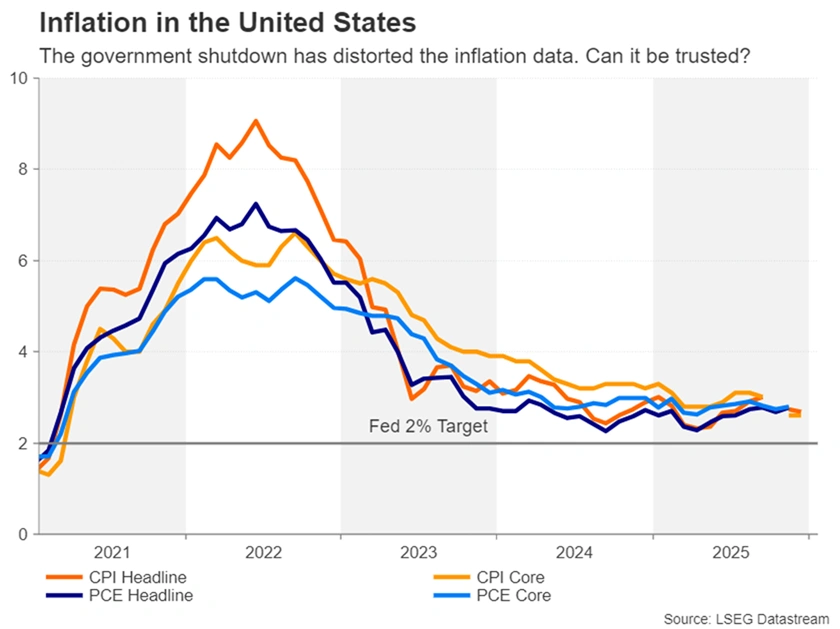
Another point of disagreement is how to weigh the balance of risks with inflation still above target and unemployment slightly above most estimates of full employment (Figures 2 & 3). At 4.4%, the latest unemployment rate is unchanged from when the FOMC last met. The inflation picture looks modestly improved even accounting for shutdown-related quirks. We estimate core PCE inflation was 3.0% yr./yr. in December, the same as December 2024 despite the lift to goods prices from tariffs last year.
There will be no updated Summary of Economic Projections, but we expect the statement to reflect the more stable balance of risks to the dual mandate. For example, it could remove the line that the FOMC "judges that downside risks to employment rose in recent months" and the reference to "the shift in the balance of risks" when discussing its policy decision. We also see the possibility for the statement to no longer say that "inflation has moved up since earlier in the year" when discussing recent economic conditions, and merely maintain that it "remains somewhat elevated."
The post-meeting communications are also likely to emphasize the cumulative amount of easing undertaken over prior meetings that allows for any additional policy changes to be made more slowly. We do not expect Chair Powell to hint in the press conference that further easing is likely to come at the FOMC's next meeting on March 18 given the range of participants' views and the desire to keep options open. It is likely that Chair Powell will be asked about the DoJ's investigation, but we expect him to respond that he has already said what he has to say on the matter.
Since September, our forecast has been for the FOMC to reduce the policy rate to 3.00%-3.25% in 2026, with two 25 bps cuts in March and June. With two more months of employment and inflation data released before the March meeting, we are not changing that assumption at this time. That said, the risks to our call look increasingly skewed toward later and possibly less easing this year. Our latest forecast looks for underlying growth to firm over the spring and summer as fiscal support and prior monetary policy easing bolster economic activity and help the labor market stabilize (Figure 4). That will leave a narrow window for the Committee to ease further this year.
As Trump Sets Sights on Greenland, What are the Risks for the Markets?
- Trump goes all out to gain control of Danish territory of Greenland.
- NATO ties become strained as Trump uses tariffs to ‘blackmail’ allies.
- But would Trump use force to seize Greenland and how would markets react?
Trump’s ‘large real estate deal’
It’s no secret that Donald Trump has had his eye on Greenland – an autonomous territory of Denmark – for some time. The President first expressed a desire to buy the giant glacier-covered island back in 2019 during his first term at the White House. Trump said the US acquisition would be like a “large real estate deal”. Unsurprisingly, the response from the islanders was that they are not for sale. Luckily for them at the time, Greenland was “not No1 on the burner” for Trump. But it is now.
Hot on the heels of Washington’s intervention in Venezuela whereby President Maduro was dramatically captured and flown out of the country, Trump seems hungry to flex America’s muscles even further. So why all the interest in Greenland?
The Arctic’s growing strategic importance
Trump is claiming that the territory is crucial for US and world security, as its location in the Arctic Circle would hand Washington control over vital northern shipping routes that Russia and China are also trying to mark as their own.
The President does have a point. The melting of Arctic ice due to climate change is making these shipping lanes more accessible, and with Russia and China becoming increasingly active in the region, even carrying out joint patrols, Trump is right to be worried.
A reduced military presence
Certainly, Denmark and its European partners haven’t done enough in recent years to shore up Greenland’s defences and boost their military presence in the Arctic. But the US is just as much to blame. There used to be 10,000 military personnel housed on the island at the height of the cold war, most of them at the Pituffik Space Base on the northwestern coast. But that figure has fallen to just 150 now.
This then raises the question of why Trump feels the need to take over Greenland. If the US already has a military base there, then surely increasing its troop numbers and agreeing with other NATO countries to do the same would solve the security issue?
Greenland’s hidden riches
Most likely, Trump’s strong interest in the island has a lot to do with the fact that Greenland is rich in rare earth minerals. There’s currently a global race by countries to get their hands on these critical minerals, as demand has surged due to their use in a vast array of technology products such as mobile phones, electric cars and solar panels.
With about 70% of the world’s rare earth supply being mined in China, having control over Greenland’s natural resources would give the US a much-needed advantage. The Trump administration is already not happy about the leverage that China holds in trade negotiations by limiting the export of these highly sought minerals.
Tariffs back on the table
But is it right for Trump to pick a fight with his closest allies just so to achieve his objective at any cost? Eight European countries, including Denmark, the United Kingdom, Germany and France, were threatened with additional US tariffs of 10% as of February 1, rising to 25% from June 1, because they are opposed to the idea of the US acquiring Greenland against the will of its people.
Trump later climbed down on those threats after progress was made in talks with NATO towards a framework deal. But there can be no doubt this was just another negotiating tactic, betting that these countries will cave in before long. However, it’s unlikely that the key European powers will ever agree to a complete handover of Greenland to the United States. Hence, there’s a very real risk of a major NATO rift forming that could possibly lead to the eventual breakup of the North American and European military alliance.
This would leave Europe extremely vulnerable against adversaries such as Russia and China, while a full-blown trade war with America could cripple its economies. Yet, investors’ immediate concern was about what such action by Trump would mean for the American economy.
‘Sell America’ is back on
The return of tariff headlines has revived the ‘sell America’ trade, which first became a phenomenon in April 2025 when the imposition of levies against almost every nation by Trump triggered a loss of confidence in US assets, with investors dumping Treasuries, Wall Street stocks and the dollar.
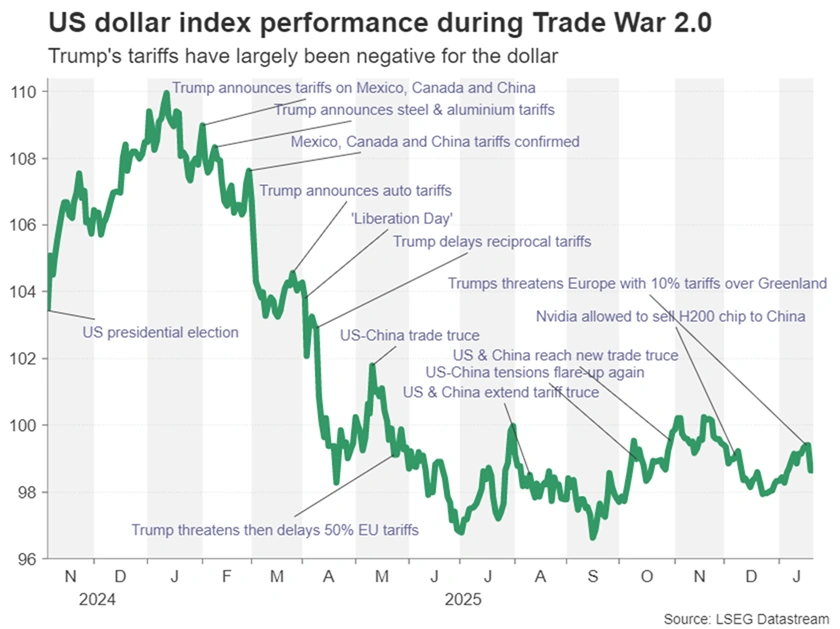
Trump’s very aggressive rhetoric and non-negotiable stance towards America’s long-time friends and allies have once again led investors to question the soundness of the President’s policies, sending the dollar into a spin. In contrast, European currencies such as the euro, pound as well as the Danish krone gained against the greenback during the initial reaction.
New risks for the global economy
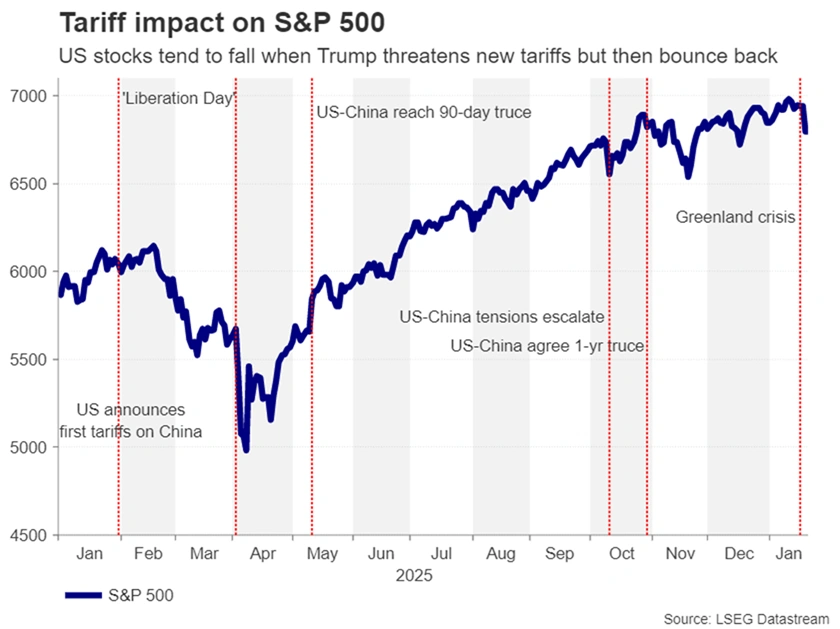
US stocks also took a tumble, but so did European shares, as a fresh tariff salvo risks clouding the otherwise mostly positive outlook for 2026.
Although the UK has opted to reason with Trump quietly behind the scenes, the European Union isn’t taking any chances and is preparing retaliatory measures and counter tariffs as a contingency plan, signalling a readiness to escalate the row. Regardless of this, in the event that Trump does not back down on his demands and starts a new round of cross-Atlantic trade war, this would almost definitely shave some percentage points off GDP growth in both regions.
Winners and losers
This suggests that the ‘sell America’ impact on the dollar would probably be short-lived and currencies like the euro would soon start to feel the heat from any deterioration in Eurozone economies.
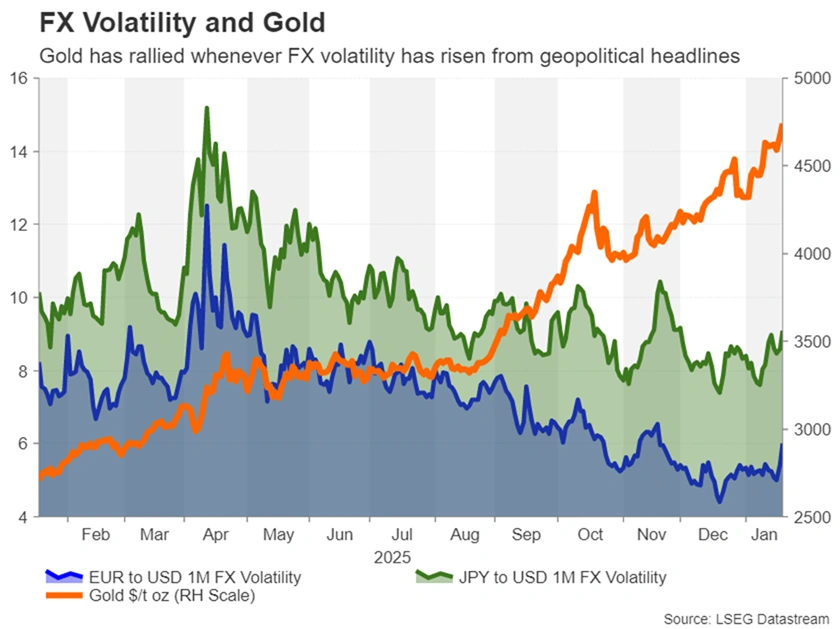
But the dollar is still vulnerable as Trump’s attempt to reshape the world order could accelerate the de-dollarization trend and push investors and central banks even more towards gold and other precious metals.
For corporate America, the AI boom and Wall Street’s global dominance in the sector would likely be enough to keep the bullish momentum alive, and in the worst-case scenario of military intervention, prevent a too heavy bloodbath. The latter case would also boost defence stocks and potentially mining stocks too.
Is Canada next on Trump’s conquest list?
The danger for the markets and the world is that the US taking Greenland by force isn’t actually the worst-case scenario, as Trump is unlikely to stop there were he to succeed. The President has often joked that Canada should become the United States’ 51st state and so, as unlikely as it sounds, an invasion is not something that’s completely out of the realm of possibility.
Trump seems intent on controlling the entire Arctic region in his own backyard and the next few weeks will be important in understanding how far he’s willing to go to get his wish. But is Europe powerless to stop him?
Europe in a bind
European investors hold more than $10 trillion in US assets, including $3.6 trillion in US Treasuries. Weaponizing these assets by selling US government bonds, for example, could inflict significant damage by pushing up Treasury yields, making it more difficult for the Trump administration to borrow money.
Such action would probably cause havoc in global financial markets, not just in bond markets, and it’s not certain if it would even deter Trump from seizing Greenland.
For now, the base case is that Trump wants to make a deal to acquire Greenland, or at the very least, to gain significant access to the island, including its rare earths, and will stop at nothing to achieve this. Europe may have no choice but to negotiate.
Week Ahead – Fed and BoC Meet Amid Geopolitical Upheaval and Trump’s Fed Pick
- Fed to likely go on pause after three straight cuts.
- BoC is also expected to stand pat.
- But will Trump steal the limelight by revealing his Fed chair nomination?
- Eurozone GDP and Australian and Tokyo CPI to be watched too.
Fed to take a backseat in January
The Federal Reserve will hold its first policy meeting of the year next week, announcing its decision on Wednesday. No change in interest rates is anticipated, as Fed chief Jerome Powell signalled back at the December meeting that after three consecutive 25-bps cuts, the central bank “is well positioned to wait to see how the economy evolves”.
Concerns about the labour market necessitated the Fed to resume its easing cycle in September after jobs growth ground to a halt over the summer, even as inflation has stayed stubbornly above the 2% target. But there are signs that the jobs market has stabilized, and although the current “no hire, no fire” conditions are hardly screaming of recovery, the Fed can afford to take some time out to get a better picture of what is happening to inflation, amid a lot of noise in the data caused in part by the government shutdown.
Headline CPI moderated to 2.7% y/y in December, while core CPI was unchanged at 2.6%, reinforcing the view that inflation is now back in a downward trend following the temporary pickup in price pressures generated by Trump’s tariffs. Powell hasn’t shied away from blaming tariffs for the inflation overshoot but sounded quite upbeat in his December post-meeting press conference that it’s likely a "one-time price increase".
Nevertheless, Fed officials remain quite cautious, not just because inflation hasn’t reached 2% since 2021 and their credibility is at stake if they don’t meet their goal soon, but also because they’ve become less worried about the labour market. Far from slowing, the US economy is booming right now, with the Atlanta Fed’s GDPNow model putting growth in the final quarter of 2025 at an impressive 5.4%.
Hence, despite the recent softness in inflation readings, the Fed is unlikely to flag a faster pace of easing in the months ahead on Wednesday. Powell will probably try to justify the ongoing caution by talking up the economy. However, should he open the door to more than one 25-bps rate cut that’s been pencilled in the dot plot for 2026, this will be music to investors’ ears.
The US dollar is still reeling from Trump’s renewed tariffs threats over Greenland so any dovish surprises could trigger fresh selling pressure.
Will Trump finally announce Powell’s successor?
In terms of data, durable goods orders for November will start things off on Monday, followed by the Conference Board’s consumer confidence index on Tuesday, factory orders on Thursday and the Chicago PMI and producer price index on Friday.
It’s possible of course that the biggest highlight next week might not come from either the Fed or the data. President Trump may well try to steal Powell’s thunder by finally announcing who he will nominate to replace him in May. It is thought that the President has narrowed the selection to four candidates: White House economic adviser Kevin Hassett, Fed Governor Christopher Waller, former Fed Governor Kevin Warsh and Rick Rieder, who is BlackRock's chief bond investment manager and a recent addition to the list.
Equity traders would probably be happy with any of those finalists, but bond markets are more likely to be calmer if Waller is picked. The dollar, on the other hand, might not see a significant immediate reaction as investors might wait until there’s more clarity on the policy direction under the new leadership before responding.
BoC set to stay on hold
With Powell potentially facing more attacks by Trump for not cutting rates next week, Canadian Prime Minister Mark Carney also remains unpopular at the White House. But despite the lack of progress towards lower US tariffs on Canadian exports not covered by the USMCA agreement, the Canadian economy appears to be holding up reasonably well. Employment has been rising since September and GDP growth bounced back in Q3. The next monthly reading is due on Friday.
Moreover, the inflation picture has been somewhat mixed lately, and so the Bank of Canada is almost certain to keep interest rates unchanged on Wednesday when it meets a few hours before the Fed.
Futures markets see around a 40% probability of a rate increase by year end. But should BoC officials keep the option of a cut on the table, the Canadian dollar could reverse some of its recent gains versus the greenback.
Will Australian CPI data seal the deal for RBA hike?
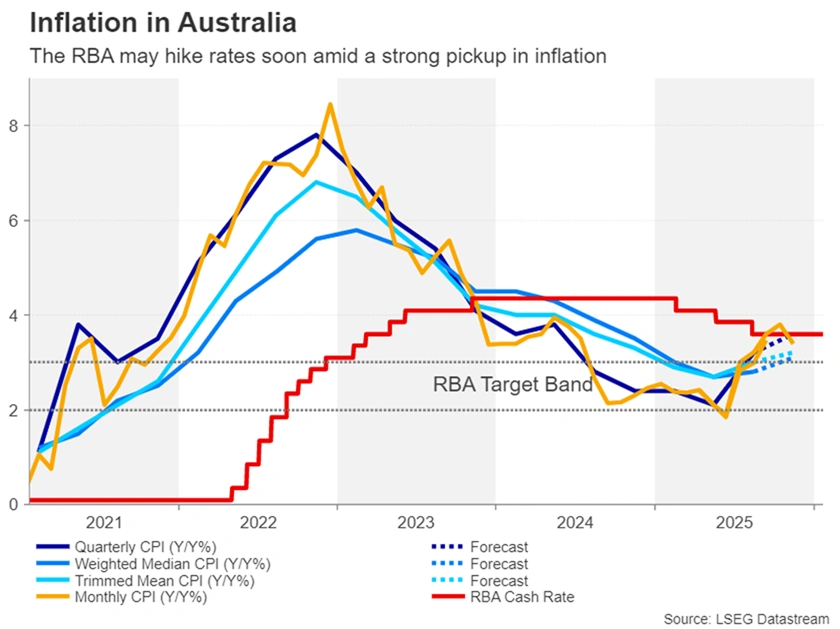
Meanwhile, in Australia, a rate rise is looking more and more likely, with investors assigning about a 58% probability that the Reserve Bank of Australia will lift the cash rate by 25 basis points when it meets on February 3.
Next week’s CPI release will be crucial in determining which way those odds swing. The quarterly prints are due on Wednesday along with the monthly numbers.
Headline CPI rose to 3.2% y/y in Q3 and is expected to have edged further up in Q4, as the monthly gauge jumped to 3.8% y/y in October before falling back to 3.4% in November.
Any downside surprises could be quite negative for the Australian dollar, which has been rallying over the past week on the growing rate hike bets. However, if the CPI report raises the likelihood of a hike, the aussie could soon set its sights on $0.6900.
Eurozone data should keep euro supported
The easing of tensions between European capitals and Washington over Greenland’s autonomy has come as a major relief for the markets. But the crisis is far from over as discussions about a framework for a future deal barely scratch the surface on what all sides need to agree on.
The euro has been a surprise benefactor of the geopolitical headlines, as the dollar fell victim to the ‘sell America’ trade. That’s not to say there aren’t any vulnerabilities for the euro while negotiations take place about Greenland’s future.
One such risk is that a flareup of trade tensions between the EU and US would increase the chances of the European Central Bank cutting rates again this year. For now, though, the data is anticipated to continue supporting a neutral ECB.
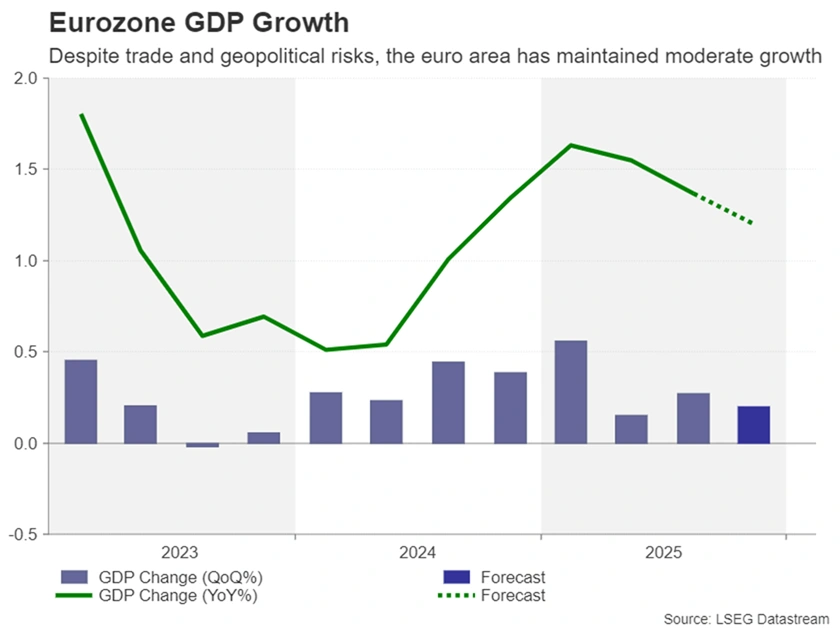
The first estimate of Q4 GDP in the Eurozone is out on Friday, with forecasts of 0.2% q/q growth, slightly slower than the 0.3% pace of Q3.
Also on investors’ radar will be Germany’s Ifo business survey on Monday and the preliminary CPI figures for January on Friday.
Focus turns to Tokyo CPI after BoJ decision
Finally, there will be more inflation data doing the rounds in Japan over the coming week, where CPI estimates for January are out on Friday for the Tokyo region. Core CPI fell to 2.3% y/y in December in Tokyo, pointing to some cooling in price pressures amid lower energy prices and an easing in food inflation.
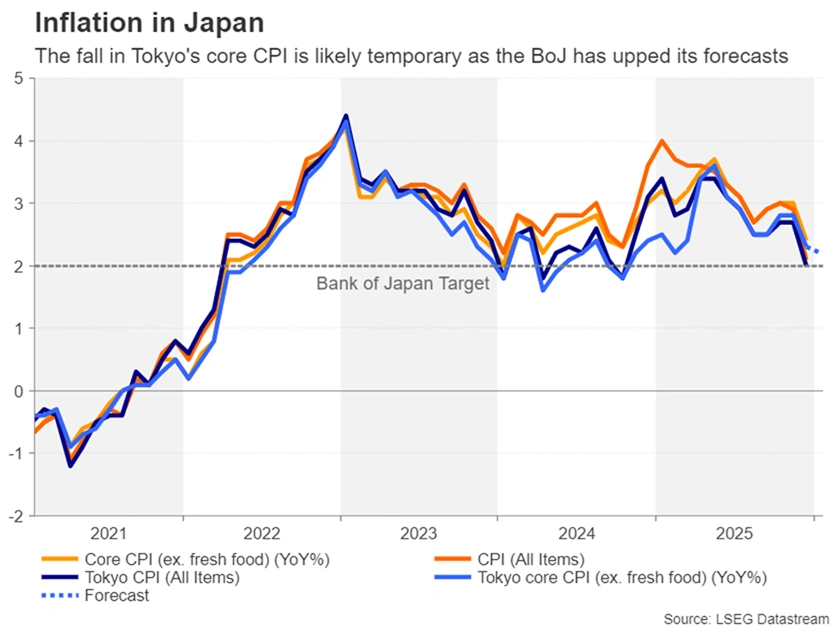
Any further decline in January could weigh on the yen, as investors are still more focused on Japan’s mounting debt problem than the Bank of Japan’s increasingly hawkish stance. The BoJ raised its inflation outlook at its policy meeting this week, suggesting it’s ready to hike again soon, but the yen remains unconvinced.
With the yen unable to catch a break, there’s an elevated risk of intervention in FX markets by Japanese authorities in the next few days after a suspected ‘rate check’ on Friday. Authorities tend to conduct a rate check as a means of gauging the market and sending a signal that they are ready to intervene at any moment, so investors need to be on standby.
Dual Central Bank Announcements the Focus in Crowded Week
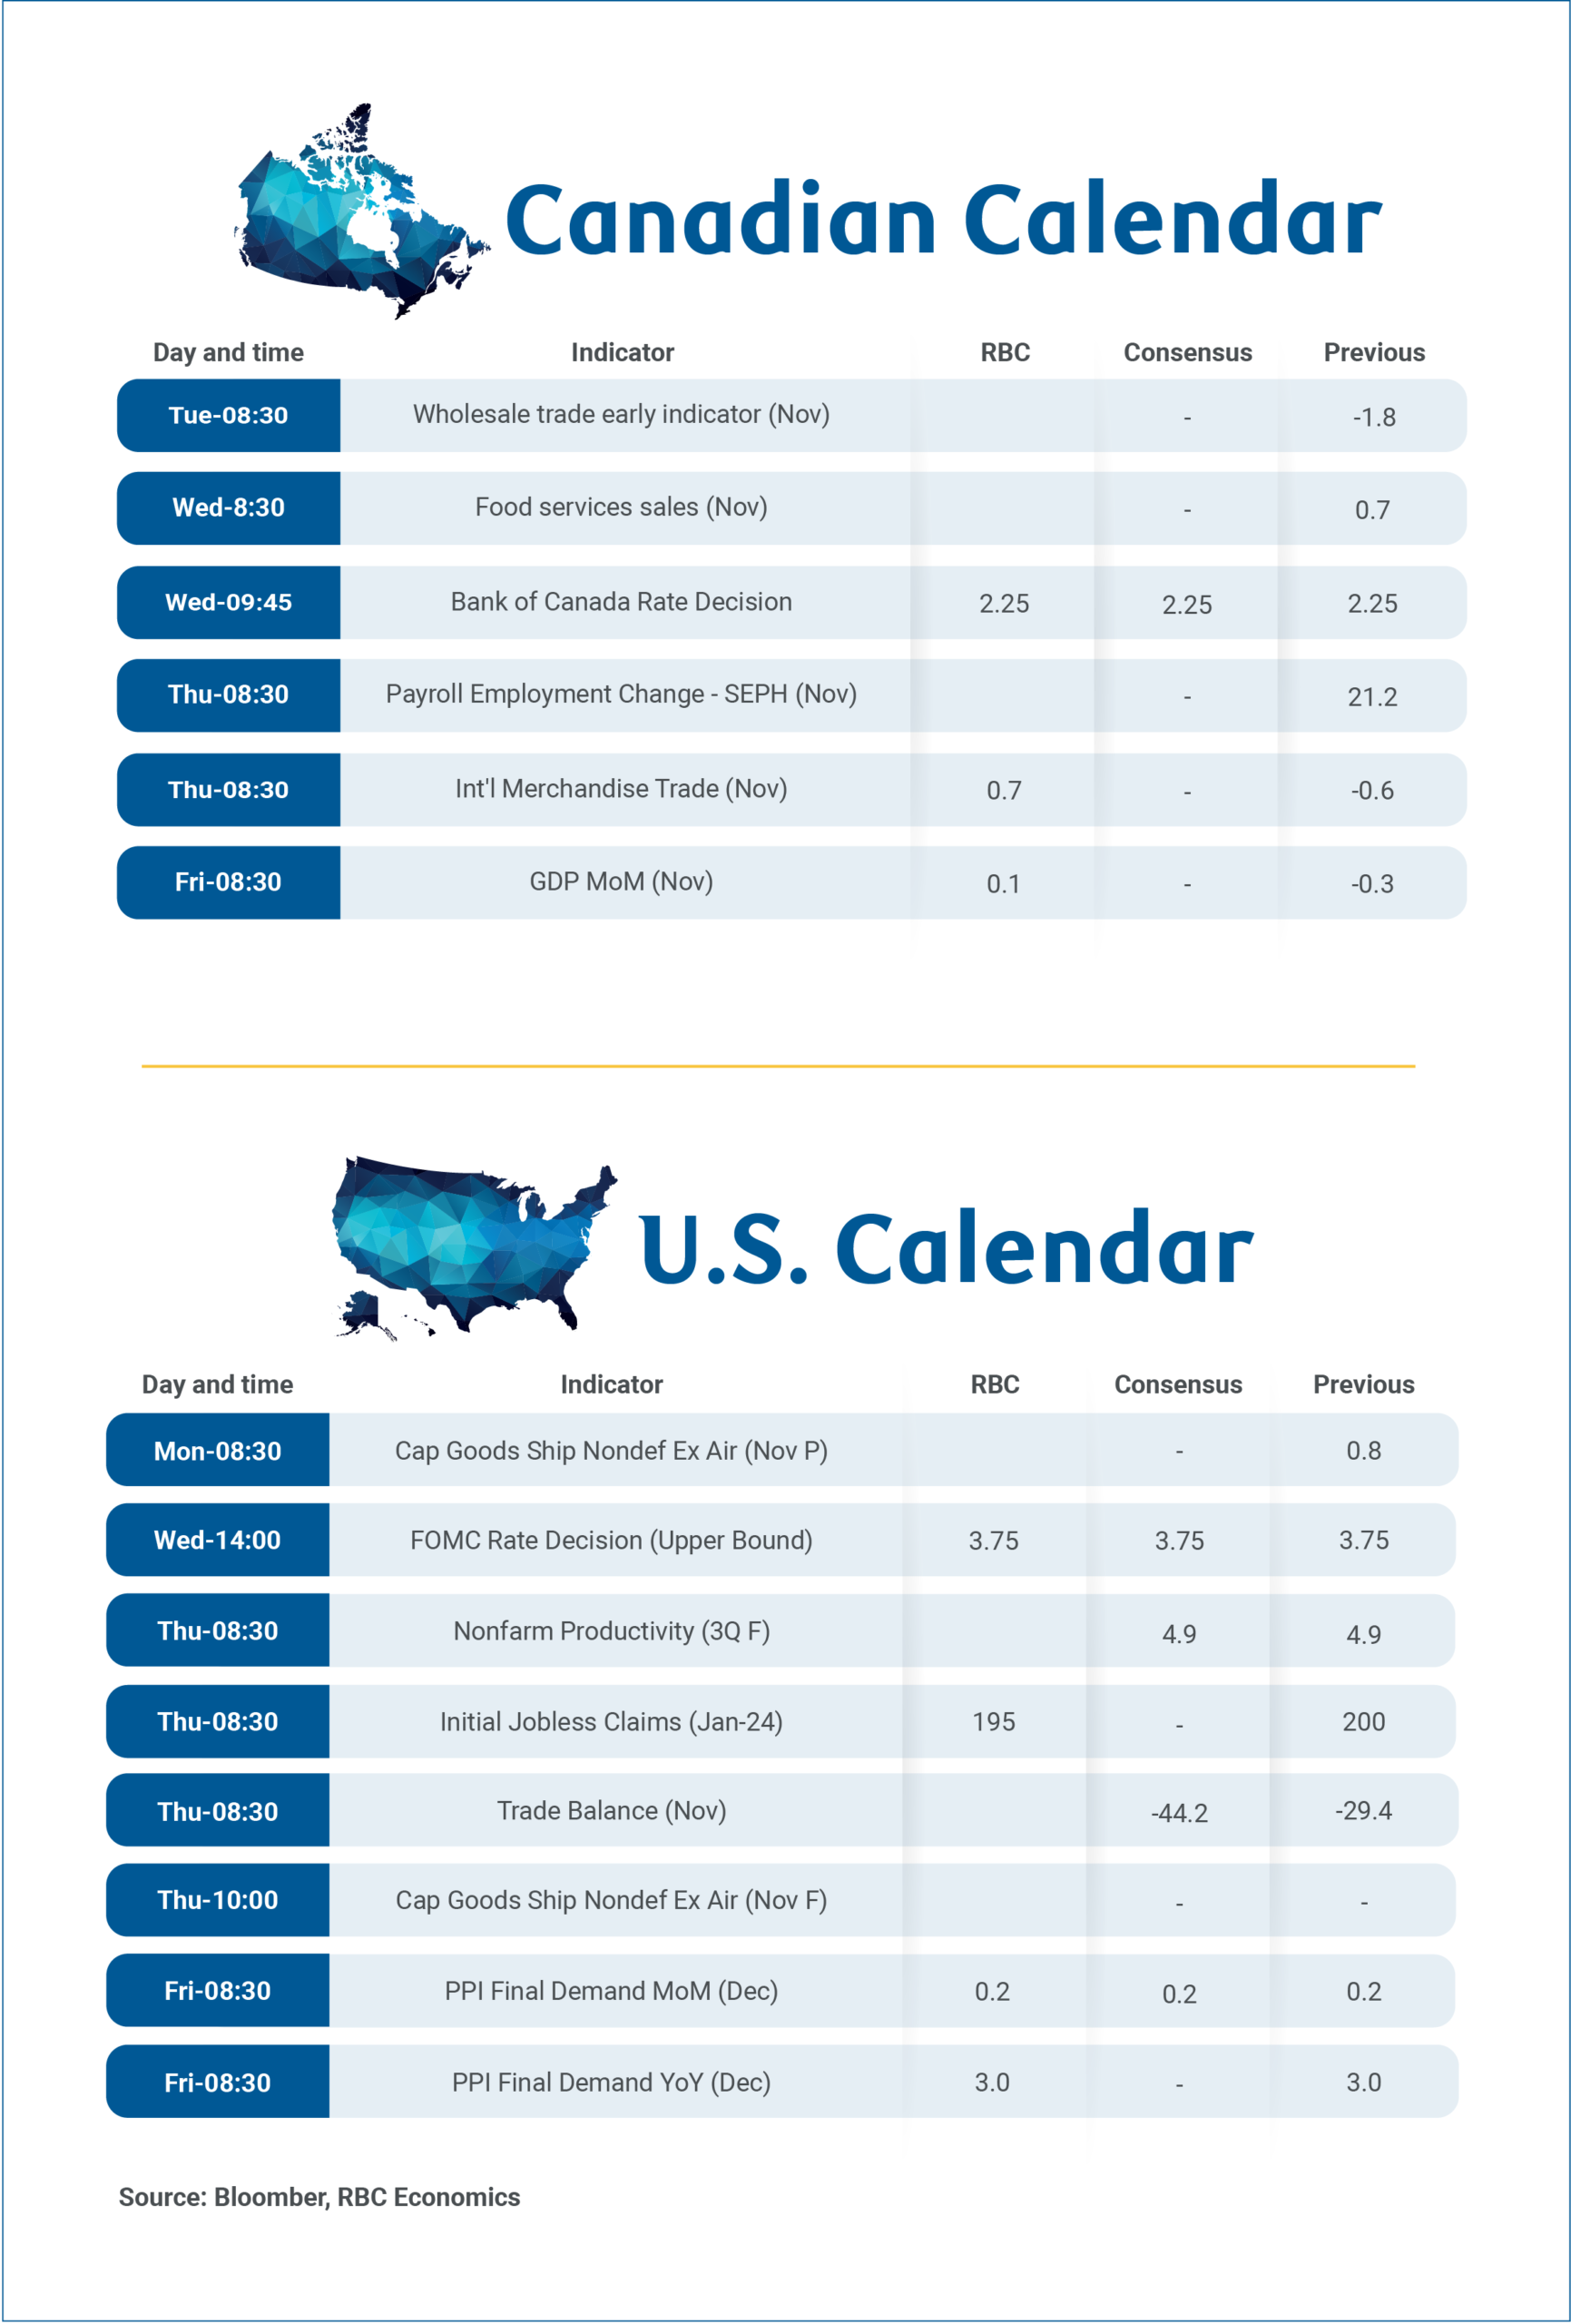
Canada’s economic calendar starts kicks off next week with the Bank of Canada’s first meeting of 2026 on Wednesday, where no change to the overnight rate is expected.
At December’s meeting, Governor Macklem reiterated the BoC’s holding bias, contingent on moderate growth and stabilizing inflation. Data since then have largely aligned with those expectations. December labour market conditions improved moderately from a quarter ago, and while core inflation decelerated in December, it remains above the 2% target.
The focus will be on the Monetary Policy Report and a new set of central projections. We don’t anticipate material revisions, and expect forecasts will continue to align well with our cautiously optimistic view for a gradual recovery in 2026. The BoC’s latest Business Outlook Survey showed a turnaround in business sentiment in late 2025, but a demand outlook still soft enough to constrain firms’ pricing ability.
Partial rebound in GDP after contraction
Canadian gross domestic product data for November on Friday is expected to be broadly consistent with that view. We expect a partial rebound of 0.1% growth (in line with Statistics Canada’s preliminary estimate) after October’s 0.3% contraction. The heavily trade exposed manufacturing sector remained under pressure. Added challenges include a global chip shortage that led to a plunge in auto manufacturing in November. Overall, manufacturing sales volume declined 2.3%.
On the plus side, education services likely bounced back in November following the end of the Alberta teachers’ strike. Postal disruptions that started in October extended into November, but a 32% drop in October postal services won’t likely be repeated. Finally, retail sales volume rose 1.1% in November.
U.S. Fed to keep rates steady despite pressure
The Federal Reserve is also widely expected to hold interest rates steady on Wednesday despite calls from the U.S. administration, and some FOMC members, for additional rate reductions. Signs of softening labour markets in the U.S. have prompted the Fed to cut at each of the last three meetings.
Going forward, the Fed will remain open to reducing interest rates further if necessary. But, GDP growth in the U.S. has been more resilient than expected, a tick lower in the unemployment rate in December reinforced the view that labour markets are cooling, not collapsing, and inflation is still running persistently above the central bank’s 2% objective.
Absent a sudden and substantial rise in the unemployment rate, we expect both the BoC and the Fed will remain on hold for the rest of this year.
Week ahead data watch:
- November’s international trade balance for Canada and the U.S. on Thursday will be closely watched for implications on Q4 2025 GDP growth, and for signs that U.S. effective tariff rates could be edging lower. Net trade is currently tracking a significant boost to GDP growth in both countries in Q4. U.S. customs duties collected fell consecutively in November and December, coinciding with an expanded list of products exempted from U.S. tariffs since mid-November. The impact on Canada will be marginal, as the new exemptions overlap with pre-existing CUSMA protections that already position Canada among the lowest tariff rates among major U.S. trading partners.
Weekly Focus – A Week of Politics Moving Markets
Geopolitics dominated headlines and moved markets this week. US president Donald Trump wrote on Saturday that he would use tariffs against eight European countries to support his Greenland policy, putting an additional 10% on large parts of European goods already from 1 February. On Wednesday though, the message was that the parties are talking and that both tariffs and military intervention are off the table. Markets reacted early in the week with significant declines in equity prices and a weaker USD, not unlike the reaction to the "Liberation Day" tariff announcement in April although on a smaller scale. In the end, equity markets mostly recovered as the situation deescalated. However, USD ended the week about 1% weaker against the EUR, taking it back close to the levels at the beginning of January. US bond markets had a negative week. In part, that could also be seen in relation to the negative sentiment around US assets. However, bond yields increased globally following a large move up in Japan, where 10-year yields are now at their highest level since the 1990's.
This is related to the week's other big political event, the calling of an election in Japan on 8 February and the election campaign for that. Both the opposition and the government have promised to temporarily cut taxes, especially on food, and it seems likely that fiscal policy will become more expansionary. The Bank of Japan did not change interest rates at their meeting this week following the hike in December, but the bank did raise its inflation forecast and it is increasingly expected that rates will be hiked in April as is also our call. However, the Bank of Japan is not immune to political pressure and there are doubts as to whether it will be able to get inflation back to target soon. The JPY has been under pressure for a long time, and the pressure intensified this week before a sudden correction on Friday. It is possible that the central bank intervened in the market to support the currency.
In the euro area, composite PMIs remained unchanged at 51.5 in January, indicating that the modest economic expansion continued into 2026. Date due Friday will likely show that GDP growth was around 0.5% q/q in Q4.
Political events could of course take the limelight again next week but barring that, the most important thing to watch from a market perspective is likely to be the monetary policy decision in the US. There is little chance of a policy change at the meeting, but markets will be looking for clues about the timing of the next cut. We should also expect a lot of questions and discussion about the administration's legal and political attempts to put pressure on the central bank.
We will get the first glimpse of European inflation in January when we get data for Germany and Spain on Friday. We expect euro area inflation to decline to 1.7% y/y due to lower energy prices compared to last year, but the ECB is looking at core inflation which is likely to remain unchanged. However, there is always much uncertainty in January and this time, there are both VAT cuts (on restaurants in Germany) and increases (on hotels in the Netherlands). In addition, energy prices have recently been increasing again, as cold weather and rather small gas stocks are putting pressure on prices.
US PMI composite ticks up to 51.9, worryingly subdued new business growth
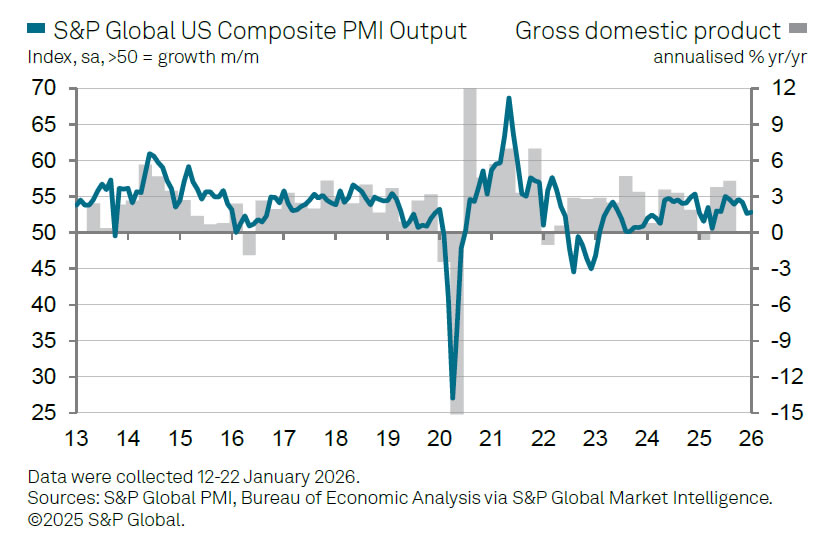
U.S. business activity remained in expansion territory in January, but signs of cooling momentum emerged. PMI Manufacturing edged up from 51.8 to 51.9, while PMI Services was unchanged at 52.5, lifting Composite PMI marginally from 52.7 to 52.8.
According to Chris Williamson of S&P Global Market Intelligence, the flash PMI signals annualized GDP growth of around 1.5% in December and January. However, he warned that new business growth remains "worryingly subdued" across both manufacturing and services, raising the risk that Q1 growth could disappoint compared with the stronger pace seen last autumn.
Labour market signals were also soft. Jobs growth remained close to stagnation, as firms hesitated to add staff amid uncertainty, weak demand, and elevated costs. At the same time, higher input costs—often blamed on tariffs—continued to push up selling prices, keeping inflation and affordability concerns firmly on businesses’ radar.
EUR/USD Mid-Day Outlook
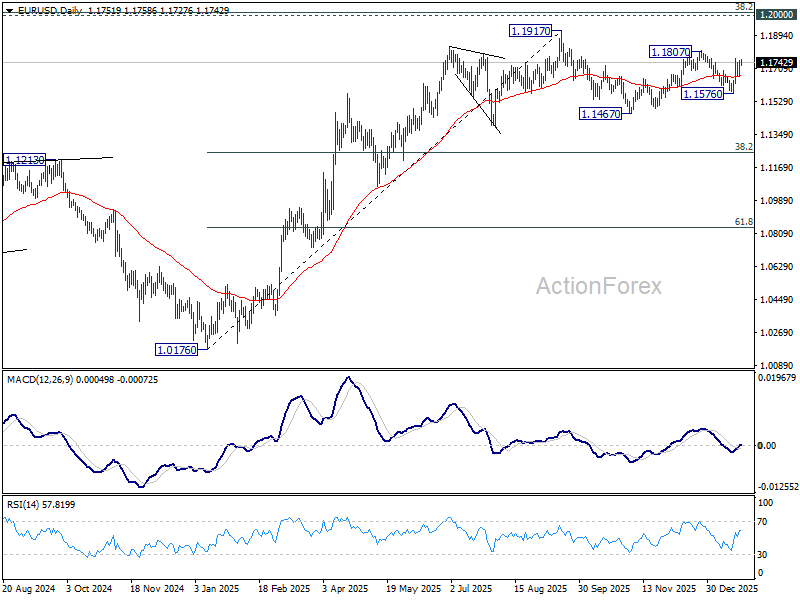
Daily Pivots: (S1) 1.1698; (P) 1.1727; (R1) 1.1785; More….
Intraday bias in EUR/USD stays neutral and outlook is unchanged. Risk stays on the upside with 55 4H EMA (now at 1.1689) intact. Break of 1.1807 will resume whole rally from 1.1467, and target a retest on 1.1917 key resistance level. However, sustained trading below 55 4H EMA will bring deeper fall back to 1.1576 support instead.
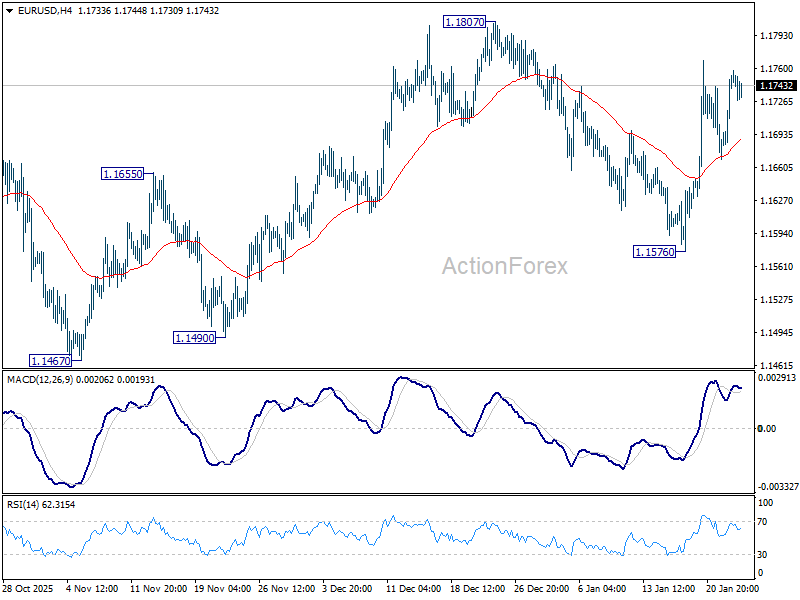
In the bigger picture, as long as 55 W EMA (now at 1.1413) holds, up trend from 0.9534 (2022 low) is still in favor to continue. Decisive break of 1.2 key psychological level will carry larger bullish implication. However, sustained trading below 55 W EMA will argue that rise from 0.9534 has completed as a three wave corrective bounce, and keep long term outlook bearish.