
Sample Category Title
USD/CHF Daily Outlook
Daily Pivots: (S1) 0.7864; (P) 0.7915; (R1) 0.7941; More….
Intraday bias in USD/CHF remains neutral for the moment. Also, risk stays on the downside with 55 4H EMA (now at 0.7951) intact. Firm break of 0.7860 support will argue that larger down trend is ready to resume through 0.7828 low. Nevertheless, sustained break of 55 4H EMA will bring stronger rebound towards 0.8039 resistance. Overall, price actions from 0.7828 are seen as a corrective pattern, which could still extend.
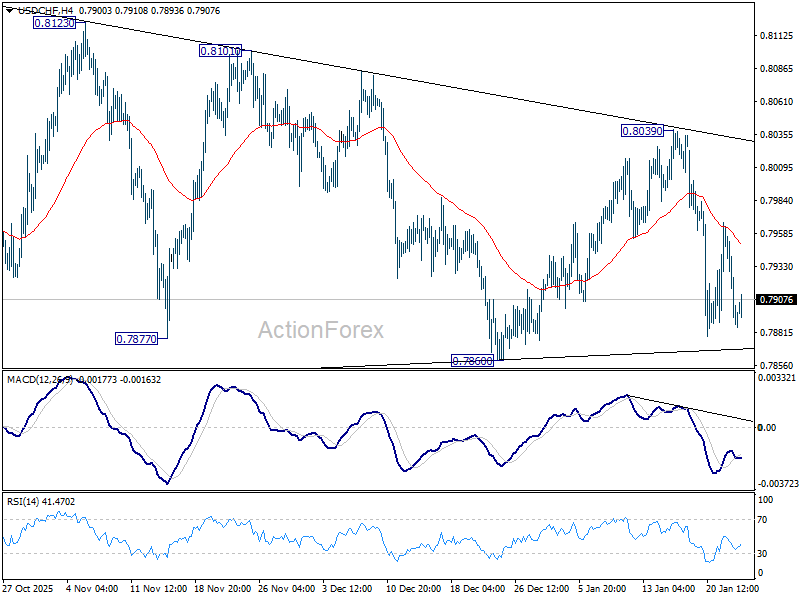
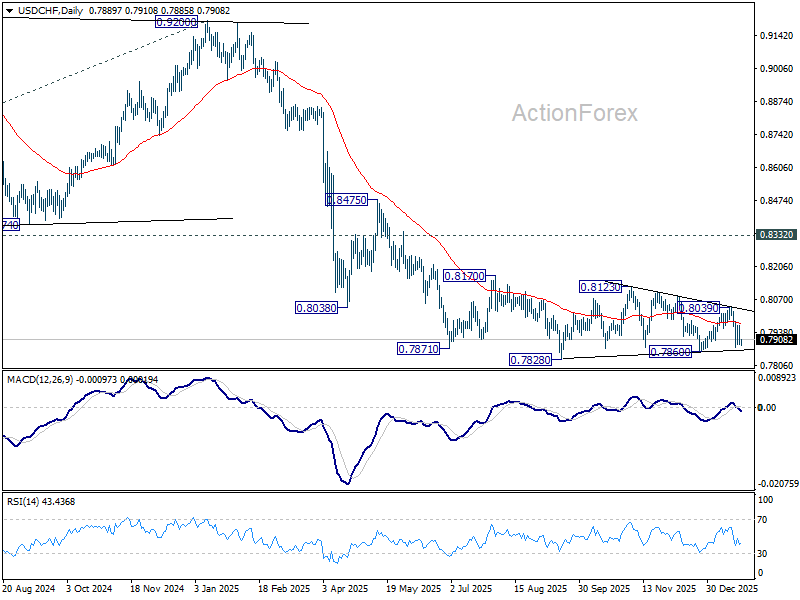
In the bigger picture, price actions from 0.7828 are seen as a correction. Larger down trend from 1.0342 (2017 high) is still in progress. Break of 0.7828 will target 100% projection of 1.0146 (2022 high) to 0.8332 from 0.9200 at 0.7382. In any case, outlook will stay bearish as long as 0.8332 support turned resistance holds (2023 low).
USD/JPY Daily Outlook
Daily Pivots: (S1) 158.10; (P) 158.50; (R1) 158.82; More...
USD/JPY drops sharply in early European session, but stays in range below 159.44. Intraday bias remains neutral at this point. Also, with 156.10 support as well as 55 D EMA (now at 156.03) intact, further rise is expected. On the upside, break of 159.44 will resume the rise from 139.87 towards 161.94 high. However, firm break of 156.10 will confirm short term topping, and turn bias back to the downside for deeper pullback.
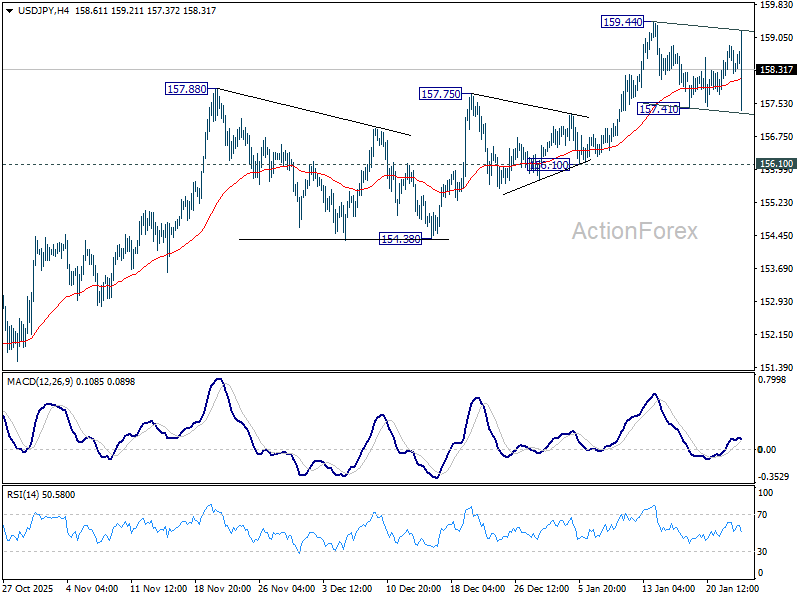
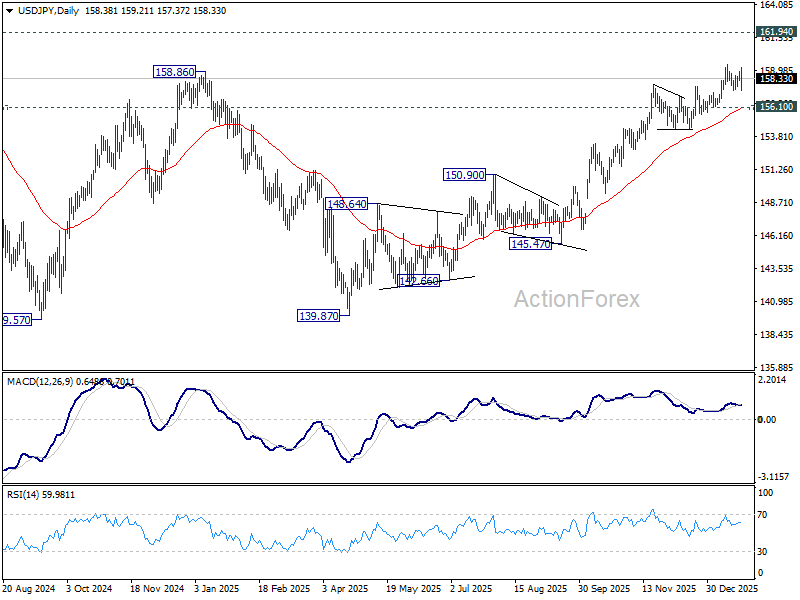
In the bigger picture, corrective pattern from 161.94 (2024 high) should have completed with three waves at 139.87. Larger up trend from 102.58 (2021 low) could be ready to resume through 161.94. Decisive break of 158.86 structural resistance will solidify this bullish case and target 161.94 for confirmation. On the downside, break of 154.38 support will dampen this bullish view and extend the corrective range pattern with another falling leg.
Yen Snaps Back on Intervention Signs, Japan Draws Line Near 160
Yen staged a sharp rebound in early European session on suspected intervention, interrupting a renewed bout of selling that followed the Bank of Japan policy decision. The bounce came after markets judged the BoJ’s message insufficiently hawkish to arrest currency weakness.
Before the reversal, USD/JPY pushed beyond 159, extending gains after BoJ Governor Kazuo Ueda stopped short of signaling imminent tightening. The move was swiftly countered, with the pair knocked down to 157.30 in a sharp, one-way drop characteristic of official action. Yet the rebound quickly stalled. Demand re-emerged above 157, keeping USD/JPY trapped within a 157.40–159.40 range, indicating that intervention has stabilized, but not reversed, the broader trend.
The price action nevertheless highlights an important point: Japanese authorities appear unwilling to tolerate a sustained move above 160. That line in the sand may deter momentum traders in the near term, but history suggests it will be retested once volatility fades.
The underlying policy story remains a headwind for Yen. The BoJ failed to offer any sense of urgency around further hikes, with just one policymaker advocating a move toward 1%. That vote count reinforces the view that the board remains cautious. Although the BoJ raised growth forecasts, inflation projections were left broadly unchanged, weakening the case for front-loaded tightening. The message remains one of gradualism rather than acceleration.
Incoming data have also sent mixed signals. Core inflation slowed sharply, partly due to energy subsidies, while PMI readings were exceptionally strong, highlighting solid activity momentum but limited near-term inflation pressure. Taken together, there is no strong signal for an April hike. Market pricing has converged decisively on June as the earliest realistic timing for the next BoJ move.
Elsewhere in FX, Kiwi eased modestly, likely reflecting profit-taking after stronger-than-expected inflation data earlier. Even so, the broader trend remains supportive, with markets increasingly pulling forward expectations for the first RBNZ hike, now seen as “odds on” by December 2026, with upside risk toward even earlier action. Aussie also remains firm. Strong PMI data added to the momentum built earlier in the week by robust employment figures, reinforcing expectations of a sooner-than-expected RBA hike.
On a weekly basis, Yen remains the worst-performing currency, despite today’s bounce. Dollar follows closely, still weighed down by lingering transatlantic political strains, with Loonie next weakest. At the top, Kiwi leads, followed by Aussie and Swiss Franc, while Euro and Sterling sit in the middle of the pack.
In Asia, Nikkei rose 0.29%. Hong Kong HSI rose 0.45%. China Shanghai SSE rose 0.33%. Singapore Strait Times is up 1.20%. Japan 10-year JGB yuield rose 0.012 to 2.252. Overnight, DOW rose 0.63%. S&P 500 rose 0.55%. NASDAQ rose 0.91%. 10-year yield fell -0.004 to 4.249.
BoJ holds rates, upgrades growth outlook, hawkish dissent keeps hike risk alive
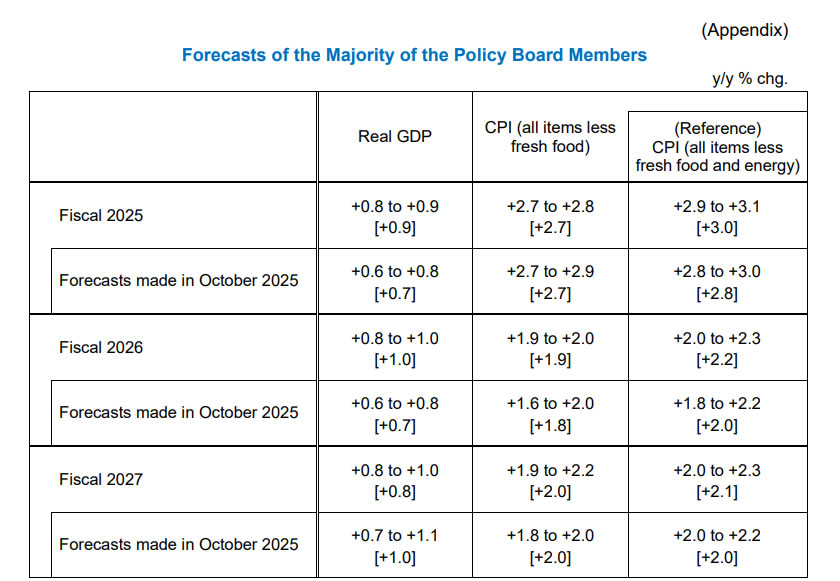
The BoJ left its benchmark interest rate unchanged at 0.75%, in line with expectations, but the decision revealed persistent internal debate. Hawkish board member Hajime Takata proposed a hike toward 1%, citing upside risks to inflation, though the motion was voted down by the majority.
The central bank maintained its assessment that the 2% inflation target will be achieved in the latter half of the three-year projection period through fiscal 2027, keeping its medium-term normalization narrative intact despite near-term caution.
At the post-meeting press conference, Governor Kazuo Ueda reiterated a data-dependent tightening bias. He said the BoJ would "continue to raise rates if economic and price forecasts materialize", stressing that the pace and path of hikes would be determined meeting by meeting as conditions evolve.
In its quarterly outlook report, the BoJ upgraded growth forecasts, reflecting the impact of fiscal stimulus under Prime Minister Sanae Takaichi. The economy is now seen growing 0.9% in the current fiscal year and 1.0% next year, up from 0.7% previously. Inflation projections were largely unchanged, aside from a 0.1pp upward revision to 1.9% for fiscal 2026.
The BoJ highlighted risks from overseas growth and prices, adding "exchange rate developments are, compared to the past, more likely to affect prices."
Japan's CPI core falls to 2.4% with sharp energy drag, limited core-core cooling
Japan’s December CPI report showed sharp moderation in headline inflation, largely reflecting energy relief rather than broad-based disinflation. Headline CPI slowed to 2.1% yoy from 2.9%, the weakest pace since early 2022. Core CPI (ex-fresh food) fell from 3.0% to 2.4%, helped by government measures to stabilize gasoline prices.
However, the decline was far less pronounced beneath the surface. Core-core CPI (ex-fresh food and energy) edged down just 0.1pp to 2.9% yoy, highlighting the stickiness of domestic inflation. Food prices excluding fresh items remained elevated at 6.7% yoy, though the pace eased slightly from 7.0%. Rice prices were still up 34.4%, even as inflation in the staple continued to cool gradually from prior peaks.
Energy prices were the key drag, reversing into a -3.1% yoy decline as gasoline prices fell -7.1%, reflecting higher subsidies and preparation for a gasoline tax cut late in the month. While these policy measures are temporarily easing inflation readings, the modest pullback in core-core CPI suggests underlying price pressures remain too firm to ignore.
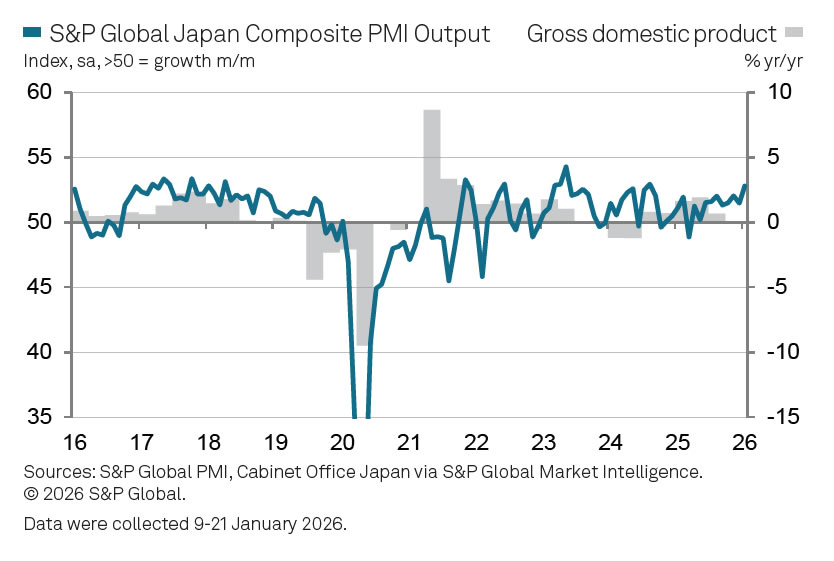
Japan PMI composite jumps to 52.8, manufacturing returns to growth
Japan’s January PMI readings delivered an upbeat signal, indicating a broadening recovery across the private sector, with PMI data pointing to the strongest expansion in 17 months. Manufacturing PMI rose from 50.0 to 51.1, returning to expansion. Services PMI jumped from 51.6 to 53.4. As a result, Composite PMI climbed from 51.1 to 52.8, signaling broad-based growth momentum.
According to Annabel Fiddes of S&P Global Market Intelligence, the data show a "solid start" to the year, supported primarily by accelerating services activity. Also, manufacturing output rose for the first time since June 2025, marking an important shift after a prolonged period of weakness.
The improvement was reinforced by the first increase in manufactured goods sales in more than three-and-a-half years, alongside rise in new export orders for the first time since early 2022.
However, business optimism weakened, reflecting concerns over rising costs, global uncertainty, labour shortages, and Japan’s ageing population, suggesting growth momentum may face headwinds later in the year.
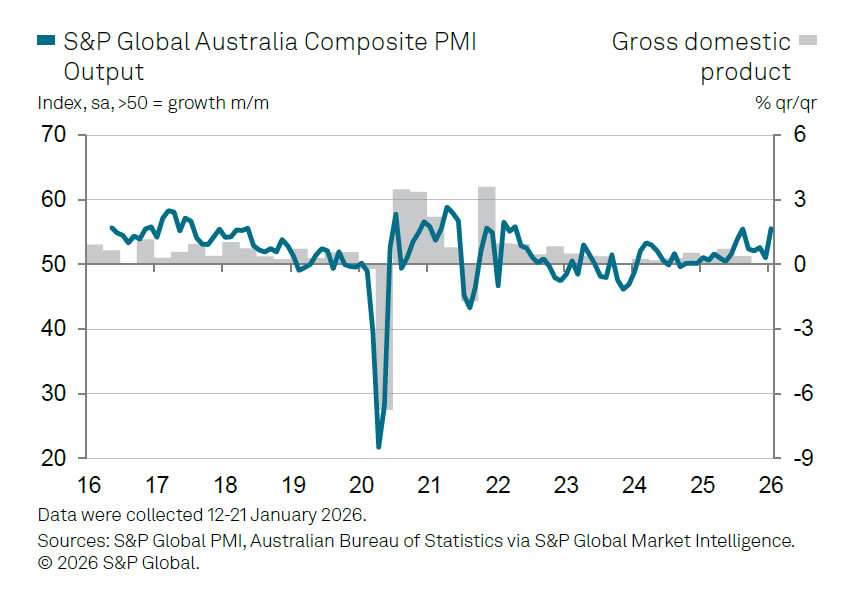
Australia PMI composite surges to 55.0, manufacturing and services in solid expansion
Australia’s business activity accelerated sharply in January, pointing to a strong start to 2026. PMI Manufacturing rose from 51.6 to 52.4, while PMI Services surged from 51.1 to 56.0. As a result, PMI Composite jumped from 51.0 to 55.0, marking the joint-highest level since April 2022 and signaling a broad-based expansion.
According to Jingyi Pan of S&P Global Market Intelligence, the flash PMI data show that growth has become "more balanced", with "solid expansions evident across both manufacturing and services". The readings reflect resilient domestic demand and improving momentum entering the new year.
That said, forward-looking indicators were mixed. Faster new order growth contrasted with declining business confidence, particularly among service providers.
While output price inflation eased, driven by softer service-sector charges, rising manufacturing input costs remain a risk factor, suggesting inflation pressures could re-intensify later in the quarter.
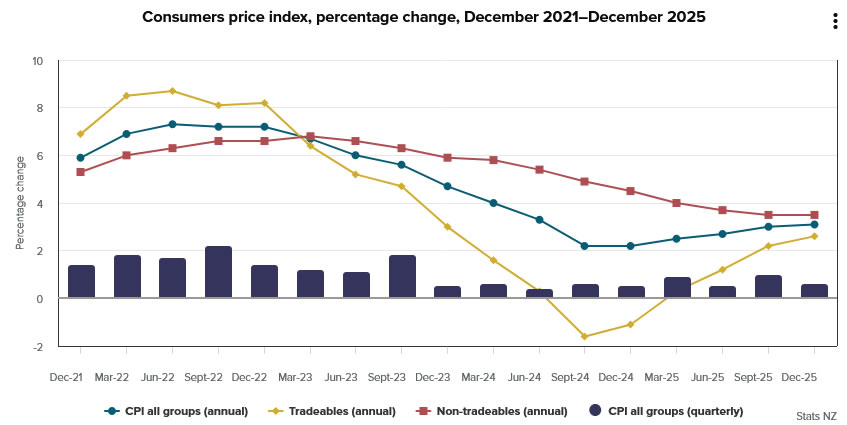
NZ CPI pushes above target as RBNZ Breman's tone shifts
New Zealand inflation accelerated again. Headline CPI rose 3.1% yoy, up from 3.0% and above expectations of 3.0%, pushing inflation back above the RBNZ’s 1–3% target band. It marked the highest annual rate since Q2 2024.
The composition of inflation showed renewed pressure from tradeable prices. Tradeable CPI jumped from 2.2% yoy to 2.6% yoy, while non-tradeable CPI held steady at 3.5% yoy.
On a quarterly basis, CPI rose 0.6% q/q, exceeding expectations of 0.5%, with both tradeable (0.7% qoq) and non-tradeable (0.6% qoq) components contributing.
Notably, RBNZ Governor Anna Breman struck a firmer in a Bloomberg interview, pledging that policymakers will ensure inflation returns to the midpoint of the target band. She declined to push back against market pricing for a rate hike, saying policy decisions would be based on a "holistic view" of incoming data at the February meeting—marking a clear shift from her more neutral comments earlier this month.
USD/JPY Daily Outlook
Daily Pivots: (S1) 158.10; (P) 158.50; (R1) 158.82; More...
USD/JPY drops sharply in early European session, but stays in range below 159.44. Intraday bias remains neutral at this point. Also, with 156.10 support as well as 55 D EMA (now at 156.03) intact, further rise is expected. On the upside, break of 159.44 will resume the rise from 139.87 towards 161.94 high. However, firm break of 156.10 will confirm short term topping, and turn bias back to the downside for deeper pullback.
In the bigger picture, corrective pattern from 161.94 (2024 high) should have completed with three waves at 139.87. Larger up trend from 102.58 (2021 low) could be ready to resume through 161.94. Decisive break of 158.86 structural resistance will solidify this bullish case and target 161.94 for confirmation. On the downside, break of 154.38 support will dampen this bullish view and extend the corrective range pattern with another falling leg.
Japanese Money Market Currently Fully Discount a Next BoJ Hike to 1% by June
Markets
Yesterday’s risk rebound lifted key US and European stock indices by 0.5% to 1.25%. Changes on US and German bond markets were minimal, but the dollar faced a tough time. EUR/USD moved from 1.1684 to 1.1755, closing in on first resistance at 1.1773/1.1808 (upside closing triangle formation/December top). A refocus on peace between Ukraine and Russia might be at play. New talks involving the US are scheduled in UAE. Today’s eco calendar contains global PMI’s, but these are unlikely to set the tone for trading. We look to overall risk sentiment and keep in mind that US President Trump in 2026 so far liked to “surprise” over the weekend. His pick of the new Fed chair is high on the agenda.
The Bank of Japan kept its policy rate unchanged this morning at 0.75% in an 8-1 majority vote. BoJ member Takata considered that the price stability target had been more or less achieved and that, with overseas economies being in a recovery phase, risks to prices in Japan were skewed to the upside. He proposed lifting the policy rate to 1%. In its quarterly outlook for economic activity and prices, the BoJ lifted its short-term growth path, mainly due to the effects of the government’s economic measures. It now expects real GDP growth of 0.9% and 1% in fiscal years 2025 & 2026 (up from 0.7% for both in October). The growth projection for FY 2027 was lowered from 1% to 0.8%. The headline inflation path was unchanged apart from a 0.1 ppt upward revision for FY 2026: 2.7%-1.9%-2%. More importantly, core-core CPI (excl. fresh food and energy) is now seen at 3%-2.2%-2.1% over the policy horizon up from 2.8%-2%-2% three months ago. The main factors that determine underlying inflation are an improving trend in the output gap towards positive territory and a greater than expected tightening of labor market conditions, partly due to a deceleration in the pace of increase in labor force participation of women and seniors. Upward pressure on wages and prices is likely to be stronger than suggested by the output gap, given that firms in many industries have started to face labor supply constraints. Risks to both economic activity and prices are generally balanced, but the BoJ mentions two specific upside inflation risks: firms’ wage- and price-setting behavior and its impact on inflation expectations and future development in FX rates and import prices. If the aforementioned outlook for economic activity and prices will be realized, the Bank of Japan will continue to raise the policy interest rate and adjust the degree of monetary accommodation. Japanese money market currently fully discount a next hike to 1% by the June meeting and see the EoY policy rate between 1.25% and 1.5%. The JGB yield curve flattens this morning with the front end creeping 3.4 bps higher while the very long end remains more in correction mode following this week’s earlier violent sell-off (-3 bps). Interestingly, BoJ governor Ueda at the press conference said that the BoJ will maintain close cooperation with government on deciding whether to conduct possible stabilizing bond (buying operations). USD/JPY holds near the recent highs (158.75) despite an overall weaker USD.
News and views
New Zealand inflation was higher than expected in Q4 2025 at 0.6% Q/Q and 3.1% Y/Y (from 3% in Q3) and returned north of the Reserve Bank of New Zealand’s 1-3% target range. It was the fastest pace since Q2 2024. While inflation slowed considerably from its 2022 peak, Statistics New-Zealand also mentions that inflation increased each quarter since Q4 2024. The largest contributors to annual inflation are electricity, local authority rates and rent. In a quarterly perspective, an increase in air transport prices was an important diver for higher prices. Tradeable inflation increased to 0.7% Q/Q. Price for non-tradeables rose by 0.6% Q/Q. The Q4 2025 outcome was also above the November RNBZ projection (2.7% Y/Y). At that meeting, the RBNZ in a 5-1 vote still cut the policy rate by 25 bps to 2.25% as it preferred to support output, even as there were already tentative signs of an economic rebound admittedly with still ample spare capacity. Markets now see two 25 bps rate hikes by end this year. While this might be a bit premature, the 2-y government bond yield today rises by 5 bps (3.32%). The Kiwi dollar yesterday already gained sharply against an overall weaker dollar and holds north of NZD/USD 0.59 (vs 0.57 one week ago).
Indian private sector growth recovered after losing some momentum at the end of last year. The composite output PMI rose to 59.5 (from 57.8), with both services activity (59.3) and manufacturing output (59.9) improving. The improvement was supported by job creation and a rebound in business confidence. At the same time, aggregate rates of input cost and output charge inflation remained moderate despite quickening since December. On another topic related to the Indian economy Bloomberg this morning runs an article that India’s holdings of US Treasures have fallen to $174bn, a five-year low, referring to US government data published last week. The move is linked to India and other regional countries diversifying their reserves away from US assets, including raising the share of gold in their reserves. Central bank action to support the local currency might also be in play.
BoJ holds rates, upgrades growth outlook, hawkish dissent keeps hike risk alive
The BoJ left its benchmark interest rate unchanged at 0.75%, in line with expectations, but the decision revealed persistent internal debate. Hawkish board member Hajime Takata proposed a hike toward 1%, citing upside risks to inflation, though the motion was voted down by the majority.
The central bank maintained its assessment that the 2% inflation target will be achieved in the latter half of the three-year projection period through fiscal 2027, keeping its medium-term normalization narrative intact despite near-term caution.
At the post-meeting press conference, Governor Kazuo Ueda reiterated a data-dependent tightening bias. He said the BoJ would "continue to raise rates if economic and price forecasts materialize", stressing that the pace and path of hikes would be determined meeting by meeting as conditions evolve.
In its quarterly outlook report, the BoJ upgraded growth forecasts, reflecting the impact of fiscal stimulus under Prime Minister Sanae Takaichi. The economy is now seen growing 0.9% in the current fiscal year and 1.0% next year, up from 0.7% previously. Inflation projections were largely unchanged, aside from a 0.1pp upward revision to 1.9% for fiscal 2026.
The BoJ highlighted risks from overseas growth and prices, adding "exchange rate developments are, compared to the past, more likely to affect prices."
Japan’s CPI core falls to 2.4% with sharp energy drag, limited core-core cooling
Japan’s December CPI report showed sharp moderation in headline inflation, largely reflecting energy relief rather than broad-based disinflation. Headline CPI slowed to 2.1% yoy from 2.9%, the weakest pace since early 2022. Core CPI (ex-fresh food) fell from 3.0% to 2.4%, helped by government measures to stabilize gasoline prices.
However, the decline was far less pronounced beneath the surface. Core-core CPI (ex-fresh food and energy) edged down just 0.1pp to 2.9% yoy, highlighting the stickiness of domestic inflation. Food prices excluding fresh items remained elevated at 6.7% yoy, though the pace eased slightly from 7.0%. Rice prices were still up 34.4%, even as inflation in the staple continued to cool gradually from prior peaks.
Energy prices were the key drag, reversing into a -3.1% yoy decline as gasoline prices fell -7.1%, reflecting higher subsidies and preparation for a gasoline tax cut late in the month. While these policy measures are temporarily easing inflation readings, the modest pullback in core-core CPI suggests underlying price pressures remain too firm to ignore.
Japan PMI composite jumps to 52.8, manufacturing returns to growth
Japan’s January PMI readings delivered an upbeat signal, indicating a broadening recovery across the private sector, with PMI data pointing to the strongest expansion in 17 months. Manufacturing PMI rose from 50.0 to 51.1, returning to expansion. Services PMI jumped from 51.6 to 53.4. As a result, Composite PMI climbed from 51.1 to 52.8, signaling broad-based growth momentum.
According to Annabel Fiddes of S&P Global Market Intelligence, the data show a "solid start" to the year, supported primarily by accelerating services activity. Also, manufacturing output rose for the first time since June 2025, marking an important shift after a prolonged period of weakness.
The improvement was reinforced by the first increase in manufactured goods sales in more than three-and-a-half years, alongside rise in new export orders for the first time since early 2022.
However, business optimism weakened, reflecting concerns over rising costs, global uncertainty, labour shortages, and Japan’s ageing population, suggesting growth momentum may face headwinds later in the year.
Australia PMI composite surges to 55.0, manufacturing and services in solid expansion
Australia’s business activity accelerated sharply in January, pointing to a strong start to 2026. PMI Manufacturing rose from 51.6 to 52.4, while PMI Services surged from 51.1 to 56.0. As a result, PMI Composite jumped from 51.0 to 55.0, marking the joint-highest level since April 2022 and signaling a broad-based expansion.
According to Jingyi Pan of S&P Global Market Intelligence, the flash PMI data show that growth has become "more balanced", with "solid expansions evident across both manufacturing and services". The readings reflect resilient domestic demand and improving momentum entering the new year.
That said, forward-looking indicators were mixed. Faster new order growth contrasted with declining business confidence, particularly among service providers.
While output price inflation eased, driven by softer service-sector charges, rising manufacturing input costs remain a risk factor, suggesting inflation pressures could re-intensify later in the quarter.
NZ CPI pushes above target as RBNZ Breman’s tone shifts
New Zealand inflation accelerated again. Headline CPI rose 3.1% yoy, up from 3.0% and above expectations of 3.0%, pushing inflation back above the RBNZ’s 1–3% target band. It marked the highest annual rate since Q2 2024.
The composition of inflation showed renewed pressure from tradeable prices. Tradeable CPI jumped from 2.2% yoy to 2.6% yoy, while non-tradeable CPI held steady at 3.5% yoy.
On a quarterly basis, CPI rose 0.6% q/q, exceeding expectations of 0.5%, with both tradeable (0.7% qoq) and non-tradeable (0.6% qoq) components contributing.
Notably, RBNZ Governor Anna Breman struck a firmer in a Bloomberg interview, pledging that policymakers will ensure inflation returns to the midpoint of the target band. She declined to push back against market pricing for a rate hike, saying policy decisions would be based on a "holistic view" of incoming data at the February meeting—marking a clear shift from her more neutral comments earlier this month.
Gold Spikes Past $4,950 as Risk Appetite Struggles to Return
It took the US president a single minute to flip sentiment from fear to greed. That came during Wednesday’s Davos speech, when he said he is not considering military action to take Greenland by force — even though he could (!) — and that discussions with NATO allies on Greenland had led to a framework that justified rolling back the latest tariffs imposed on a handful of European countries.
A relief rally followed, BUT didn’t last long. As we enter the second year of the Trump administration, it is increasingly clear — even for those who still had doubts — that US deals and agreements offer little guarantee of stability. New tariffs could be announced at any time, and they could be as ambitious as US objectives themselves — regardless of whether they make sense, are legal, or are accepted by the rest of the world.
This broader understanding of risk likely cast a shadow over yesterday’s relief rally. The S&P 500 gained, but by less than 1% on Thursday, and remains below its weekly opening level. The same is true for the Nasdaq 100.
Gold spiked past $4950 per ounce this morning. It looks like we’ll be hitting the $5000 before we thought! That move is a clear sign that the risk appetite is not fully restored!
Within tech, Nvidia also failed to meaningfully extend gains on Thursday. Appetite above the 50-day moving average — currently just below $185 per share — remains limited. Even CEO Jensen Huang’s comments that AI adoption will require several more trillions of dollars in investment, and reports that OpenAI’s Sam Altman is seeking $50bn in Middle Eastern funding — some of which would ultimately flow to Nvidia as a GPU supplier — failed to whet investor appetite.
Fresh news is instead boosting appetite in what used to be considered “boring tech”: memory chip makers — companies few investors could even name until the last quarter of last year. These are the stocks attracting inflows right now. And how! SanDisk, for example, is up more than 1’000% since last August; Western Digital has gained more than 250%, while Micron — which has made a few headlines — is up around 245% over the same period. The rally reflects a memory chip shortage that is being exacerbated by the soaring demands of AI infrastructure. And while the memory chip market is historically defined by boom-and-bust cycles, there is growing consensus that this time a structural shift is underway, meaning the current upswing could prove longer — and more memorable — than previous ones.
Looking deeper, however, such sharp price gains have pushed valuations to extremes. SanDisk now trades on a PE ratio of around 720 — meaning investors are paying 720 times current earnings. While this multiple should compress as demand explodes and pricing power lifts revenues and profits significantly, a ratio of this magnitude still places the stock firmly in bubble territory. Memory chip manufacturing remains capital-intensive, capacity constraints persist and while pricing power is clearly the main upside, and a longer-lasting cycle may justify higher forward valuations, current levels leave no room for disappointment. After such a powerful rally, a pullback would not be surprising. Samsung for comparison trades at a PE ratio of around 32, after an impressive rally as well. And SK Hynix’s PE ratio is less than 15. Just saying.
One final point on the sector. Intel — which jumped 11% on Wednesday amid the Greenland-driven relief rally — fell roughly 11% in after-hours trading yesterday after disappointing earnings. The company reported a net loss of $600m, or 12 cents per diluted share, compared with a $100m loss, or 3 cents per share, a year earlier. To make matters worse, Intel delivered soft guidance for the current quarter, citing insufficient supply to meet seasonal demand, though it expects conditions to improve in the second quarter. There remains hope that Intel will eventually benefit from the AI investment wave — but when?
Zooming out, the surge in AI investment continues to underpin strong US growth. According to the latest GDP update released yesterday, the US economy expanded by 4.4% in Q3 last year, up from 3.8% the previous quarter and above the 4.3% Bloomberg consensus. Price pressures picked up as well, with core PCE inflation rising from 2.6% to 2.9%, in line with expectations. While the Federal Reserve (Fed) has been out of focus recently, strong growth and above-target inflation have sharply reduced the probability of near-term rate cuts. Fed funds futures now imply just a 16% chance of a March cut, down from around 50% at the start of the year. The US 2-year yield pushed above 3.60% for the first time in more than six weeks, while the 10-year yield stabilized after dipping to around 4.25%.
Elsewhere, stress in Japanese government bond markets, sparked by Sanae Takaichi’s expansive fiscal ambitions, appears to be easing as a hectic week draws to a close. Still, her proposals — including suspending the consumption tax on food for two years as part of a campaign platform ahead of a snap general election — are difficult to square with Japan’s public debt, which sits near 215% of GDP. The measure alone would cost roughly ¥5 trillion per year (around $30bn), and crucially, no clear financing plan has been outlined! Does this remind you of another lady? And all this is happening at the same time, the Bank of Japan (BoJ) is willing to normalize policy and is no longer absorbing bonds at the pace it once did.
Why does this matter? Because Japanese investors are among the largest holders of US Treasuries. As yield differentials between the US and Japan narrow, incentives to repatriate capital increase — potentially draining global liquidity and triggering broader market sell-offs. This risk surfaced several times last year without fully materialising, likely thanks to ample global liquidity. The open question is for how long that buffer can last.
Time will tell.