
Sample Category Title
USD/CAD Daily Outlook
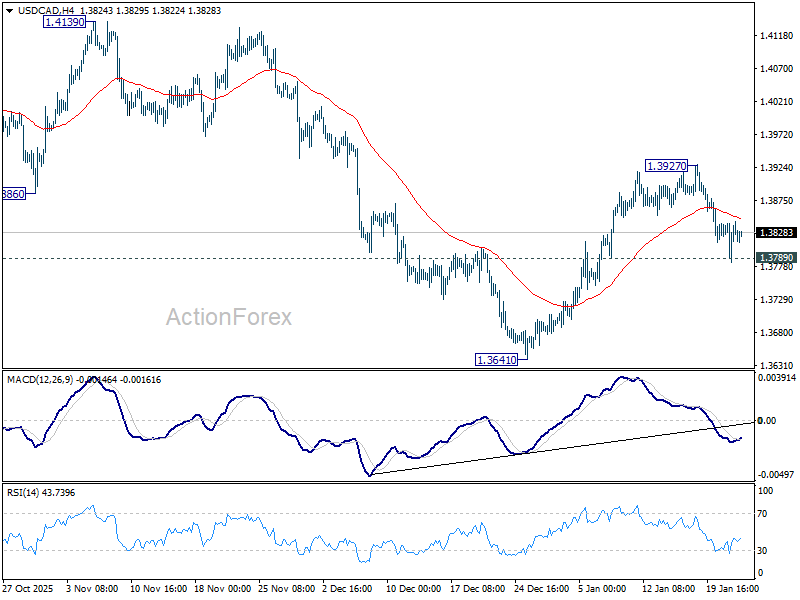
Daily Pivots: (S1) 1.3800; (P) 1.3821; (R1) 1.3857; More...
Intraday bias in USD/CAD stays neutral and further rise is still mildly in favor with 1.3789 support intact. Break of 1.3927 will resume the rebound from 1.3641, as part of the corrective pattern from 1.3538, towards 1.4139. However, firm break of 1.3789 will bring deeper fall back to 1.3538/3641 support zone.
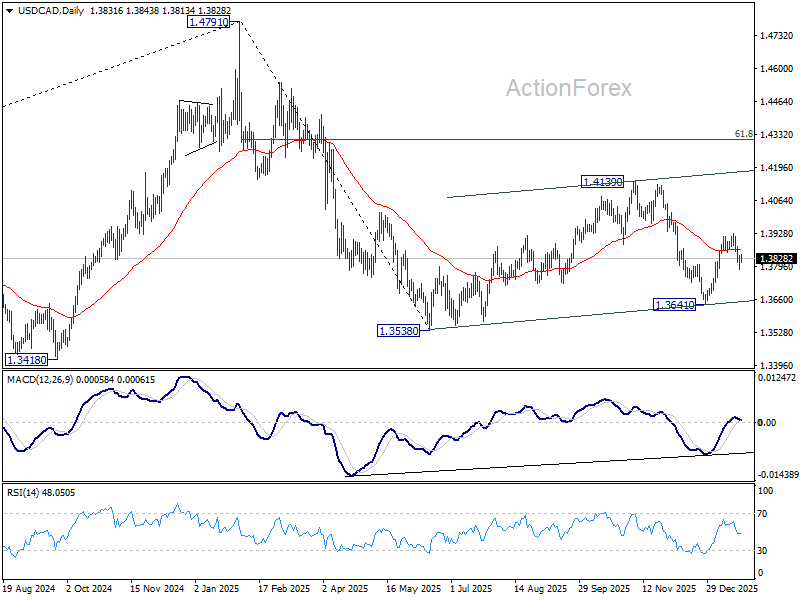
In the bigger picture, price actions from 1.4791 are seen as a corrective pattern to the whole up trend from 1.2005 (2021 low). Deeper fall could be seen as the pattern extends, and break of 1.3538 will target 61.8% retracement of 1.2005 to 1.4791 at 1.3069. For now, medium term outlook will be neutral until there are signs that the correction has completed.
EUR/CHF Daily Outlook
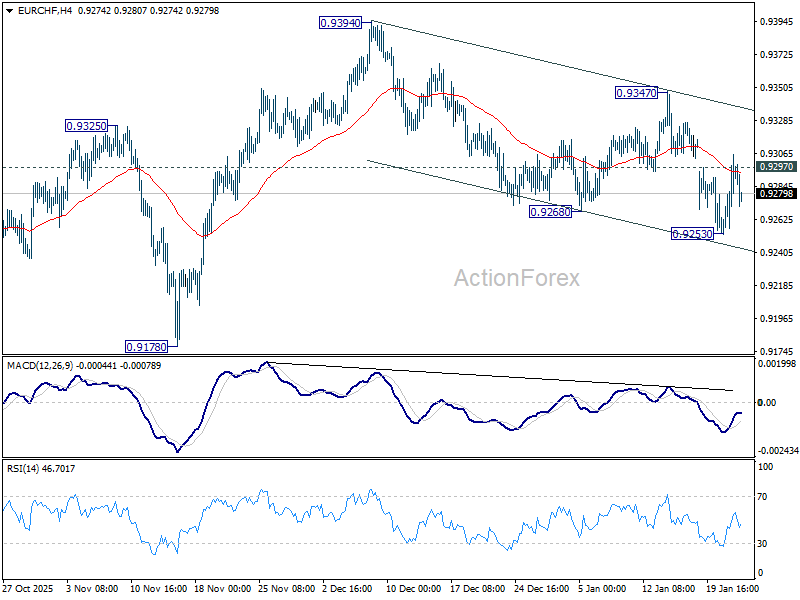
Daily Pivots: (S1) 0.9255; (P) 0.9282; (R1) 0.9322; More....
Intraday bias in EUR/HF is turned neutral first with breach of 0.9297 minor resistance. Another fall will remain mildly in favor as long as 0.9347 resistance holds. Below 0.9253 will extend the decline from 0.9394 towards 0.9178 low. Nevertheless, firm break of 0.9347 will indicate that fall from 0.9394 has completed as a correction, and bring stronger rally to retest this resistance.
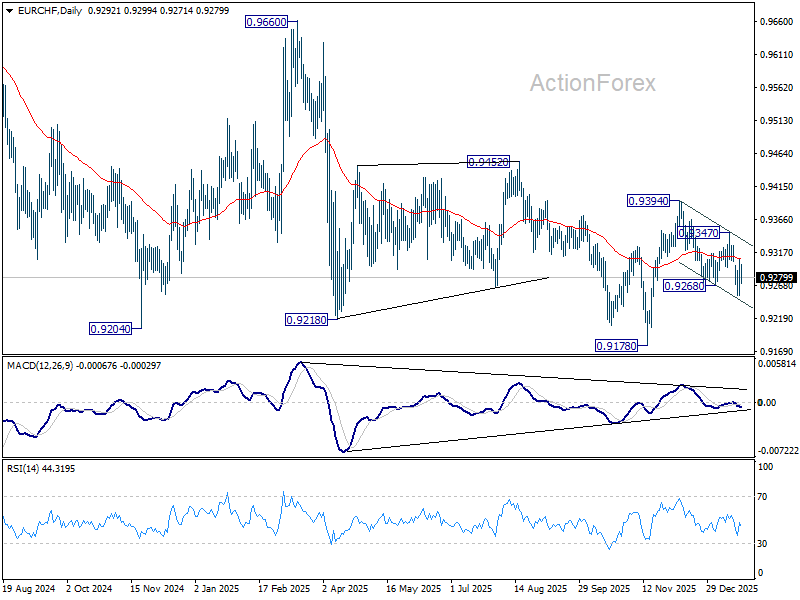
In the bigger picture, persistent bullish convergence condition in W MACD is a medium term bullish sign. Firm break of 0.9394 resistance should bring sustained trading above 55 W EMA (now at 0.9360). That should indicate medium term bottoming at 0.9178. Further break of 0.9452 resistance will bring stronger medium term rally towards 0.9928 resistance next, even still as a corrective bounce. Nevertheless, rejection by 55 W EMA will retain bearishness for another fall through 0.9178 at a later stage.
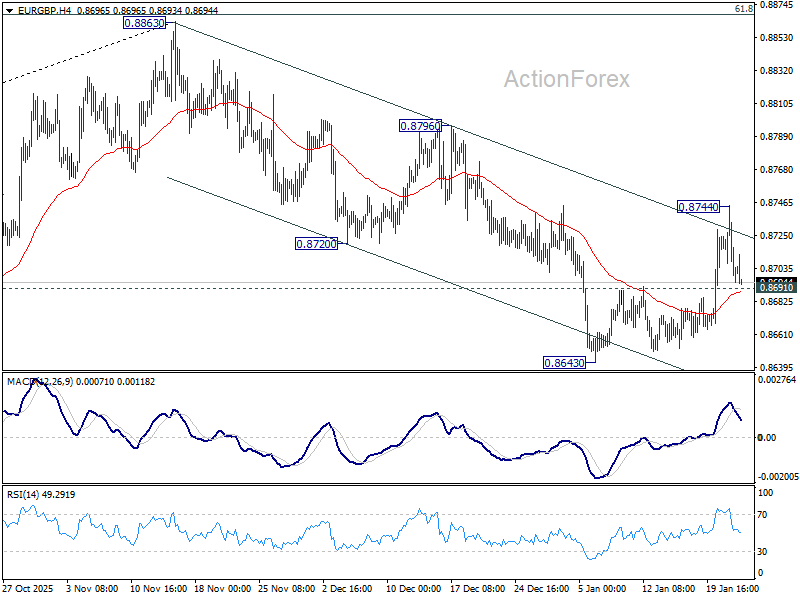
EUR/GBP Daily Outlook
Daily Pivots: (S1) 0.8686; (P) 0.8716; (R1) 0.8733; More…
Intraday bias in EUR/GBP is turned neutral first with current retreat. On the downside, firm break of 0.8691 resistance turned support will suggest that rebound form 0.8643 has completed as a corrective bounce. Rejection by 55 D EMA (now at 0.8717) will keep the fall from 0.8863 intact. Intraday bias will be back on the downside for 0.8643 low first, and then 0.8631 cluster support (38.2% retracement of 0.8221 to 0.8663 at 0.8618).
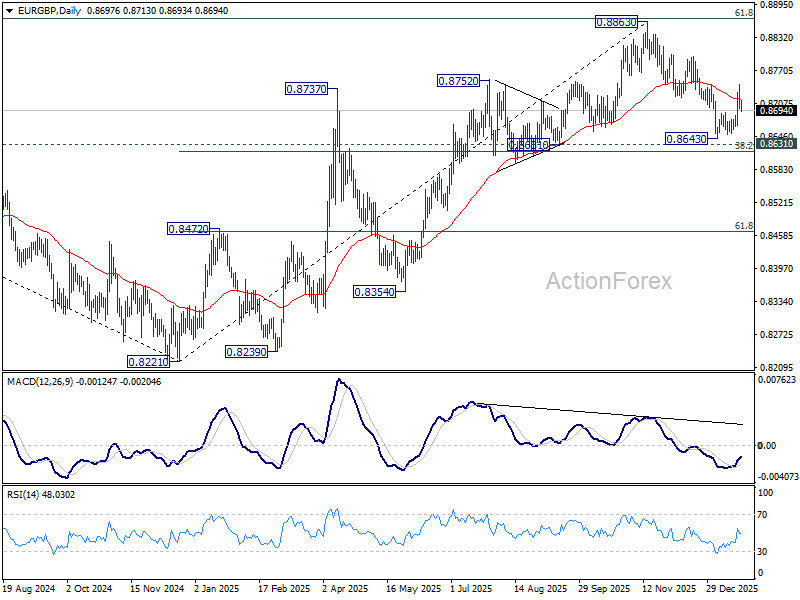
In the bigger picture, rise from 0.8221 medium term bottom (2024 low) is seen as a corrective move. Upside should be limited by 61.8% retracement of 0.9267 to 0.8221 at 0.8867. Sustained trading below 55 W EMA (now at 0.8623) should confirm that this corrective bounce has completed. In this case, deeper fall would be seen back to 0.8201/21 key support zone. However, decisive break of 0.8867 will suggest that EUR/GBP is already reversing whole decline from 0.9267 (2022 high). That should pave the way back to 0.9267.
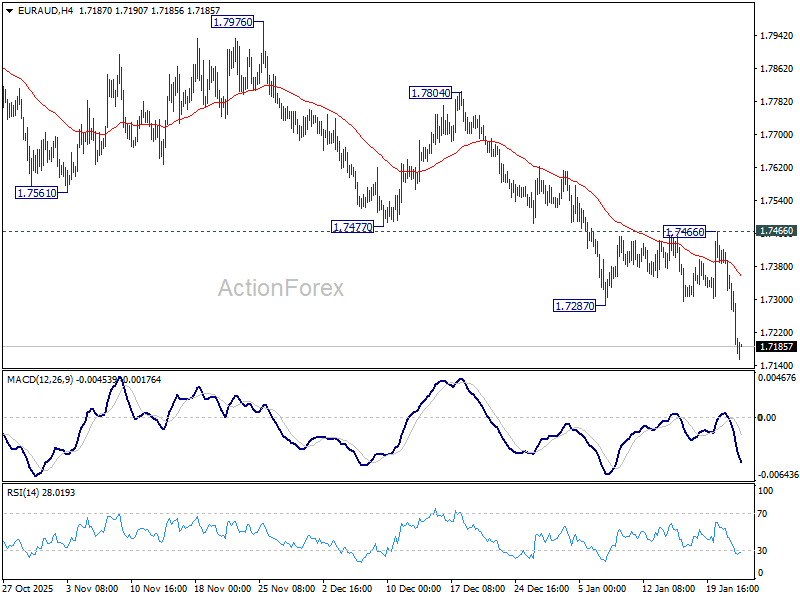
EUR/AUD Daily Outlook
Daily Pivots: (S1) 1.7230; (P) 1.7326; (R1) 1.7379; More...
EUR/AUD's fall from 1.8160 resumed by breaking through 1.7287 and intraday bias is back on the downside. Current decline is seen as the third leg of the whole pattern from 1.8554. Next target is 100% projection of 1.8554 to 1.7245 from 1.8160 at 1.6851. For now, outlook will stay bearish as long as 1.7466 resistance holds, in case of recovery.
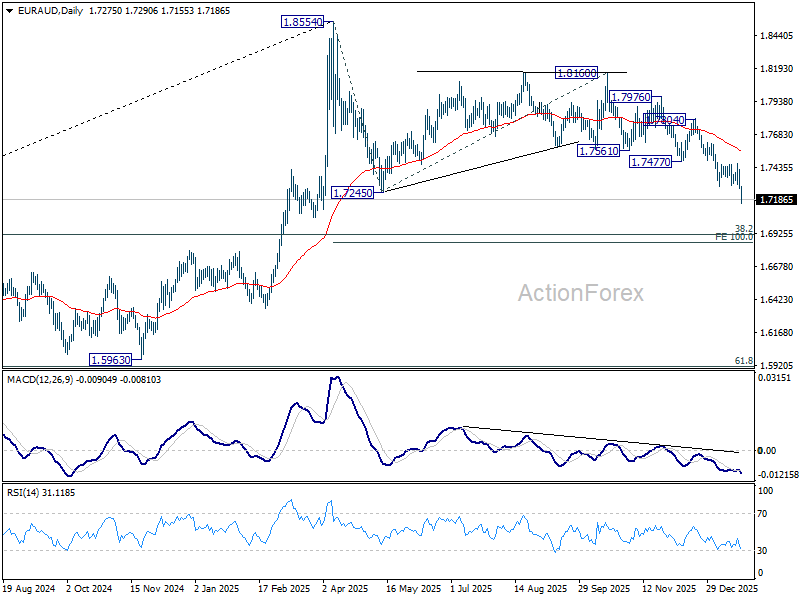
In the bigger picture, the break of 55 W EMA (now at 1.7464) argues that fall from 1.8554 medium term top is correcting whole up trend from 1.4281 (2022 low). Deeper decline is in favor to 38.2% retracement of 1.4281 to 1.8554 at 1.6922, and possibly below. Risk will stay on the downside as long as 1.8160 resistance holds, in case of strong rebound.
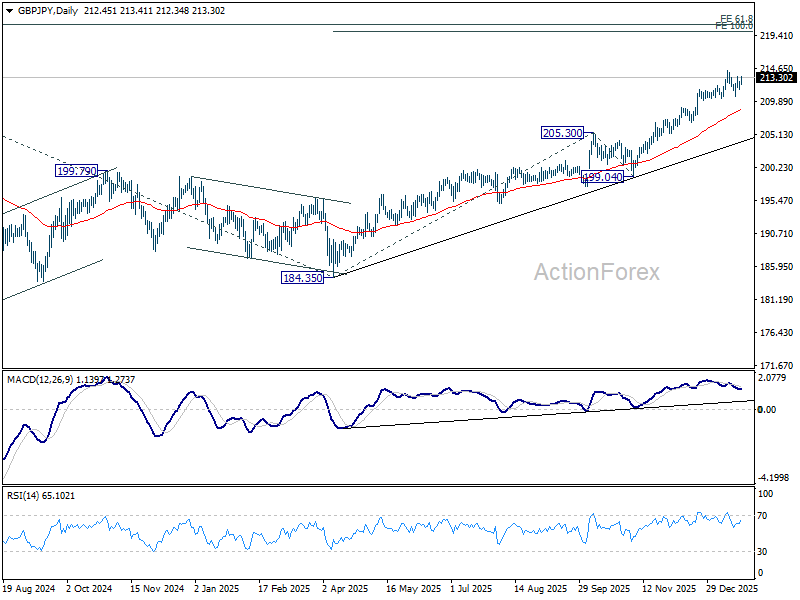
GBP/JPY Daily Outlook
Daily Pivots: (S1) 211.90; (P) 212.34; (R1) 213.08; More...
Range trading continues in GBP/JPY below 214.27 and intraday bias stays neutral. With 210.28 support intact, further rally is expected. On the upside, break of 214.27 will resume larger up trend to 100% projection of 184.35 to 205.30 from 199.04 at 219.99 next. Nevertheless, considering bearish divergence condition in 4H MACD, firm break of 210.28 will confirm short term topping, and turn bias to the downside for deeper pullback to 55 D EMA (now at 208.71).
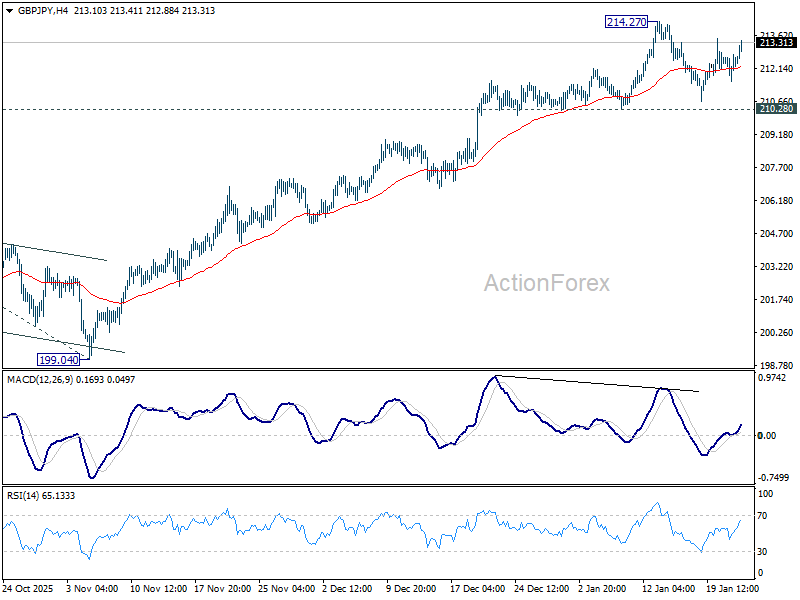
In the bigger picture, up trend from 123.94 (2020 low) is in progress. Next target is 61.8% projection of 148.93 (2022 low) to 208.09 (2024 high) from 184.35 at 220.90. On the downside, break of 205.30 resistance turned support is needed to indicate medium term topping. Otherwise, outlook will stay bullish even in case of deep pullback.
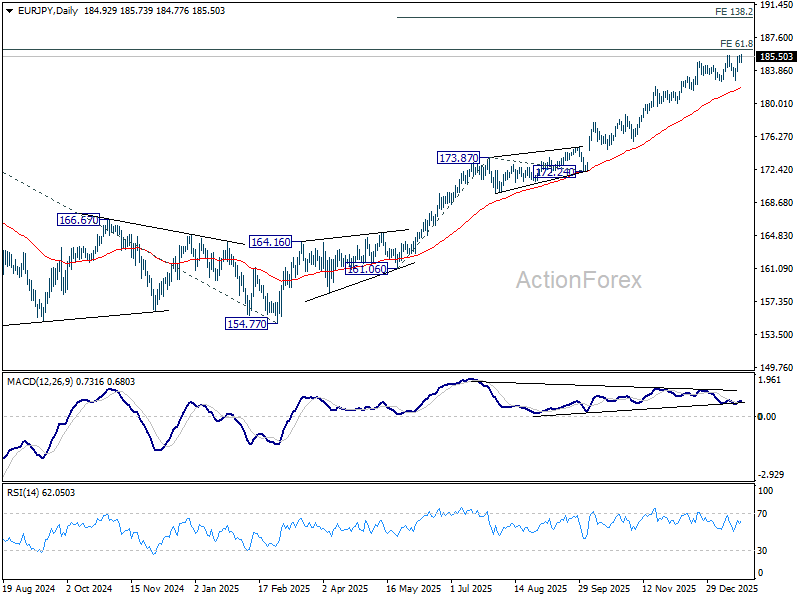
EUR/JPY Daily Outlook
Daily Pivots: (S1) 184.71; (P) 185.13; (R1) 185.43; More...
Intraday bias in EUR/JPY is back on the upside as breach of 185.55 suggests resumption of the long term up trend. Next target is 186.31 projection level. Firm break there will target 138.2% projection of 151.06 to 173.87 from 172.24 at 189.94. On the downside, below 184.77 will delay the bullish case and turn intraday bias neutral again. But further rally is expected as long as 182.75 support holds, in case of retreat.
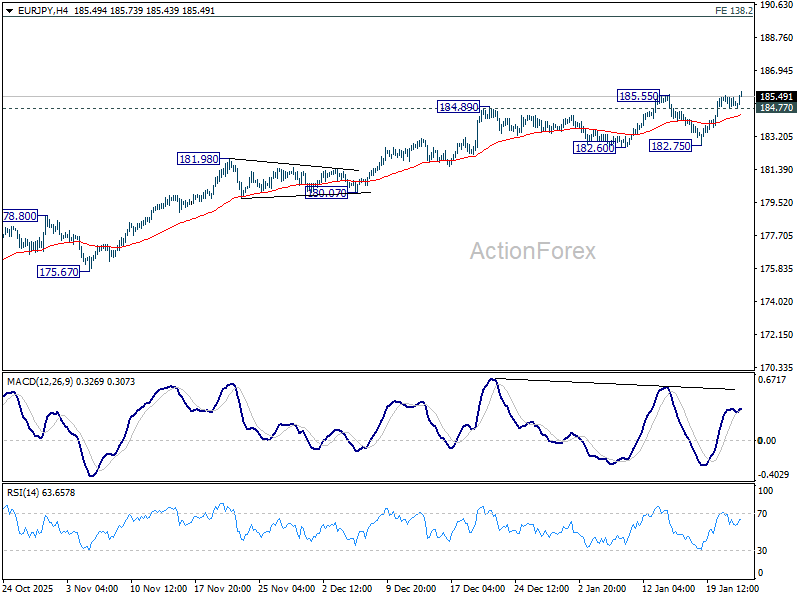
In the bigger picture, up trend from 114.42 (2020 low) is in progress and should target 61.8% projection of 124.37 to 175.41 from 154.77 at 186.31. Considering bearish divergence condition in D MACD, upside could be capped by 186.31 on first attempt. Still, outlook will stay bullish as long as 55 W EMA (now at 172.58) holds, even in case of deep pullback. Sustained break of 186.31 will pave the way to 78.6% projection at 194.88 next.
Greenland Framework Triggers Risk-On Turn, Trade War Fears Recede
Market sentiment staged a sharp U-turn after signs that U.S.–European tensions over Greenland had moved toward resolution. The immediate risk of a transatlantic trade war has been averted for now, allowing investors to unwind defensive positioning built earlier in the week. The pivot lifted global equities, with Japan leading the charge in Asia, while European Indexes jumped at the open. U.S. equity futures also strengthened, building on yesterday’s firm Wall Street close.
Meanwhile, Gold and silver retreated from record highs, signaling a pullback in geopolitical hedging demand. In rates, U.S. 10-year yields slipped back below 4.25%, after briefly breaching 4.30% earlier in the week as term premium surged on political risk.
The catalyst came late Wednesday when US President Donald Trump said he had secured a “framework” deal on Greenland. Trump said the agreement would grant the U.S. and its European allies access to mineral rights and cooperation on the proposed Golden Dome missile defense initiative. Crucially, Trump added that punitive tariffs scheduled for February 1 on several European countries would no longer be imposed, directly removing the market’s most immediate escalation risk.
Speaking minutes after the social media post in an interview with CNBC, Trump described the Greenland arrangement as the “concept of a deal.” He offered few details, saying the proposal was complex and would be explained later, but reiterated that minerals and missile defense cooperation were central.
European reaction was cautiously constructive. Danish Prime Minister Mette Frederiksen welcomed the shift, saying Denmark was prepared to hold talks with Washington on the Golden Dome plan. She also said it was “good and natural” that Arctic security had been discussed between Trump and Mark Rutte at the World Economic Forum, reinforcing the view that the matter is being handled within an alliance framework.
In FX markets, Australian Dollar is leading the performance table for the day, alongside the New Zealand Dollar, both benefiting from the risk-on turn. Aussie is drawing additional support from strong jobs data, which has lifted expectations for an RBA rate hike in February. At the other end, Yen is the weakest performer, followed by Dollar. European majors are mixed in the middle, trading alongside Loonie.
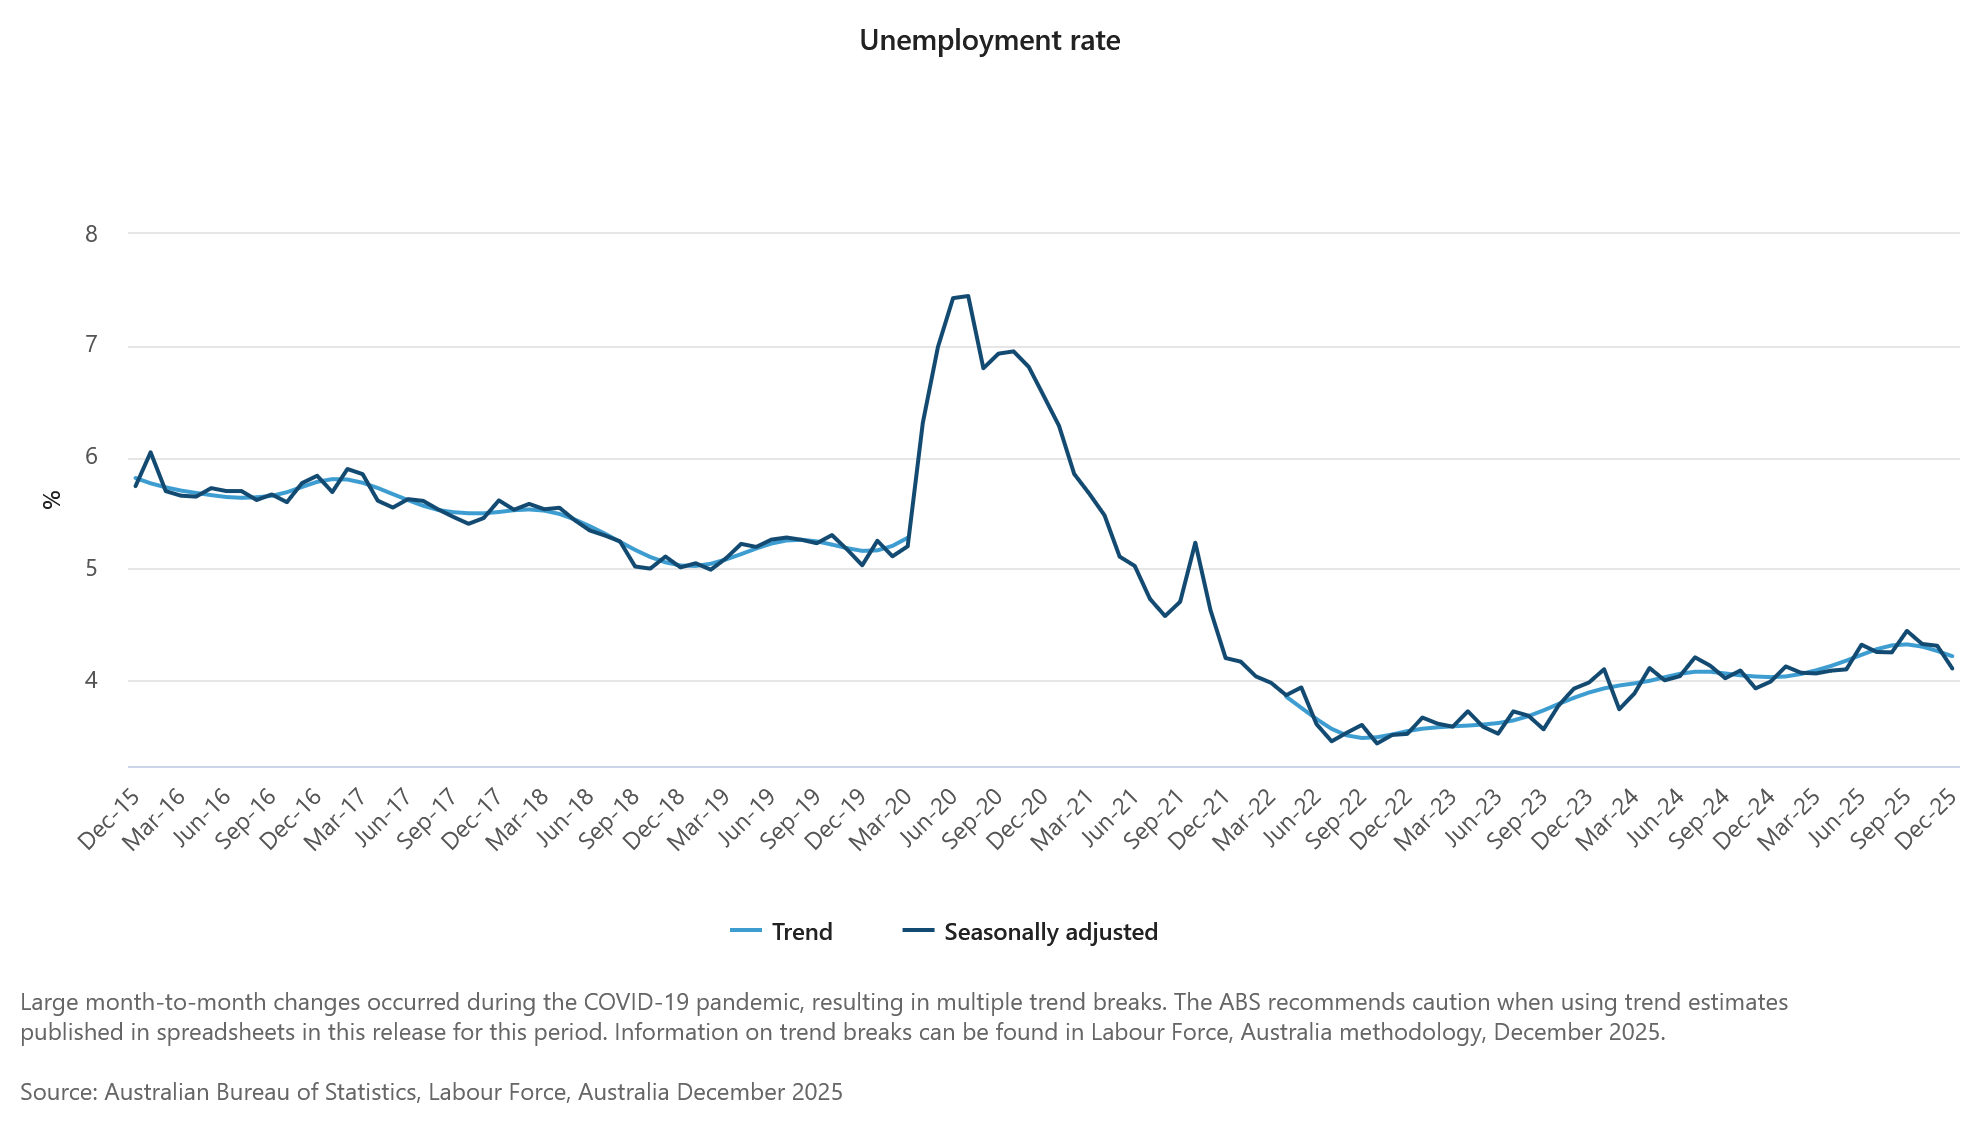
Australia jobs surge 65.2k in December, unemployment drops to 4.1%
Australia’s labor market delivered a major upside surprise in December, reinforcing the picture of persistent tightness. Employment surged 65.2k, more than double expectations of 26.5k, driven primarily by a strong rise in full-time jobs (+54.8k), with part-time employment also increasing (+10.4k).
The strength fed directly into the unemployment rate, which fell from 4.3% to 4.1%, far below expectations of 4.4% and matching the joint-lowest level since December 2024. The participation rate held steady at 66.8%, while monthly hours worked rose 0.4% mom, signaling that labor demand remains robust rather than superficial.
According to Sean Crick, head of labour statistics at Australian Bureau of Statistics, the drop in unemployment was partly driven by more younger people entering the workforce. Even so, the scale of job creation highlights an economy that continues to absorb new entrants with ease.
RBA hike risks jump, AUD/USD heading to 7.2, AUD/JPY to 110
The Australian Dollar surged sharply as markets aggressively repriced interest-rate expectations following much stronger-than-expected jobs data. The rally reflects a swift reassessment of policy risk, with labor market resilience undermining the assumption that unemployment would drift higher and cool inflation pressures on its own.
The key shift is the absence of any rise in unemployment, which raises the risk that inflation could re-accelerate without additional policy restraint. In that context, markets are increasingly open to the idea that another rate hike may be required in the near term to keep price pressures contained.
That said, conviction remains conditional. The decisive input will be next week’s quarterly inflation report, which is likely to determine whether labor strength translates into a renewed inflation problem or simply reflects lagging labor-market adjustment.
Technically, AUD/USD broke above 0.68 handle, with D MACD suggesting the move is accelerating. The next immediate target sits at 61.8% projection of 0.5913 to 0.6706 from 0.6420 at 0.6910. As long as 0.6667 support holds, near-term outlook remains bullish, even if consolidation emerges along the way.
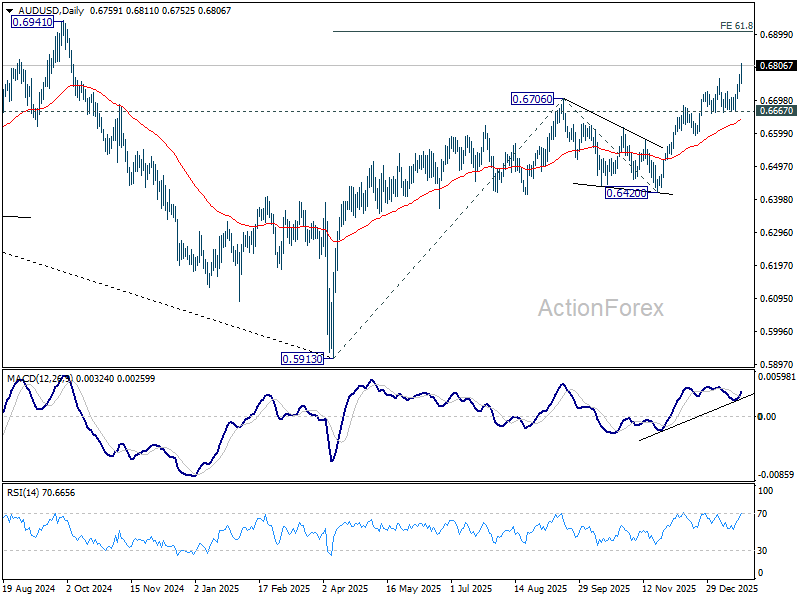
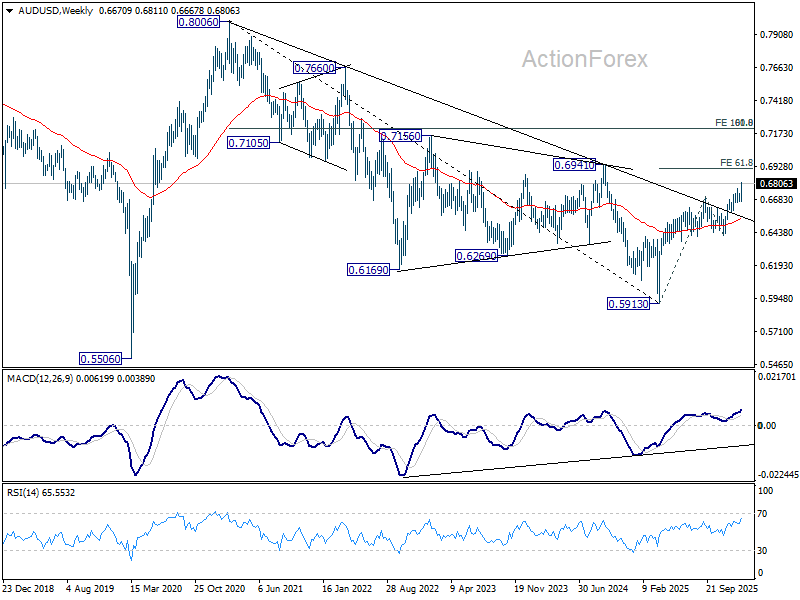
More importantly, the current advance strengthens the case that the rally from 0.5913 is reversing the entire downtrend from 2021 high at 0.8006. Firm break above 0.6941 would be a solid confirmation. Next target will be at around 0.72, which is 100% projection at 0.7213, which is close to 61.8% retracement of 0.8006 to 0.5913 at 0.7206.
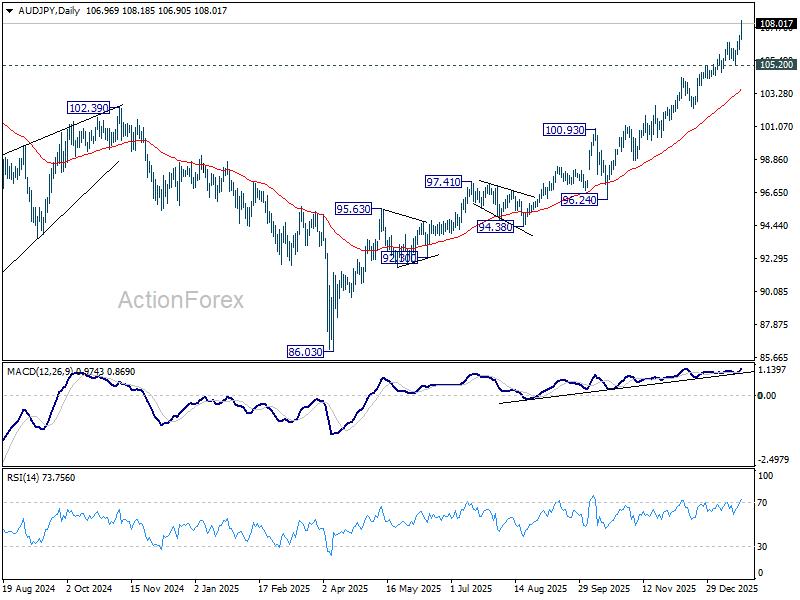
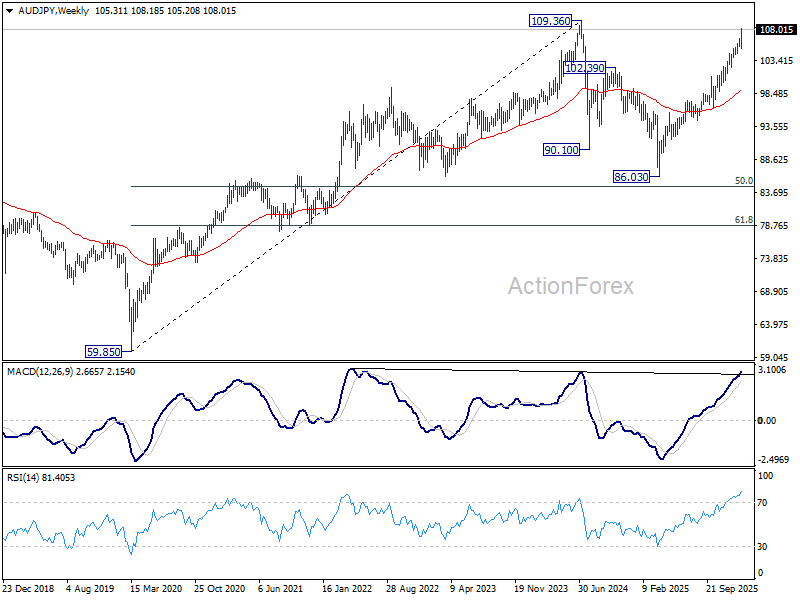
AUD/JPY is also surging, with the uptrend from 86.03 (2025 low) on track to retest 109.36, 2024 high. Given current momentum, a break above that level is likely to resume the long-term uptrend from 59.85 (2020 low). In any case, outlook will stay bullish as long as 105.20 support holds.
EUR/JPY Daily Outlook
Daily Pivots: (S1) 184.71; (P) 185.13; (R1) 185.43; More...
Intraday bias in EUR/JPY is back on the upside as breach of 185.55 suggests resumption of the long term up trend. Next target is 186.31 projection level. Firm break there will target 138.2% projection of 151.06 to 173.87 from 172.24 at 189.94. On the downside, below 184.77 will delay the bullish case and turn intraday bias neutral again. But further rally is expected as long as 182.75 support holds, in case of retreat.
In the bigger picture, up trend from 114.42 (2020 low) is in progress and should target 61.8% projection of 124.37 to 175.41 from 154.77 at 186.31. Considering bearish divergence condition in D MACD, upside could be capped by 186.31 on first attempt. Still, outlook will stay bullish as long as 55 W EMA (now at 172.58) holds, even in case of deep pullback. Sustained break of 186.31 will pave the way to 78.6% projection at 194.88 next.
RBA hike risks jump, AUD/USD heading to 7.2, AUD/JPY to 110
The Australian Dollar surged sharply as markets aggressively repriced interest-rate expectations following much stronger-than-expected jobs data. The rally reflects a swift reassessment of policy risk, with labor market resilience undermining the assumption that unemployment would drift higher and cool inflation pressures on its own.
The key shift is the absence of any rise in unemployment, which raises the risk that inflation could re-accelerate without additional policy restraint. In that context, markets are increasingly open to the idea that another rate hike may be required in the near term to keep price pressures contained.
That said, conviction remains conditional. The decisive input will be next week’s quarterly inflation report, which is likely to determine whether labor strength translates into a renewed inflation problem or simply reflects lagging labor-market adjustment.
Technically, AUD/USD broke above 0.68 handle, with D MACD suggesting the move is accelerating. The next immediate target sits at 61.8% projection of 0.5913 to 0.6706 from 0.6420 at 0.6910. As long as 0.6667 support holds, near-term outlook remains bullish, even if consolidation emerges along the way.
More importantly, the current advance strengthens the case that the rally from 0.5913 is reversing the entire downtrend from 2021 high at 0.8006. Firm break above 0.6941 would be a solid confirmation. Next target will be at around 0.72, which is 100% projection at 0.7213, which is close to 61.8% retracement of 0.8006 to 0.5913 at 0.7206.
AUD/JPY is also surging, with the uptrend from 86.03 (2025 low) on track to retest 109.36, 2024 high. Given current momentum, a break above that level is likely to resume the long-term uptrend from 59.85 (2020 low). In any case, outlook will stay bullish as long as 105.20 support holds.
Australia jobs surge 65.2k in December, unemployment drops to 4.1%
Australia’s labor market delivered a major upside surprise in December, reinforcing the picture of persistent tightness. Employment surged 65.2k, more than double expectations of 26.5k, driven primarily by a strong rise in full-time jobs (+54.8k), with part-time employment also increasing (+10.4k).
The strength fed directly into the unemployment rate, which fell from 4.3% to 4.1%, far below expectations of 4.4% and matching the joint-lowest level since December 2024. The participation rate held steady at 66.8%, while monthly hours worked rose 0.4% mom, signaling that labor demand remains robust rather than superficial.
According to Sean Crick, head of labour statistics at Australian Bureau of Statistics, the drop in unemployment was partly driven by more younger people entering the workforce. Even so, the scale of job creation highlights an economy that continues to absorb new entrants with ease.
EUR/USD Faces Reduced Risks After Volatility; Bearish Trend Continues
EUR/USD held steady at 1.1684 on Thursday, following three days of heightened volatility. This stabilisation comes as geopolitical and trade tensions between the US and Europe over Greenland ease.
US President Donald Trump has de-escalated tensions by ruling out the use of military force to gain control of Greenland and softening his tariff rhetoric towards European nations after reaching a framework agreement with NATO. However, the details remain unclear, and Denmark has already stated that it is not considering negotiations over transferring the territory to the US.
On the US domestic front, attention is shifting to the release of data on initial unemployment claims, which could provide further insights into the labour market. The Federal Reserve is expected to keep rates unchanged at its next meeting, although the market anticipates a total rate cut of 50 basis points by the end of the year.
The US dollar has seen general strength against the euro but continues to weaken against the Australian and New Zealand dollars.
Technical Analysis
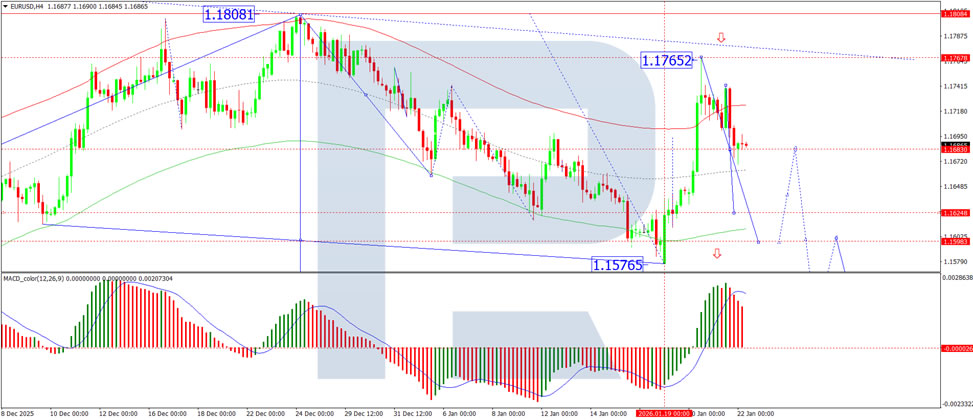
On the H4 chart, EUR/USD is consolidating around 1.1683. We anticipate a downward movement, with the potential for the bearish trend to continue towards 1.1628, possibly 1.1598. This scenario is supported by the MACD indicator, which shows the signal line above zero and pointing downward, reflecting ongoing bearish momentum.
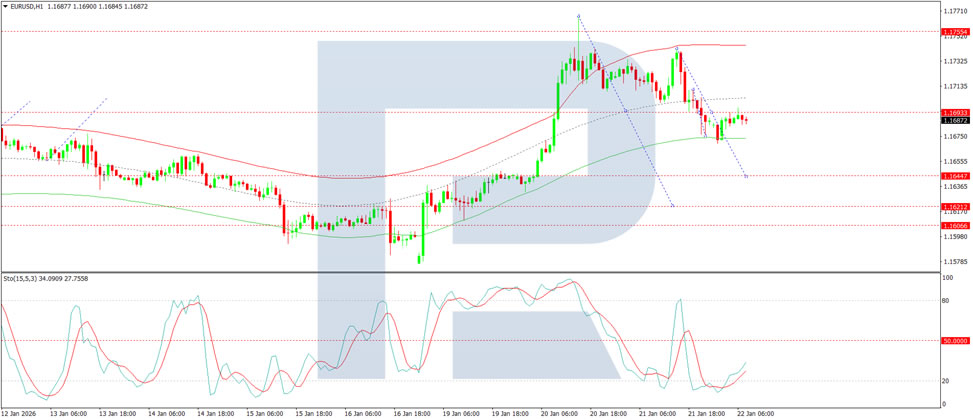
On the H1 chart, a wave of decline is forming towards 1.1644. After reaching this level, a correction to 1.1690 is expected, followed by a further decline to 1.1620. This outlook is confirmed by the Stochastic oscillator, whose signal line is below 50 and pointing downward to 20.
Conclusion
EUR/USD remains in a consolidation phase, with a bearish trend still in play. Geopolitical tensions have subsided, but risks remain. Investors are closely watching US labour market data, which may influence the next moves for the dollar and euro. Technically, the pair remains in a downward bias, with key support levels at 1.1628 and 1.1598.