
Sample Category Title
EUR/USD Faces Reduced Risks After Volatility; Bearish Trend Continues
EUR/USD held steady at 1.1684 on Thursday, following three days of heightened volatility. This stabilisation comes as geopolitical and trade tensions between the US and Europe over Greenland ease.
US President Donald Trump has de-escalated tensions by ruling out the use of military force to gain control of Greenland and softening his tariff rhetoric towards European nations after reaching a framework agreement with NATO. However, the details remain unclear, and Denmark has already stated that it is not considering negotiations over transferring the territory to the US.
On the US domestic front, attention is shifting to the release of data on initial unemployment claims, which could provide further insights into the labour market. The Federal Reserve is expected to keep rates unchanged at its next meeting, although the market anticipates a total rate cut of 50 basis points by the end of the year.
The US dollar has seen general strength against the euro but continues to weaken against the Australian and New Zealand dollars.
Technical Analysis
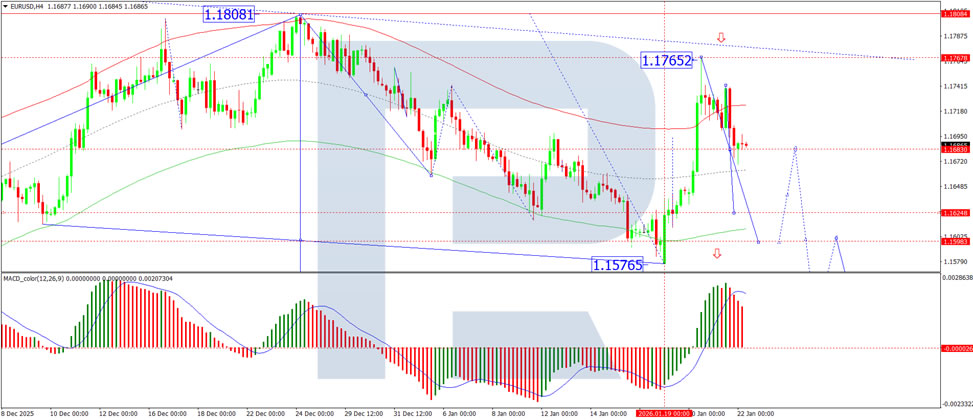
On the H4 chart, EUR/USD is consolidating around 1.1683. We anticipate a downward movement, with the potential for the bearish trend to continue towards 1.1628, possibly 1.1598. This scenario is supported by the MACD indicator, which shows the signal line above zero and pointing downward, reflecting ongoing bearish momentum.
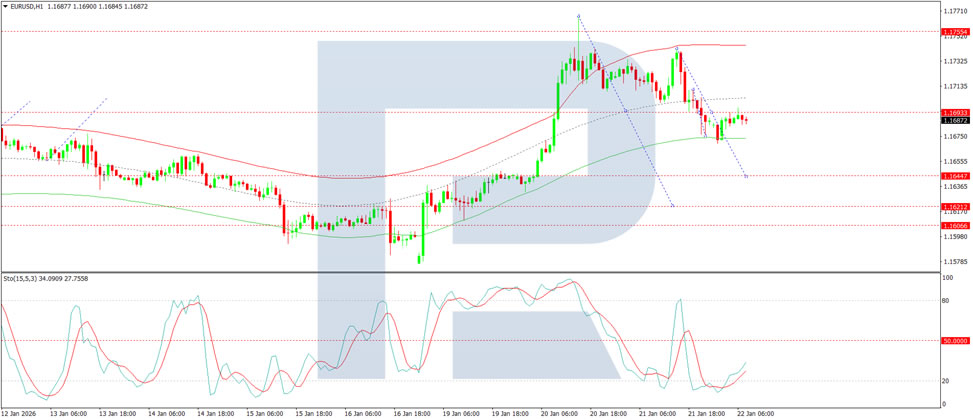
On the H1 chart, a wave of decline is forming towards 1.1644. After reaching this level, a correction to 1.1690 is expected, followed by a further decline to 1.1620. This outlook is confirmed by the Stochastic oscillator, whose signal line is below 50 and pointing downward to 20.
Conclusion
EUR/USD remains in a consolidation phase, with a bearish trend still in play. Geopolitical tensions have subsided, but risks remain. Investors are closely watching US labour market data, which may influence the next moves for the dollar and euro. Technically, the pair remains in a downward bias, with key support levels at 1.1628 and 1.1598.
Once Again, Trimmed Mean Gets the Casting Vote
Surprisingly strong labour market data means the RBA’s February decision will (again) hinge on next week’s inflation data. Chance of a hike shifts closer to a 50:50 call but could end up being an awkward ‘one-and-done’.
- RBA does not really run policy by just reacting to the latest trimmed mean inflation print, but sometimes it looks that way. The inflation data (due next week) will once again have the casting vote in the RBA policy meeting in February.
- Stronger labour market and consumer spending data are feeding into a narrative that the Australian economy is running too hot. We think the true situation is more nuanced, with supply capacity expanding faster than the RBA and some others believe. Even so, these stronger data offset the downward revision to our expectations for Q4 inflation. An upside surprise next week relative to these downwardly revised inflation expectations will tip the balance over to a February hike.
- While the near-term starting point for domestic demand and the labour market is stronger than previously understood, a near-term hike will dampen the outlook further out. It will also pose some awkward questions about why policy needs to be almost as tight to squeeze out the last half a point of inflation as it was to reduce from 8% to 3%, and why it needs to be so much higher than expected in peer economies.
In a recent interview, RBA Deputy Governor Andrew Hauser complained that some people seemed to think the RBA runs policy as a knee-jerk response to the latest inflation data. That is not really how they do it, of course. The RBA looks at every piece of data, including some things the private sector does not get to see. Yet for the past year or so, quarterly CPI prints, especially the trimmed mean, have been unusually consequential for monetary policy decisions.
If it is any consolation to Deputy Governor Hauser, we are as annoyed about this as he seems to be. Things should never be this line-ball, but it is partly an outworking of the RBA’s decision-making process. When the other data are finely balanced, the data point that comes out last gets the casting vote. And because the forecast rounds ahead of RBA meetings are timed to take place just after that CPI release, it appears as if everything turns on it.
In addition, the RBA’s current assessment of the balance of supply and demand in the economy – and the weight this has in its decision-making – makes the inflation print even more consequential. If inflation surprises on the upside, its thinking goes, it must therefore be that the balance of supply and demand was tighter than previously believed. For any given GDP outcome, this therefore leads the RBA to conclude that supply capacity is weaker than previously thought, and this conclusion from the inflation print is carried forward into the RBA’s view of the broader outlook. While more recently there have been some attempts to triangulate this view of supply against business survey measures, by design recent inflation surprises heavily influence policy outcomes.
With this week’s release of surprisingly strong labour market data for December, we are – once again – in the position of the cash rates view hinging on the CPI print next week. We have previously flagged the possibility that another uncomfortably high inflation result will induce a near-term hike in the cash rate at the February meeting. That possibility shifted closer to a 50:50 bet with the labour market data. It could tip over the line if trimmed mean inflation prints higher than expected.
At the same time, we note that the first two months of the quarter point to some downside risk to the inflation print. We have incorporated some of this into our nowcast for inflation, with the quarterly trimmed mean measure now expected to print at 0.7%qtr (3.1%yr). An outcome at this level or lower should be enough to stay the RBA’s hand, at least for now. The rhetoric would remain hawkish, but such a result would support the RBA’s earlier assessment that some of the surprise September quarter inflation result reflected temporary factors.
If, however, the December quarter inflation result surprises us on the upside next week, the RBA will likely see little alternative to raising the cash rate in February. Such a response would buy into a narrative that the Australian economy is running too hot with interest rates at current levels. The RBA might even take the view that policy has been stimulatory with the cash rate at current levels and that the previous cuts were in hindsight a mistake. We would not draw that conclusion, but we can see how recent consumer spending and labour market data would lend themselves to it. And although the near-term demand picture is stronger, a February hike would induce a weaker outlook further out.
If the RBA does end up hiking in February, it would be unlikely to follow that up with a back-to-back hike in March. Even with a more hawkish view of where ‘neutral’ policy settings are, a 50bp increase would take the cash rate almost all the way back to the peak in rates that everybody at the time thought was very restrictive. It would seem odd if almost the same policy setting was needed to get underlying inflation from the low 3s to 2½% as was needed to get inflation from 8% to 3%, but that is the implication of a two-hike forecast. Instead, a ‘one-and-done’ (or at least ‘one then wait and see’) path might be the outcome. Typically, people rule out a single 25bp move and expect multiple moves, given how little difference a 25bp move makes to inflation forecasts. Nowadays, though, the RBA is in the business of fine-tuning policy to hit that 2½% target midpoint. It might flag the possibility of further hikes in the post-meeting communication but not end up following through.
Also odd is the implication that – if market pricing and bond yields are any guide – Australia apparently needs higher rates than all its peers for years to shake out that last half a point or so of disinflation. Some observers will note that Australia did not hike as far as many of its peers and has seen less of a slowing in the labour market (which was the intent!), but it seems like a big difference now to offset what were not huge differences at the peak.
Part of the issue seems to be the belief that Australia cannot grow faster than about 2% before stoking inflation, much slower than in the past, and yet is actually growing faster than this. We have previously discussed how sensitive these judgements are to underlying assumptions. The thing is, the only way to judge how fast supply capacity is growing in real time is to see how inflation performs given actual growth in output. Once again, trimmed mean inflation gets the casting vote.
The Day Ended Better Than The Way It Started
Markets
The much-anticipated visit at the World Economic Forum in Davos by US President Trump defused the Greenland crisis. During his keynote address, risk sentiment turned less sour after excluding the tail risk of using military force to obtain the “giant piece of ice”. Instead he floated the short term prospect of immediate talks on acquiring Greenland. After European close and following several bilateral meetings including with head of NATO, Rutte, Trump turned to social media announcing a framework for a future deal on Greenland (and the broader arctic region). He dropped the February 1st tariff treat (10%) against eight EU nations and also touted that the US would be involved in Greenland’s mineral rights. The US storyline so far hasn’t been really confirmed/challenged from the European side, though the Danish foreign minister said that the day ended better than the way it started. Financial markets in any case didn’t wait to get the specifics on what has been agreed upon or how the road forward towards a deal exactly looks like. European stock markets erased losses after the WEF speech to close near unchanged. US stock markets grabbed more momentum thanks to social media details, closing up to 1.2% higher. FI and FX markets also retraced on Tuesday’s sell America move. US Treasuries outperformed German Bunds in a bull flattening move that sends the long end of the curve up to 6 bps lower. The German Bund curve still closed in bear steepening fashion (long end up to 3.5 bps higher). Higher energy prices (both oil, but especially gas) because of expected cold winter weather against the background of relatively low inventories are probably also at play. EUR/USD closed at 1.1685 from a start at 1.1725. Apart from the Greenland pivot, markets also welcomed the outcome of the US Supreme Court hearing on Trump’s attempt to fire Fed governor Cook for cause. Most judges side with lower court rulings that the administration is overstepping its authority and thereby risks weakening if not shattering the independence of the US central bank. The court is set to rule on the issue in July.
Asian stock market join the risk rally this morning with only China (flat) underperforming. The very long end of the Japanese yield curve for a second consecutive session shows signs of “stabilization” with the 30-yr yield down 5.4 bps. To put things in perspective: we haven’t returned to last Friday’s closing levels following the nasty JGB sell-off on Monday and Tuesday. Today’s eco calendar contains weekly jobless claims and (outdated & distorted) November PCE deflators and spending/income data. The ECB published minutes of its December meeting. These data/events will play second fiddle with markets looking for more clues next steps or details about the Greenland framework. The removal of the short term (tariff-escalated) tail risk is one thing, but reaching a sustained deal is still something different. US officials (Witkoff & Kushner) will travel to Russia for talks with Russian president Putin on the latest proposals on a peace plan and serve as a wildcard for trading.
News and views
The Australian Bureau of Statistics this morning published strong/stronger than expected December labour market data. The unemployment rate dropped to 4.1% from 4.3%. The number of employed people rose by 65.2k (after a 28.7k decline in the previous month), mostly driven by higher full employment. The participation rate increased from 66.6% to 66.7, mainly due to young people (15-24-y) moving into employment. The strong labour market data are adding to market expectations that the Reserve Bank of Australia might lift its policy rate already as soon as the February 03 meeting (60% discounted). Other recent data pointed to decent domestic demand with markets looking for final clues in the quarterly CPI report to be released next Wednesday. The Australian 3-y government bond yield this morning rose 6.5 bp to 4.24%. The Aussie dollar jumped higher to test the AUD/USD 0.68 barrier, trading at the strongest levels since October 2024.
The Hungarian government yesterday was reported to set up measures worth HUF 100bn (€260mn) to support the restaurant industry, including liquidity support for the sector, halving a tourism tax and allowing them to treat part of their revenue as a service fee, reducing their tax bills. Separately, Hungarian Prime Minster Orban on social media also announced that he will take extra measures to help households coping with higher energy bills in January because of cold weather. The announcement comes as the government faces a fierce political battle in the run-up to parliamentary elections to be held in April.
Relief, for How Long?
The US President was in Davos yesterday, in case you missed it, and he gave a speech — a long one — in which he said plenty of things that didn’t appeal much to the elite audience in the room. But his much-awaited commentary on Greenland — awaited with fear and pessimism — was not that aggressive.
Donald Trrump said he still wants Greenland, but that he would not move into Greenland or take it over by military force. He also dropped the latest tariffs on eight European countries that opposed the idea of Greenland being bought by the US. Great News!
Markets rallied in relief.
Now yes, this may sound pathetic, but this is how markets have functioned since last year: sell the punch, buy the pullback.
Gold fell, but the price of an ounce remains above the $4’800 level. It was not smashed — a reminder that investors remain somewhat... sceptical. And it’s not just investors: central banks are replacing their US Treasury reserves with gold, a trend that is likely to continue as US international policies become blurrier and more unpredictable by the day, regardless of short-term ups and downs.
In FX, the US dollar rebounded on the de-escalation around Greenland, while US 10-year yields retreated — also helped by a rebound in Japanese bonds, which pulled long-dated JGB yields lower after early-week stress that bordered on a flash crash.
The S&P 500 rebounded more than 1% and the Nasdaq 100 gained 1.36%, with Nvidia jumping nearly 3% after CEO Jensen Huang said scaling AI infrastructure would require trillions of dollars in investment. Disco Corp — a supplier of high-precision semiconductor processing machines used by TSMC, which manufactures Nvidia’s chips — jumped 17%. SK Hynix and Samsung, key memory-chip suppliers, extended their rally, pushing the Kospi to a fresh record high. The Korean index is now up around 20% year-to-date.
Optimism is further fuelled by reports that OpenAI is looking to bring in additional investors from the Middle East.
Interestingly, not everyone in the broader OpenAI ecosystem was reacting positively yesterday. The reactions were significantly different. Oracle fell 3%, Microsoft declined more than 2%, while Intel jumped more than 11% — a notable move for a company about to report another decline in earnings and revenue amid AI delays and ongoing pressure in the PC market. We’ll see how the earnings update goes tonight.
Zooming out, overall market mood has improved. European futures are looking bullish this morning, with Euro Stoxx futures up more than 1.2% at the time of writing, seemingly eager to benefit from TACO Trade v2.0. Nasdaq futures are leading gains among major US indices.
That said, this season of TACO gains could prove less impressive than last year’s. First, there is still no clarity on Greenland — although the fact that Europeans appear willing to draw a red line is a constructive development. Second, there has been no major market stress so far; losses were relatively modest, which also limits the size of the rebound.
What’s next? Markets will continue to react emotionally to US headlines — that won’t change. Uncertainty and sudden volatility spikes will remain on the menu this year. But as a former French prime minister said in reaction to the US president’s Davos speech, people should not react to words — and there are a lot of them coming out of the White House — but to actions. He meant it politically and geopolitically, but the logic applies just as well to markets. That, ultimately, is what the TACO trade is about: stripping out the noise and cutting the grease from overreaction.
Which brings us back to South Korea and the importance of hedging currency risk when diversifying away from the US. The Kospi’s stellar performance does not reflect the broader economy. The grass is not greener there. South Korea’s economy contracted 0.3% in Q4 last year, missing expectations for 0.1% growth due to weak domestic demand and declining exports outside semiconductors.
In short, technology is driving Korean equities higher — much like in China, where tech rallies mask weak domestic demand, the property crisis, deflation and an ageing population. As a result, the Korean won has been weakening, meaning part of the Kospi’s gains comes from currency effects. Investors should therefore hedge FX exposure when venturing into Asia.
Even US dollar exposure has been increasingly hedged by European investors since last year, on the assumption that the dollar may not offer protection if a global sell-off is triggered by US policy itself.
TACO Trade Back in the Driver’s Seat?
In focus today
In Norway, we expect Norges Bank to keep the policy rate unchanged at 4.00% at the monetary policy meeting today. We also expect Norges Bank to signal that 'there is some time until the next rate cut', implying that the threshold for a cut in March is high. This would be in line with the signals given at the December meeting. Considering that unemployment has come in marginally below and inflation marginally above expectations from December, the risk is tilted towards a somewhat more hawkish message than in December. This is an interim meeting, without new economic projections but with a press release and a press conference.
In the euro area, focus turns to the minutes from the December ECB meeting and the flash consumer confidence indicator for January. We will give the ECB minutes an argus-eyed review for any signals about the next rate move. However, we expect a limited market reaction.
In Denmark, the January consumer sentiment indicator is due. We forecast a decline, driven by more negative perceptions of the economy, likely influenced by Trump's interest in Greenland. However, confidence should improve in 2026 as inflation eases, supported by the removal of the electricity tax.
Overnight, the Bank of Japan concludes a two-day policy meeting. With the December rate hike in mind and an upcoming election next month, Bank of Japan will stay on hold, even if a weaker yen continues to feed the inflation problem. Ahead of the decision, we will look for fresh inflation data as well as PMIs.
Economic and market news
What happened yesterday
In geopolitics, yesterday was a day of mixed signals. At the World Economic Forum in Davos, Trump dismissed military action but urged immediate negotiations to acquire Greenland, warning the US would "remember" if no deal was reached. The EU responded by freezing the ratification vote on the EU-US trade deal. Later, following talks with NATO Secretary Rutte, Trump announced a U-turn, stating that "a framework of a future deal" regarding Greenland and the entire Arctic Region had been reached. He also confirmed the cancellation of tariffs set for 1 February. VP Vance and Secretary of State Rubio, Special Envoy Witkoff among others will be responsible for the negotiations. The proposed deal reportedly grants the US access to Greenland's mineral rights, blocks Russian influence, integrates the Golden Dome defence system, and opens doors to US-backed infrastructure investments. Rutte confirmed Greenland's status within the Kingdom of Denmark was not discussed. According to New York times, officials have drawn comparisons between the potential sovereignty over small pockets of Greenland and the status of UK bases in Cyprus, which are classified as British territory. Today, EU leaders will meet at an emergency summit in Brussels to discuss their approach.
In the UK, headline CPI data came in at 3.4% y/y, slightly above consensus, while core CPI was 3.2% y/y, slightly below consensus. Service inflation remains elevated at 4.5% y/y. Two out of the last four prints have been soft, but further disinflationary signs are needed to trigger the next cut.
In the US, the Supreme Court heard oral arguments in the Lisa Cook case. Justices appeared sceptical about Trump's push to fire Cook over alleged mortgage fraud and disagreed with the administration's claim that the president has 'broad discretion' to remove Fed members, citing concerns over Fed independence. They were also frustrated with the administration for bypassing lower courts. While the court seems reluctant to support Cook's dismissal, it remains cautious about creating a precedent that could affect the removal of Fed officials in cases of misconduct.
Equities: Global equity markets staged an almost full reversal of Wednesday's moves yesterday. Cyclicals outperformed, led by the US, broadly in line, in direction and timing, with statements from the US President indicating that tariffs on selected European countries will not be implemented on 1 February, alongside confirmation of a framework agreement with NATO regarding Greenland.
What is at least as notable is where we did not see a reversal. Small caps and value continued to outperform. Small caps have now outperformed on all but one trading day so far this year, which fits well with the underlying fundamental backdrop. This is also a useful reminder that rather than attempting to anticipate the next political headline, markets continue to reward a focus on fundamentals. Asian equities are higher this morning, with the Korean KOSPI approaching a 20% year-to-date gain. European and US equity futures are also pointing higher.
FI and FX: Market sentiment improved substantially yesterday following Trump initially stating he would not take Greenland by force and subsequently when he on social media announced that the Greenland-related tariffs on Denmark and a handful of other European backers were cancelled. Seemingly a framework for a deal around Greenland including mineral rights, small pockets of land, US investments and security planning has been reached - but very little has been confirmed at this stage. EUR/USD has fallen back below the 1.170 on the news while the US curve has flattened on the short-end selling off, and the long-end delivering some slight performance.
Elliott Wave View: Light Crude Oil (CL) Looking for Larger Degree Correction
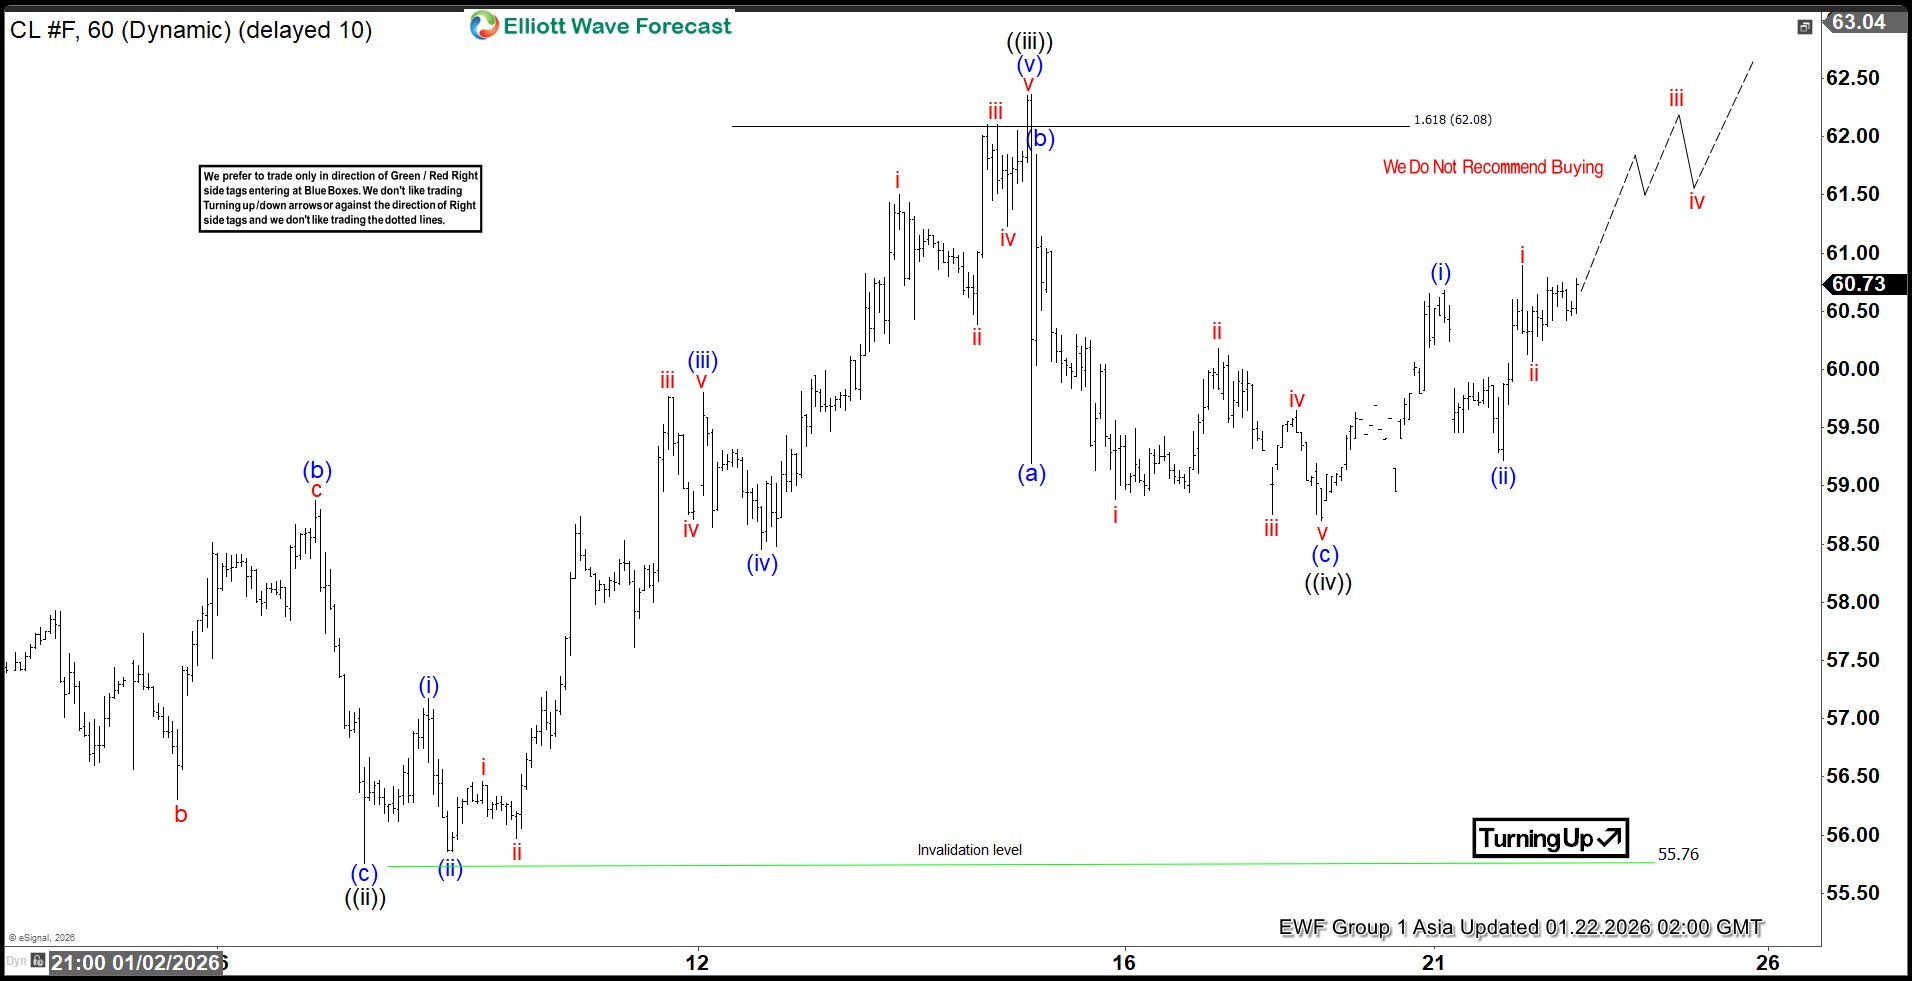
The short-term Elliott Wave outlook for Oil (CL) shows the cycle from the June 23, 2025 peak ended at the December 16, 2025 low of $54.98. After this completion, Oil began correcting the prior cycle in a larger degree, expected to unfold in either three or seven swings. From the December 16 low, wave ((i)) advanced to $58.88. The pullback in wave ((ii)) developed as a zigzag structure. Within this correction, wave (a) ended at $56.65, wave (b) reached $58.87, and wave (c) declined to $55.76. This sequence completed wave ((ii)) in higher degree.
Oil then resumed higher in wave ((iii)), subdividing into five waves. From wave ((ii)), wave (i) ended at $57.17, followed by a pullback in wave (ii) that concluded at $55.86. Wave (iii) advanced to $59.8, while wave (iv) corrected to $58.45. The final leg, wave (v), extended to $62.36, completing wave ((iii)) in higher degree. A corrective phase unfolded in wave ((iv)), again forming a zigzag. From wave ((iii)), wave (a) ended at $59.19, wave (b) advanced to $61.85, and wave (c) declined to $58.7. This completed wave ((iv)) in higher degree. Oil has since turned higher in wave ((v)). From wave ((iv)), wave (i) ended at $60.68, while the pullback in wave (ii) concluded at $59.22. Near term, as long as the pivot at $55.76 remains intact, Oil is expected to continue higher.
Oil (CL) 60 minute chart
CL Elliott Wave video:
https://www.youtube.com/watch?v=-K7iVdxA6uo
Gold Record Rally Ignites $5,000 Speculation Before US GDP Data
Key Highlights
- Gold started a fresh surge and traded to a new all-time high above $4,880.
- A connecting bullish trend line is forming with support at $4,670 on the 4-hour chart.
- WTI Crude Oil prices are attempting to recover above $60.00.
- The US Gross Domestic Product could grow 4.3% in Q3 2025 (Preliminary).
Gold Price Technical Analysis
Gold prices started a fresh rally above $4,500 and $4,600 against the US Dollar. It settled above $4,800 and gained momentum for a new uptrend.
The 4-hour chart of XAU/USD indicates that the price extended gains above $4,850 and traded to a new all-time high above $4,880. The current price action is bullish and suggests that the bulls could aim for more upside.
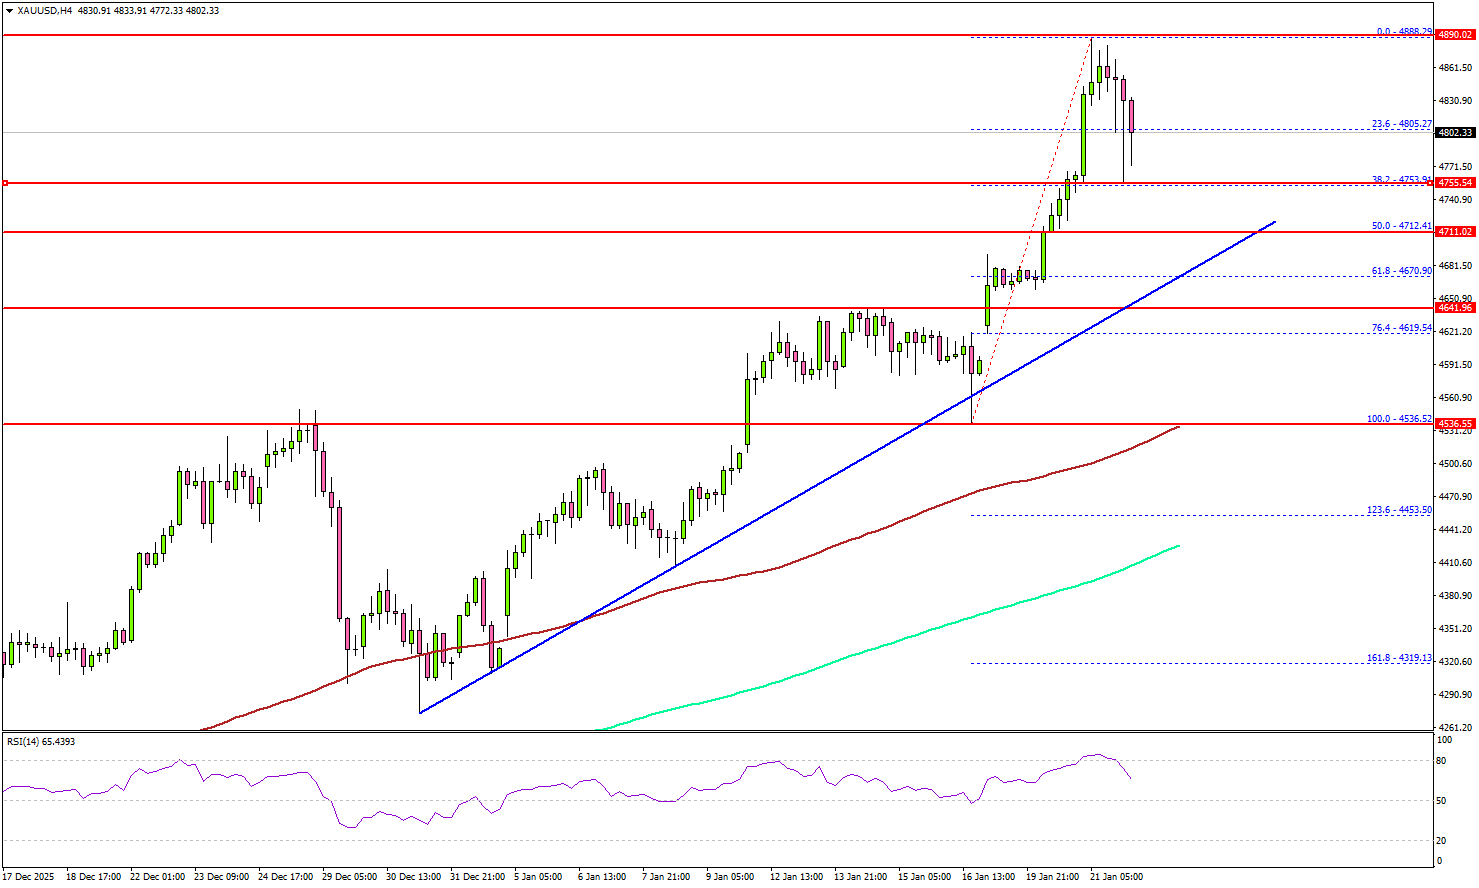
On the upside, immediate resistance is near the $4,850 level. The next major resistance sits near the $4,885 level. A clear move above $4,885 could open the doors for more upside. In the stated case, the bulls could aim for a move toward $4,950. The main target for the bulls could be $5,000.
If there is a pullback, Gold might find bids near the $4,780 level. The first major support sits at $4,750, below which the price might slide to $4,720.
The main support sits at $4,670. There is also a connecting bullish trend line forming with support at $4,670. Any more losses might call for a test of the 100 Simple Moving Average (red, 4 hours) at $4,530 or even the 200 Simple Moving Average (green, 4 hours) at $4,400.
Looking at WTI Crude Oil, the price started a recovery wave, but it continues to face heavy resistance above the $61.20 zone.
Economic Releases to Watch Today
- US Initial Jobless Claims - Forecast 212K, versus 198K previous.
- US Gross Domestic Product for Q3 2025 (Preliminary) – Forecast 4.3% versus previous 4.3%.
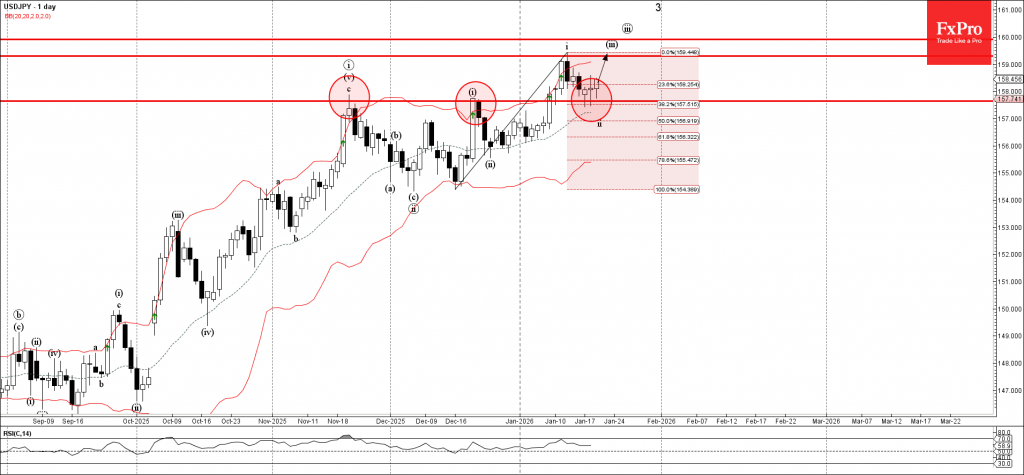
USDJPY Wave Analysis
USDJPY: ⬆️ Buy
- USDJPY reversed from support area
- Likely to rise to resistance level 5.50
USDJPY currency pair recently reversed up from the support area between the support level 157.75 (former strong resistance from November and October) and the 38.2% Fibonacci correction of the upward impulse from December.
The upward reversal from this support area continues the active multi-impulse upward sequence 3 from September.
Given the ы, Uniswap cryptocurrency can be expected to rise to the next resistance level 5.50 (former support from the start of January).
Eco Data 1/22/26
| GMT | Ccy | Events | Act | Cons | Prev | Rev |
|---|---|---|---|---|---|---|
| 23:50 | JPY | Trade Balance (JPY) Dec | -0.21T | -0.01T | 0.06T | 0.01T |
| 00:30 | AUD | Employment Change Dec | 65.2K | 26.5K | -21.3K | -28.7K |
| 00:30 | AUD | Unemployment Rate Dec | 4.10% | 4.40% | 4.30% | |
| 07:00 | GBP | Public Sector Net Borrowing (GBP) Dec | 11.6B | 13.5B | 11.7B | |
| 12:30 | EUR | ECB Monetary Policy Meeting Accounts | ||||
| 13:30 | CAD | New Housing Price Index M/M Dec | -0.20% | -0.20% | 0.00% | |
| 13:30 | USD | Initial Jobless Claims (Jan 16) | 200K | 209K | 198K | |
| 13:30 | USD | GDP Annualized Q3 | 4.40% | 4.30% | 4.30% | |
| 13:30 | USD | GDP Price Index Q3 | 3.70% | 3.80% | 3.80% | |
| 15:00 | USD | Personal Income M/M Nov | 0.30% | 0.40% | 0.10% | |
| 15:00 | USD | Personal Spending M/M Nov | 0.50% | 0.50% | 0.50% | |
| 15:00 | USD | PCE Price Index M/M Nov | 0.20% | 0.20% | 0.20% | |
| 15:00 | USD | PCE Price Index Y/Y Nov | 2.80% | 2.80% | 2.70% | |
| 15:00 | USD | Core PCE Price Index M/M Nov | 0.20% | 0.20% | 0.20% | |
| 15:00 | USD | Core PCE Price Index Y/Y Nov | 2.80% | 2.80% | 2.70% | |
| 15:00 | EUR | Eurozone Consumer Confidence Jan P | -12 | -13 | -15 | |
| 15:30 | USD | Natural Gas Storage (Jan 16) | -120B | -90B | -71B | |
| 17:00 | USD | Crude Oil Inventories (Jan 16) | 3.6M | -1.0M | 3.4M |
| 23:50 | JPY |
| Trade Balance (JPY) Dec | |
| Actual | -0.21T |
| Consensus | -0.01T |
| Previous | 0.06T |
| Revised | 0.01T |
| 00:30 | AUD |
| Employment Change Dec | |
| Actual | 65.2K |
| Consensus | 26.5K |
| Previous | -21.3K |
| Revised | -28.7K |
| 00:30 | AUD |
| Unemployment Rate Dec | |
| Actual | 4.10% |
| Consensus | 4.40% |
| Previous | 4.30% |
| 07:00 | GBP |
| Public Sector Net Borrowing (GBP) Dec | |
| Actual | 11.6B |
| Consensus | 13.5B |
| Previous | 11.7B |
| 12:30 | EUR |
| ECB Monetary Policy Meeting Accounts | |
| Actual | |
| Consensus | |
| Previous | |
| 13:30 | CAD |
| New Housing Price Index M/M Dec | |
| Actual | -0.20% |
| Consensus | -0.20% |
| Previous | 0.00% |
| 13:30 | USD |
| Initial Jobless Claims (Jan 16) | |
| Actual | 200K |
| Consensus | 209K |
| Previous | 198K |
| 13:30 | USD |
| GDP Annualized Q3 | |
| Actual | 4.40% |
| Consensus | 4.30% |
| Previous | 4.30% |
| 13:30 | USD |
| GDP Price Index Q3 | |
| Actual | 3.70% |
| Consensus | 3.80% |
| Previous | 3.80% |
| 15:00 | USD |
| Personal Income M/M Nov | |
| Actual | 0.30% |
| Consensus | 0.40% |
| Previous | 0.10% |
| 15:00 | USD |
| Personal Spending M/M Nov | |
| Actual | 0.50% |
| Consensus | 0.50% |
| Previous | 0.50% |
| 15:00 | USD |
| PCE Price Index M/M Nov | |
| Actual | 0.20% |
| Consensus | 0.20% |
| Previous | 0.20% |
| 15:00 | USD |
| PCE Price Index Y/Y Nov | |
| Actual | 2.80% |
| Consensus | 2.80% |
| Previous | 2.70% |
| 15:00 | USD |
| Core PCE Price Index M/M Nov | |
| Actual | 0.20% |
| Consensus | 0.20% |
| Previous | 0.20% |
| 15:00 | USD |
| Core PCE Price Index Y/Y Nov | |
| Actual | 2.80% |
| Consensus | 2.80% |
| Previous | 2.70% |
| 15:00 | EUR |
| Eurozone Consumer Confidence Jan P | |
| Actual | -12 |
| Consensus | -13 |
| Previous | -15 |
| 15:30 | USD |
| Natural Gas Storage (Jan 16) | |
| Actual | -120B |
| Consensus | -90B |
| Previous | -71B |
| 17:00 | USD |
| Crude Oil Inventories (Jan 16) | |
| Actual | 3.6M |
| Consensus | -1.0M |
| Previous | 3.4M |
The U.S. Dollar in 2025: Down, But Not Out
Highlights
- The U.S. dollar is coming off a difficult year, but concerns that global investors are fleeing it in droves are overblown.
- The depreciation over the past year still leaves the dollar close to 2024 levels on a trade-weighted basis and in line with its long-term average against many major currencies.
- Looking ahead to 2026, we see additional downside to the greenback of around 3%.
- There is little evidence that the diversification away from dollar-centric systems has accelerated, but it does continue gradually.
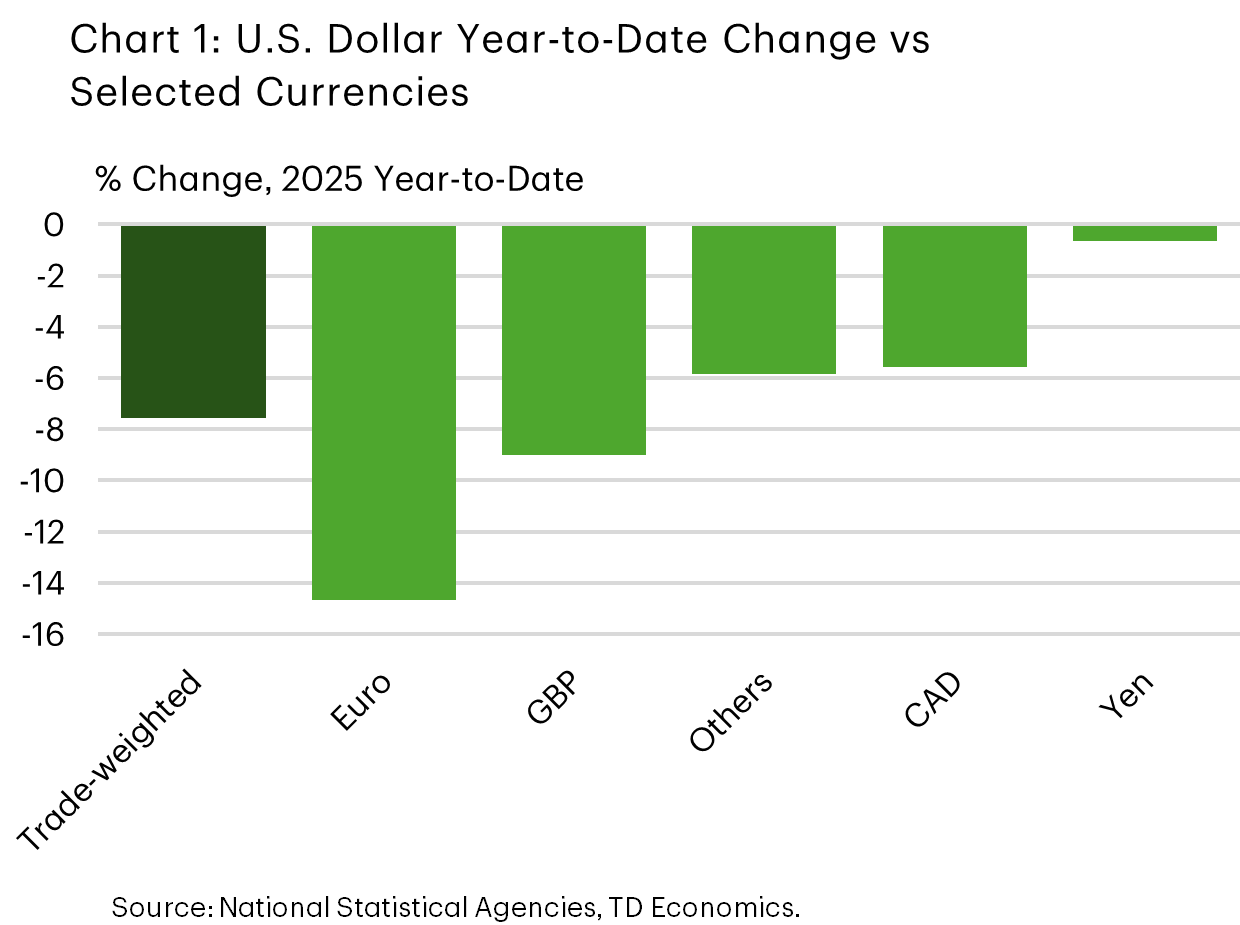
In broad trade‑weighted terms, the U.S. dollar fell roughly 8% in 2025, with a more notable ~10% decline against the majors (Chart 1). This marked an end to a fairly steady run of appreciation since the end of 2023.
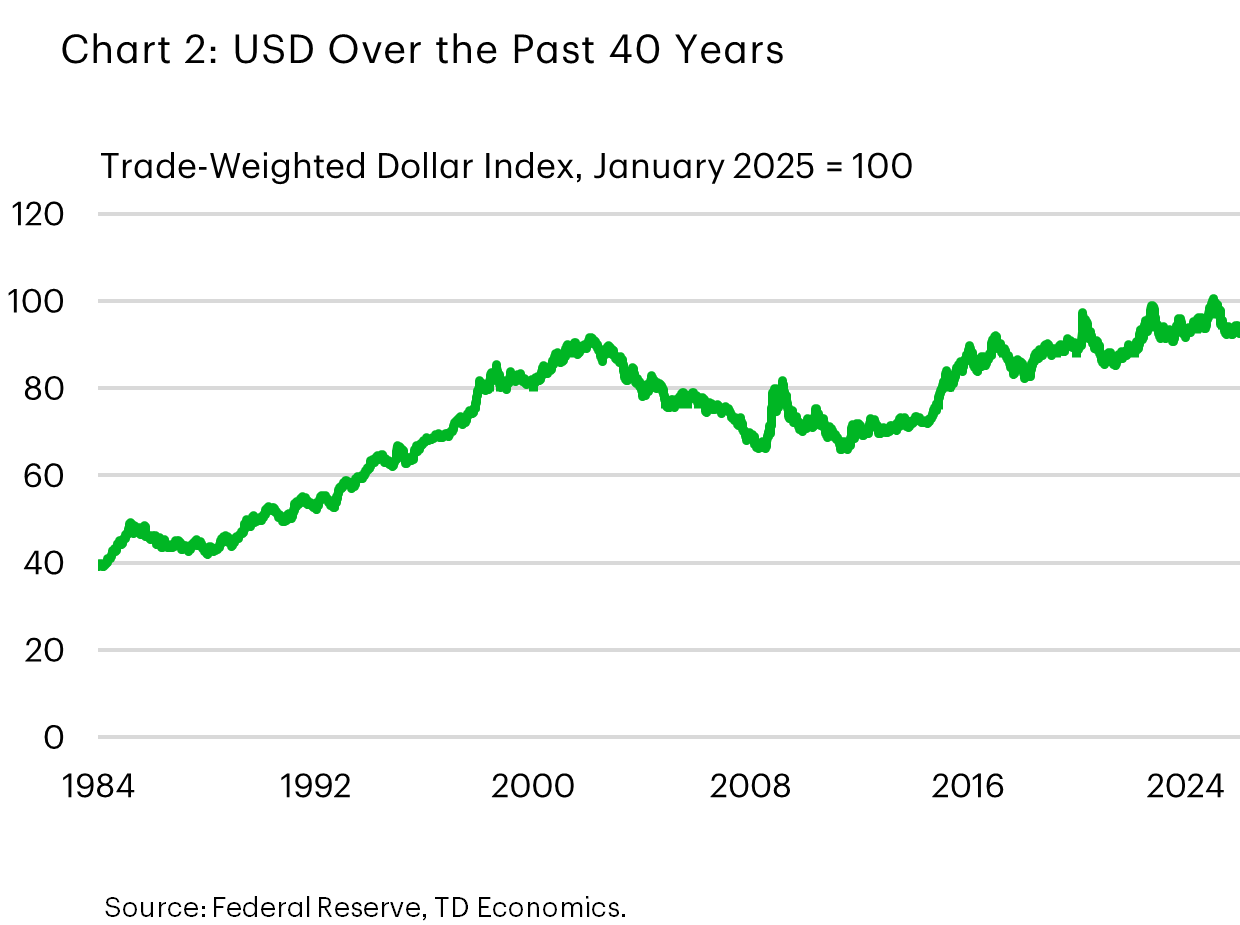
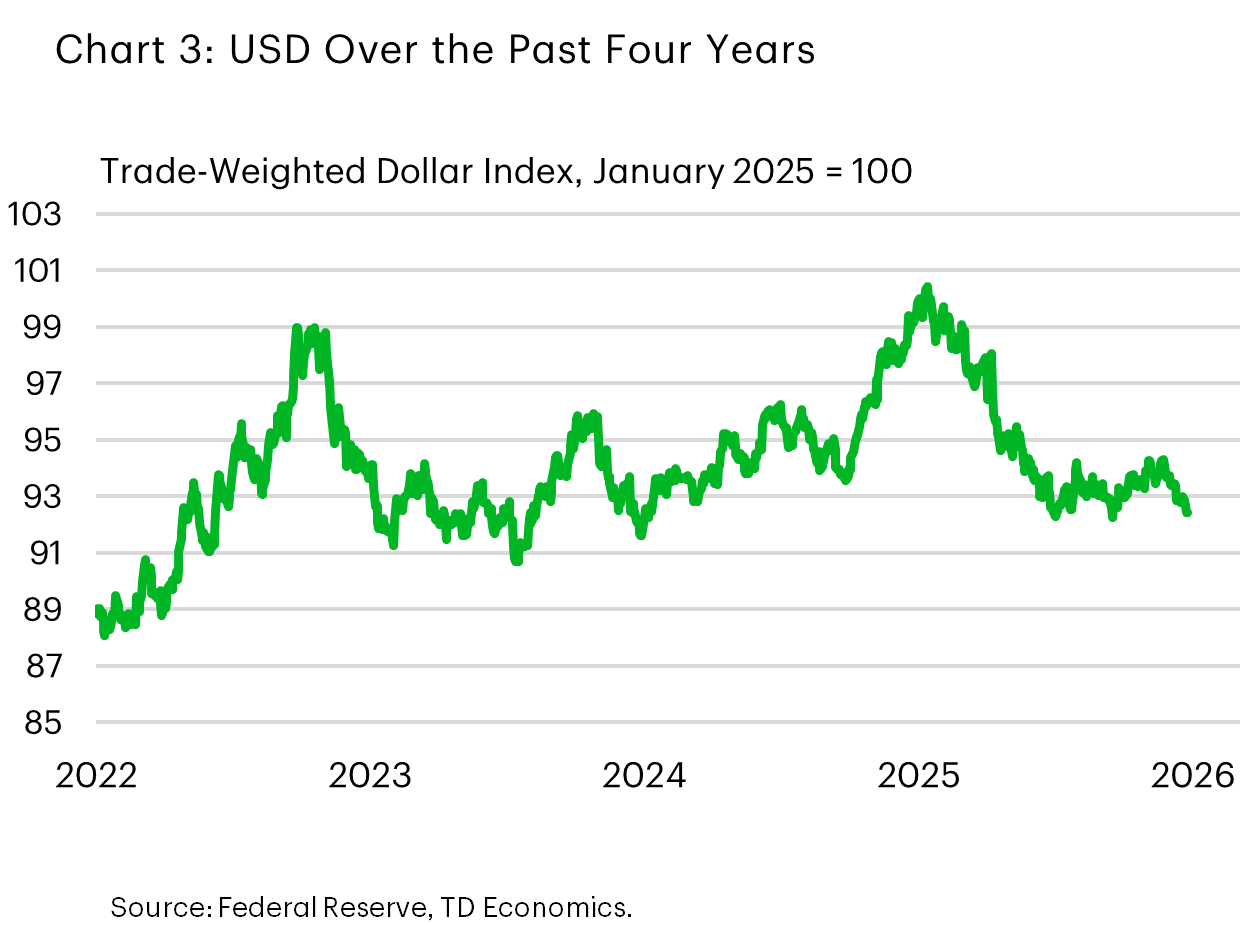
Still, for all the recent chatter around the greenback’s woes the currency is hardly plumbing the depths. Last year’s pull-back only took the USD back to its level prevailing in 2024 and close to its average level over the past decade. Taking an even longer perspective, the trade-weighted dollar continued to hold near its 3-decade high (Chart 2 & 3).
Factors conspiring against the dollar
Part of the perception is fueled by the delta between actual USD performance and the lofty expectations at the start of last year. Many forecasters had anticipated another step up in the dollar in 2025, under the assumption that U.S. import tariffs would be imposed, which in theory should be currency supportive. Moreover, many expected that U.S. growth exceptionalism since the pandemic would carry over into the first half of last year.
It didn’t take long for that thesis to unravel as 2025 got underway. Market attention quickly shifted to the potential negative impact tariffs would have on the U.S. expansion and hopes for Fed rate cuts. Although the rate relief was ultimately delayed until the autumn due to stubborn core inflation, investors never lost hope that U.S. central bank rate cuts would eventually materialize. And, indeed, as the Fed resumed monetary easing in the closing months of 2025, the extra yield offered by dollar-denominated assets relative to global assets narrowed.
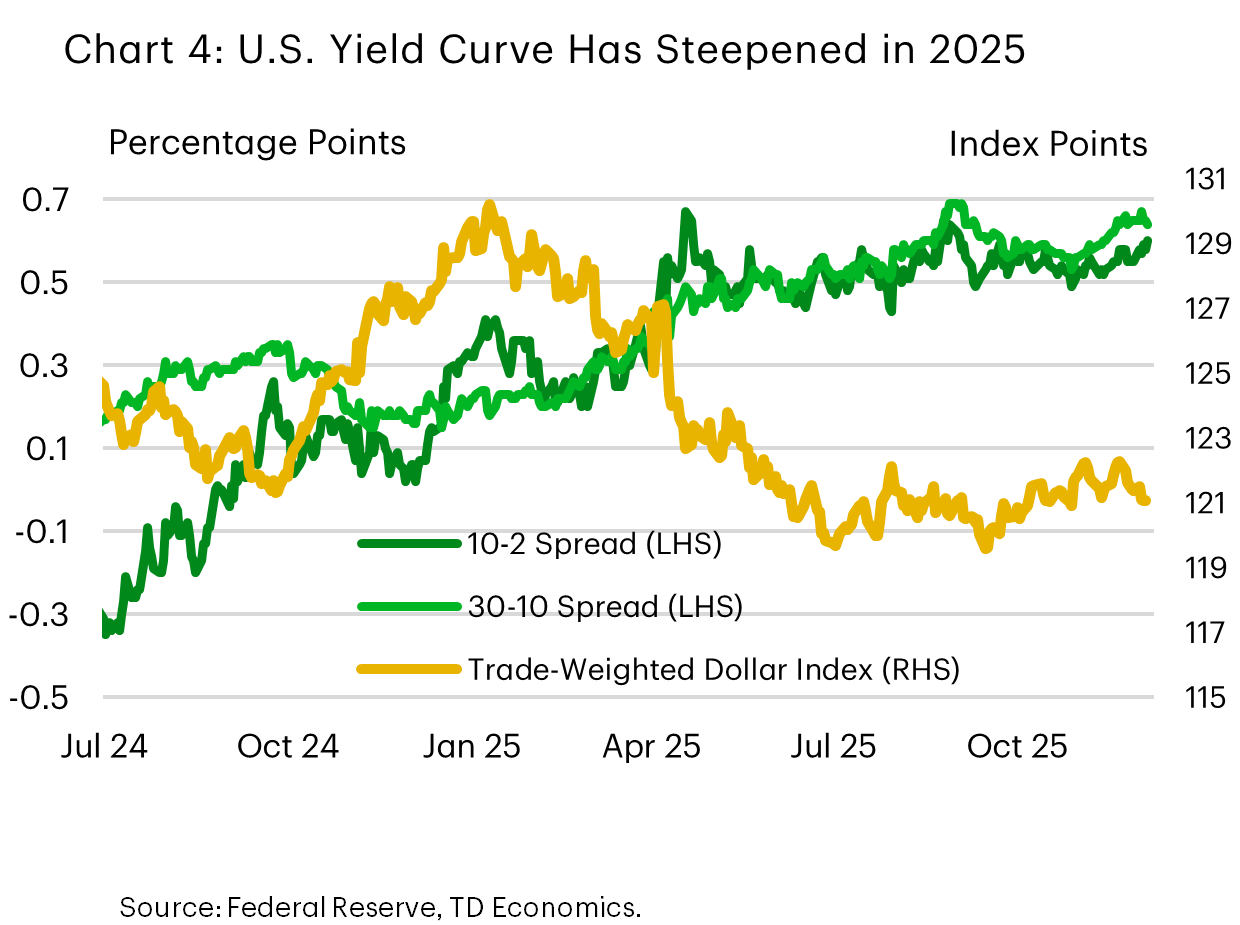
Technical factors also contributed to the bout of dollar weakness. Research from the Bank for International Settlements indicates that a decline in hedging costs between January and May spurred increased foreign currency hedging activity. This effect was particularly pronounced during Asian trading hours, placing incremental downward pressure on the dollar1. We suspect, as well, that the steepening yield curve through May 2025, as the United States Congress debated the One Big Beautiful Bill and its impact on the national debt – alongside discussion around Fed independence – contributed to a souring in sentiment towards the dollar. The depreciation coincided with the increased spreads witnessed on long-term U.S. Treasuries relative to short-term Treasuries (Chart 4).
Euro and pound record the strongest gains
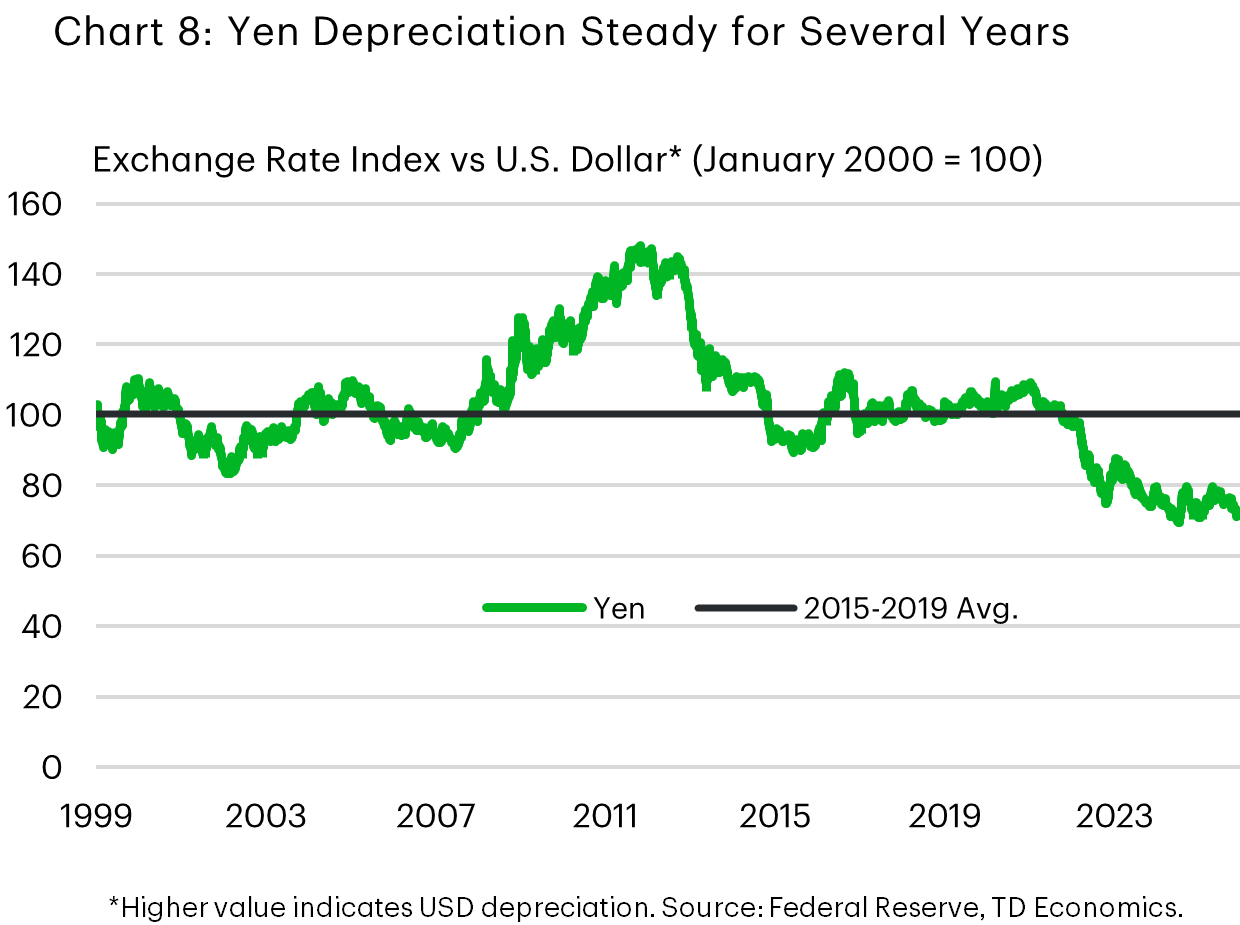
Taking a look under the hood, the U.S. dollar lost ground across board last year, led by a nearly 15% depreciation against the euro and a 9% depreciation against the pound sterling. Smaller 6-8% drops were recorded vis-à-vis the Canadian dollar and the Australian dollar, while the USD was roughly flat against the Japanese yen. The USD was not alone in depreciating against the euro, which reached an all-time high in trade-weighted terms in September, benefiting from perceptions that Europe’s fiscal and strategic shift would raise growth in the coming years.
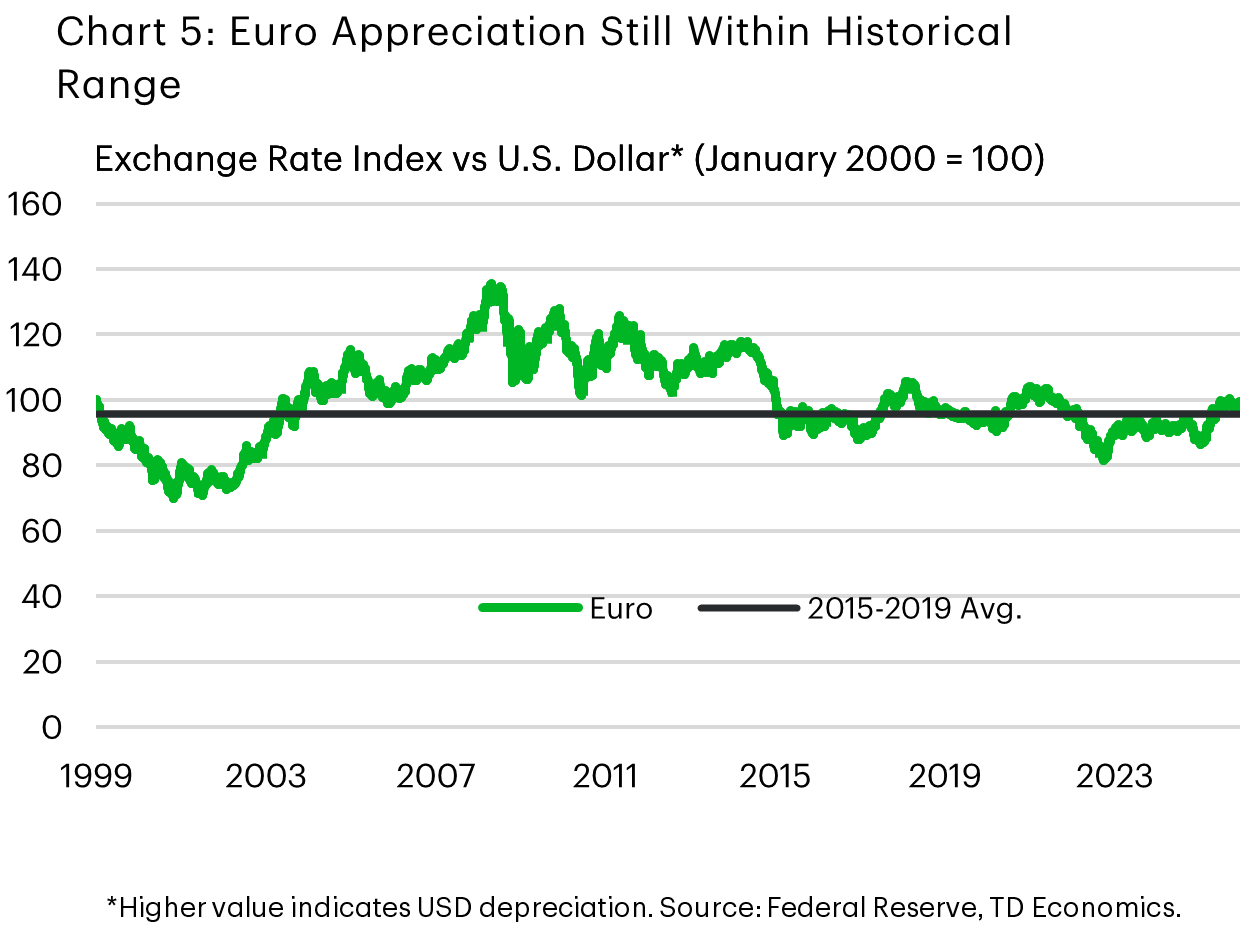
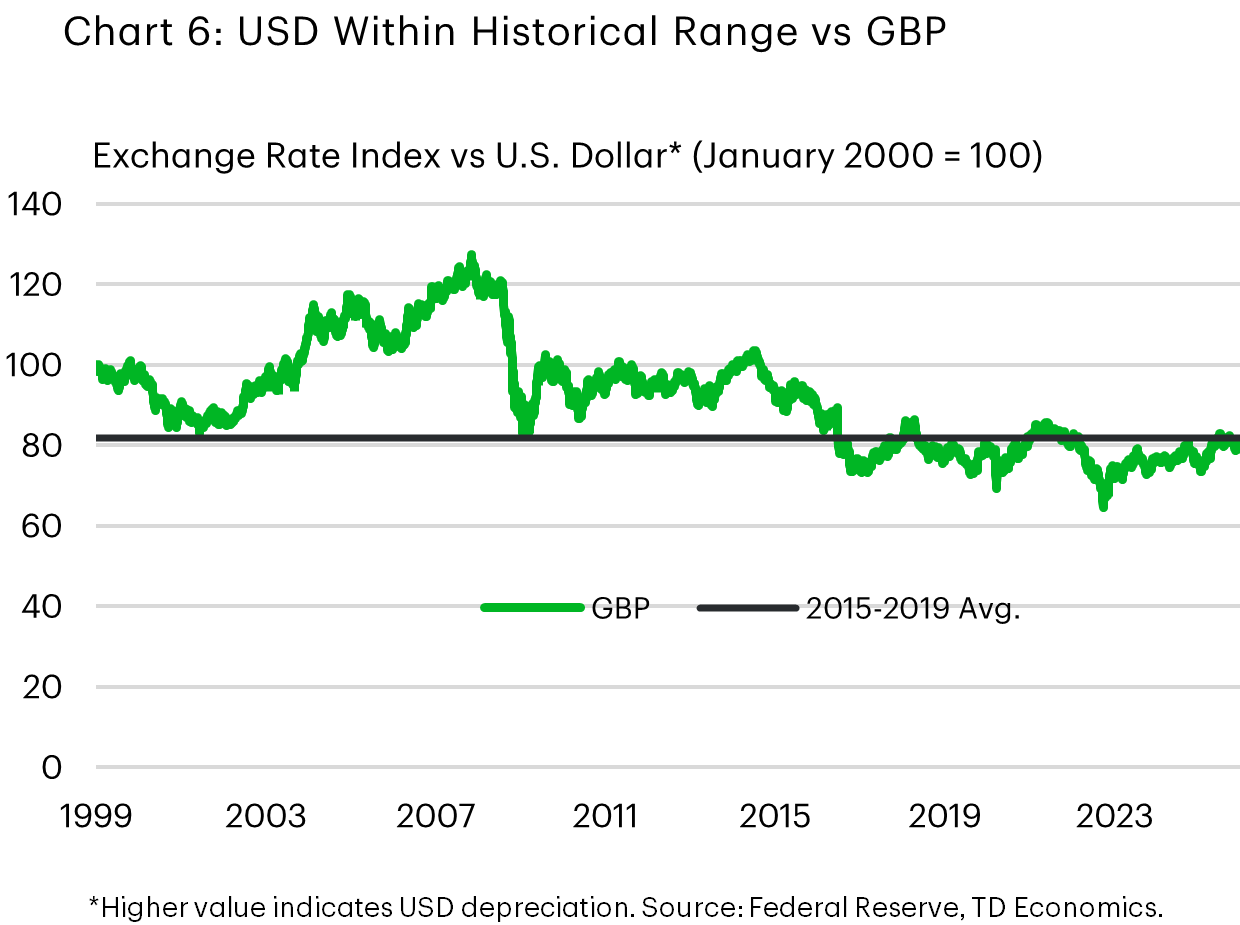
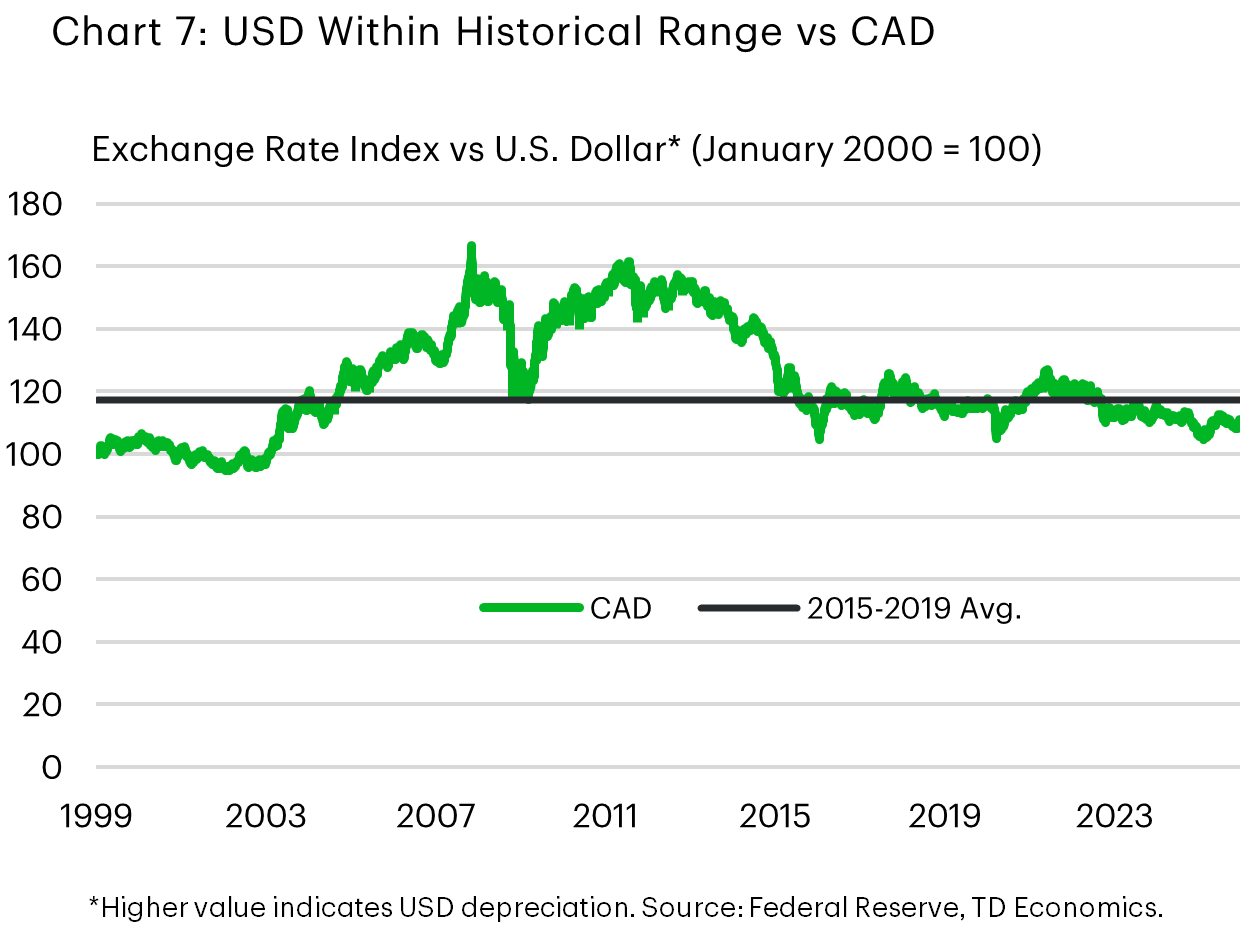
Charts 5-8 show 2025-ending levels for the dollar against their major counterparts. Against the euro, the pound, and the Canadian dollar, the dollar now trades close to its 2015–2019 averages. Bucking the trend is the yen, which sits well below its pre-pandemic levels, hit by concerns around the direction of Japanese fiscal policy, and more recently, the pro-stimulus, expansionary policy bent of the new Prime Minister.
Further downside in store for 2026
We are not expecting a repeat of 2025 but do see scope for a further USD modest depreciation on the order of 3% in the year ahead. U.S. growth is likely to be a relatively neutral factor on the dollar, as the U.S. continues to outperform most other developed market currencies. However, the rate-differential story will likely translate into some downdraft in the greenback against the euro, CAD, and GBP. The other major central banks have largely concluded their easing cycles, but we see room for the Federal Reserve to lower interest rates this summer. While additional monetary easing is already priced into the market, we still see further selling pressure as the specter of the cuts draws nearer.
We see this modest appreciation shared across most of the majors. In Canada, a continued gradual easing in trade uncertainty is likely to support a 2-3% bounce in the Loonie to around the 0.74 CAD per USD level. A similar gain is expected in the euro (to around 1.20) predicated on promised fiscal expansions and defense spending commitments materializing. On the flip side, the yen appears oversold, and should start to the turn the corner, though a snap election set in Japan in the coming weeks and a period of heightened uncertainty about the direction of policy could keep it below 150 to a dollar for longer.
Based on our estimate, the trade-weighted USD is currently at a level not far off its fundamental value and consistent with our baseline macro outlook. Thus, a large move from the prevailing level would likely take the realization of major downside or upside surprise, such as a major geopolitical event, a more durable erosion of central bank independence than we have seen to date, or a significant change to the economic growth outlook.
What about “De-dollarization”?
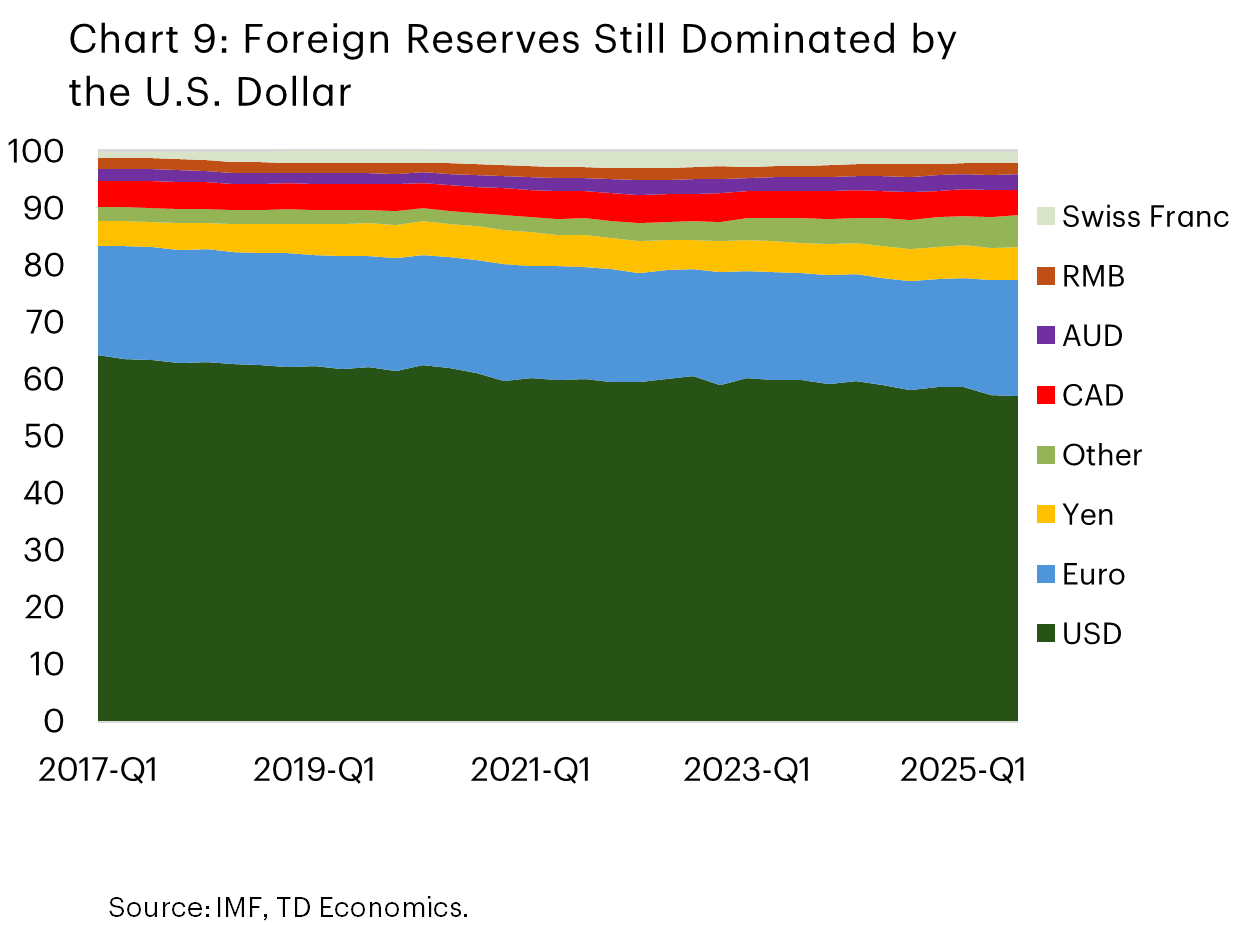
Turning back to the “de-dollarization” theme that has made lots of hay over the past year, the truth of the matter is that a gradual move away from the greenback has been ongoing for many years. For example, official foreign exchange reserves have been slowly, but steadily, trending away from the greenback (Chart 9). The small move down we see over 2025 in the USD share of official reserves is almost entirely attributable to the depreciation and not official sales of USD reserves2, which is to say that 2025 largely looks like another year on the same trend, rather than an abrupt shift in the status and perception of the dollar.
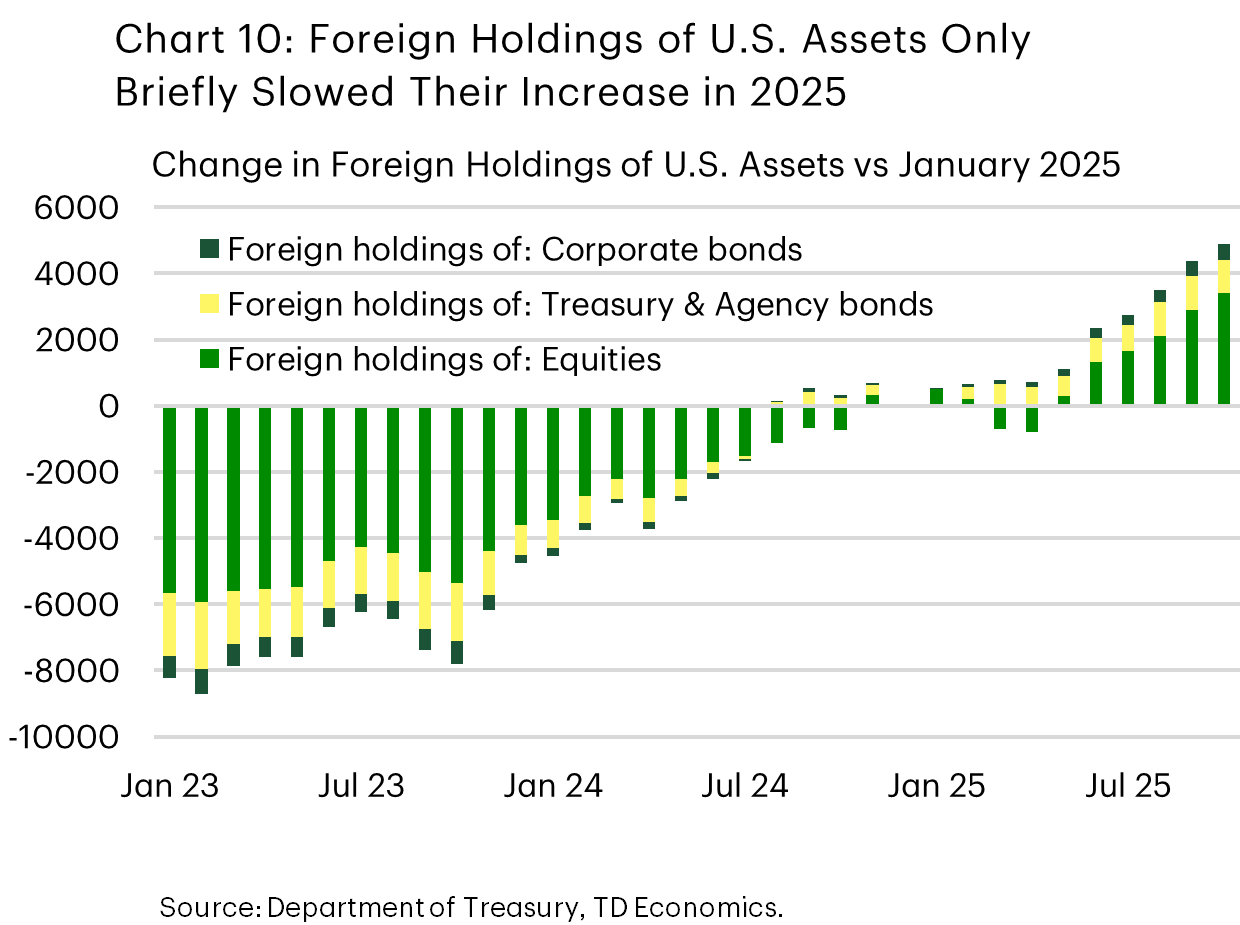
We also do not see a prolonged decrease in investor appetite for U.S.-dollar assets; in fact, foreign investors had a healthy appetite for US dollars in the second half of 2025. There was a brief pause in foreign investors’ accumulation of U.S. assets in early-2025 and outflows in April and May, and accumulation resumed thereafter (Chart 10). Undoubtedly, some of the factors we previously touched on were on the minds of investors – the expanding deficit, the uncertain impact of tariffs, and the change in the Federal Reserve’s stance all seemed to come together to briefly sour sentiment on the dollar in those months, but this was clearly temporary. The $US 4 trillion inflow into USD assets show in Chart 8 likely dwarfs the flows into alternative assets such as crypto and gold over 2025 – and stablecoin demand is actually positive for the USD in its current form, since most are backed by the USD. Gold had a banner year in 2025, but available data show that flows into gold-related funds were a small fraction of broader flows into USD assets, around $US 100 billion in 20253.
This underscores that there is no clear alternative to the U.S. dollar, even while there may be appetite for one. Competitors such as China have sought alternatives that would free it and the countries it has close economic ties with from reliance on the U.S. dollar and the associated constellation of financial architecture. It created the Cross-Border Interbank Payment System to build a cross-border payments network that settles transactions in yuan to further this end. While the growth in this system has been substantial, having seen participation by over 18 countries and exceeding US$50 billion in daily transactions, the RMB still only accounts for a low-single-digit share of global cross-border payments. Related initiatives underway elsewhere the world. The European Union, for example, is moving to adopt a digital euro, which would allow electronic retail payments to occur without the involvement of payment processors (primarily U.S. businesses), but this is not yet fully approved and remains years from being operational.
It is all but certain that many economies’ quests to reduce their reliance on the U.S. dollar will continue apace in the coming years, but completely displacing the USD as the global reserve currency and the central currency in international trade and finance is not realistically in the cards. Chart 11 shows how the closest competitors, in our view, lack the characteristics necessary to take on the role of a reserve asset. The U.S. dollar and U.S.-dollar denominated assets exist in far greater supply and have shown to provide more liquidity than the closest substitutes that exist today.

As it stands, there is little evidence that de-dollarization has accelerated. Flows into dollar-based assets have returned to trend, dollar use has been relatively stable, official reserves are mostly unchanged, and the world still lacks a convincing alternative. The U.S. dollar remains, by far, the most widely available, freely traded, and commonly accepted currency, in part because it has been issued by the world’s largest economy for nearly eighty years now. This is a privileged position that it cannot be dislodged from quickly.
Going forward, we expect that the international financial system will continue to become more multi-polar and less dominated by the dollar, as innovations in payments technologies continue, rivals further development of competing architecture to the existing dollar-based systems, and alternatives expand in size. But this gradual diversification away from the U.S. dollar globally still leaves the greenback in a leading position for some time to come.