
Sample Category Title
USD/CHF Daily Outlook
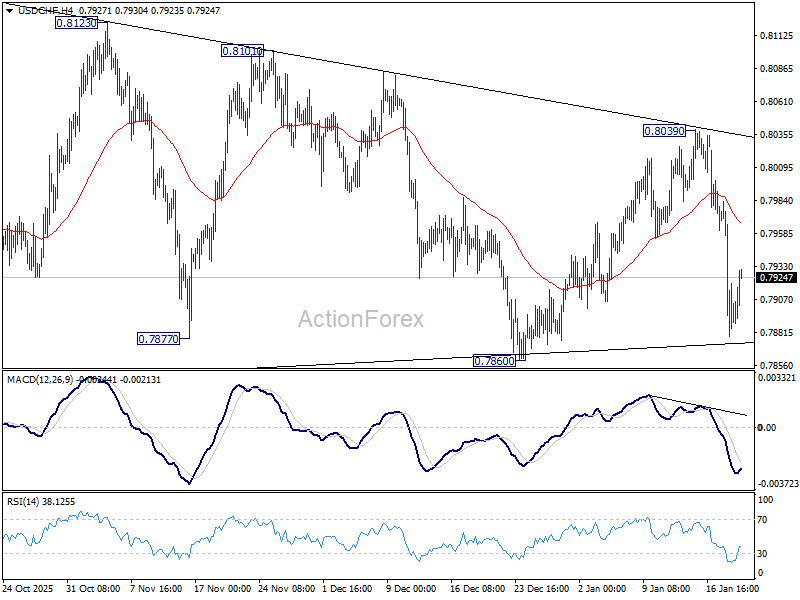
Daily Pivots: (S1) 0.7858; (P) 0.7921; (R1) 0.964; More….
No change in USD/CHF's outlook as intraday bias stays on the downside at this point. Firm break of 0.7860 support will argue that larger down trend is ready to resume through 0.7828 low. Next target will be 0.7382 projection level. For now, risk will stay on the downside as long as 55 4H EMA (now at 0.7967) holds, in case of recovery.
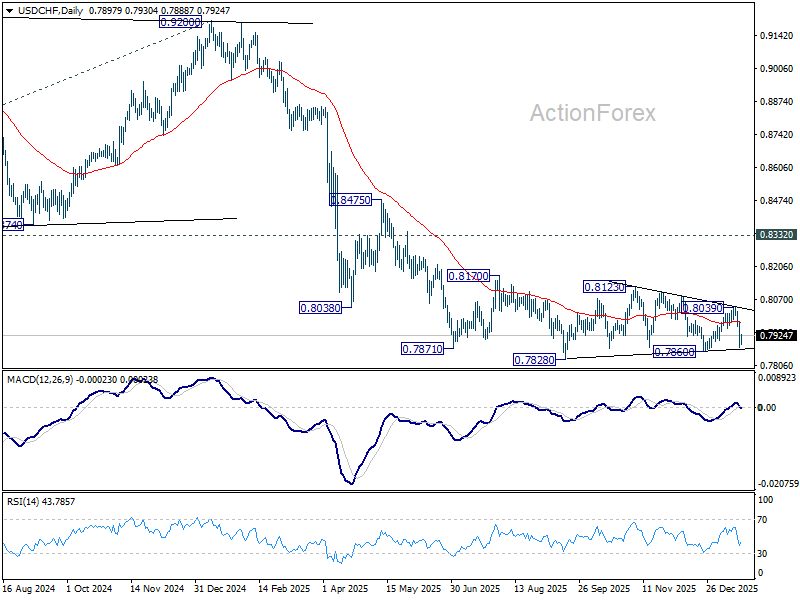
In the bigger picture, price actions from 0.7828 are seen as a correction. Larger down trend from 1.0342 (2017 high) is still in progress. Break of 0.7828 will target 100% projection of 1.0146 (2022 high) to 0.8332 from 0.9200 at 0.7382. In any case, outlook will stay bearish as long as 0.8332 support turned resistance holds (2023 low).
AUD/USD Daily Report
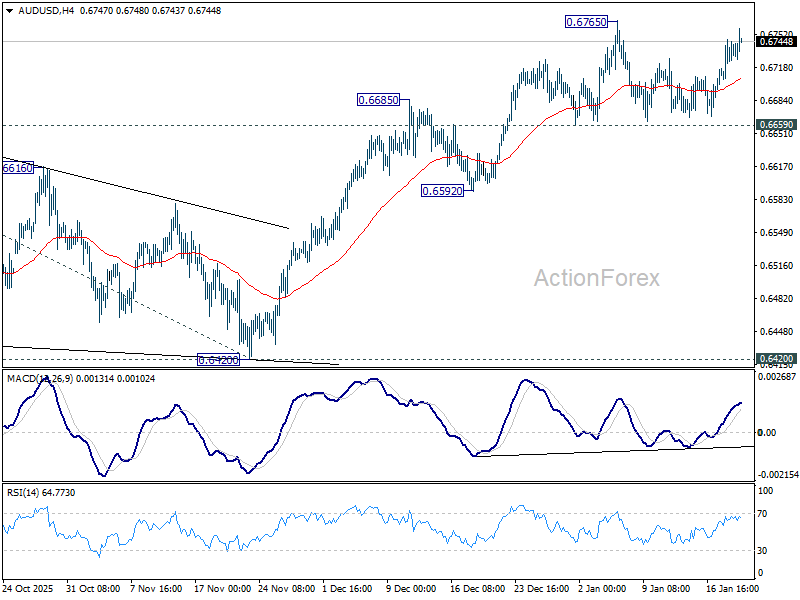
Daily Pivots: (S1) 0.6713; (P) 0.6730; (R1) 0.6753; More...
Intraday bias in AUD/USD remains neutral and range trading continues below 0.6757. Further rally is expected with 0.6659 support intact. On the upside, above 0.6765 will resume the whole rise from 0.5913 and target 61.8% projection of 0.5913 to 0.6706 from 0.6420 at 0.6910. However, considering bearish divergence condition in 4H MACD, firm break of 0.6659 will confirm short term topping, and bring deeper correction back to 55 D EMA (now at 0.6637) and below.
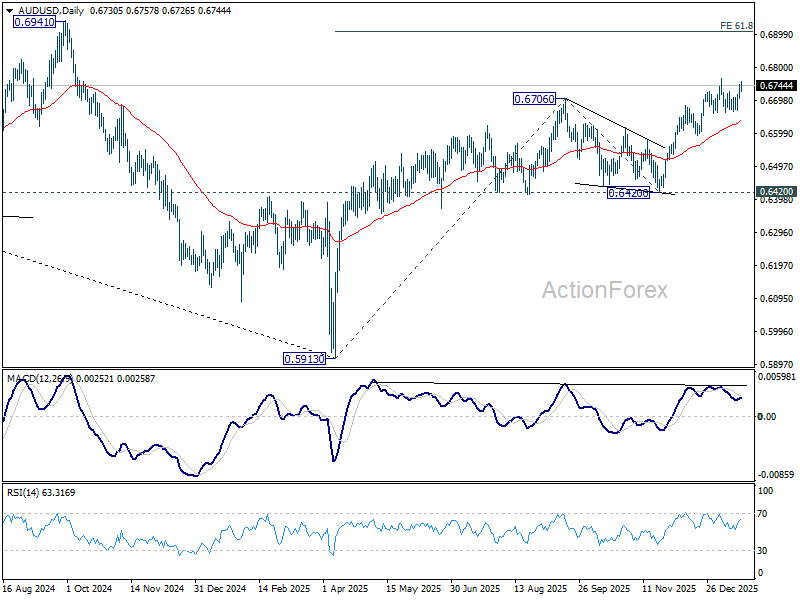
In the bigger picture, current development argues that rise from 0.5913 (2024 low) is reversing whole down trend from 0.8006 (2021 high). Further rally should be seen to 61.8% retracement of 0.8006 to 0.5913 at 0.7206. This will remain the favored case as long as 0.6420 support holds, even in case of deep pullback.
USD/CAD Daily Outlook
Daily Pivots: (S1) 1.3808; (P) 1.3844; (R1) 1.3873; More...
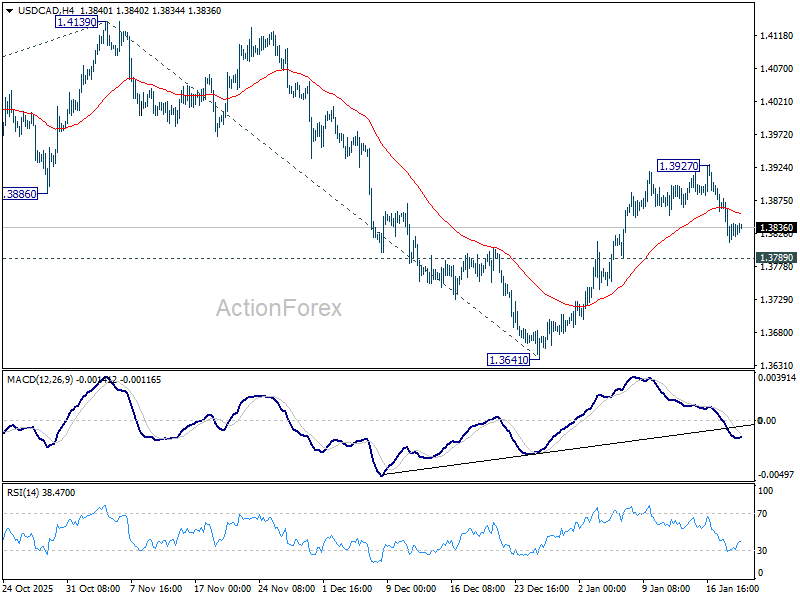
Intraday bias in USD/CAD remains neutral and more consolidations would be seen below 1.3927. Further rise is still in favor with 1.3789 minor support intact. On the upside, above 1.3927 will target 1.4139 first. Break there will target 100% projection of 1.3538 to 1.4139 from 1.3641 at 1.4242, as the third leg of the corrective pattern from 1.3538. However, firm break of 1.3789 will bring deeper fall back to 1.3641 support instead.
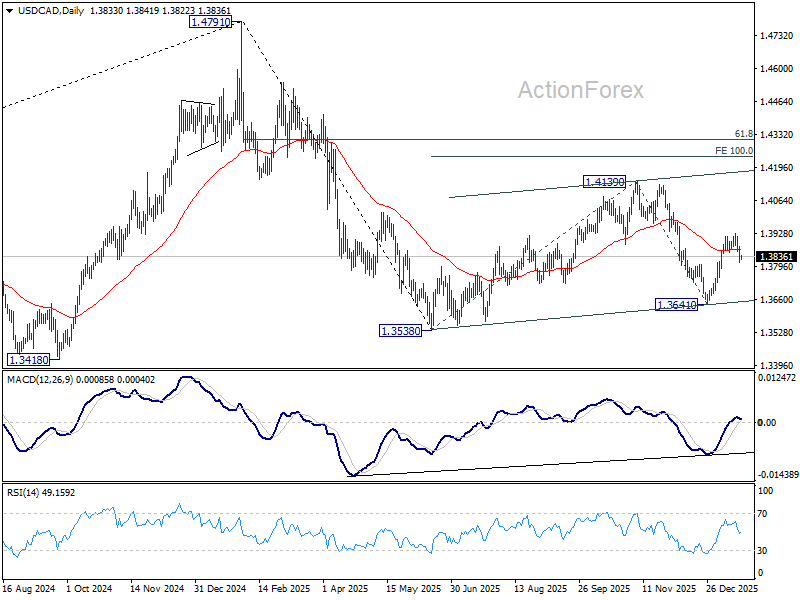
In the bigger picture, price actions from 1.4791 are seen as a corrective pattern to the whole up trend from 1.2005 (2021 low). Deeper fall could be seen as the pattern extends, and break of 1.3538 will target 61.8% retracement of 1.2005 to 1.4791 at 1.3069. For now, medium term outlook will be neutral until there are signs that the correction has completed.
EUR/CHF Daily Outlook
Daily Pivots: (S1) 0.9247; (P) 0.9270; (R1) 0.9286; More....
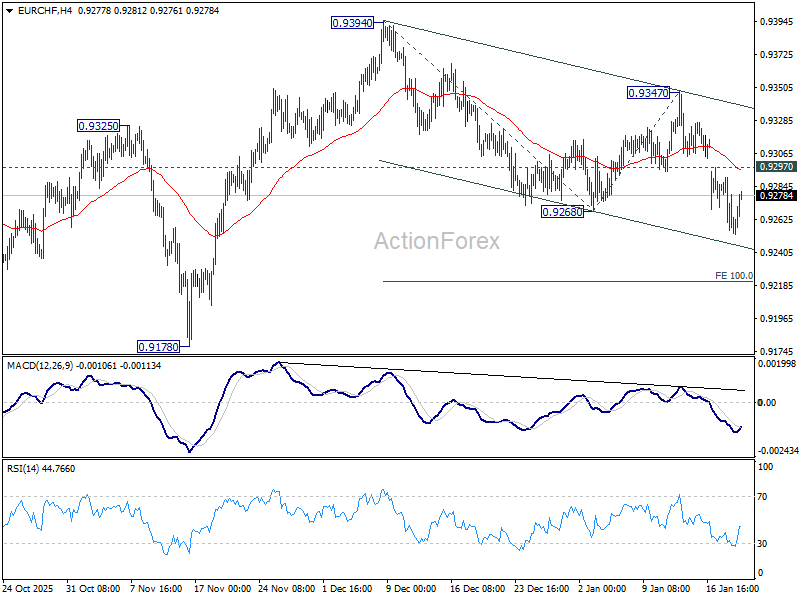
Intraday bias in EUR/CHF remains mildly on the downside for the moment. Fall from 0.9394 should target 100% projection of 0.9394 to 0.9268 from 0.9347 at 0.9221. Break will bring retest of 0.9178 low. On the upside, above 0.9297 minor resistance will turn intraday bias neutral again first.
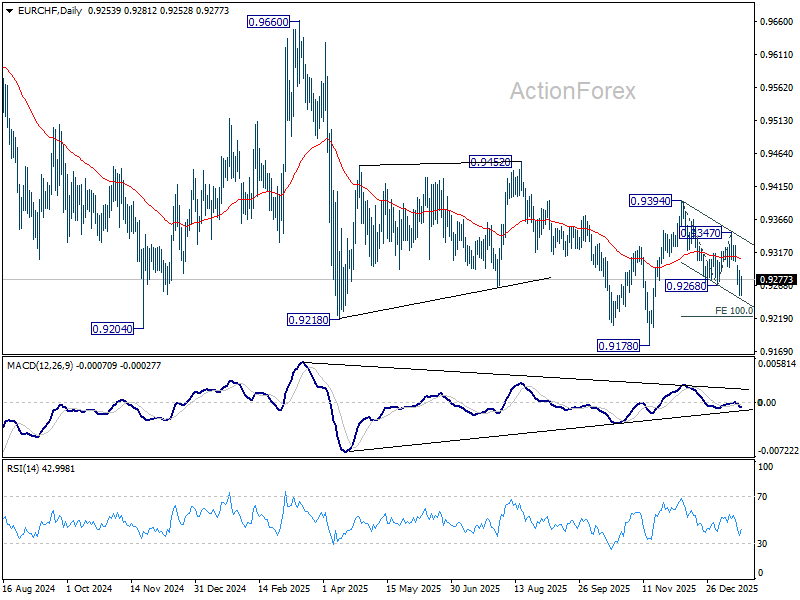
In the bigger picture, persistent bullish convergence condition in W MACD is a medium term bullish sign. Firm break of 0.9394 resistance should bring sustained trading above 55 W EMA (now at 0.9360). That should indicate medium term bottoming at 0.9178. Further break of 0.9452 resistance will bring stronger medium term rally towards 0.9928 resistance next, even still as a corrective bounce. Nevertheless, rejection by 55 W EMA will retain bearishness for another fall through 0.9178 at a later stage.
EUR/GBP Daily Outlook
Daily Pivots: (S1) 0.8684; (P) 0.8708; (R1) 0.8746; More…
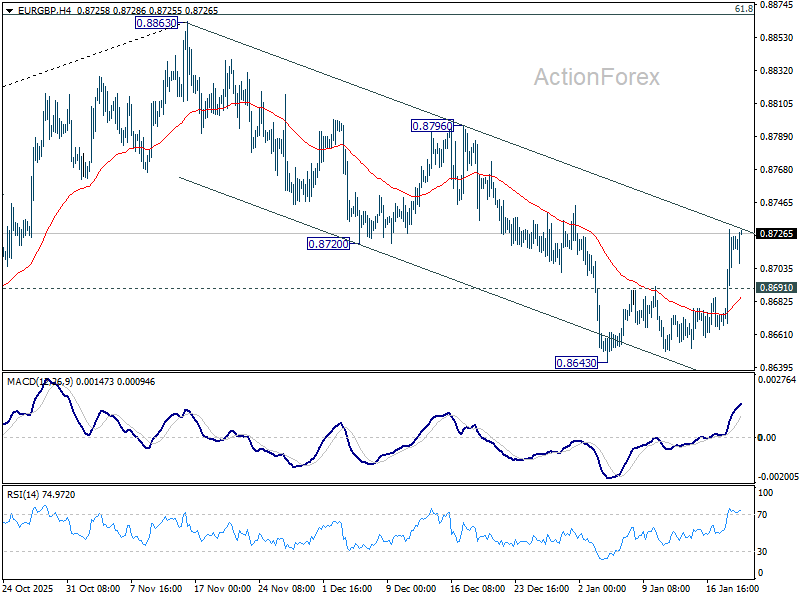
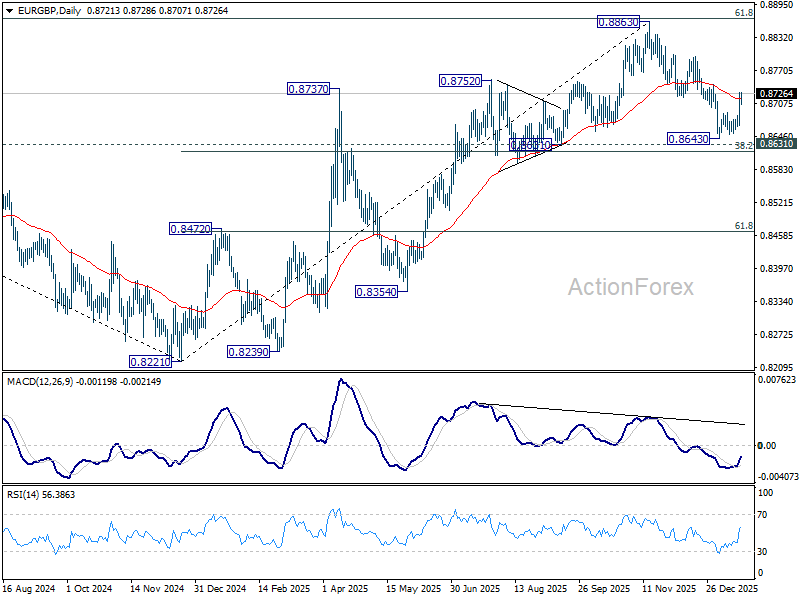
EUR/GBP's rebound from 0.8643 extended first and intraday bias stays on the upside. Sustained trading above 55 D EMA (now at 0.8717) will argue that whole fall from 0.8863 has already completed as a correction. Retest of 0.8863 should be seen next. Nevertheless, rejection by the 55 D EMA will bring another decline to 0.8631 cluster support (38.2% retracement of 0.8221 to 0.8663 at 0.8618).
In the bigger picture, rise from 0.8221 medium term bottom (2024 low) is seen as a corrective move. Upside should be limited by 61.8% retracement of 0.9267 to 0.8221 at 0.8867. Sustained trading below 55 W EMA (now at 0.8623) should confirm that this corrective bounce has completed. In this case, deeper fall would be seen back to 0.8201/21 key support zone. However, decisive break of 0.8867 will suggest that EUR/GBP is already reversing whole decline from 0.9267 (2022 high). That should pave the way back to 0.9267.
EUR/AUD Daily Outlook
Daily Pivots: (S1) 1.7319; (P) 1.7394; (R1) 1.7479; More...
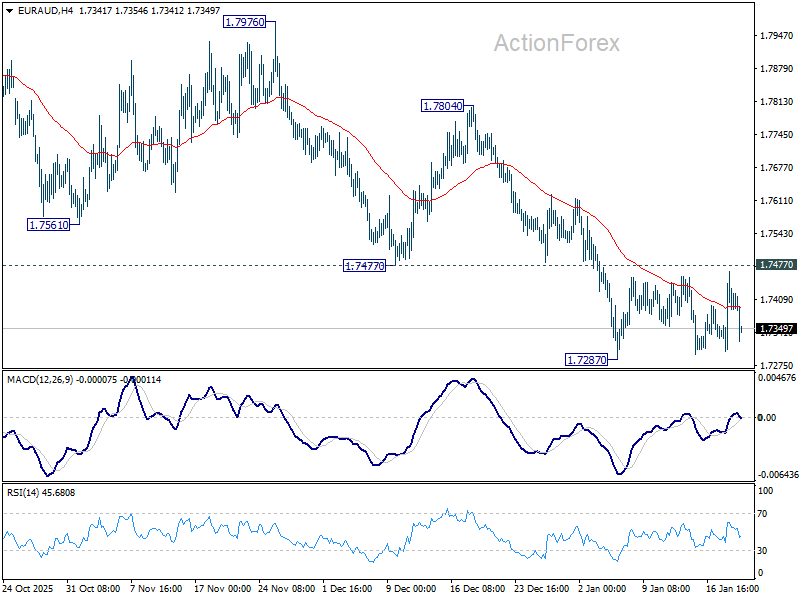
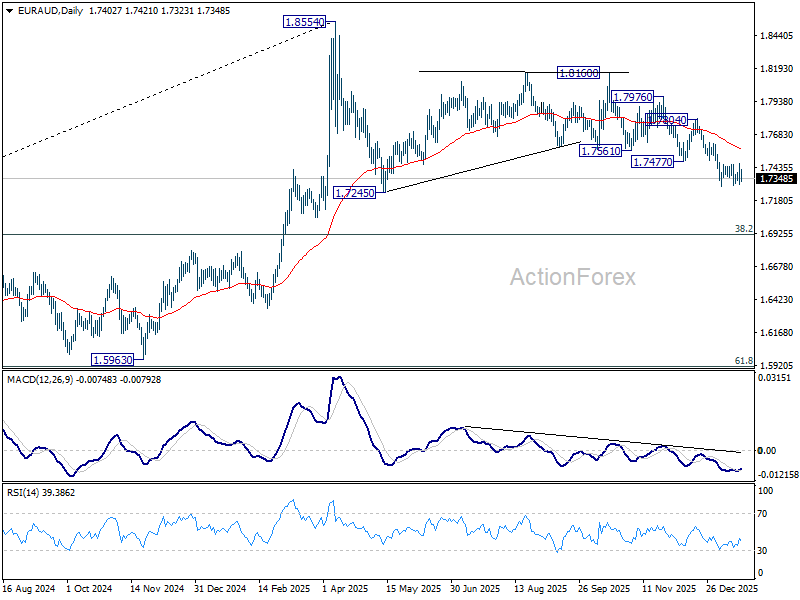
No change in EUR/AUD's outlook as range trading continues inside 1.7287/7477. Intraday bias remains neutral and further decline is expected. On the downside, break of 1.7287 will resume the fall from 1.8160. As this is seen as the third leg of the corrective pattern from 1.8554, deeper fall should be seen to 1.7245 support and below. Nevertheless, firm break of 1.7477 will indicate short term bottoming, and bring stronger rebound back to 55 D EMA (now at 1.7569).
In the bigger picture, the break of 55 W EMA (now at 1.7464) argues that fall from 1.8554 medium term top is correcting whole up trend from 1.4281 (2022 low). Deeper decline is in favor to 38.2% retracement of 1.4281 to 1.8554 at 1.6922, and possibly below. Risk will stay on the downside as long as 1.8160 resistance holds, in case of strong rebound.
GBP/JPY Daily Outlook
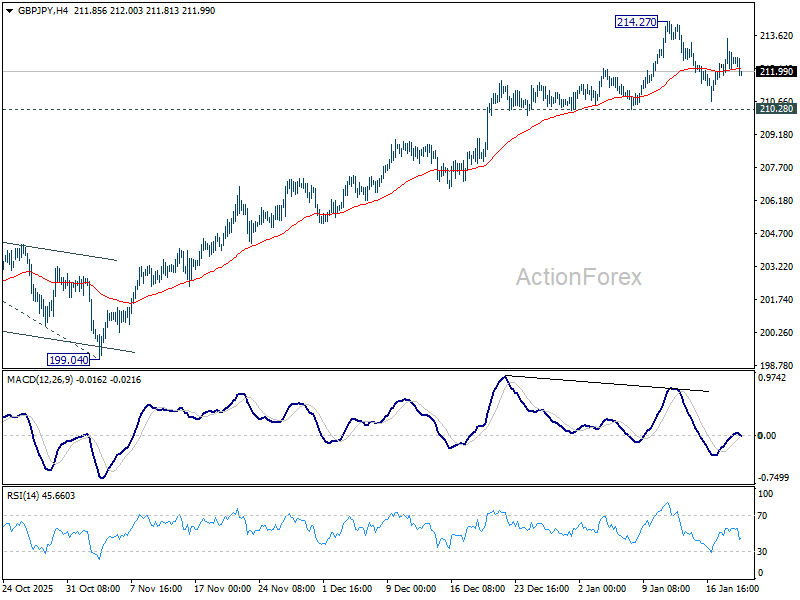
Daily Pivots: (S1) 211.79; (P) 212.64; (R1) 213.44; More...
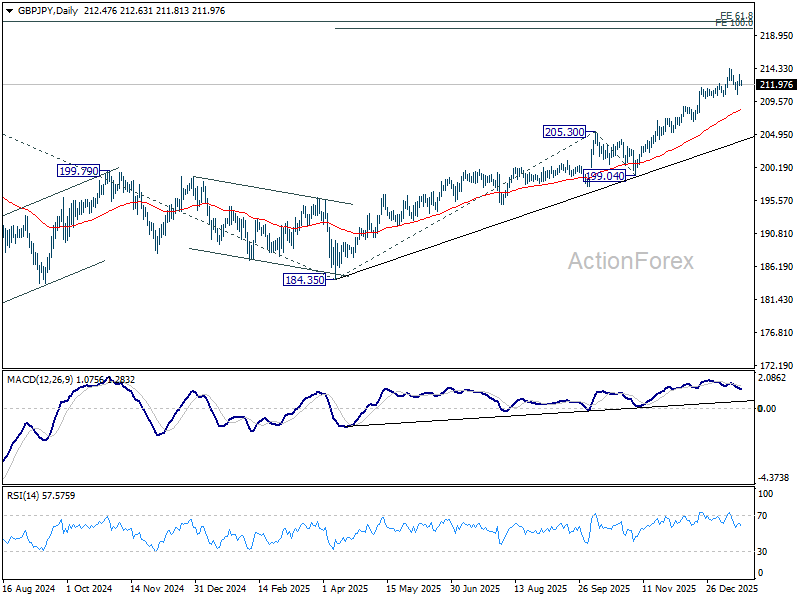
GBP/JPY is still bounded in range trading below 214.27 and intraday bias stays neutral. With 210.28 support intact, further rally is expected. On the upside, break of 214.27 will resume larger up trend to 100% projection of 184.35 to 205.30 from 199.04 at 219.99 next. Nevertheless, considering bearish divergence condition in 4H MACD, firm break of 210.28 will confirm short term topping, and turn bias to the downside for deeper pullback to 55 D EMA (now at 208.52).
In the bigger picture, up trend from 123.94 (2020 low) is in progress. Next target is 61.8% projection of 148.93 (2022 low) to 208.09 (2024 high) from 184.35 at 220.90. On the downside, break of 205.30 resistance turned support is needed to indicate medium term topping. Otherwise, outlook will stay bullish even in case of deep pullback.
Dollar Under Pressure: Tariffs and Geopolitical Risks Shift Market Sentiment
The US dollar continues to weaken after a period of short-term consolidation, amid rising tariff uncertainty and increasing geopolitical tensions. Statements by Donald Trump regarding the possible introduction of new tariffs against Europe have heightened market concerns about the consequences for global trade and economic growth, undermining support for the dollar as a defensive currency.
Additional caution is being driven by expectations of a heavy slate of US macroeconomic releases, including housing market data, inflation indicators, business activity figures, as well as speeches by Federal Reserve officials. In this environment, market participants prefer to reduce dollar exposure and act more selectively, awaiting new signals that could clarify the future path of monetary policy.
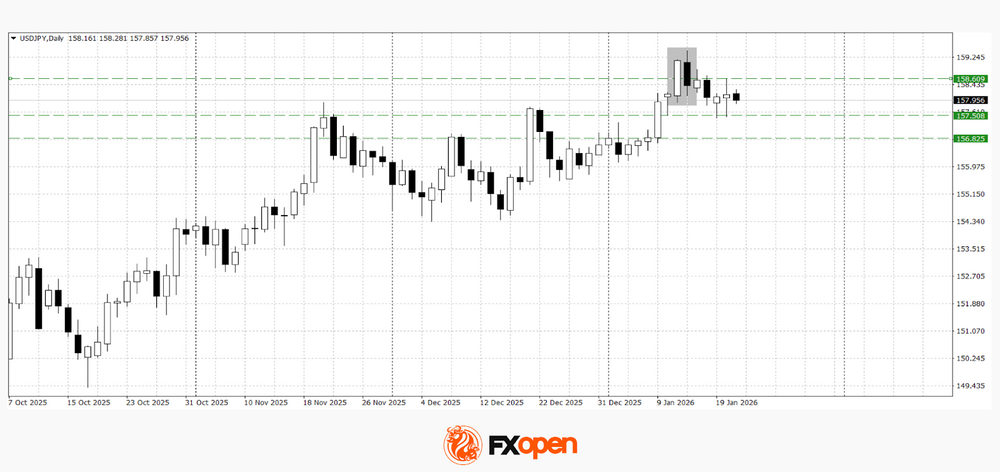
USD/JPY
At the start of the current week, the USD/JPY pair slowed its downward movement that followed the formation of a “dark cloud cover” pattern on the daily timeframe. For several sessions, price action has been consolidating within a narrow range of 157.60–158.50, although this sideways movement may soon come to an end.
A break below the 157.60 level could allow the downtrend to resume towards 156.80–157.00. Conversely, a sustained move above 158.50 may support a retest of this year’s highs.
The following events may influence USD/JPY price dynamics in the coming trading sessions:
- today at 11:00 (GMT+2): the International Energy Agency’s monthly oil market report;
- today at 15:30 (GMT+2): a speech by US President Trump;
- tomorrow at 01:50 (GMT+2): Japan’s trade balance (seasonally adjusted).
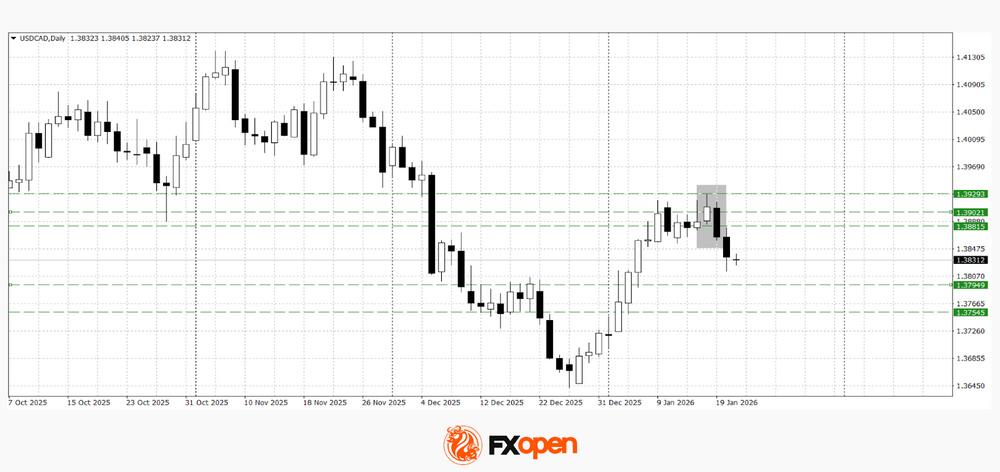
USD/CAD
Last week, USD/CAD buyers failed to overcome the key resistance zone at 1.3900–1.3930. Technical analysis points to the potential for a decline towards the 1.3750–1.3790 area, as a bearish engulfing pattern has formed on the daily chart.
Invalidation of the bearish scenario would require a firm break and sustained consolidation above 1.3900.
The following events may affect USD/CAD price action in the upcoming sessions:
- today at 15:30 (GMT+2): Canada’s Raw Materials Price Index (RMPI);
- today at 19:00 (GMT+2): the Atlanta Fed’s GDPNow indicator;
- today at 20:00 (GMT+2): the US Treasury auction of 20-year bonds.
Trade over 50 forex markets 24 hours a day with FXOpen. Take advantage of low commissions, deep liquidity, and spreads from 0.0 pips (additional fees may apply). Open your FXOpen account now or learn more about trading forex with FXOpen.
This article represents the opinion of the Companies operating under the FXOpen brand only. It is not to be construed as an offer, solicitation, or recommendation with respect to products and services provided by the Companies operating under the FXOpen brand, nor is it to be considered financial advice.
EUR/JPY Daily Outlook
Daily Pivots: (S1) 184.33; (P) 184.90; (R1) 186.02; More...
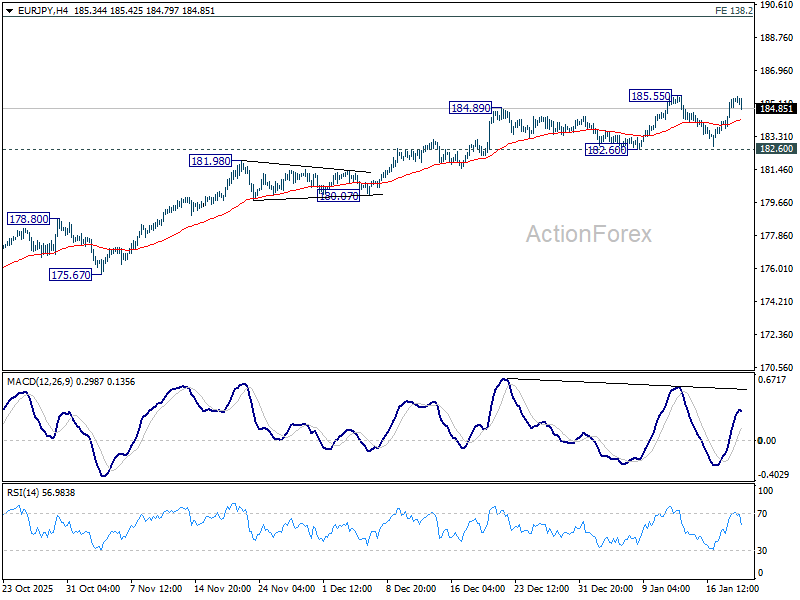
EUR/JPY retreated ahead of 185.55 resistance as range trading continues. Intraday bias remains neutral for the moment. With 182.60 support intact, further rally is expected. On the upside, break of 185.55 will resume larger up trend to 186.31 projection level. Firm break there will target 138.2% projection of 151.06 to 173.87 from 172.24 at 189.94. However, sustained break of 182.60 will confirm short term topping, and turn bias back to the downside for 55 D EMA (now at 181.83) and below.
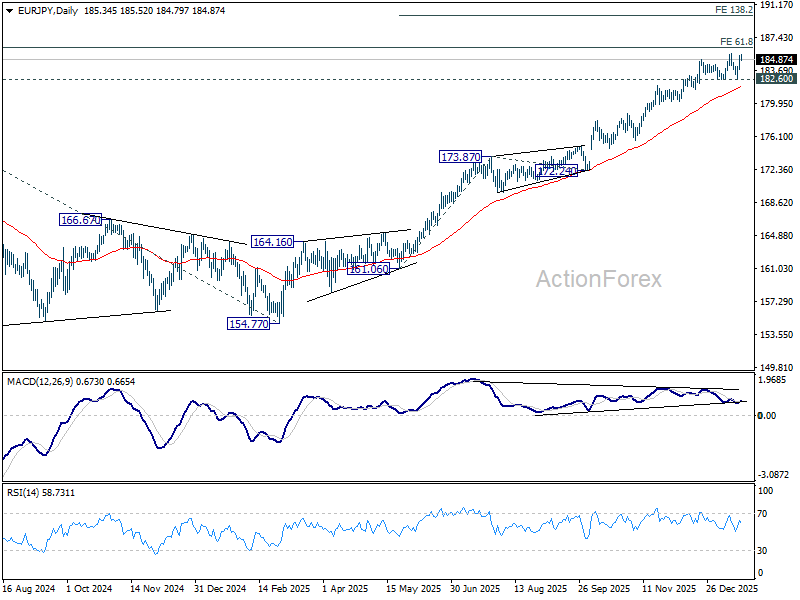
In the bigger picture, up trend from 114.42 (2020 low) is in progress and should target 61.8% projection of 124.37 to 175.41 from 154.77 at 186.31. Considering bearish divergence condition in D MACD, upside could be capped by 186.31 on first attempt. Still, outlook will stay bullish as long as 55 W EMA (now at 172.58) holds, even in case of deep pullback. Sustained break of 186.31 will pave the way to 78.6% projection at 194.88 next.
Markets Catch Their Breath, Trumps Speech in Davos Now Key
Global markets appeared to stabilize somewhat today after the sharp U.S. selloff overnight, which saw the DOW suffer its worst one-day loss since October. That said, the underlying source of stress has not faded. Greenland-related tensions remain unresolved, with no visible path toward de-escalation. The current stabilization looks more like position-squaring, rather than renewed confidence.
For now, markets are simply catching their breath, awaiting the next catalyst. Attention has shifted to World Economic Forum, where US President Donald Trump is due to deliver a closely watched address later today. Trump’s speech comes amid soaring tensions between the U.S. and Europe over Danish territory Greenland, which Trump wants the U.S. to acquire. Markets are watching closely for any signal of escalation, moderation, or strategic ambiguity.
On Tuesday, Trump declined to specify how far he is prepared to go to achieve that objective, telling reporters bluntly, “You’ll find out.” He has previously refused to rule out military action and has threatened new tariffs on multiple European countries if they block the takeover bid.
Those threats have already left their mark on markets this week. The renewed risk of a transatlantic trade war pushed U.S. Treasuries sharply lower, while Gold surged to new record highs.
U.S. 10-year yield briefly breached 4.3% overnight, before settling around 4.295%. Speaking in Davos, Scott Bessent sought to play down concerns about the bond selloff. He said he was not worried about Treasuries, dismissing speculation that European investors were pulling back.
Asked specifically about Denmark, Bessent said its holdings were “irrelevant,” noting they amounted to less than USD 100 million, and added that Denmark has been selling Treasuries for years. He emphasized that the U.S. has seen record foreign investment in Treasuries overall.
Instead, Bessent pointed to Japan, arguing that the recent Japanese bond selloff following a snap election announcement had spilled over into global markets. He dismissed talk of European liquidation as originating from a single analyst at Deutsche Bank. Bessent added that Deutsche Bank’s CEO had personally contacted him to say the bank did not stand by the analyst report, accusing “fake news media” of amplifying unfounded fears.
Meanwhile, Gold climbed above 4,800, extending a powerful rally driven by tariff threats, geopolitical instability, falling real rates, and ongoing diversification away from the dollar. After a record 2025, Gold has entered 2026 with momentum firmly intact. According to analysts surveyed by the London Bullion Market Association, prices are increasingly expected to rise above 5,000 this year, citing lower U.S. real yields, continued Fed easing, and sustained central-bank diversification.
In FX performance terms this week so far, Dollar sits at the bottom, followed by Yen and Sterling, while Kiwi leads, followed by Swiss Franc and Aussie, with Euro and Loonie in the middle.
In Asia, Nikkei fell -0.41%. Hong Kong HSI rose 0.37%. China Shanghai SSE rose 0.08%. Singapore Strait Times is down -0.46%. Japan 10-year JGB yield stabilized and fell -0.056 to 2.288. Overnight, DOW fell -1.76%. S&P 500 fell -2.06%. NADSAQ fell -2.39%. 10-year yield rose 0.064 to 4.295.
ECB's Lagarde: Tariffs manageable, Trump's constant reversals more damaging
ECB President Christine Lagarde said she expects only a "minimal" inflationary impact from additional U.S. tariffs, arguing that Eurozone price pressures remain firmly under control. Speaking to RTL, Lagarde noted that inflation is currently around 1.9%, leaving little scope for tariffs to materially disrupt the ECB’s inflation outlook.
Though, she acknowledged that the impact would not be evenly distributed, with Germany likely more exposed than France given its export-heavy manufacturing base. However, Lagarde argued that Europe would be far more resilient if it focused on removing non-tariff trade barriers within the EU, strengthening internal trade and competitiveness rather than reacting defensively to external shocks.
Lagarde’s sharper warning was reserved for uncertainty, not tariffs themselves. Referring to renewed threats from US President Donald Trump, who has vowed to impose escalating tariffs on several European countries over Greenland, she said the "constant reversals" and unpredictability pose a more serious risk. Trump, she added, often takes a transactional approach, setting demands at “sometimes completely unrealistic” levels.
UK CPI rises to 3.4%, core holds at cycle low of 3.2%
UK inflation firmed at the end of 2025, with headline pressure coming in slightly hotter than expected. CPI rose to 3.4% yoy in December, up from 3.2% and above expectations of 3.3%, while prices increased 0.4% mom, pointing to ongoing near-term inflation momentum.
The upside in headline inflation, however, masked relative stability in underlying pressures. Core CPI—excluding energy, food, alcohol and tobacco—was unchanged at 3.2% yoy, undershooting expectations of 3.3%, and marking the joint-lowest reading since December 2024. Core inflation was last lower in September 2021, reinforcing the view that underlying disinflation progress, while slow, remains intact.
By component, services inflation edged up to 4.5% yoy from 4.4%, keeping the sector firmly in focus for the BoE, while goods inflation rose to 2.2% from 2.1%.
NZD/USD presses resistance Q4 CPI awaited on RBNZ hike guidance
NZD/USD has surged sharply this week and is now pressing key near-term resistance at 0.5852, as shifting global risk dynamics unexpectedly favor the Kiwi. With Dollar and Euro under pressure from Greenland-related geopolitical tensions, both New Zealand dollar and Australian Dollar have surprisingly emerged as relative safe havens, benefiting from stable domestic backdrops and distance from the dispute.
At the same, Yen remains under pressure, weighed down by an aggressive selloff in Japanese government bonds as markets price in post-election fiscal expansion. That divergence has left antipodean currencies unusually well-bid, along with Swiss Franc.
For Kiwi, attention now turns to New Zealand Q4 CPI, due Friday in Asia. The annual rate is expected to hold at 3.0%, right at the top of the RBNZ’s 2–3% target band. With the Official Cash Rate at 2.25%, markets broadly agree the RBNZ has completed its easing cycle. The open question is timing of the next hike, not whether one eventually comes. CPI overshoot would sharply pull forward expectations and offer fresh support to NZD.
That focus will intensify at the February 18 OCR review, the first major policy decision under new Governor Anna Breman. Markets will be listening closely to the tone of the post-meeting press conference for clues on whether Breman leans hawkish, dovish, or neither.
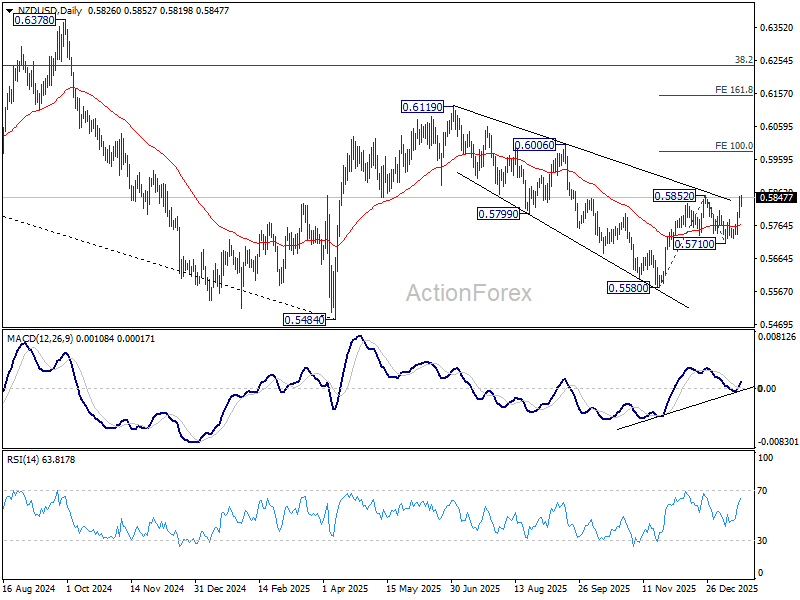
Technically, NZD/USD's dip to 0.5710 earlier this month was a little deeper than expected. But that didn't alter the overall structure. The corrective down trend from 0.6119 (2025 high) should have completed with three waves down to 0.5580.
Firm break of 0.5852 will resume the whole rally from 0.5580 and target 100% projection of 0.5580 to 0.5852 from 0.5710 at 0.6015. Decisive break of 0.6015 will solidify that NZD/USD is in an impulsive move that should be resuming whole rise from 0.5484 (2025 low) through 0.6119. In any case, outlook will now stay bullish as long as 0.5710 support holds.
EUR/JPY Daily Outlook
Daily Pivots: (S1) 184.33; (P) 184.90; (R1) 186.02; More...
EUR/JPY retreated ahead of 185.55 resistance as range trading continues. Intraday bias remains neutral for the moment. With 182.60 support intact, further rally is expected. On the upside, break of 185.55 will resume larger up trend to 186.31 projection level. Firm break there will target 138.2% projection of 151.06 to 173.87 from 172.24 at 189.94. However, sustained break of 182.60 will confirm short term topping, and turn bias back to the downside for 55 D EMA (now at 181.83) and below.
In the bigger picture, up trend from 114.42 (2020 low) is in progress and should target 61.8% projection of 124.37 to 175.41 from 154.77 at 186.31. Considering bearish divergence condition in D MACD, upside could be capped by 186.31 on first attempt. Still, outlook will stay bullish as long as 55 W EMA (now at 172.58) holds, even in case of deep pullback. Sustained break of 186.31 will pave the way to 78.6% projection at 194.88 next.