
Sample Category Title
USD/CHF Mid-Day Outlook
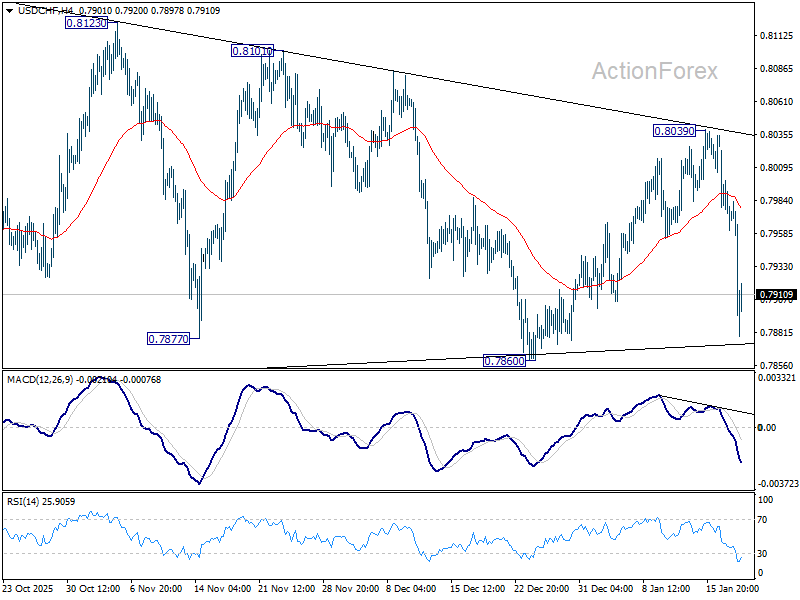
Daily Pivots: (S1) 0.7951; (P) 0.7987; (R1) 0.8012; More….
Intraday bias in USD/CHF remains on the downside for the moment. Firm break of 0.7860 support will argue that larger down trend is ready to resume through 0.7828 low. Next target will be 0.7382 projection level. For now, risk will stay on the downside as long as 55 4H EMA (now at 0.7978) holds, in case of recovery.
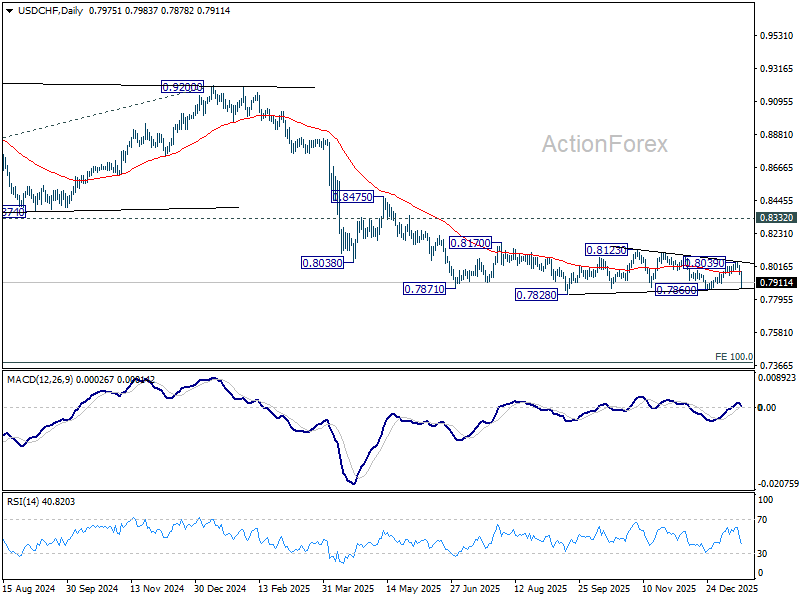
In the bigger picture, price actions from 0.7828 are seen as a correction. Larger down trend from 1.0342 (2017 high) is still in progress. Break of 0.7828 will target 100% projection of 1.0146 (2022 high) to 0.8332 from 0.9200 at 0.7382. In any case, outlook will stay bearish as long as 0.8332 support turned resistance holds (2023 low).
USD/JPY Mid-Day Outlook
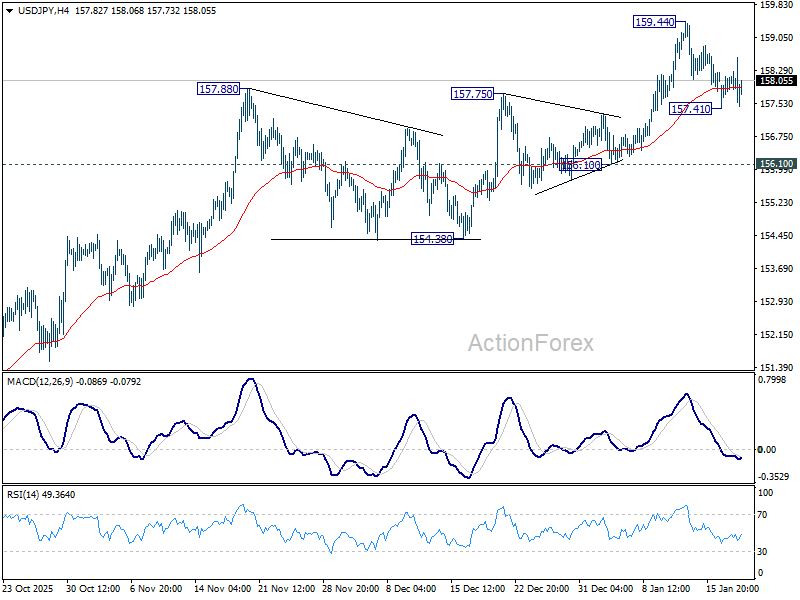
Daily Pivots: (S1) 157.64; (P) 157.91; (R1) 158.38; More...
USD/JPY is still bounded in consolidations below 159.44 and intraday bias stays neutral. With 156.10 support intact, outlook remains bullish. On the upside, break of 159.44 will resume the rise from 139.87 towards 161.94 high. However, firm break of 156.10 will confirm short term topping, and turn bias back to the downside for deeper pullback.
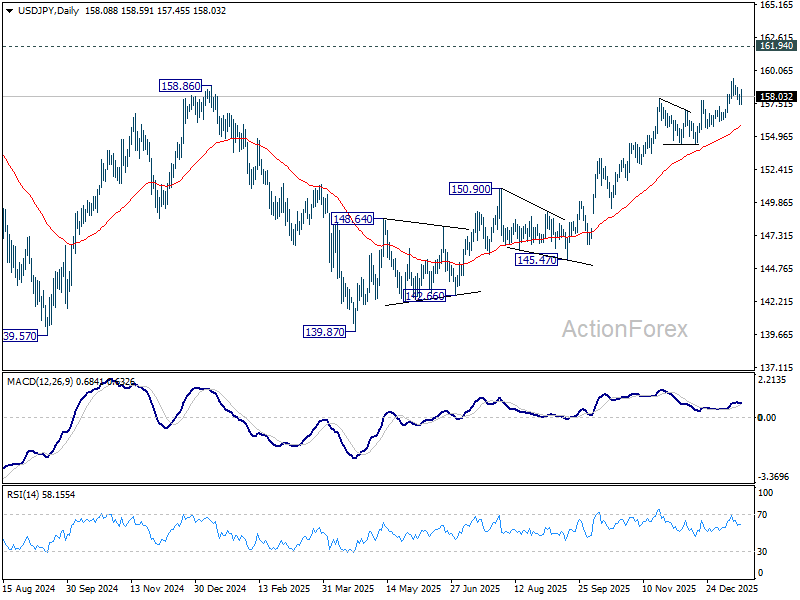
In the bigger picture, corrective pattern from 161.94 (2024 high) should have completed with three waves at 139.87. Larger up trend from 102.58 (2021 low) could be ready to resume through 161.94. Decisive break of 158.86 structural resistance will solidify this bullish case and target 161.94 for confirmation. On the downside, break of 154.38 support will dampen this bullish view and extend the corrective range pattern with another falling leg.
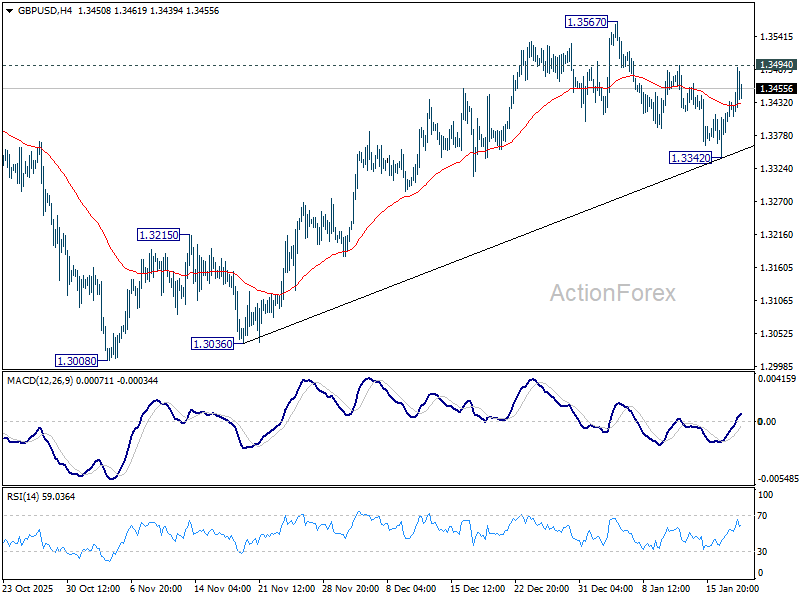
GBP/USD Mid-Day Outlook
Daily Pivots: (S1) 1.3368; (P) 1.3402; (R1) 1.3460; More...
Intraday bias in GBP/USD remains neutral with focus on 1.3494 resistance. Firm break there will suggest that pullback from 1.3567 has completed at 1.3342, after drawing support from 55 D EMA (now at 1.3375). Intraday bias will be back on the upside for 1.3567 first. Break there will resume the rally from 1.3008 to retest 1.3787 high. On the downside, sustained trading below 55 D EMA will argue that the decline is another falling leg in the corrective pattern from 1.3787.
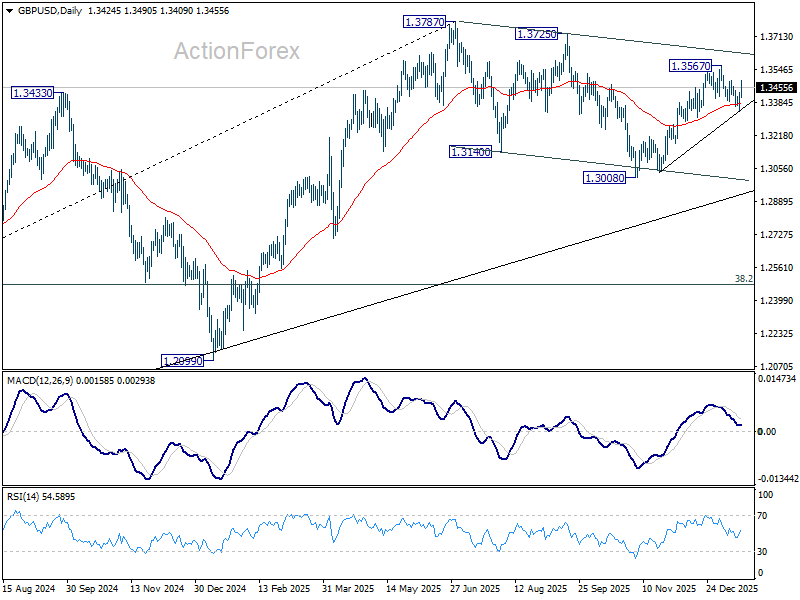
In the bigger picture, price actions from 1.3787 (2025 high) are seen as a correction to the larger up trend from 1.3051 (2022 low). Deeper decline could be seen as the pattern extends, but downside should be contained by 38.2% retracement of 1.0351 to 1.3787 at 1.2474 to bring rebound. Break of 1.3787 for up trend resumption is expected at a later stage.
Bitcoin Took a Double Hit from Tariffs
The White House’s threat to impose 10% tariffs on eight European countries from February 1st, with a potential increase to 25% by the summer. It has become a nightmare for Bitcoin. Investors already saw this horror movie in April last year, when BTC lost about a third of its value reacting to the threat of the highest import levies since the 1930s.
Bitcoin is taking a double hit from tariffs. Donald Trump’s intention to turn the United States into the world’s crypto capital has made crypto a kind of American asset. Therefore, the return of the ‘sell America’ trade quickly pulled the rug out from under the BTC bulls.
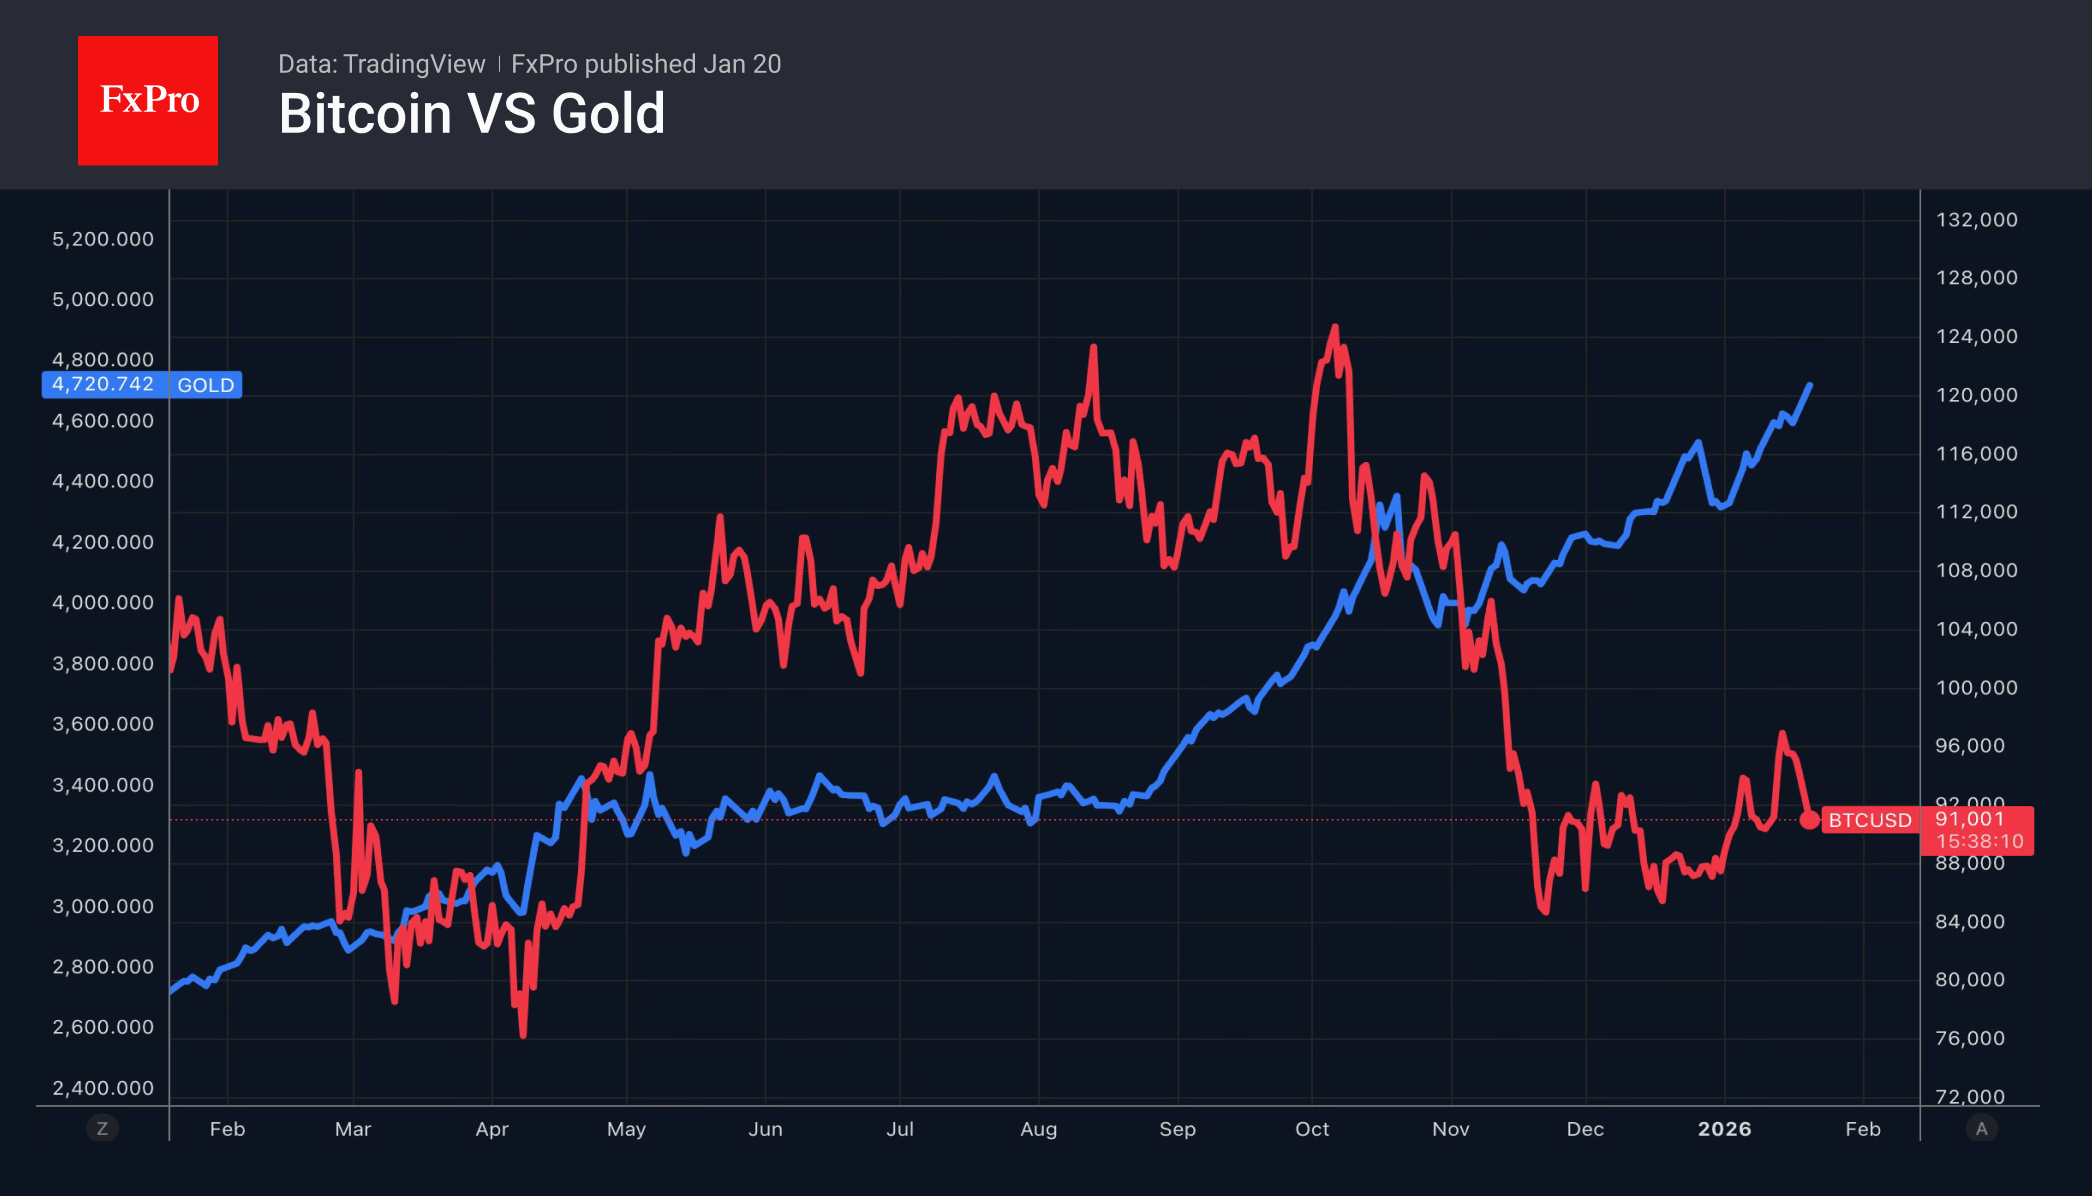
At the same time, digital assets faced an outflow of capital to the gold market. Its record highs on America’s Liberation Day and its first rise above $4,700 per ounce in history in January were the result, in part, of money flowing in. Previously, investors bought Bitcoin simply because it was rising. Now the same thing is happening with gold. A significant part of its rally is speculative in nature.
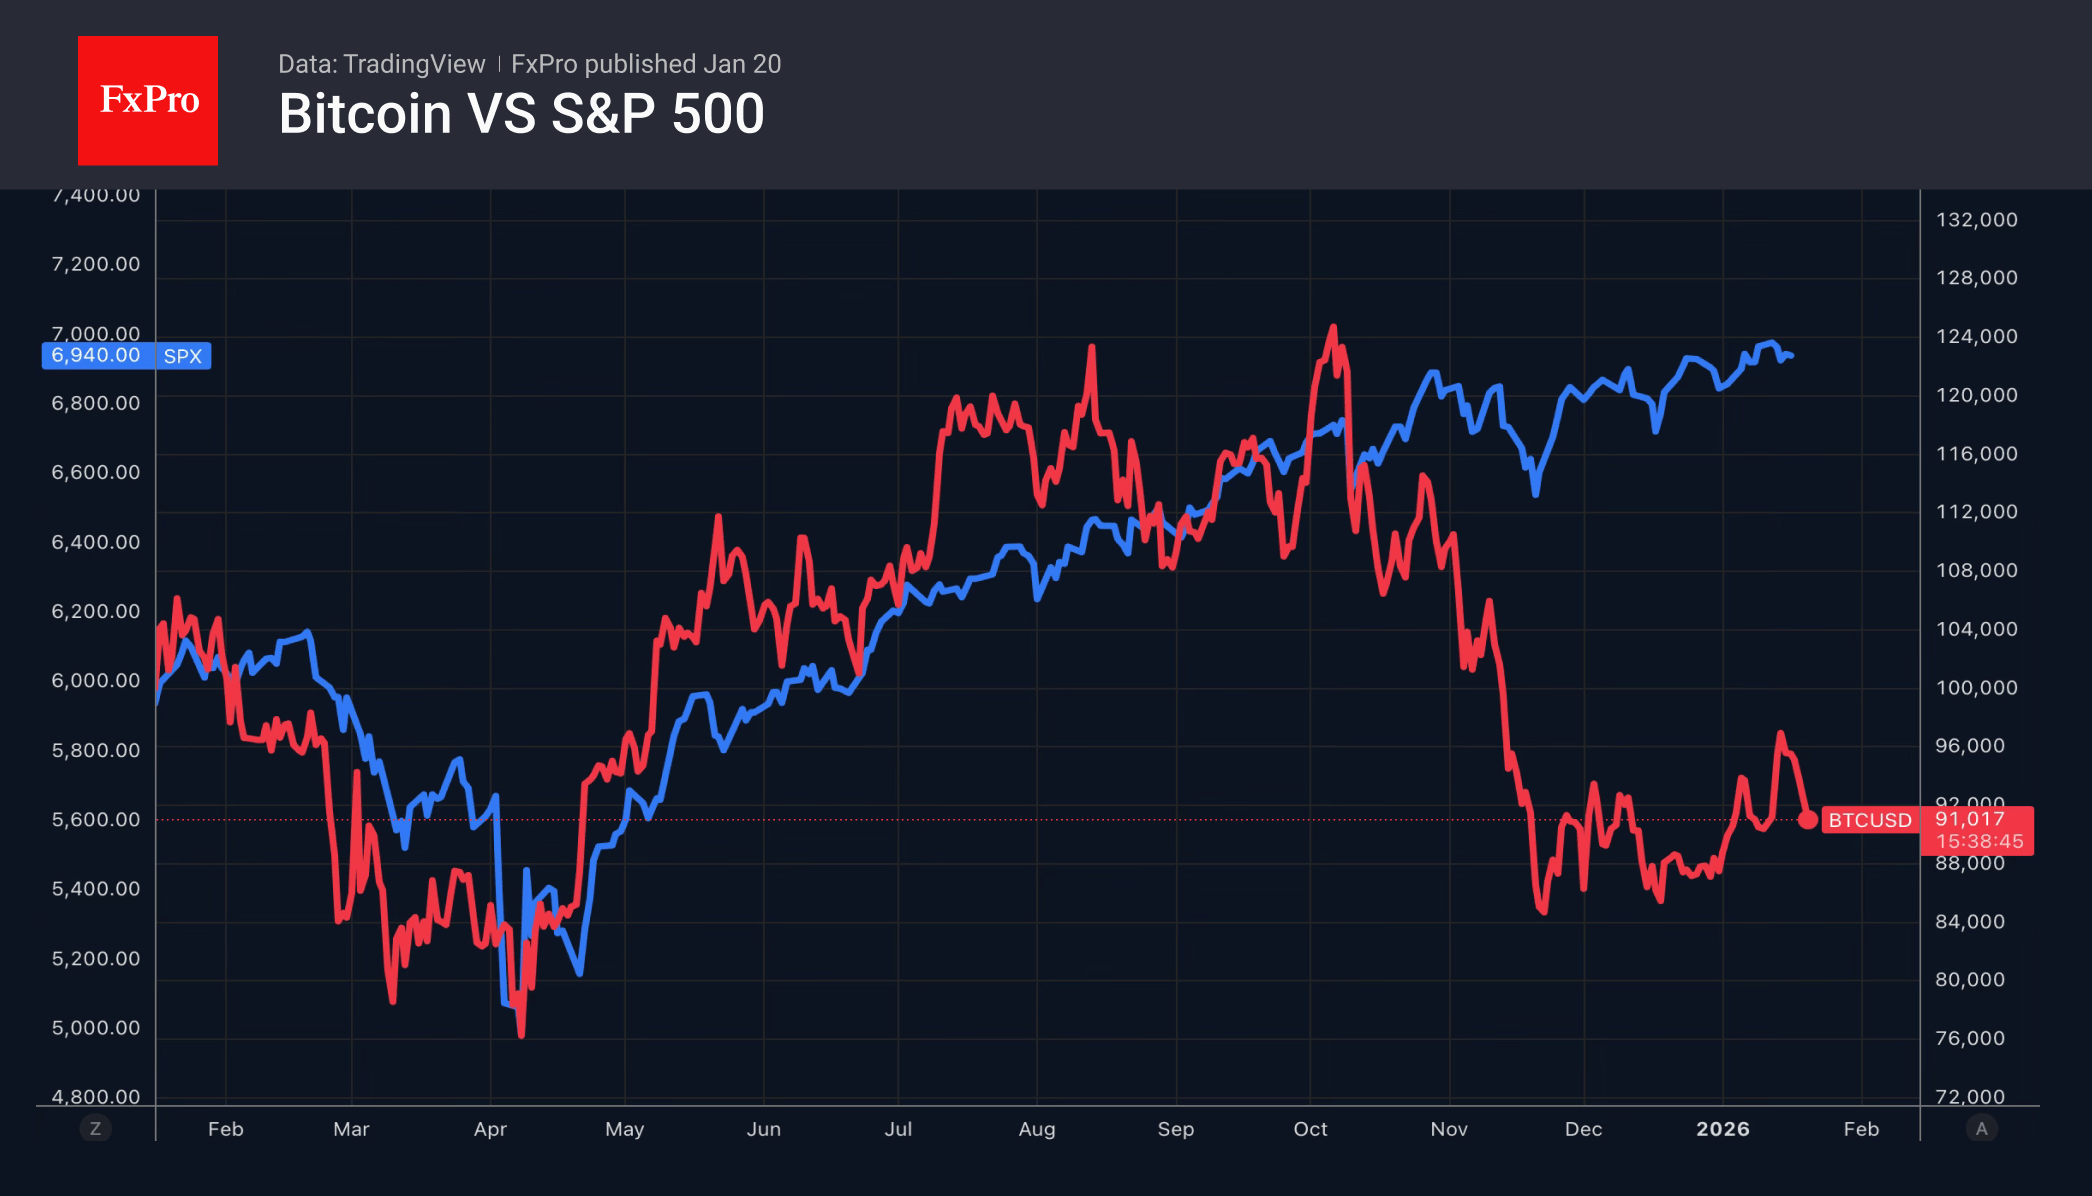
On EU-US trade conflict escalation, the paths of Bitcoin and US stock indices are likely to converge again. They diverged in the fourth quarter, and one of the reasons was artificial intelligence technology. It helped stocks grow and prevented BTC from doing so. According to Jefferies, the development of quantum computing will seriously undermine the reliability of crypto wallets. The security of storing funds in them will decline, which will reduce confidence in digital assets and contribute to a collapse in their prices. The company has reduced the share of cryptocurrencies in its portfolios by 10%.
Thus, after a fairly successful start to the year, Bitcoin has once again fallen out of favour with investors and is poised to resume its downward trend. What can save it? The Supreme Court may lend a helping hand to the crypto market. The abolition of universal tariffs will be favourable for US stocks and may trigger a correction in gold. The outflow of capital from it allows us to expect that part of the pie will go to cryptocurrency.
Dollar, Stocks, and Treasuries All Down as Trump Escalates Pressure on Allies
The “Sell America” trade gathered further momentum today, with U.S. assets coming under broad pressure as markets returned to full participation. U.S. Treasuries led the move, with the 10-year yield pushing toward 4.3% as bond selling accelerated. U.S. equity futures point to a sharply lower open. The combination of developments has not supported the Dollar, which is under broad selling pressure.
Geopolitical risk remains the central catalyst. US President Donald Trump doubled—if not tripled—down on his push to seize Greenland, declaring there was “no going back” and refusing to rule out the use of force. Speaking after talks with NATO Secretary General Mark Rutte, Trump framed Greenland as “imperative for national and world security.” To reinforce the message, Trump posted AI-generated images depicting himself in Greenland holding a U.S. flag, and another showing Canada and Greenland folded into the US. Markets interpreted the imagery less as symbolism and more as confirmation that the issue has moved from rhetoric into sustained political pressure.
Tensions with France escalated further after Trump leaked private messages, including from President Emmanuel Macron, questioning U.S. actions over Greenland. Trump has already threatened 200% tariffs on French wines and champagne. The escalation has not been limited to continental Europe. On the eve of his appearance at the World Economic Forum, Trump also turned on the UK, attacking London’s decision to transfer sovereignty of the Chagos Islands to Mauritius. The move has left the so-called “special relationship” visibly strained.
The widening rift with allies has reinforced market concerns that U.S. trade and foreign policy are becoming increasingly unpredictable, with direct implications for capital flows. European investors remain the largest holders of U.S. assets, and markets are increasingly questioning what level of escalation would prompt a reassessment of that exposure.
Alongside geopolitical risk, uncertainty around U.S. institutions stayed in the picture. US Treasury Secretary Scott Bessent stressed in a CNB interview that Fed independence remains vital. But he frame the scrutiny of Fed Chair Jerome Powell as an accountability issue, noting the number of ethics-related resignations under Powell’s tenure. "If that happened at a Wall Street firm, the CEO would be out," Bessent said.
In the currency markets, Dollar is currently the worst performer for the week so far, followed by Yen, and then Sterling. Swiss Franc is the best, followed by Kiwi, and then Euro. Aussie and Loonie are positioning in the middle.
BoE’s Bailey: Market calm offers no assurance amid geopolitical strain
BoE Governor Andrew Bailey warned that risks to the UK financial system have increased over the past year, even as markets remain relatively calm. Speaking to parliament’s Treasury Committee, he said the central bank’s December Financial Stability Report concluded that geopolitical developments were a key driver behind the rising risk assessment.
Bailey highlighted geopolitical tensions and trade disputes as particularly important considerations, noting that they can carry significant “financial stability consequences”. While he stopped short of pointing to any single trigger, he stressed that the scale and persistence of geopolitical uncertainty itself represents a material risk to the financial system.
He also cautioned against complacency. Bailey said markets and global growth have so far proved more resilient than expected in the face of repeated political shocks, including ongoing U.S. tariff threats. “Neither of them I take as a source of any assurance going forward,” he said, adding that policymakers must remain highly alert to the risks ahead.
UK payrolled employment falls -43k, wage growth gradually eases
UK labor market data showed further signs of cooling in December, led by outright job losses. Payrolled employment fell by -43k (-0.1% m/m), while the claimant count rose by 17.9k, pointing to softening hiring demand as growth momentum slows.
Wage dynamics were mixed but continued to ease on a broader trend basis. Median monthly pay growth rose to 4.0% yoy from yoy, though this follows a sharp deceleration from levels well above 5% seen through mid-2025.
In the three months to November, unemployment rate was unchanged at 5.1%, suggesting labour slack is building only gradually. Meanwhile, average earnings including bonuses slowed to 4.7% yoy from 4.8%, while earnings excluding bonuses eased to 4.5% from 4.6%.
German ZEW jumps to 59.6, momentum building but US unpredictability a burden
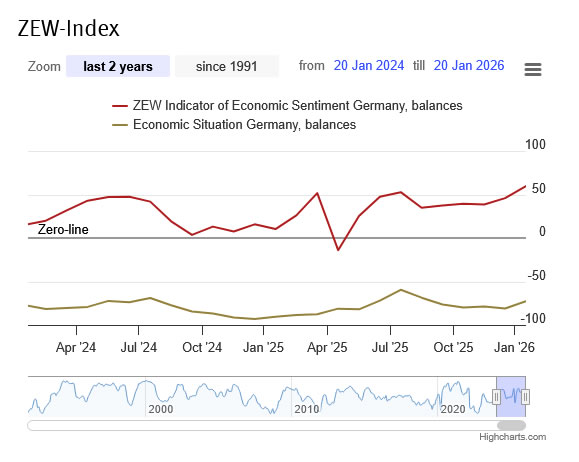
Germany’s economic sentiment strengthened sharply at the start of 2026, offering an early sign that growth momentum may be building. German ZEW Economic Sentiment Index jumped from 45.8 to 59.6 in January, well above expectations of 49.6, while Current Situation Index improved from -81.0 to -72.7, also beating forecasts.
The improvement was echoed at the euro area level. Eurozone ZEW Economic Sentiment rose from 33.7 to 40.8, exceeding expectations of 35.2. The Current Situation measure remained deeply negative, though it showed some stabilization, up from -10.4 to -18.1.
Commenting on the data, Achim Wambach, president of ZEW, said the strong rise suggests 2026 could mark a "turning point", while cautioning that further reforms are needed to strengthen Germany’s attractiveness as a business location and ensure sustainable growth.
Notably, sentiment improved despite renewed tariff threats from the U.S. Export-oriented industries showed broad-based gains, with sentiment balances rising 18.2 points in steel and metals, 22.7 points in mechanical engineering, and 16.5 points in the automotive sector. Chemicals, pharmaceuticals, and electrical engineering also posted double-digit improvements of 12.4 and 14.0 respectively
Still, ZEW noted, "the unpredictable US trade policy continues to be an additional burden on the German export economy".
China keeps LPRs steady as policy shifts to structural support
The PBoC kept its benchmark lending rates unchanged, leaving the 1-year loan prime rate at 3.0% and the 5-year LPR at 3.5%. The decision was widely expected and reinforces the view that Beijing remains reluctant to deploy broad-based monetary easing despite slowing growth.
The policy stance reflects a clear preference for targeted support over headline rate cuts. The 1-year LPR continues to guide most corporate and household loans, while the 5-year rate anchors mortgage pricing. By holding both steady, authorities are signaling concern over financial stability and capital outflows, while relying on alternative tools to stimulate demand where needed.
Instead, the PBOC has intensified the use of structural monetary policy instruments. Last week, it cut rates on key relending facilities by 25bp, lowering the 1-year relending rate for agriculture and small businesses to 1.25%, effective Monday. By reducing the cost of central bank funding to banks, the PBOC aims to encourage cheaper credit for targeted sectors without reopening the door to broad leverage expansion.
Bitcoin risks deeper fall toward 70k if NASDAQ selloff intensifies
Cryptocurrencies are under renewed pressure alongside technology stocks as risk aversion intensified on fresh fears of a transatlantic trade war linked to the Greenland dispute. The macro backdrop is deteriorating quickly. Renewed tariff threats between the U.S. and Europe have revived concerns over growth, policy uncertainty, and capital flows.
From a market structure perspective, the current selloff suggests that Bitcoin’s corrective recovery since last November may already be complete. Price action has turned decisively lower, raising the risk that the broader downtrend resumes if risk sentiment continues to worsen. A key near-term catalyst will be the NASDAQ’s reaction to support around 23,000 at today’s open. A clean break below that zone would likely accelerate equity downside, and history suggests crypto would not be spared in such a move.
Technically, Bitcoin’s rebound from 80,492 appears to have topped at 97,922, following rejection by 38.2% retracement of 126,289 to 80,492 at 97,986, as well as 55 W EMA. Firm break below 86,405 support would strengthen the case that fall from 126,289 is resuming, opening the door to a full retest of 80,492 low.
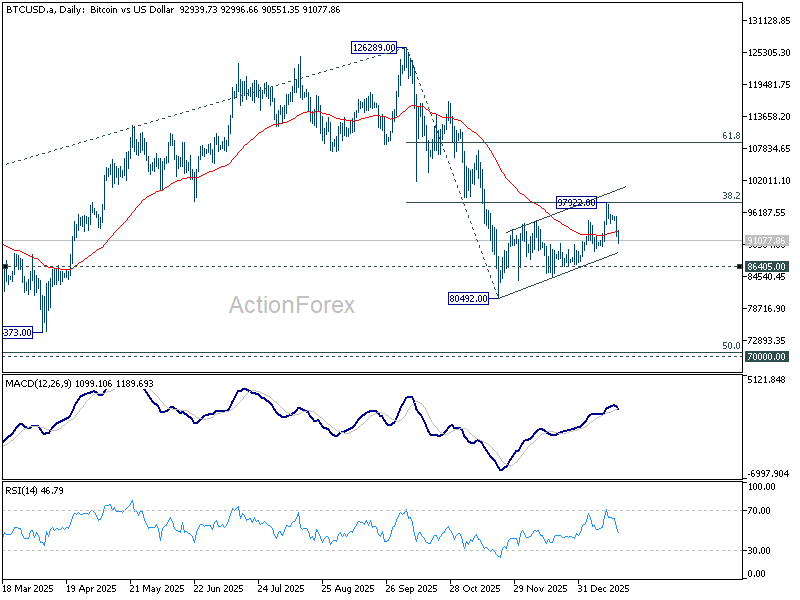
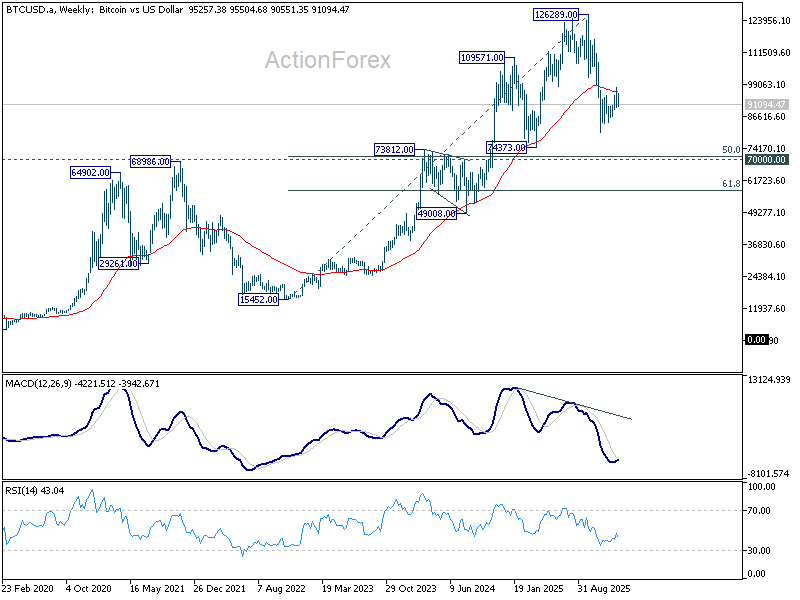
Failure at 80, 492 would shift focus to a deeper medium-term correction. On that view, the next major downside objective sits near 70,000 psychological level, close to 50% retracement of the long-term rise from 2022 low at 15,452 to 2025 high at 126,289, located at 70,870.
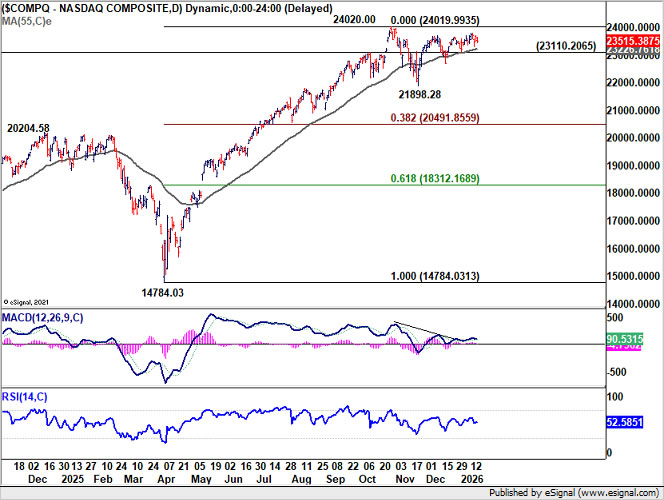
NASDAQ’s rebound from 21,898.28 appears corrective, representing the second leg of the corrective pattern that began from 24,020 peak. Decisive break of 23,110.20 support would signal the start of the third leg lower. In that scenario, downside would likely extend back toward 21,898.28, and possibly further to 38.2% retracement 14,784.03 (2025 low) to 24,020.00 (2025 high) at 20,491.85.
Such a move in NASDAQ would almost certainly intensify pressure on crypto markets. Historically, extended drawdowns in tech equities have produced non-linear declines in cryptocurrencies, as leverage unwinds and liquidity thins rapidly.
EUR/USD Mid-Day Outlook
Daily Pivots: (S1) 1.1600; (P) 1.1625; (R1) 1.1670; More….
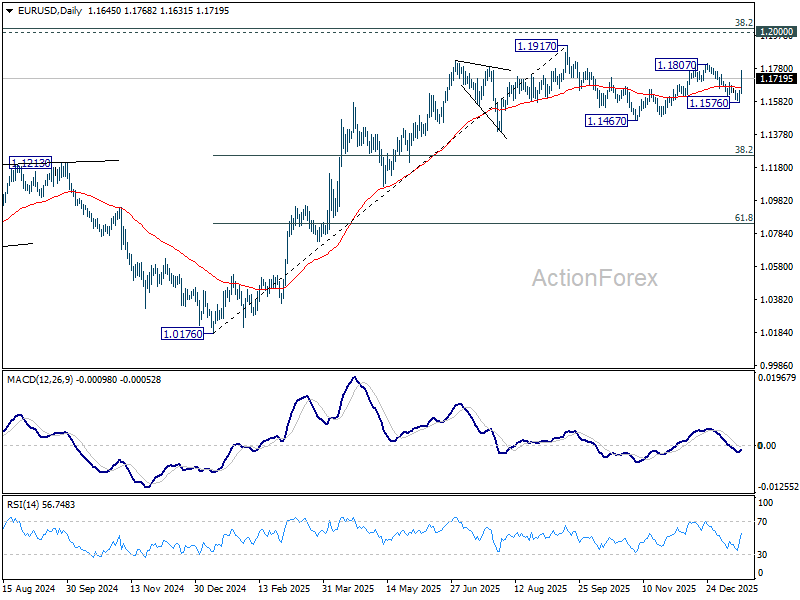
Intraday bias in EUR/USD remains on the upside for 1.1807 resistance. Firm break there will resume whole rally from 1.1467, and target a retest on 1.1917 key resistance level. For now, risk will stay on the upside as long as 55 4H EMA (now at 1.1652) holds, in case of retreat.
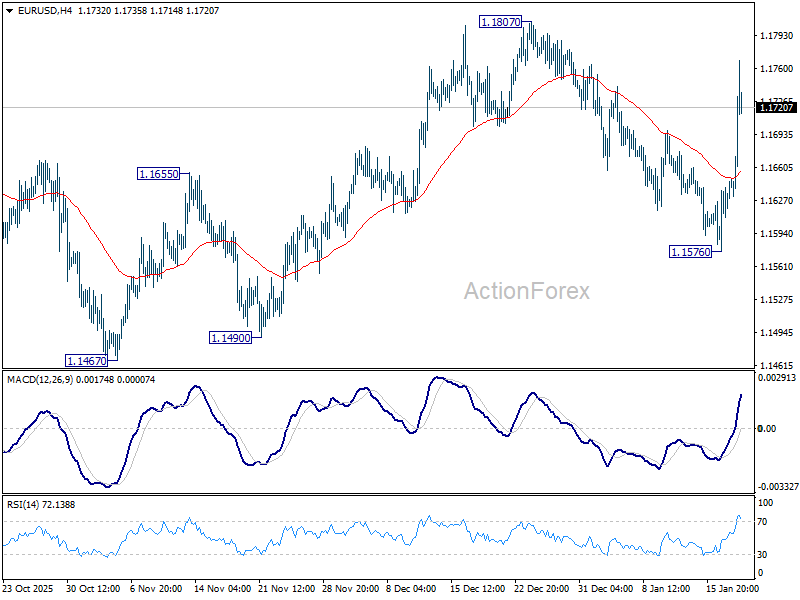
In the bigger picture, as long as 55 W EMA (now at 1.1413) holds, up trend from 0.9534 (2022 low) is still in favor to continue. Decisive break of 1.2 key psychological level will carry larger bullish implication. However, sustained trading below 55 W EMA will argue that rise from 0.9534 has completed as a three wave corrective bounce, and keep long term outlook bearish.
EUR/USD Mid-Day Outlook
Daily Pivots: (S1) 1.1600; (P) 1.1625; (R1) 1.1670; More….
Intraday bias in EUR/USD remains on the upside for 1.1807 resistance. Firm break there will resume whole rally from 1.1467, and target a retest on 1.1917 key resistance level. For now, risk will stay on the upside as long as 55 4H EMA (now at 1.1652) holds, in case of retreat.
In the bigger picture, as long as 55 W EMA (now at 1.1413) holds, up trend from 0.9534 (2022 low) is still in favor to continue. Decisive break of 1.2 key psychological level will carry larger bullish implication. However, sustained trading below 55 W EMA will argue that rise from 0.9534 has completed as a three wave corrective bounce, and keep long term outlook bearish.
BoE’s Bailey: Market calm offers no assurance amid geopolitical strain
BoE Governor Andrew Bailey warned that risks to the UK financial system have increased over the past year, even as markets remain relatively calm. Speaking to parliament’s Treasury Committee, he said the central bank’s December Financial Stability Report concluded that geopolitical developments were a key driver behind the rising risk assessment.
Bailey highlighted geopolitical tensions and trade disputes as particularly important considerations, noting that they can carry significant "financial stability consequences". While he stopped short of pointing to any single trigger, he stressed that the scale and persistence of geopolitical uncertainty itself represents a material risk to the financial system.
He also cautioned against complacency. Bailey said markets and global growth have so far proved more resilient than expected in the face of repeated political shocks, including ongoing U.S. tariff threats. “Neither of them I take as a source of any assurance going forward,” he said, adding that policymakers must remain highly alert to the risks ahead.
Dollar Index (DXY) Falls More Than 0.9% Since the Start of the Week
News surrounding Greenland is the main driver of financial markets today. As a result, we are seeing the implementation of the “Sell America” strategy: the share prices of US companies are falling, and the dollar is losing value against other currencies.
The risks of trade wars, NATO fragmentation, and a potential recession are causing the USD to lose its status as a “safe haven”, with capital flowing into alternative assets (confirming today’s rise in the price of gold to $4,700).
As a result, the dollar index is showing accelerating downward momentum today, having fallen to the 98.500 level.
Technical Analysis of the DXY Chart
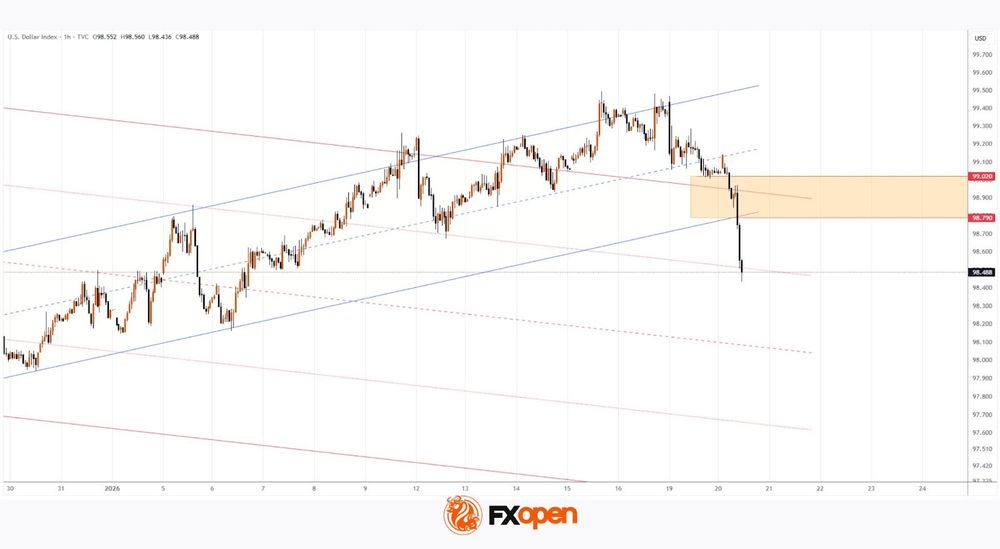
On 12 January, analysing the dollar index (DXY) chart, we:
→ updated the descending channel (marked in red);
→ noted that its upper boundary showed signs of strong resistance.
At that time, we considered a scenario of an intermediate upward correction within the prevailing downward trend and suggested that this upward trajectory could eventually be broken by the bears.
Since then:
→ the price continued to fluctuate within the upward trajectory (shown by the blue channel);
→ but it was unable to hold above the upper red line.
Thus, today’s decline fully confirms the earlier assumption (completion of the intermediate recovery and a return of DXY values to the framework of the dominant downward trend), with:
→ the 98.79–99.02 zone (where supply strength had effectively broken support lines) potentially acting as resistance in the future;
→ an ambitious target for the current bearish pressure being the median of the descending channel.
Trade global index CFDs with zero commission and tight spreads (additional fees may apply). Open your FXOpen account now or learn more about trading index CFDs with FXOpen.
This article represents the opinion of the Companies operating under the FXOpen brand only. It is not to be construed as an offer, solicitation, or recommendation with respect to products and services provided by the Companies operating under the FXOpen brand, nor is it to be considered financial advice.
German ZEW jumps to 59.6, momentum building but US unpredictability a burden
Germany’s economic sentiment strengthened sharply at the start of 2026, offering an early sign that growth momentum may be building. German ZEW Economic Sentiment Index jumped from 45.8 to 59.6 in January, well above expectations of 49.6, while Current Situation Index improved from -81.0 to -72.7, also beating forecasts.
The improvement was echoed at the euro area level. Eurozone ZEW Economic Sentiment rose from 33.7 to 40.8, exceeding expectations of 35.2. The Current Situation measure remained deeply negative, though it showed some stabilization, up from -10.4 to -18.1.
Commenting on the data, Achim Wambach, president of ZEW, said the strong rise suggests 2026 could mark a "turning point", while cautioning that further reforms are needed to strengthen Germany’s attractiveness as a business location and ensure sustainable growth.
Notably, sentiment improved despite renewed tariff threats from the U.S. Export-oriented industries showed broad-based gains, with sentiment balances rising 18.2 points in steel and metals, 22.7 points in mechanical engineering, and 16.5 points in the automotive sector. Chemicals, pharmaceuticals, and electrical engineering also posted double-digit improvements of 12.4 and 14.0 respectively
Still, ZEW noted, "the unpredictable US trade policy continues to be an additional burden on the German export economy".
Bitcoin risks deeper fall toward 70k if NASDAQ selloff intensifies
Cryptocurrencies are under renewed pressure alongside technology stocks as risk aversion intensified on fresh fears of a transatlantic trade war linked to the Greenland dispute. The macro backdrop is deteriorating quickly. Renewed tariff threats between the U.S. and Europe have revived concerns over growth, policy uncertainty, and capital flows.
From a market structure perspective, the current selloff suggests that Bitcoin’s corrective recovery since last November may already be complete. Price action has turned decisively lower, raising the risk that the broader downtrend resumes if risk sentiment continues to worsen. A key near-term catalyst will be the NASDAQ’s reaction to support around 23,000 at today’s open. A clean break below that zone would likely accelerate equity downside, and history suggests crypto would not be spared in such a move.
Technically, Bitcoin’s rebound from 80,492 appears to have topped at 97,922, following rejection by 38.2% retracement of 126,289 to 80,492 at 97,986, as well as 55 W EMA. Firm break below 86,405 support would strengthen the case that fall from 126,289 is resuming, opening the door to a full retest of 80,492 low.
Failure at 80, 492 would shift focus to a deeper medium-term correction. On that view, the next major downside objective sits near 70,000 psychological level, close to 50% retracement of the long-term rise from 2022 low at 15,452 to 2025 high at 126,289, located at 70,870.
NASDAQ’s rebound from 21,898.28 appears corrective, representing the second leg of the corrective pattern that began from 24,020 peak. Decisive break of 23,110.20 support would signal the start of the third leg lower. In that scenario, downside would likely extend back toward 21,898.28, and possibly further to 38.2% retracement 14,784.03 (2025 low) to 24,020.00 (2025 high) at 20,491.85.
Such a move in NASDAQ would almost certainly intensify pressure on crypto markets. Historically, extended drawdowns in tech equities have produced non-linear declines in cryptocurrencies, as leverage unwinds and liquidity thins rapidly.