Sample Category Title
GBP/USD Pushes Higher, But 1.3450 Looms as a Speed Bump
Key Highlights
- GBP/USD found support near 1.3340 and recovered some losses.
- A bearish trend line is forming with resistance at 1.3440 on the 4-hour chart.
- EUR/USD started a consolidation phase below 1.1665.
- Bitcoin price corrected some gains and again settled below $95,000.
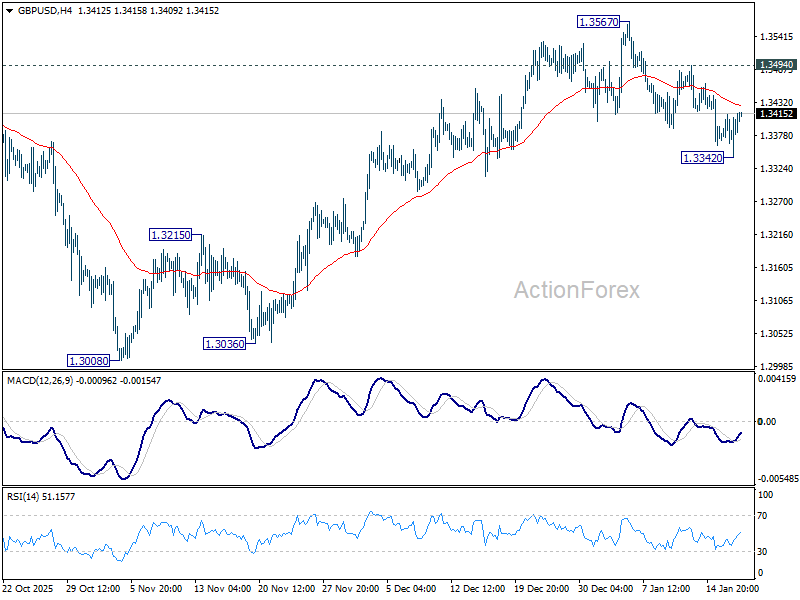
GBP/USD Technical Analysis
The British Pound declined below 1.3400 against the US Dollar before the bulls appeared. GBP/USD tested 1.3340 and recently started a recovery wave.
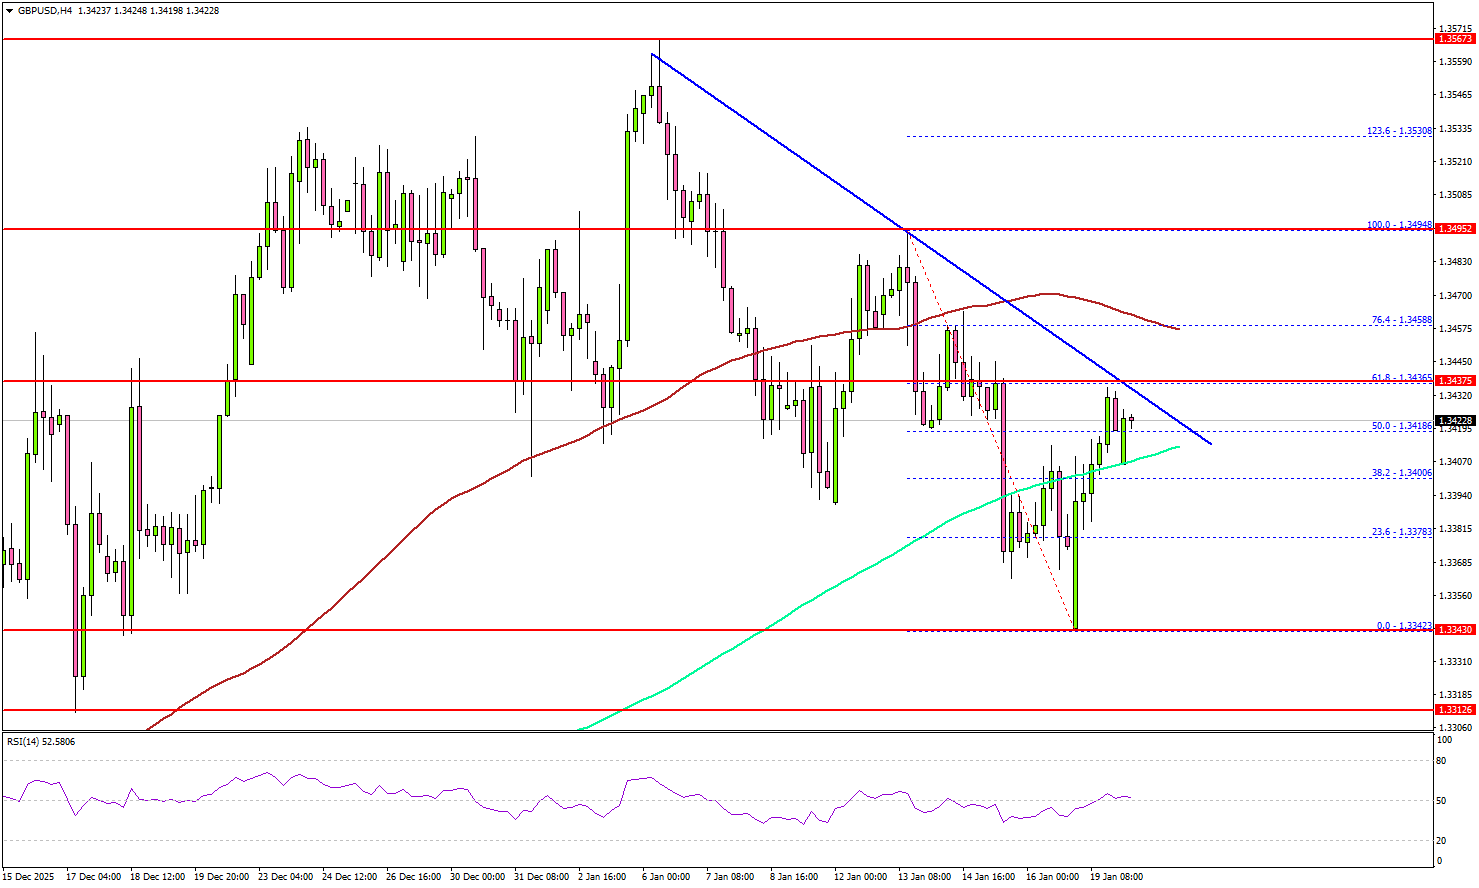
Looking at the 4-hour chart, the pair climbed above 1.3365 and 1.3380. The bulls pushed the pair above the 38.2% Fib retracement level of the downward move from the 1.3494 swing high to the 1.3342 low, and the 200 simple moving average (green, 4-hour).
However, the pair faces many hurdles near 1.3450. Immediate resistance sits near 1.3440 and a connecting bearish trend line. It coincides with the 61.8% Fib retracement level of the downward move from the 1.3494 swing high to the 1.3342 low.
A close above 1.3450 could open the doors for a move toward the 100 simple moving average (red, 4-hour) at 1.3460. Any more gains could set the pace for a steady increase toward 1.3500.
If there is no move above 1.3450, there could be a bearish reaction. On the downside, immediate support is near the 1.3380 level. The first major area for the bulls might be near 1.3340.
A close below 1.3340 might spark heavy bearish moves. The next support could be 1.3300, below which the bears might aim for a move toward 1.3250.
Looking at Gold, the price remained elevated, and the bulls might soon aim for more gains above the $4,680 zone.
Upcoming Key Economic Events:
- UK Claimant Count Change for Dec 2025 – Forecast 18.8K, versus 20.1K previous.
- UK ILO Unemployment Rate for Nov 2025 (3M) – Forecast 5%, versus 5.1% previous.
EUR/USD Hints a Breakout After Latest Trump-Greenland Chaos
In case you missed the headlines, the attention quickly shifted from a potential intervention in Iran to heightened US threats to acquire Greenland by purchase.
After the threats over the weekend, EU heads of state are planning an emergency meeting, even as the World Economic Forum in Davos begins.
The recent geopolitical intimidation against Denmark and Greenland, combined with additional economic warnings, has prompted the European Union to raise the current 15% tariff rate by 10% if the European Union disagrees, starting February 1.
Despite American Markets being closed today for MLK Day, US assets have sold off quite harshly, with the latest tariff and general Trump volatility hurting the US Dollar.
On the other hand, the European Central Bank is consolidating its power and stability as Vice President de Guindos officially steps down, with hawk-leaning Croatian Governor Boris Vujcic selected as his replacement.
With the latest events and flows, EUR/USD is breaking to the upside and could attract quite a bit of attention (and volatility) for the times to come – keep a close eye on these developments.
In the meantime, let's dive into a multi-timeframe EUR/USD technical analysis.
EUR/USD Multi-timeframe Technical Analysis
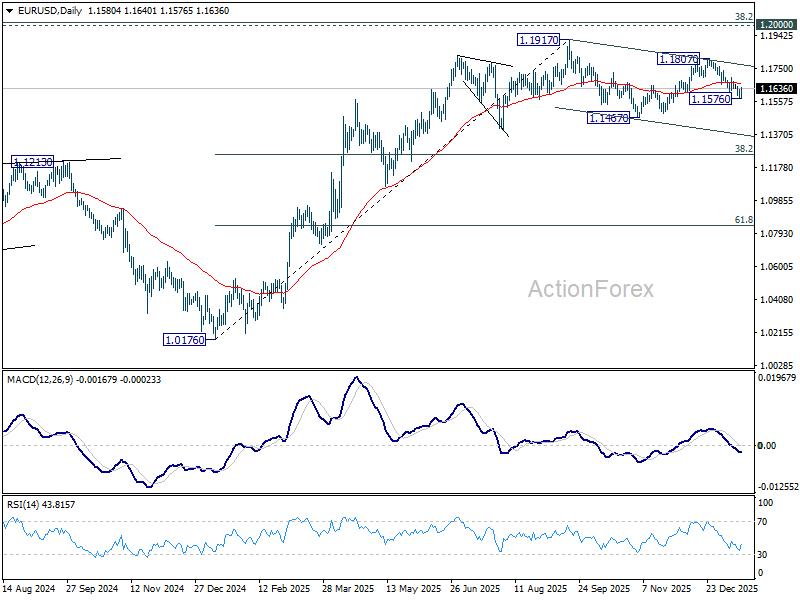
Daily Chart
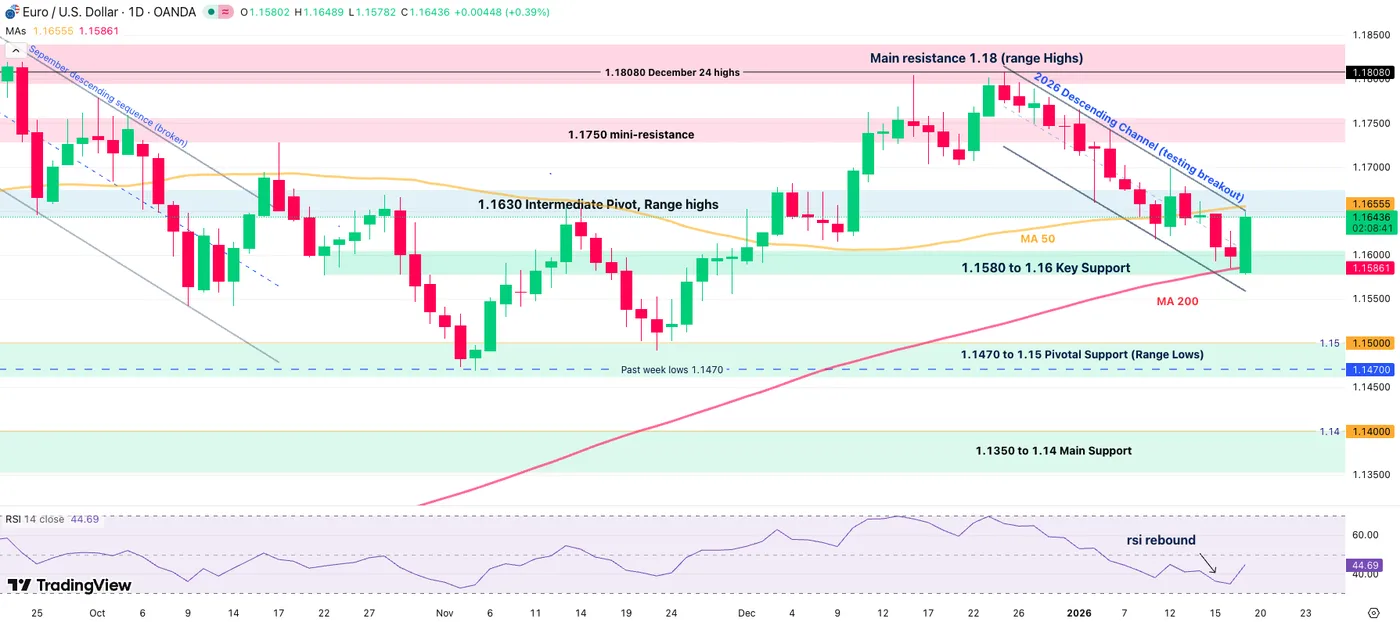
EUR/USD Daily Chart, January 19, 2026 – Source: TradingView
EUR/USD is attempting an upside breakout from its end-2025 Descending Channel.
Bouncing off of its 200-Day Moving Average (which just caught up from the 10% 2025 rally in the pair), the immediate flows and events could cause a larger breakout from its 6-month long 4,000 pip consolidation.
Several hurdles will need to be breached before that.
- The immediate test comes around 1.1630 which acts as key momentum pivot and coincides with the actual breakout from the Channel.
- Breaking and closing 1.18 on the weekly could test the 1.20 levels – Such developments would take more time
- Such scenarios exclude a potential Trump TACO where he backs off of his recent words ~ The best scenario for the USD
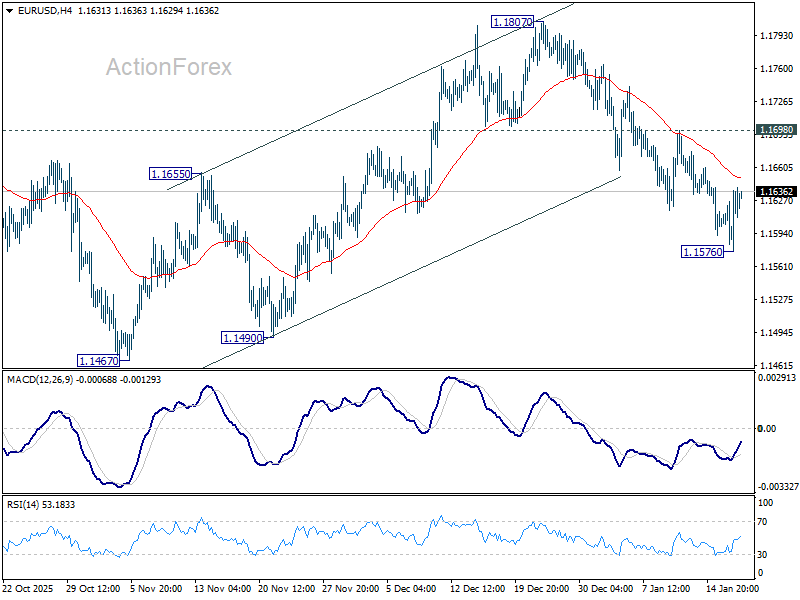
4H Chart and Technical Levels
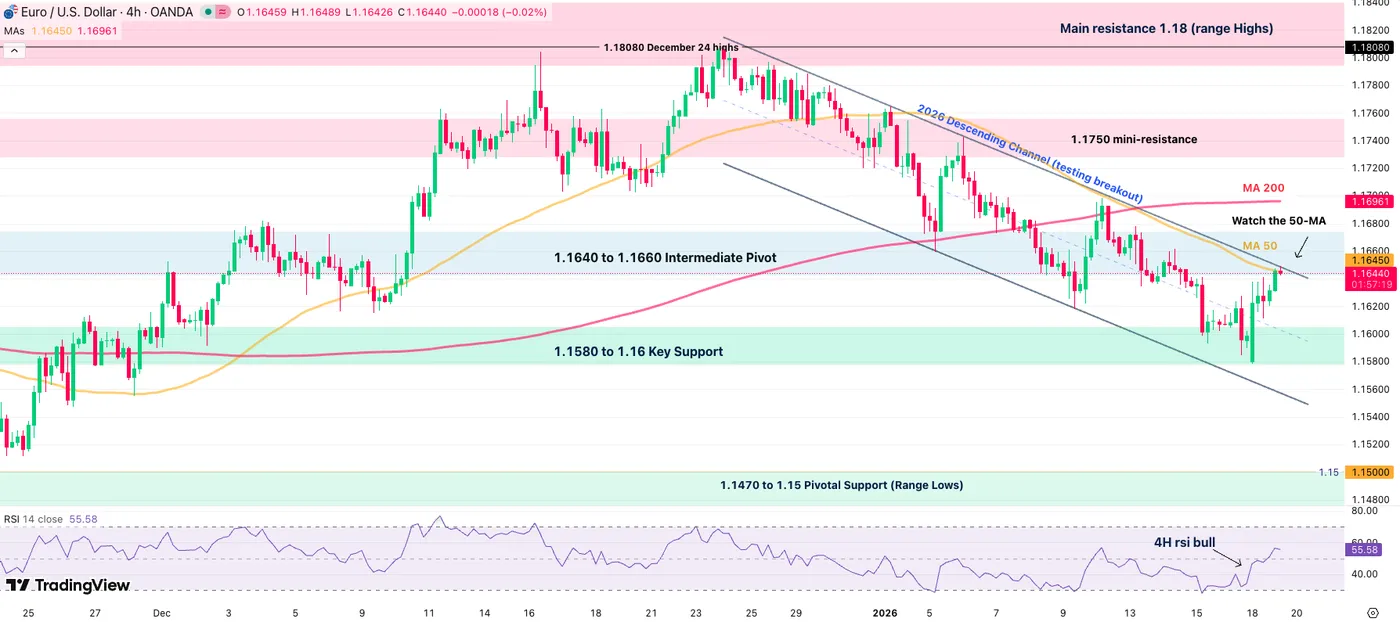
EUR/USD 4H Chart, January 19, 2026 – Source: TradingView
Watch if tomorrow closes above or below the 4H-50 MA to confirm a breakout or rejection of the Channel higher bound.
Resistance levels
- 1.1640 to 1.1660 Intermediate Pivot and 4H 50-MA (1.16490)
- 1.17 Psychological Level
- 1.1750 minor resistance
- Main resistance 1.18 (range Highs)
Support levels
- 1.1580 to 1.16 Key Support
- 1.1550 Channel lows
- 1.1470 to 1.15 Pivotal Support (Range Lows)
1H Chart
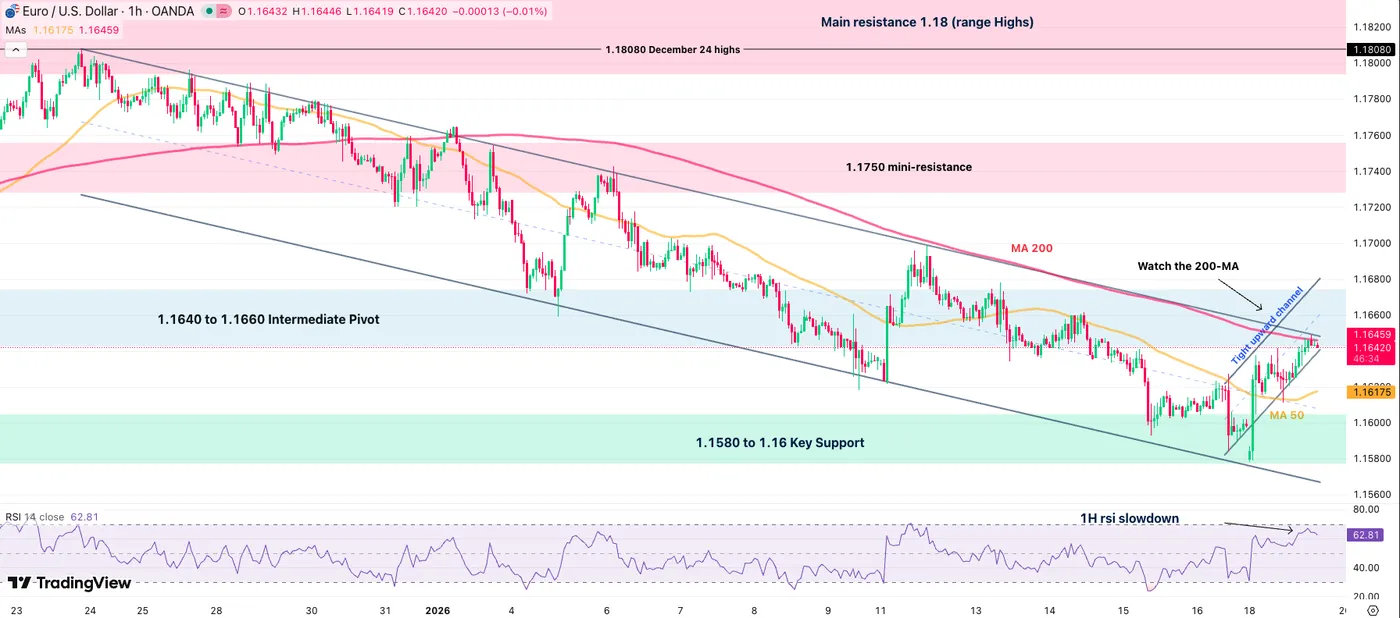
EUR/USD 1H Chart, January 19, 2026 – Source: TradingView
EUR/USD shows a more balanced price action as volumes largely fall off (US Traders are off).
It will be very interesting to see whether bulls push for a (descending) channel breakout or the 1H 200 MA/4H 50 MA stalls the price action.
Rejecting the channel highs would point either to a retest of Sunday lows or (1.15780) or continued downside (lower odds looking at the current situation).
Note: The Euro could still be affected negatively from the current development, reason why the Swiss Franc is leading the daily FX flows.
Safe Trades!
Gold Wave Analysis
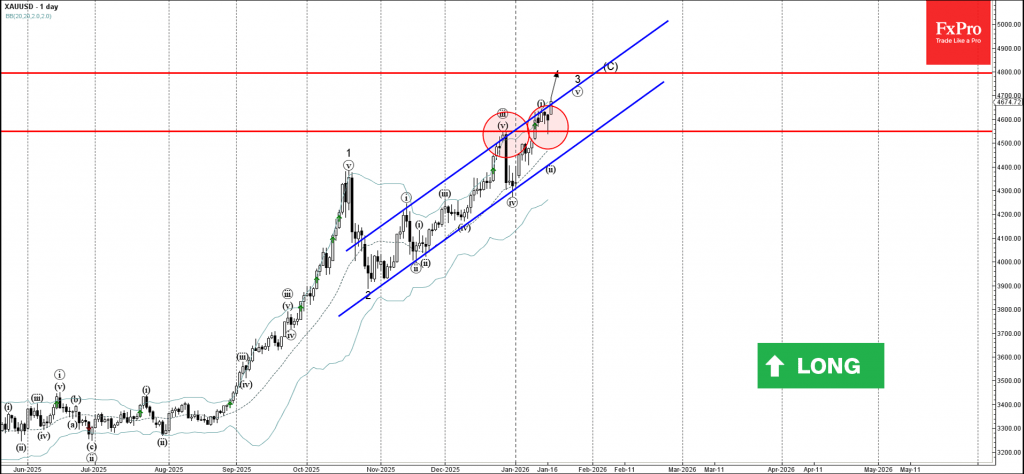
Gold: ⬆️ Buy
- Gold reversed from key support level 4547.00
- Likely to rise to resistance level 4800.00
Gold recently reversed up from the key support level 4547.00 (former resistance from the end of December, acting as support after it was broken).
The upward reversal from the support level 4547.00 created the daily Japanese candlesticks Hammer.
Given the strong daily uptrend, Gold can be expected to rise to the next resistance level 4800.00 (target price for the completion of the active impulse wave (C)).
Silver Wave Analysis
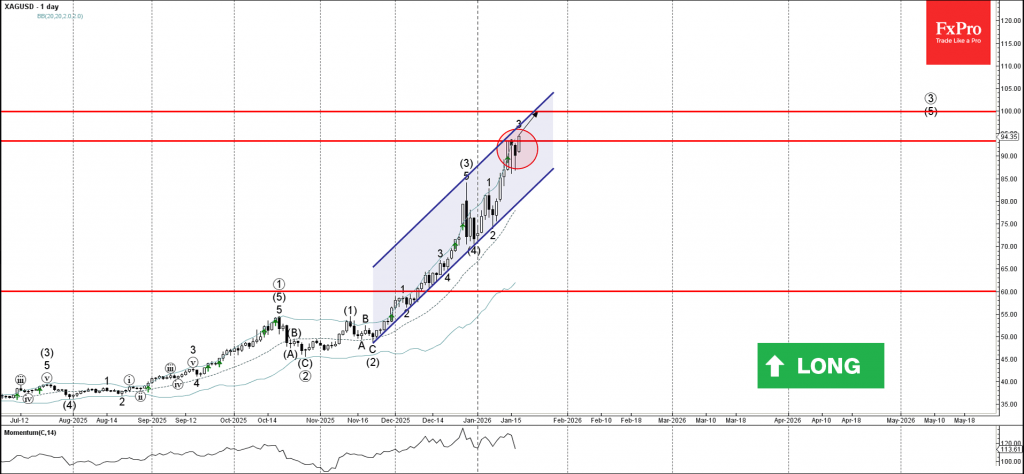
Silver: ⬆️ Buy
- Silver broke resistance level 93.30
- Likely to rise to resistance level 100.00
Silver today broke above the resistance level 93.30, which reversed the price with the daily Evening Star eerier this month.
The breakout of the resistance level 93.30 should accelerate the active impulse wave 3 which belongs to the intermediate impulse wave (3) from November.
Given the clear daily uptrend, Silver can be expected to rise to the next round resistance level 100.00 (target price for the completion of the active impulse wave (5)).
EURJPY Wave Analysis
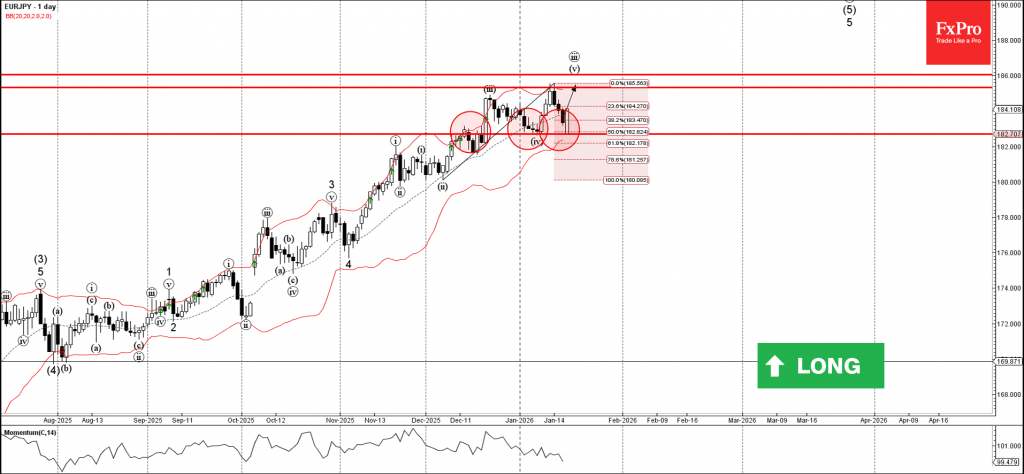
EURJPY: ⬆️ Buy
- EURJPY reversed from support zone
- Likely to rise to resistance level 185.30
EURJPY currency pair recently down from the support zone between the support level 182.70 (low of the previous minor correction iv) and the lower daily Bollinger Band.
This support zone was further strengthened by the 50% Fibonacci correction of the sharp upward impulse from December.
Given the clear daily uptrend, EURJPY currency pair can be expected to rise to the next resistance level 185.30 (which reversed the price earlier this month).
Eco Data 1/20/26
| GMT | Ccy | Events | Act | Cons | Prev | Rev |
|---|---|---|---|---|---|---|
| 21:30 | NZD | Business NZ PSI Dec | 51.5 | 46.9 | 47.2 | |
| 01:00 | CNY | 1-Y Loan Prime Rate | 3.00% | 3.00% | 3.00% | |
| 01:00 | CNY | 5-Y Loan Prime Rate | 3.50% | 3.50% | 3.50% | |
| 07:00 | EUR | Germany PPI M/M Dec | -0.20% | -0.10% | 0% | |
| 07:00 | EUR | Germany PPI Y/Y Dec | -2.50% | -2.40% | -2.30% | |
| 07:00 | GBP | Claimant Count Change Dec | 17.9K | 15.6K | 20.1K | |
| 07:00 | GBP | ILO Unemployment Rate (3M) Nov | 5.10% | 5.10% | 5.10% | |
| 07:00 | GBP | Average Earnings Including Bonus 3M/Y Nov | 4.70% | 4.60% | 4.70% | 4.80% |
| 07:00 | GBP | Average Earnings Excluding Bonus 3M/Y Nov | 4.50% | 4.50% | 4.60% | |
| 07:30 | CHF | PPI M/M Dec | -0.20% | 0.20% | -0.50% | |
| 07:30 | CHF | PPI Y/Y Dec | -1.80% | -1.60% | ||
| 09:00 | EUR | Eurozone Current Account (EUR) Nov | 8.6B | 20.3B | 25.7B | |
| 10:00 | EUR | Germany ZEW Economic Sentiment Jan | 59.6 | 49.6 | 45.8 | |
| 10:00 | EUR | Germany ZEW Current Situation Jan | -72.7 | -75.5 | -81 | |
| 10:00 | EUR | Eurozone ZEW Economic Sentiment Jan | 40.8 | 35.2 | 33.7 |
| 21:30 | NZD |
| Business NZ PSI Dec | |
| Actual | 51.5 |
| Consensus | |
| Previous | 46.9 |
| Revised | 47.2 |
| 01:00 | CNY |
| 1-Y Loan Prime Rate | |
| Actual | 3.00% |
| Consensus | 3.00% |
| Previous | 3.00% |
| 01:00 | CNY |
| 5-Y Loan Prime Rate | |
| Actual | 3.50% |
| Consensus | 3.50% |
| Previous | 3.50% |
| 07:00 | EUR |
| Germany PPI M/M Dec | |
| Actual | -0.20% |
| Consensus | -0.10% |
| Previous | 0% |
| 07:00 | EUR |
| Germany PPI Y/Y Dec | |
| Actual | -2.50% |
| Consensus | -2.40% |
| Previous | -2.30% |
| 07:00 | GBP |
| Claimant Count Change Dec | |
| Actual | 17.9K |
| Consensus | 15.6K |
| Previous | 20.1K |
| 07:00 | GBP |
| ILO Unemployment Rate (3M) Nov | |
| Actual | 5.10% |
| Consensus | 5.10% |
| Previous | 5.10% |
| 07:00 | GBP |
| Average Earnings Including Bonus 3M/Y Nov | |
| Actual | 4.70% |
| Consensus | 4.60% |
| Previous | 4.70% |
| Revised | 4.80% |
| 07:00 | GBP |
| Average Earnings Excluding Bonus 3M/Y Nov | |
| Actual | 4.50% |
| Consensus | 4.50% |
| Previous | 4.60% |
| 07:30 | CHF |
| PPI M/M Dec | |
| Actual | -0.20% |
| Consensus | 0.20% |
| Previous | -0.50% |
| 07:30 | CHF |
| PPI Y/Y Dec | |
| Actual | -1.80% |
| Consensus | |
| Previous | -1.60% |
| 09:00 | EUR |
| Eurozone Current Account (EUR) Nov | |
| Actual | 8.6B |
| Consensus | 20.3B |
| Previous | 25.7B |
| 10:00 | EUR |
| Germany ZEW Economic Sentiment Jan | |
| Actual | 59.6 |
| Consensus | 49.6 |
| Previous | 45.8 |
| 10:00 | EUR |
| Germany ZEW Current Situation Jan | |
| Actual | -72.7 |
| Consensus | -75.5 |
| Previous | -81 |
| 10:00 | EUR |
| Eurozone ZEW Economic Sentiment Jan | |
| Actual | 40.8 |
| Consensus | 35.2 |
| Previous | 33.7 |
Canadian Business Sentiment Remained Subdued While Consumer Sentiment Deteriorated
Business sentiment
The Bank of Canada's Business Outlook Survey (BOS) overall indicator improved slightly in Q4 but remained subdued at -1.78. The share of firms anticipating a recession eased to 22% from 33% in the previous quarter.
Firms' expectations for future sales turned positive, though they remain below the long-run average.
Investment intentions improved modestly in Q4. However, plans remain cautious, with firms continuing to prioritize maintenance spending over expansion.
Hiring plans weakened in Q4 after two quarters of modest growth, driven by the share of firms planning outright staff reductions rising to the highest level since 2016.
Wage growth expectations have stabilized after several quarters of cooling, reflecting ongoing profitability constraints.
Expectations for both input and output price growth eased further in Q4, pointing to continued improvement in price pressures. One-year inflation expectations declined to 3.0% from 3.2%, while five-year inflation expectations held steady around 2.8%.
Consumer sentiment
After improving in Q3, the Bank's Canadian Survey of Consumer Expectations (CSCE) indicator declined modestly in Q4 and remains well below its pre-pandemic average.
The deterioration was driven primarily by the financial health index, as a larger share of respondents reported worsening finances and a higher likelihood of missing a debt payment compared with the previous quarter.
Consistent with this, spending intentions edged lower.
The labour market index rose slightly, but remains below the pre-pandemic level, reflecting elevated expectations of job loss.
Longer-term inflation expectations declined by 0.6 points in Q4 to 3.1%, falling below their pre-pandemic average. Short-term inflation expectations, however, edged slightly higher.
Key Implications
Business sentiment improved modestly in Q4, but closed 2025 below last year's levels, with the Bank of Canada characterizing the mood as "subdued". Firms are expecting stronger demand in 2026, however export sales growth expectations remain muted. While trade uncertainty seems to have eased, hiring and investment plans are expected to remain constrained.
Meanwhile, consumer sentiment remains under pressure, driven by a perceived deterioration in financial health. This is weighing on consumer spending intentions overall. That said, real spending expectations are more resilient among households with equity holdings, pointing to a modest wealth effect from the recent equity market rally.
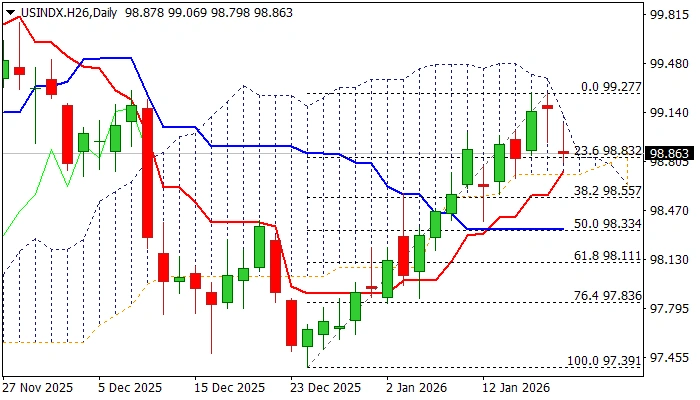
USD Index: Dollar Drops Across the Board on the Latest Tariff Threats
Fresh migration into safety after latest signals from President Trump about additional tariffs on a number of EU countries further weakened the sentiment and increased pressure on the US dollar.
The dollar index opened about $40 lower on Monday and fell to five-day low, with potential for deeper correction of $97.39/$99.27 upleg.
Fading bullish momentum and south heading RSI and Stochastic on daily chart (after Stochastics’ bearish divergence signaled stall of the latest rally) contribute to signals of further easing, along with double bull-trap (at $99.20 Fibo resistance) though fresh weakness needs to clear pivotal supports at $98.83/73 zone (Fibo 23.6% of $97.39/$99.27 / daily Tenkan-sen / cloud base) to validate signal and spark fresh acceleration lower (Fibo supports 38.2%; 50% and 61.8% at $98.55; $98.33 and $98.11 respectively).
Fragile political situation with threats of further escalation on EU’s response to Trump’s threats, contributes to dollar’s negative performance, however strong positive technical signals from diverging daily Tenkan/Kijun-sen after forming a bull-cross and converging 100/200DMAs in attempt to for golden-cross, may partially offset bears.
Res: 98.79; 99.00; 99.30; 99.63
Sup: 98.73; 98.55; 98.33; 98.11
EUR/USD Mid-Day Outlook
Daily Pivots: (S1) 1.1580; (P) 1.1604; (R1) 1.1622; More….
Intraday bias in EUR/USD is turned neutral with current retreat. Further fall is in favor with 1.1698 resistance intact. Fall from 1.1807 is seen as the third leg of the corrective pattern from 1.1917. Below 1.1576 will target 1.1467 and below. However, break of 1.1698 will bring stronger rally back to 1.1807 resistance.
In the bigger picture, as long as 55 W EMA (now at 1.1413) holds, up trend from 0.9534 (2022 low) is still in favor to continue. Decisive break of 1.2 key psychological level will carry larger bullish implication. However, sustained trading below 55 W EMA will argue that rise from 0.9534 has completed as a three wave corrective bounce, and keep long term outlook bearish.
GBP/USD Mid-Day Outlook
Daily Pivots: (S1) 1.3358; (P) 1.3386; (R1) 1.3405; More...
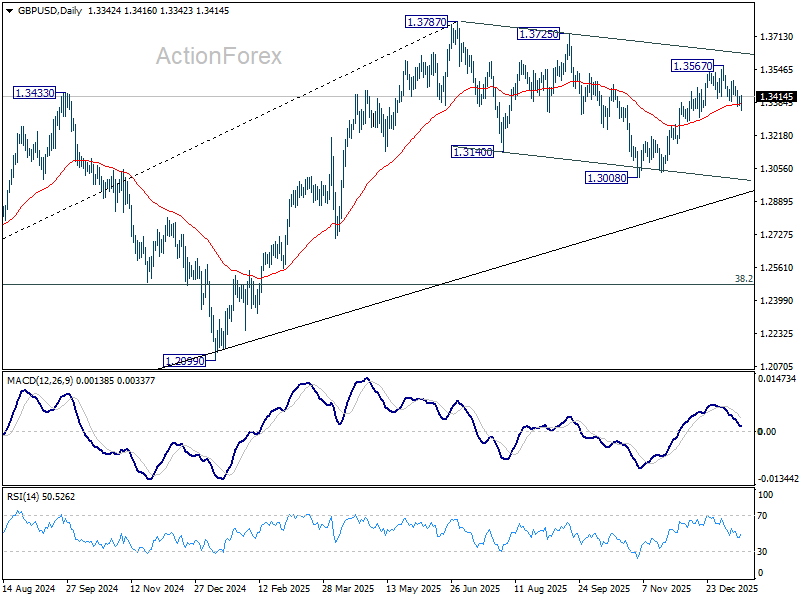
Intraday bias in GBP/USD is turned neutral with current recovery, but risk stays on the downside with 1.3494 resistance intact. On the downside, sustained trading below 55 D EMA (now at 1.3375) will argue that the decline is another falling leg in the corrective pattern from 1.3787. In this case, deeper fall should be seen back to 1.3008 support. However, break of 1.3494 will bring stronger rally back to 1.3567.
In the bigger picture, price actions from 1.3787 (2025 high) are seen as a correction to the larger up trend from 1.3051 (2022 low). Deeper decline could be seen as the pattern extends, but downside should be contained by 38.2% retracement of 1.0351 to 1.3787 at 1.2474 to bring rebound. Break of 1.3787 for up trend resumption is expected at a later stage.