Sample Category Title
S&P 500 Opens the Week With a Bearish Gap
Despite a public holiday in the US (Martin Luther King Jr Day), the US stock market is showing volatility this morning. As the S&P 500 index chart (US SPX 500 mini on FXOpen) indicates, trading on Monday opened with a sizeable bearish gap, driven by Donald Trump’s activity over the weekend.
According to media reports, the US president threatened to impose new tariffs on goods from eight European countries in order to force them to “fully and completely buy Greenland”. The proposed measures target Germany, the UK, France, Denmark, Norway, Sweden, the Netherlands and Finland. A 10% tariff is set to take effect on 1 February and would rise to 25% in June if no agreement is reached.
In response to the US threats, European leaders are considering suspending the ratification of last year’s trade agreement. Clearly, the market could not ignore such an escalation in international trade tensions.
Technical Analysis of the S&P 500 Chart
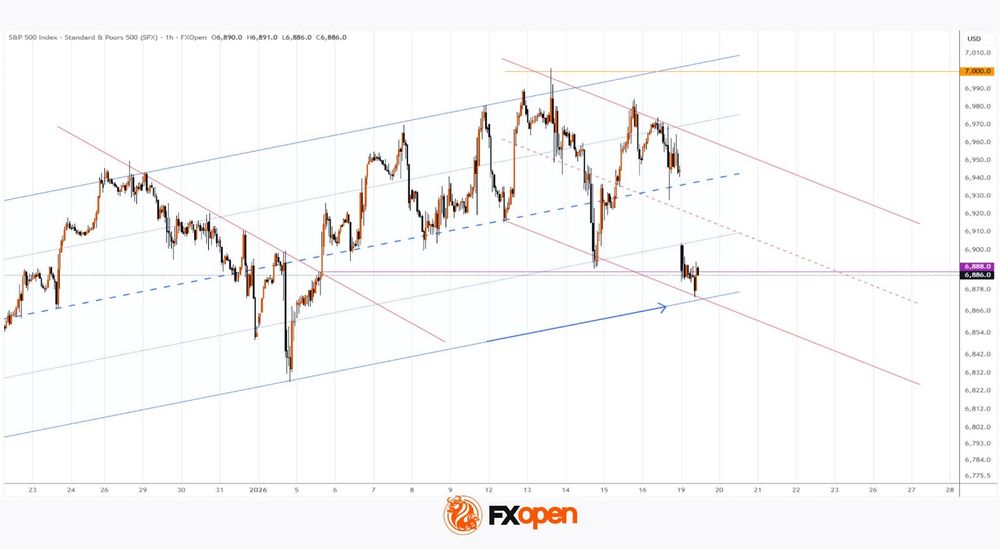
The decline in the S&P 500 (US SPX 500 mini on FXOpen) appears to confirm the bearish signals highlighted in the article S&P 500 Hits a Record – But Is Everything Really So Positive? published on 13 January.
As anticipated:
→ bears proved effective in defending the psychological 7,000-point level (with the price posting a false bullish breakout on the same day);
→ on 14 January, bulls confidently met the decline near the marked support at 6,888, after which the price moved higher.
At the same time, the previously identified ascending channel remains relevant. In this context:
→ the channel median acted as support on Friday;
→ today’s bearish gap has pushed the price down to the lower boundary of the channel (shown by the blue arrow).
The lower boundary has already demonstrated its strength as support in the first days of 2026. However, if geopolitical tensions and disappointing releases during the ongoing earnings season continue to fuel anxiety, bears may break through it and steer the S&P 500 onto a downward path that is becoming increasingly apparent.
Trade global index CFDs with zero commission and tight spreads (additional fees may apply). Open your FXOpen account now or learn more about trading index CFDs with FXOpen.
This article represents the opinion of the Companies operating under the FXOpen brand only. It is not to be construed as an offer, solicitation, or recommendation with respect to products and services provided by the Companies operating under the FXOpen brand, nor is it to be considered financial advice.
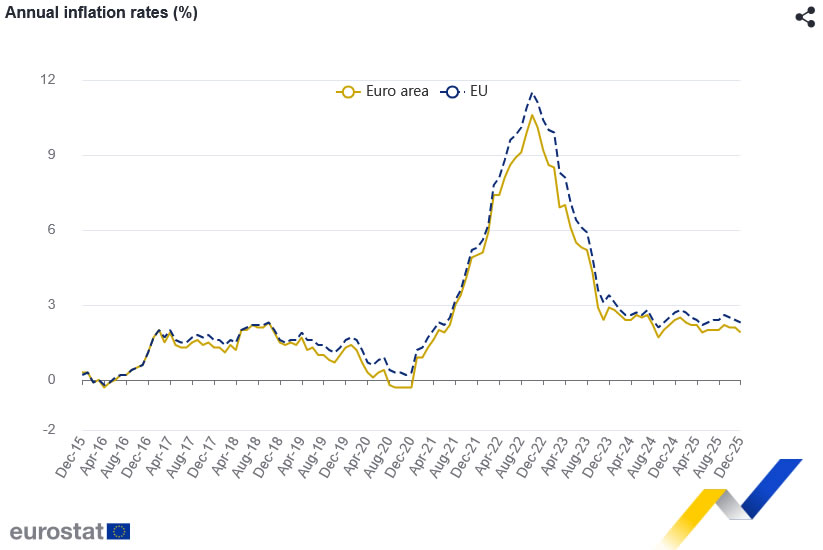
Eurozone CPI finalized at 1.9% in December, regional gaps persist
Final inflation data confirmed that price pressures in the Eurozone continued to ease into year-end. Eurostat reported headline CPI at 1.9% yoy in December, down from 2.1% in November. Core inflation slowed modestly to 2.3% yoy from 2.4%.
Despite the overall cooling, inflation remained heavily services-led. Services accounted for +1.54pp of headline inflation, far outweighing contributions from food, alcohol and tobacco (+0.49pp) and non-energy industrial goods (+0.09pp). Energy prices continued to offset inflation pressures, subtracting -0.18pp.
At the EU level, CPI was finalized at 2.3% yoy, also easing from 2.4% previously. Disinflation was broad-based, with inflation falling in 18 countries, though dispersion remains notable. Inflation was lowest in Cyprus (0.1%), France (0.7%) and Italy (1.2%). Romania (8.6%), Slovakia (4.1%) and Estonia (4.0%) posted elevated readings.
EUR/USD Daily Outlook
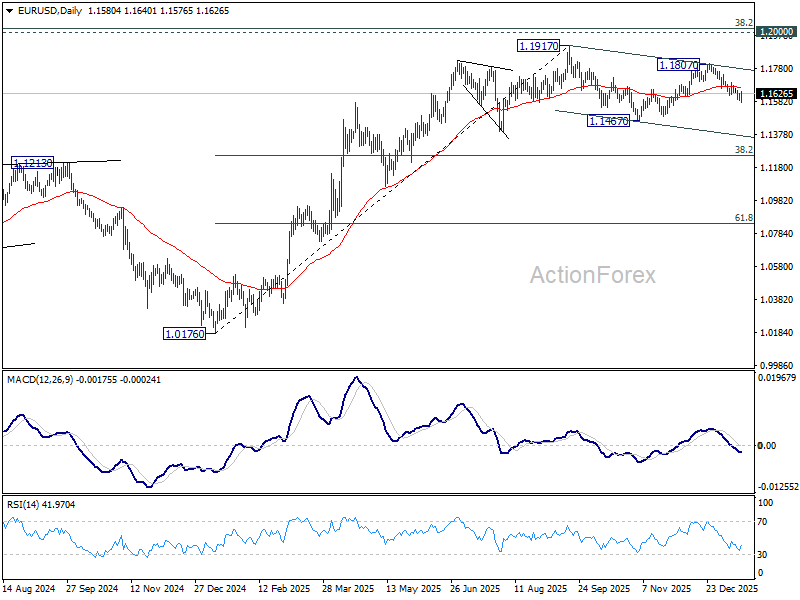
Daily Pivots: (S1) 1.1580; (P) 1.1604; (R1) 1.1622; More….
Intraday bias in EUR/USD remains mildly on the downside at this point. Fall from 1.1807 is seen as the third leg of the corrective pattern from 1.1917. Deeper decline would be seen to 1.1467 and below. For now, risk will stay on the downside as long as 1.1698 resistance hods, in case of recovery.
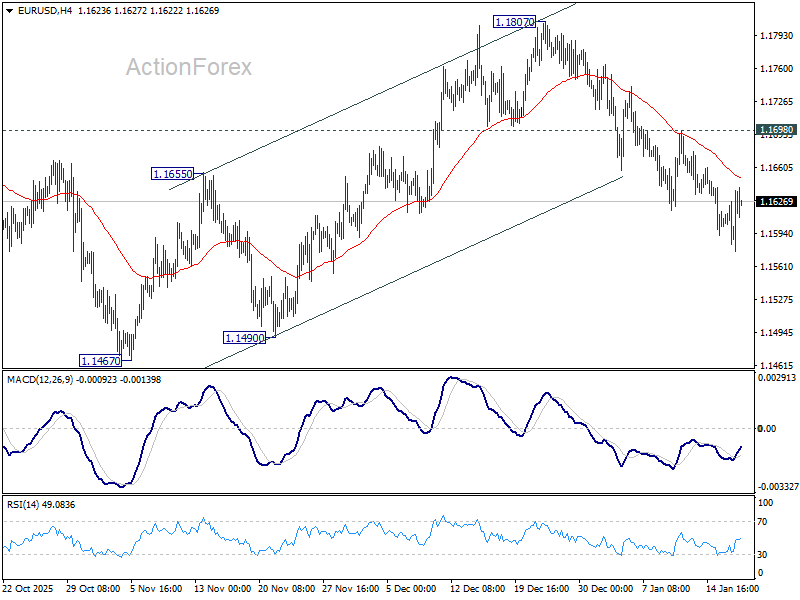
In the bigger picture, as long as 55 W EMA (now at 1.1413) holds, up trend from 0.9534 (2022 low) is still in favor to continue. Decisive break of 1.2 key psychological level will carry larger bullish implication. However, sustained trading below 55 W EMA will argue that rise from 0.9534 has completed as a three wave corrective bounce, and keep long term outlook bearish.
USD/JPY Daily Outlook
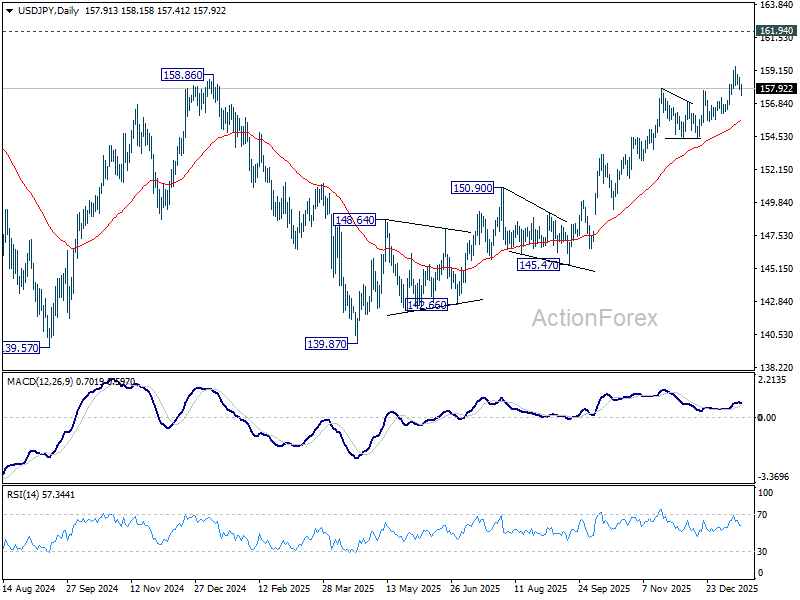
Daily Pivots: (S1) 157.70; (P) 158.20; (R1) 158.59; More...
Intraday bias in USD/JPY remains neutral and more consolidations would be seen below 159.44. But outlook remains bullish with 156.10 support intact. On the upside, break of 159.44 will resume the rise from 139.87 towards 161.94 high. However, firm break of 156.10 will confirm short term topping, and turn bias back to the downside for deeper pullback.
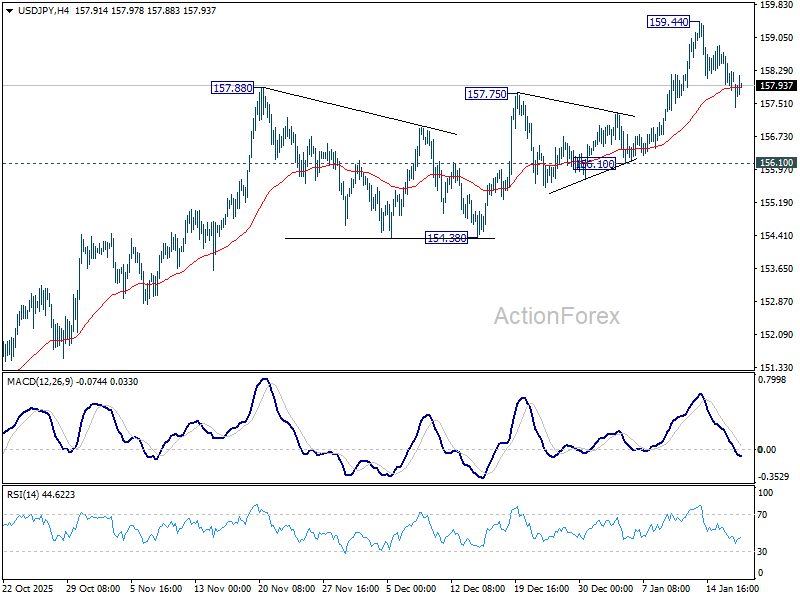
In the bigger picture, corrective pattern from 161.94 (2024 high) should have completed with three waves at 139.87. Larger up trend from 102.58 (2021 low) could be ready to resume through 161.94. Decisive break of 158.86 structural resistance will solidify this bullish case and target 161.94 for confirmation. On the downside, break of 154.38 support will dampen this bullish view and extend the corrective range pattern with another falling leg.
GBP/USD Daily Outlook
Daily Pivots: (S1) 1.3358; (P) 1.3386; (R1) 1.3405; More...
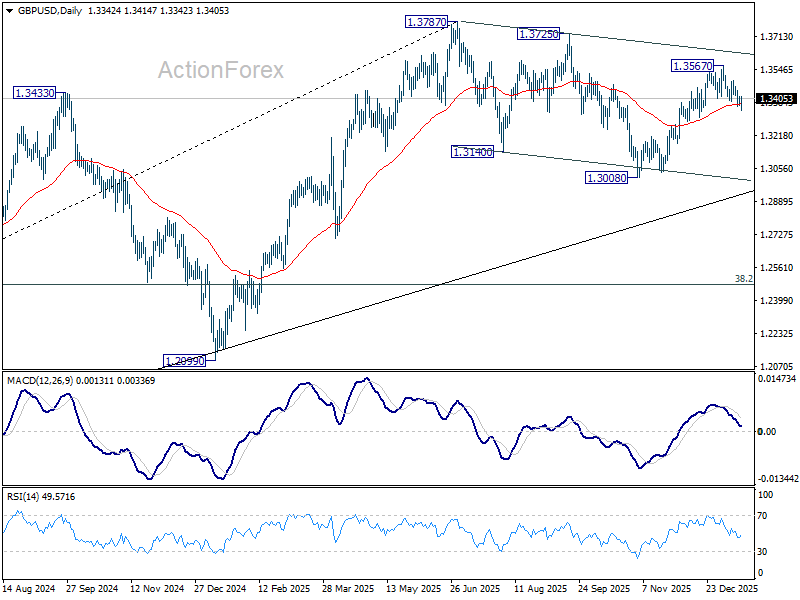
Intraday bias in GBP/USD stays mildly on the downside, as fall from 1.3567 is in progress. Sustained trading below 55 D EMA (now at 1.3375) will argue that the decline is another falling leg in the corrective pattern from 1.3787. In this case, deeper fall should be seen back to 1.3008 support. For now, risk will stay mildly on the downside as long as 1.3494 holds, in case of recovery.
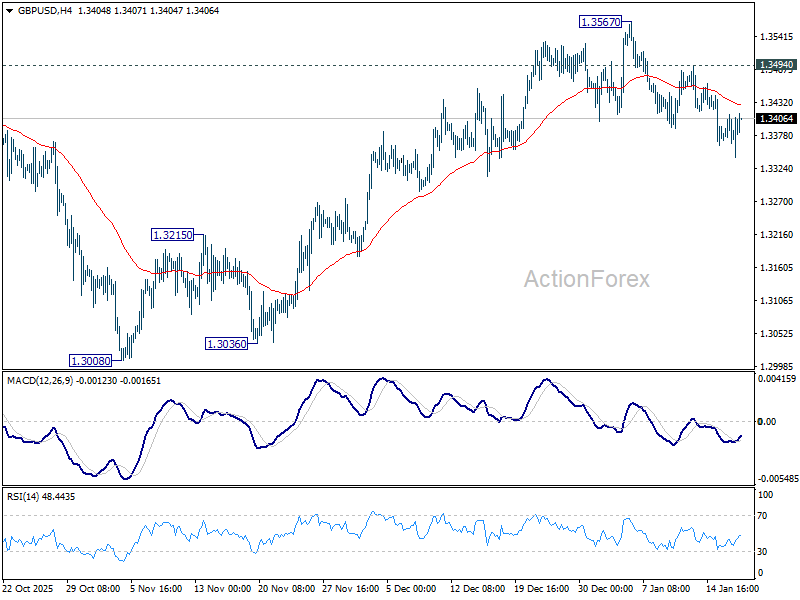
In the bigger picture, price actions from 1.3787 (2025 high) are seen as a correction to the larger up trend from 1.3051 (2022 low). Deeper decline could be seen as the pattern extends, but downside should be contained by 38.2% retracement of 1.0351 to 1.3787 at 1.2474 to bring rebound. Break of 1.3787 for up trend resumption is expected at a later stage.
USD/CHF Daily Outlook
Daily Pivots: (S1) 0.8011; (P) 0.8026; (R1) 0.8045; More….
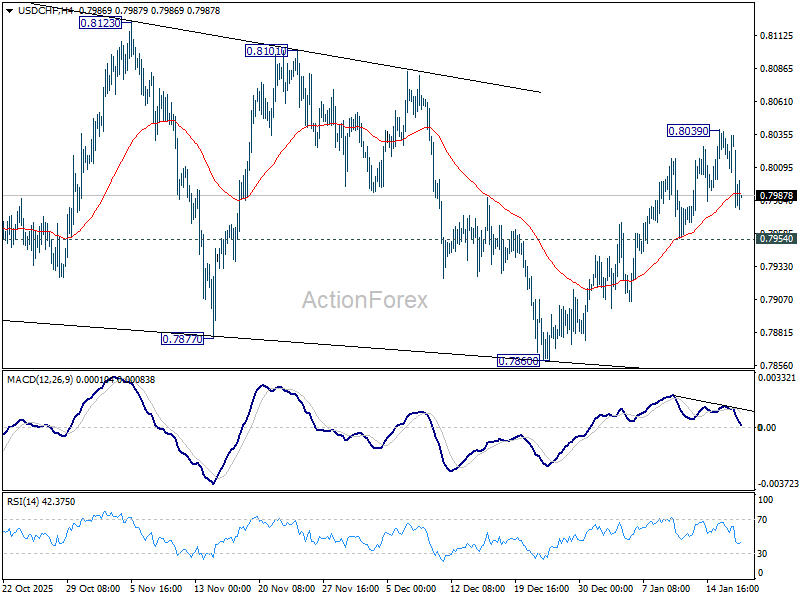
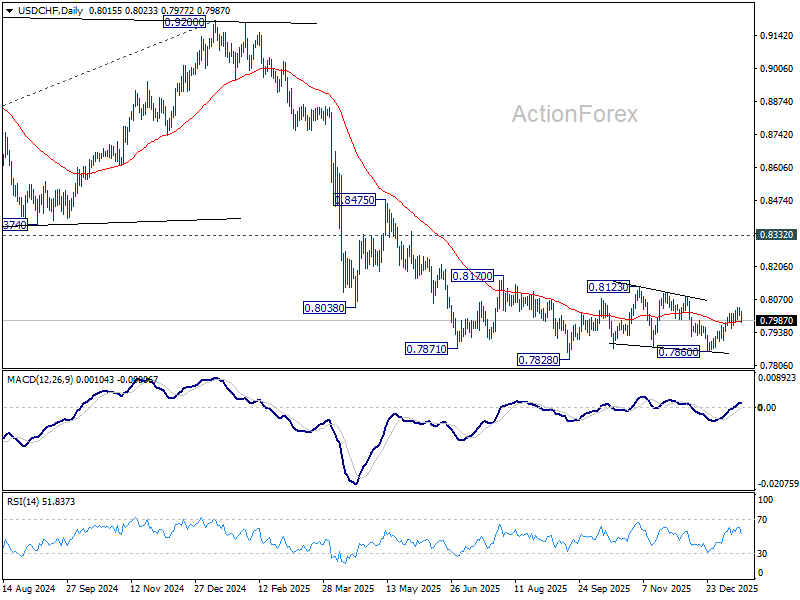
Intraday bias in USD/CHF is turned neutral again with current retreat. On the upside, break of 0.8039 will resume the rally from 0.7860 for 0.8123 resistance However, break of 0.7954 support will argue that the rebound has completed, and turn bias back to the downside for 0.7860. Overall, corrective pattern from 0.7828 is extending.
In the bigger picture, price actions from 0.7828 are seen as a correction. Larger down trend from 1.0342 (2017 high) is still in progress. Break of 0.7828 will target 100% projection of 1.0146 (2022 high) to 0.8332 from 0.9200 at 0.7382. In any case, outlook will stay bearish as long as 0.8332 support turned resistance holds (2023 low).
AUD/USD Daily Report
Daily Pivots: (S1) 0.6666; (P) 0.6687; (R1) 0.6704; More...
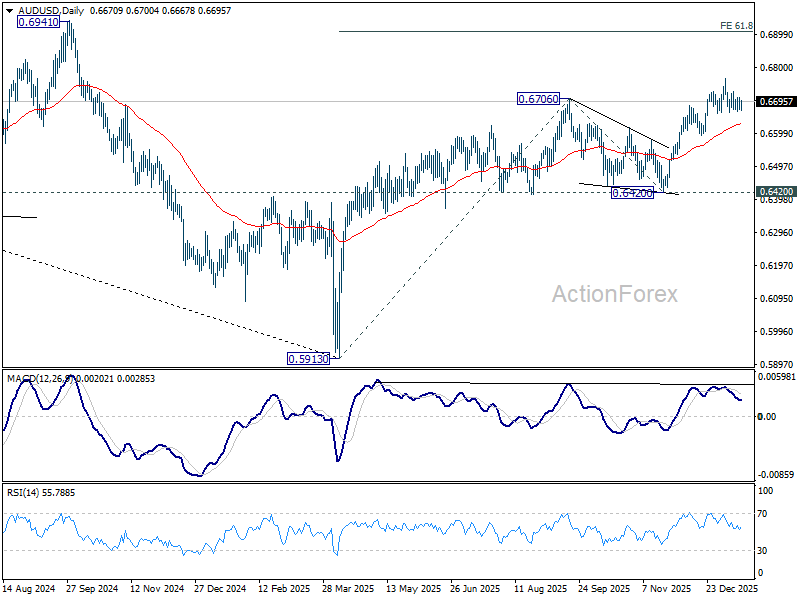
Intraday bias in AUD/USD remains neutral as sideway consolidations continues. Further rally is expected with 0.6659 support intact. On the upside, above 0.6765 will resume the whole rise from 0.5913 and target 61.8% projection of 0.5913 to 0.6706 from 0.6420 at 0.6910. However, considering bearish divergence condition in 4H MACD, firm break of 0.6659 will confirm short term topping, and bring deeper correction back to 55 D EMA (now at 0.6629) and below.
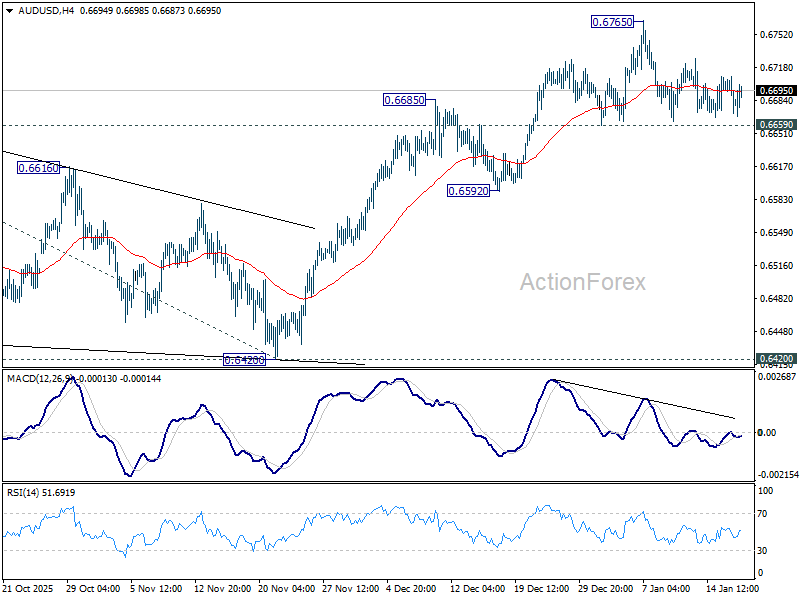
In the bigger picture, current development argues that rise from 0.5913 (2024 low) is reversing whole down trend from 0.8006 (2021 high). Further rally should be seen to 61.8% retracement of 0.8006 to 0.5913 at 0.7206. This will remain the favored case as long as 0.6420 support holds, even in case of deep pullback.
USD/CAD Daily Outlook
Daily Pivots: (S1) 1.3890; (P) 1.3910; (R1) 1.3935; More...
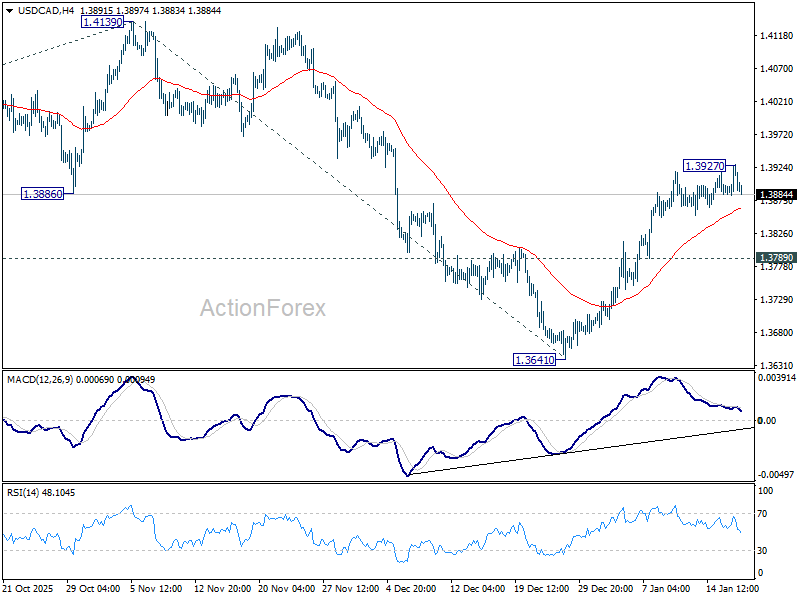
Intraday bias in USD/CAD is turned neutral with current retreat, and some consolidations would be seen below 1.3927 temporary top. Further rally is expected as long as 1.3789 support holds. Above 1.3927 will target 1.4139 first. Break there will target 100% projection of 1.3538 to 1.4139 from 1.3641 at 1.4242, as the third leg of the corrective pattern from 1.3538.
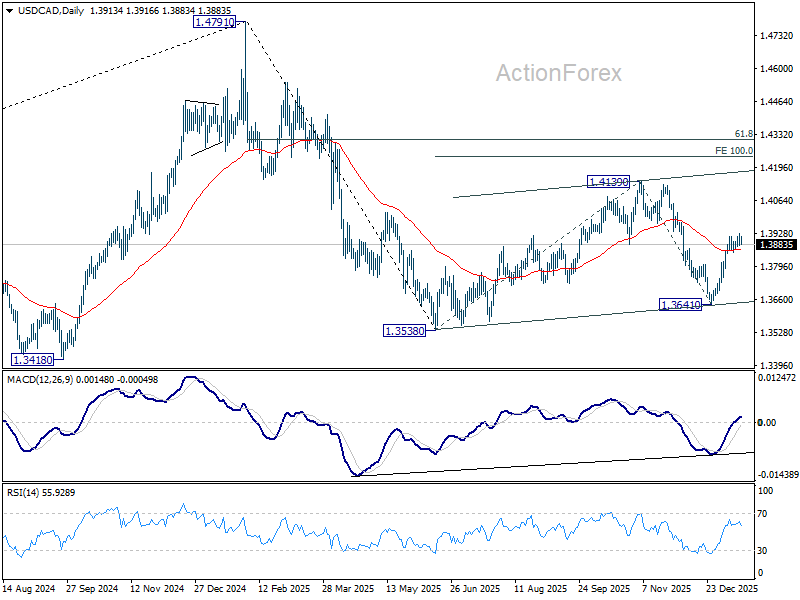
In the bigger picture, price actions from 1.4791 are seen as a corrective pattern to the whole up trend from 1.2005 (2021 low). Deeper fall could be seen as the pattern extends, and break of 1.3538 will target 61.8% retracement of 1.2005 to 1.4791 at 1.3069. For now, medium term outlook will be neutral until there are signs that the correction has completed.
GBP/JPY Daily Outlook
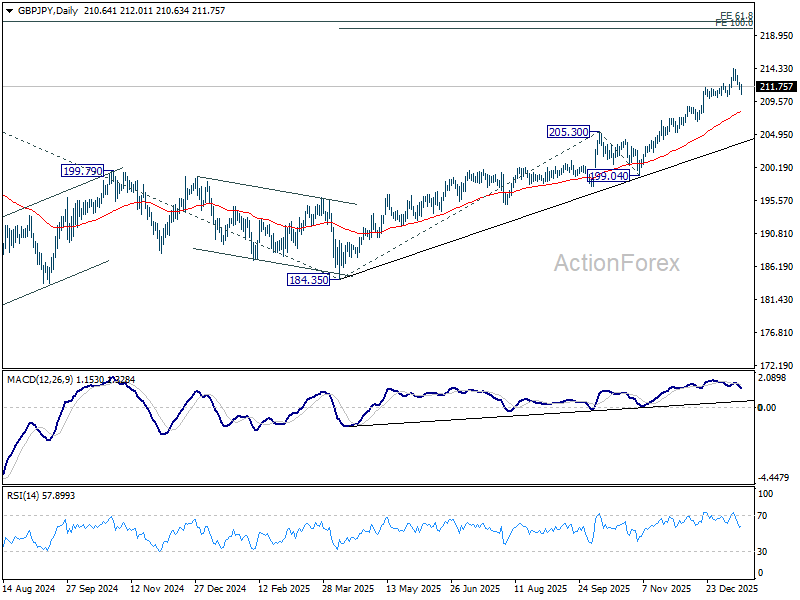
Daily Pivots: (S1) 211.14; (P) 211.73; (R1) 212.07; More...
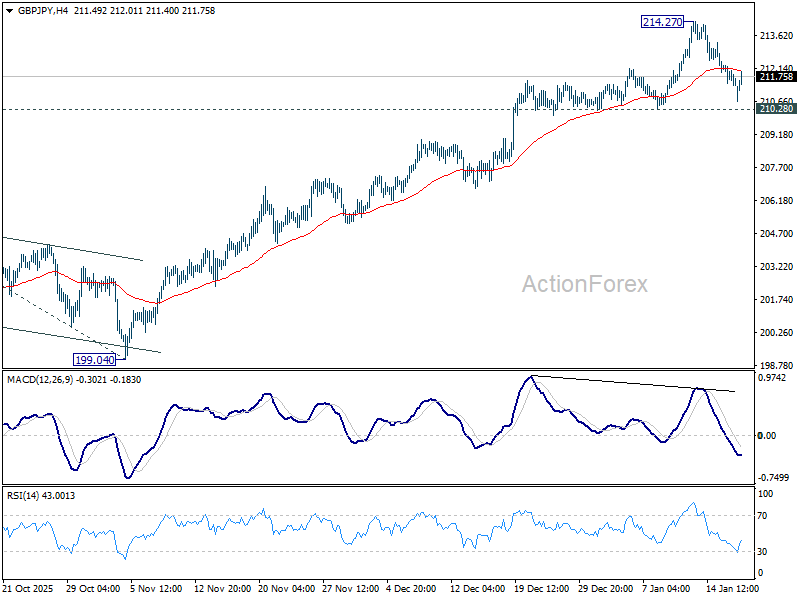
GBP/JPY recovered ahead of 210.28 support and intraday bias remains neutral. Further rise is still expected with 210.28 intact. Break of 214.27 will resume larger up trend to 100% projection of 184.35 to 205.30 from 199.04 at 219.99 next. Nevertheless, considering bearish divergence condition in 4H MACD, firm break of 210.28 will confirm short term topping, and turn bias to the downside for deeper pullback to 55 D EMA (now at 208.22).
In the bigger picture, up trend from 123.94 (2020 low) is in progress. Next target is 61.8% projection of 148.93 (2022 low) to 208.09 (2024 high) from 184.35 at 220.90. On the downside, break of 205.30 resistance turned support is needed to indicate medium term topping. Otherwise, outlook will stay bullish even in case of deep pullback.
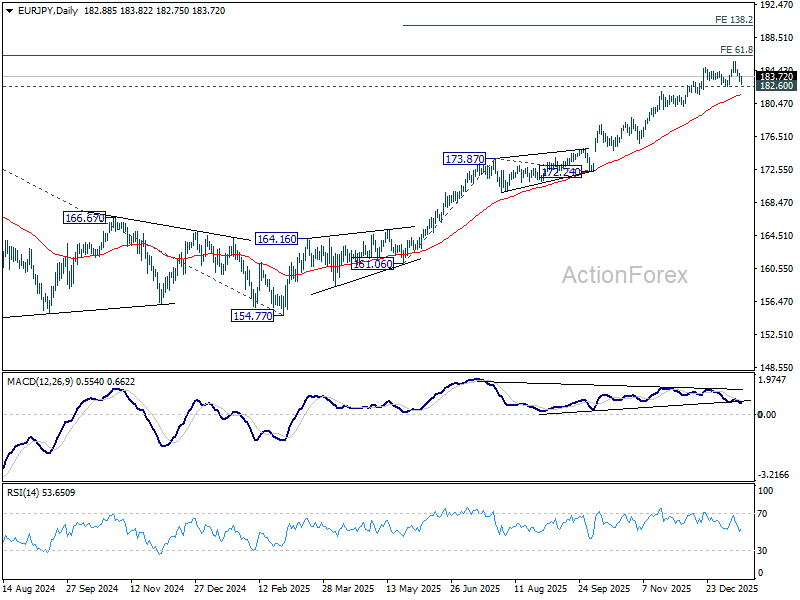
EUR/JPY Daily Outlook
Daily Pivots: (S1) 182.96; (P) 183.58; (R1) 183.97; More...
EUR/JPY recovered ahead of 182.60 support, and intraday bias remains neutral. Another rise is in favor as long as 182.60 support holds. Above 185.55 will target 186.31 projection level. However, considering bearish divergence condition in 4H MACD, firm break of 182.60 will confirm short term topping, and turn bias back to the downside for 55 D EMA (now at 181.57) and below.
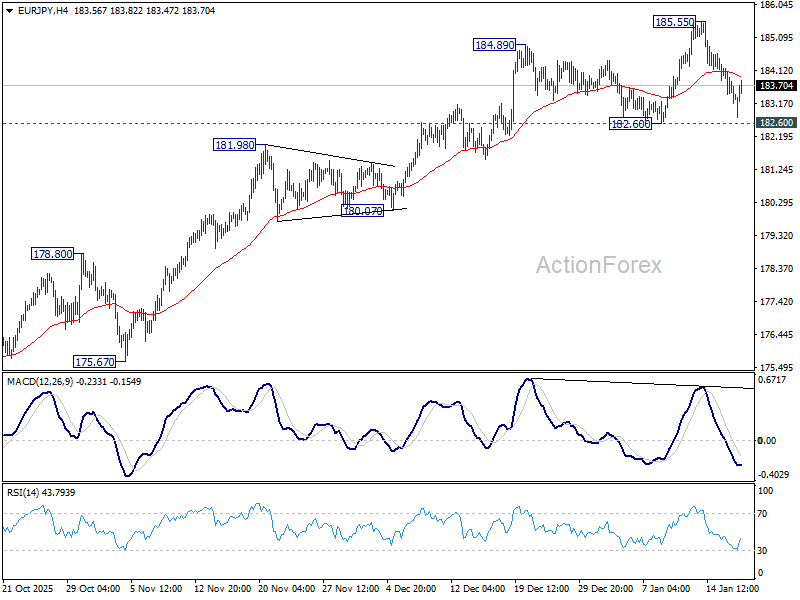
In the bigger picture, up trend from 114.42 (2020 low) is in progress and should target 61.8% projection of 124.37 to 175.41 from 154.77 at 186.31. Considering bearish divergence condition in D MACD, upside could be capped by 186.31 on first attempt. Still, outlook will stay bullish as long as 55 W EMA (now at 172.58) holds, even in case of deep pullback. Sustained break of 186.31 will pave the way to 78.6% projection at 194.88 next.