Sample Category Title
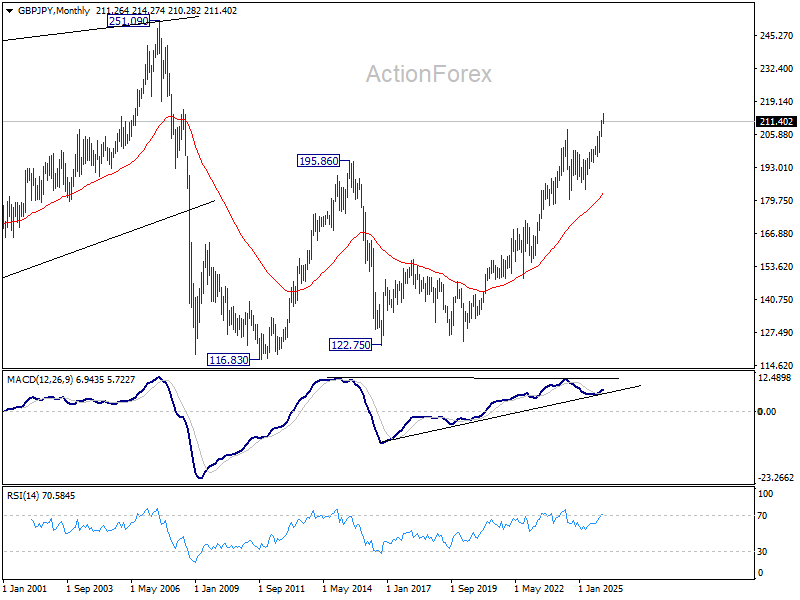
GBP/JPY Weekly Outlook
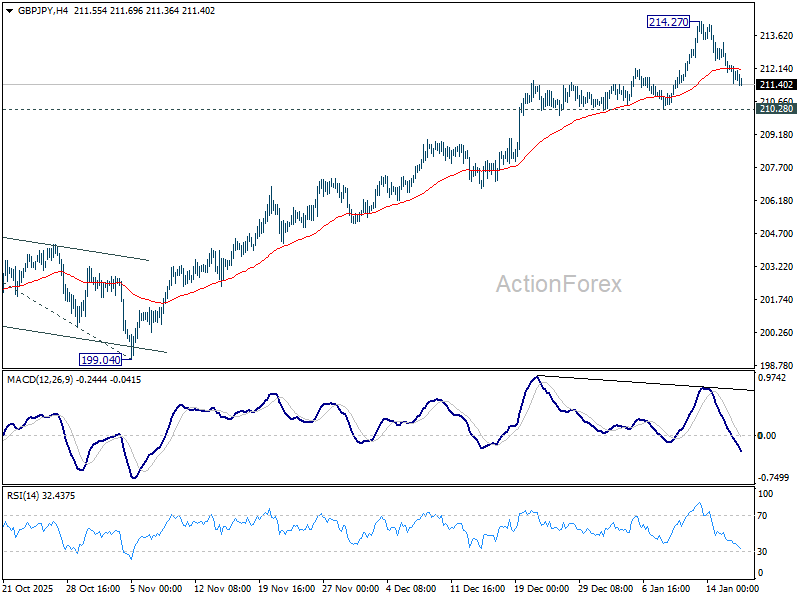
GBP/JPY edged higher to 214.27 last week but quickly retreated. Initial bias remains neutral this week and further rise is in favor. Break of 214.27 will resume larger up trend to 100% projection of 184.35 to 205.30 from 199.04 at 219.99 next. Nevertheless, considering bearish divergence condition in 4H MACD, firm break of 210.28 will confirm short term topping, and turn bias to the downside for deeper pullback to 55 D EMA (now at 207.97).
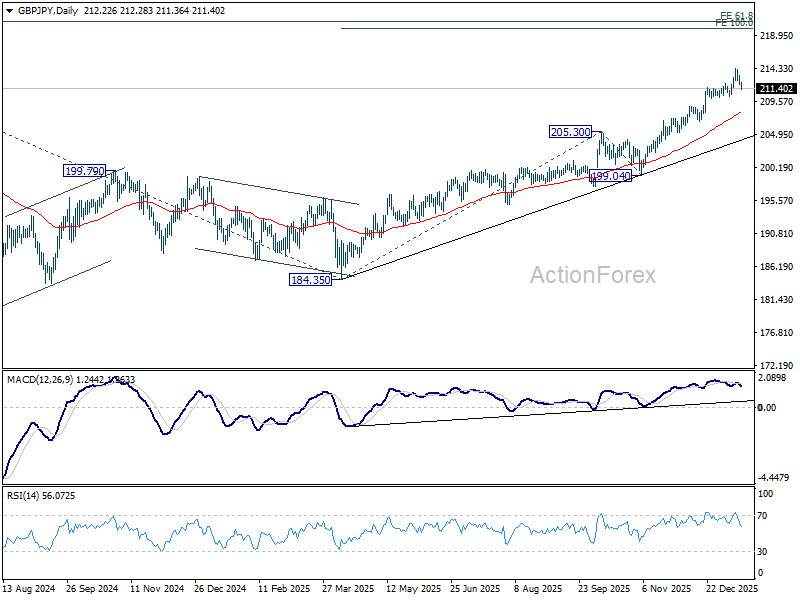
In the bigger picture, up trend from 123.94 (2020 low) is in progress. Next target is 61.8% projection of 148.93 (2022 low) to 208.09 (2024 high) from 184.35 at 220.90. On the downside, break of 205.30 resistance turned support is needed to indicate medium term topping. Otherwise, outlook will stay bullish even in case of deep pullback.
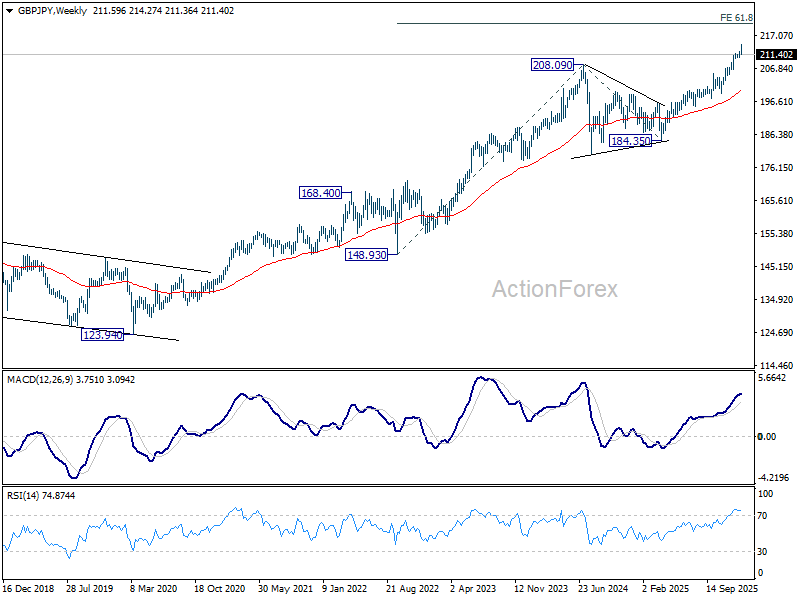
In the long term picture, up trend from 116.83 (2011 low) is resuming. Next target is 251.09 (2007 high). This will remain the favored case as long as 55 M EMA (now at 182.91) holds.
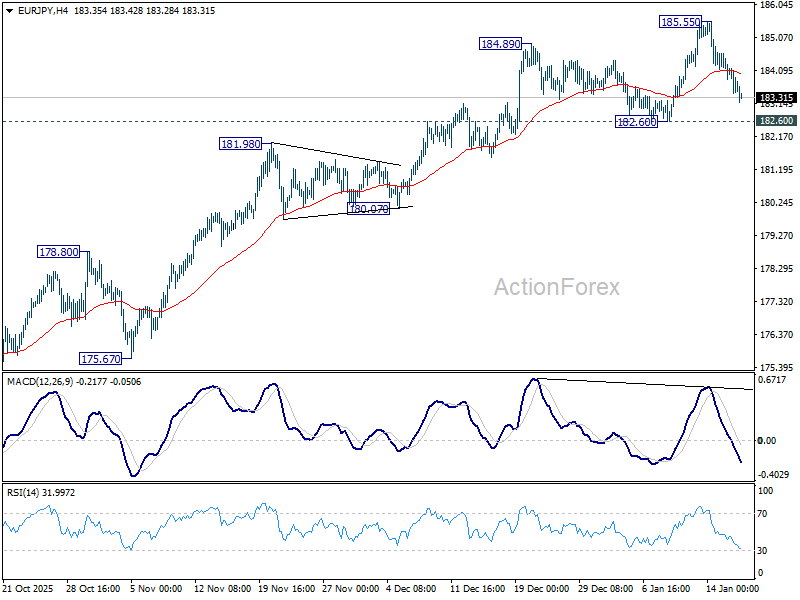
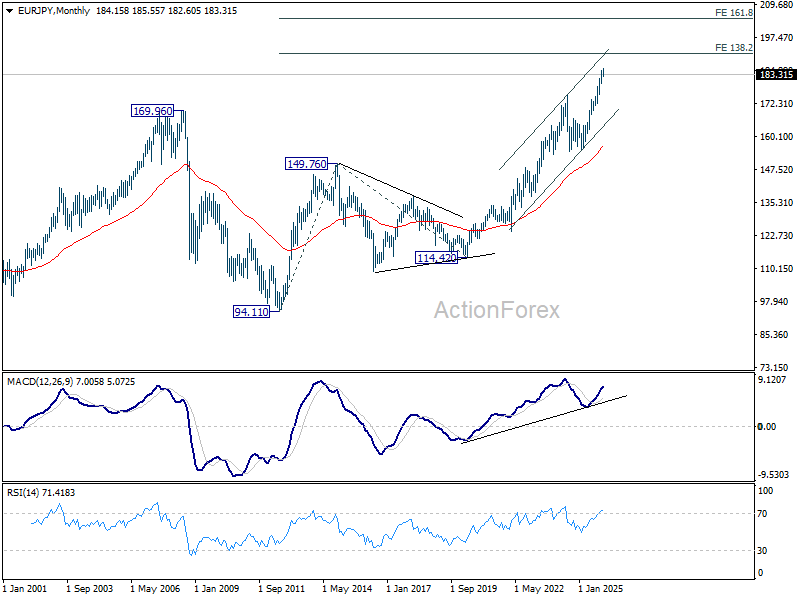
EUR/JPY Weekly Outlook
EUR/JPY edged higher to 185.55 last week but retreated steeply since then. Initial bias remains neutral this week and another rise is in favor as long as 182.60 support holds. Above 185.55 will target 186.31 projection level. However, considering bearish divergence condition in 4H MACD, firm break of 182.60 will confirm short term topping, and turn bias back to the downside for 55 D EMA (now at 181.49) and below.
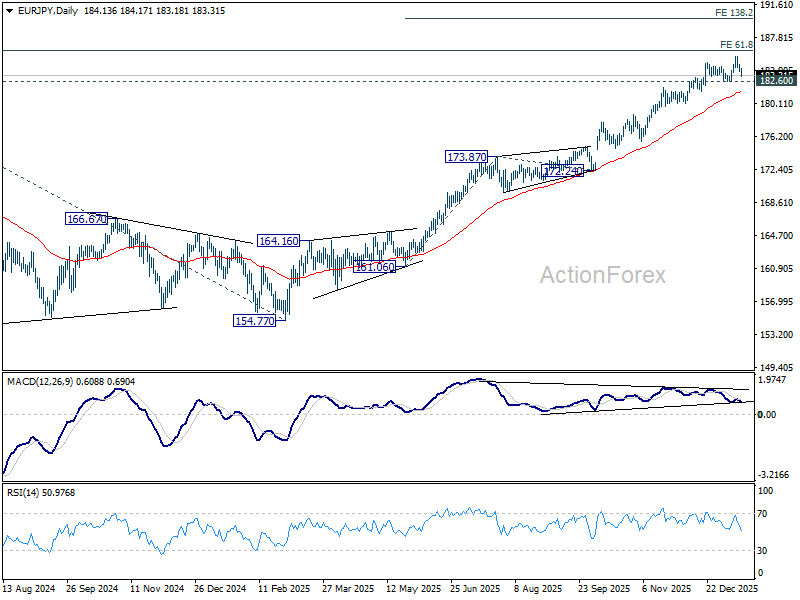
In the bigger picture, up trend from 114.42 (2020 low) is in progress and should target 61.8% projection of 124.37 to 175.41 from 154.77 at 186.31. Considering bearish divergence condition in D MACD, upside could be capped by 186.31 on first attempt. Still, outlook will stay bullish as long as 55 W EMA (now at 172.58) holds, even in case of deep pullback. Sustained break of 186.31 will pave the way to 78.6% projection at 194.88 next.
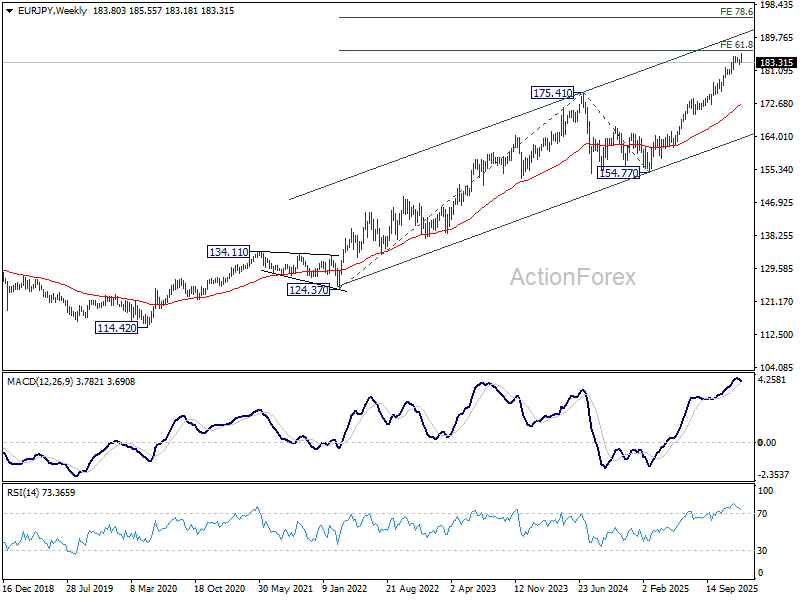
In the long term picture, up trend from 94.11 (2021 low) is in progress. Next target is 138.2% projection of 94.11 to 149.76 (2014 high) from 114.42 (2020 low) at 191.32. This will remain the favored case as long as 154.77 support holds.
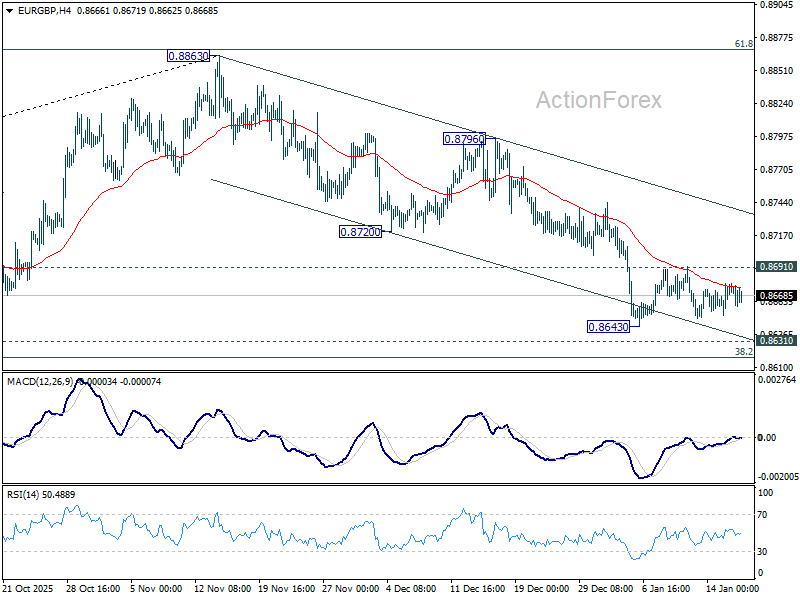
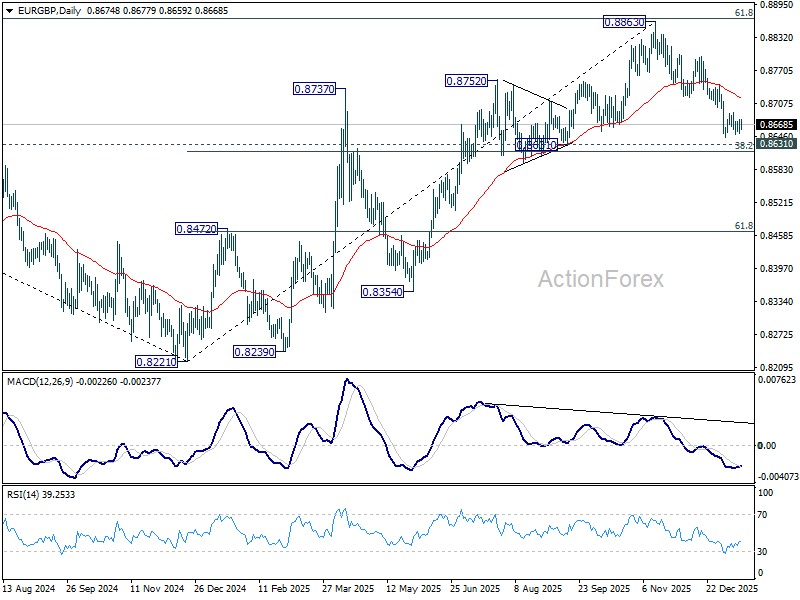
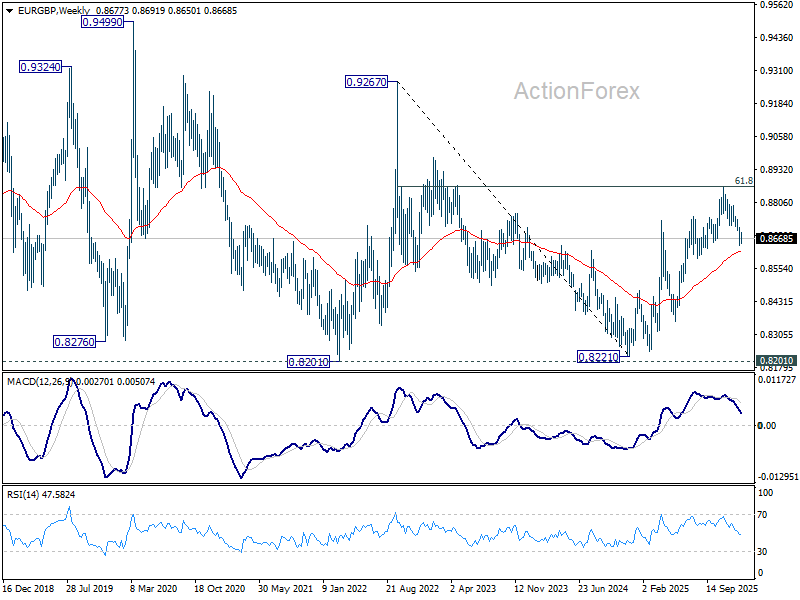
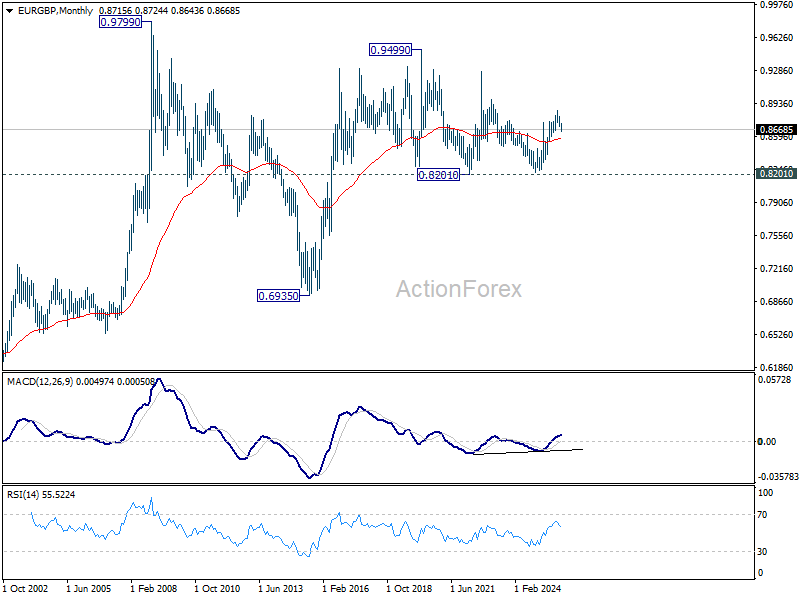
EUR/GBP Weekly Outlook
EUR/GBP stayed in range above 0.8643 last week. Initial bias remains neutral and further decline is in favor. . On the downside, decisive break of 0.8631 cluster support (38.2% retracement of 0.8221 to 0.8663 at 0.8618) will pave the way to 61.8% retracement at 0.8466. Nevertheless, break of 0.8691 resistance will turn bias to the upside, for stronger rebound to 55 D EMA (now at 0.8718) first.
In the bigger picture, rise from 0.8221 medium term bottom (2024 low) is seen as a corrective move. Upside should be limited by 61.8% retracement of 0.9267 to 0.8221 at 0.8867. Sustained trading below 55 W EMA (now at 0.8622) should confirm that this corrective bounce has completed. In this case, deeper fall would be seen back to 0.8201/21 key support zone. However, decisive break of 0.8867 will suggest that EUR/GBP is already reversing whole decline from 0.9267 (2022 high). That should pave the way back to 0.9267.
In the long term picture, price action from 0.9499 (2020 high) is seen as part of the long term range pattern from 0.9799 (2008 high). Range trading should continue between 0.8201 and 0.9499, until there is clear signal of imminent breakout.
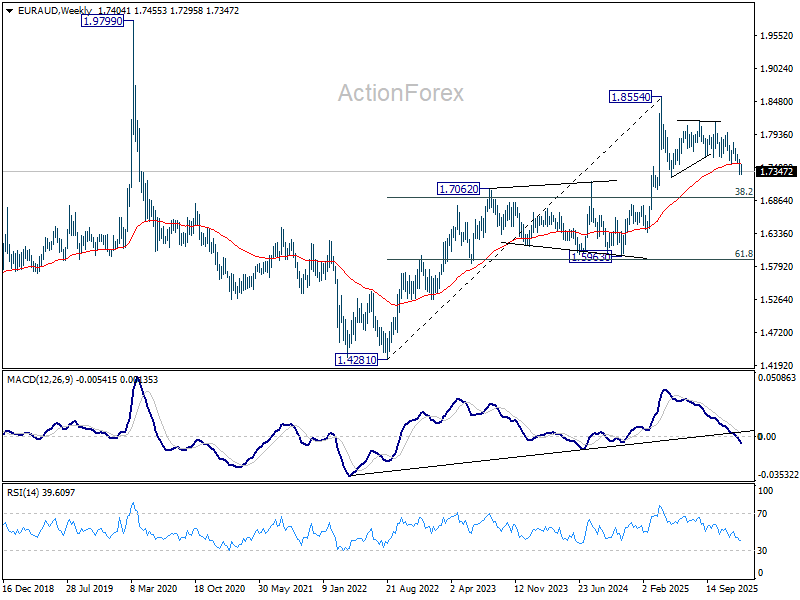
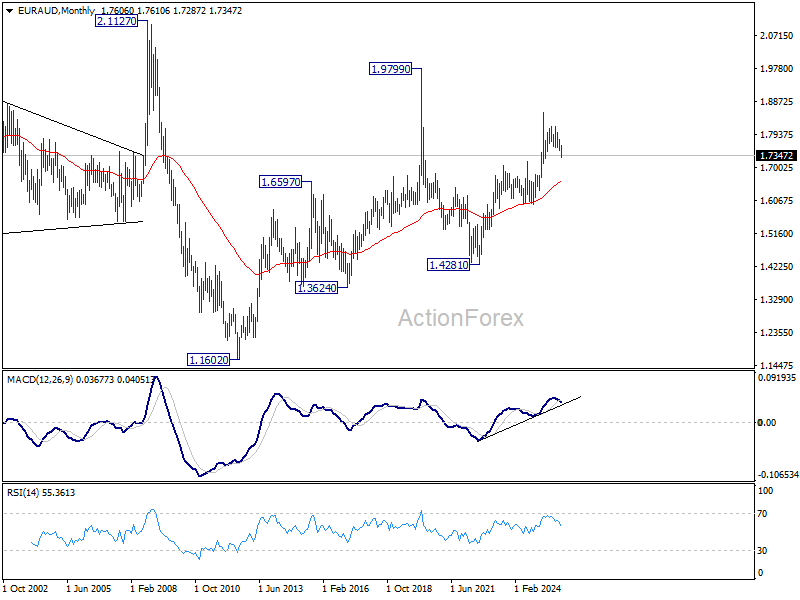
EUR/AUD Weekly Outlook
EUR/AUD stayed in range trading between 1.7287/7477 last week and outlook is unchanged. Initial bias remains neutral this week first, and further decline is in favor. On the downside, break of 1.7287 will resume the fall from 1.8160. As this is seen as the third leg of the corrective pattern from 1.8554, deeper fall should be seen to 1.7245 support and below. Nevertheless, firm break of 1.7477 will indicate short term bottoming, and bring stronger rebound back to 55 D EMA (now at 1.7593).
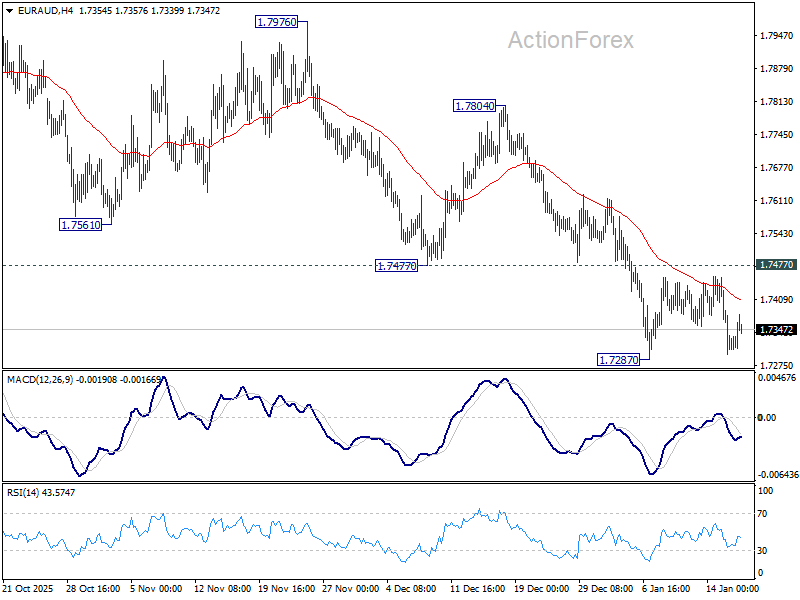
In the bigger picture, the break of 55 W EMA (now at 1.7464) argues that fall from 1.8554 medium term top is correcting whole up trend from 1.4281 (2022 low). Deeper decline is in favor to 38.2% retracement of 1.4281 to 1.8554 at 1.6922, and possibly below. Risk will stay on the downside as long as 1.8160 resistance holds, in case of strong rebound.
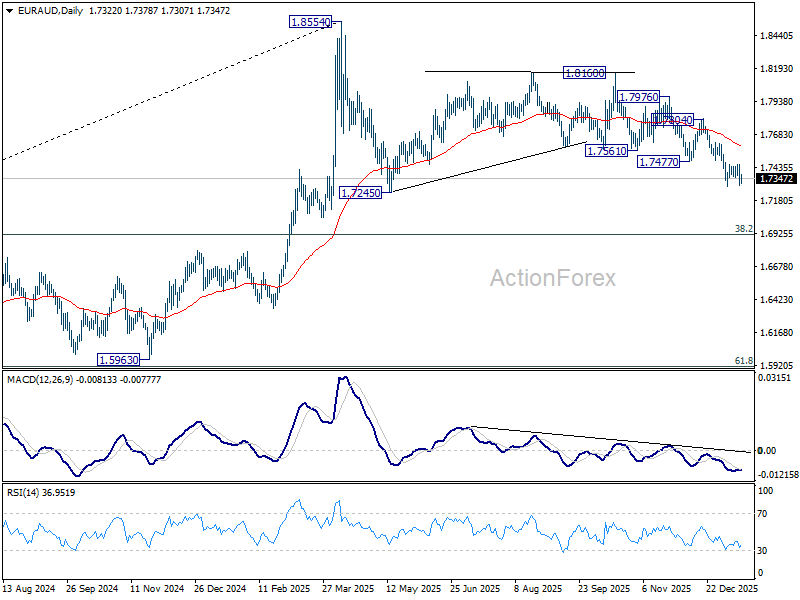
In the longer term picture, rise from 1.4281 is seen as the second leg of the pattern from 1.9799 (2020 high), which is part of the pattern from 2.1127 (2008 high). As long as 55 M EMA (now at 1.6610) holds, this second leg could still extend higher.
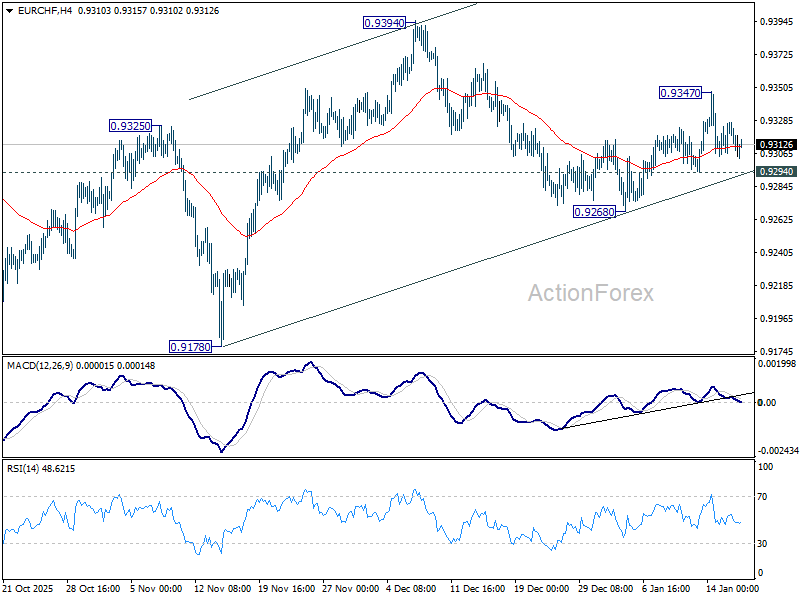
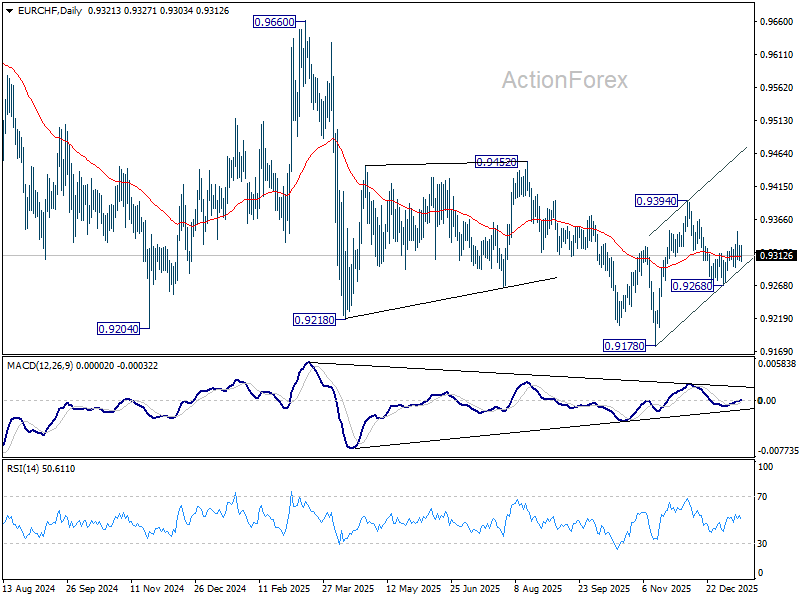
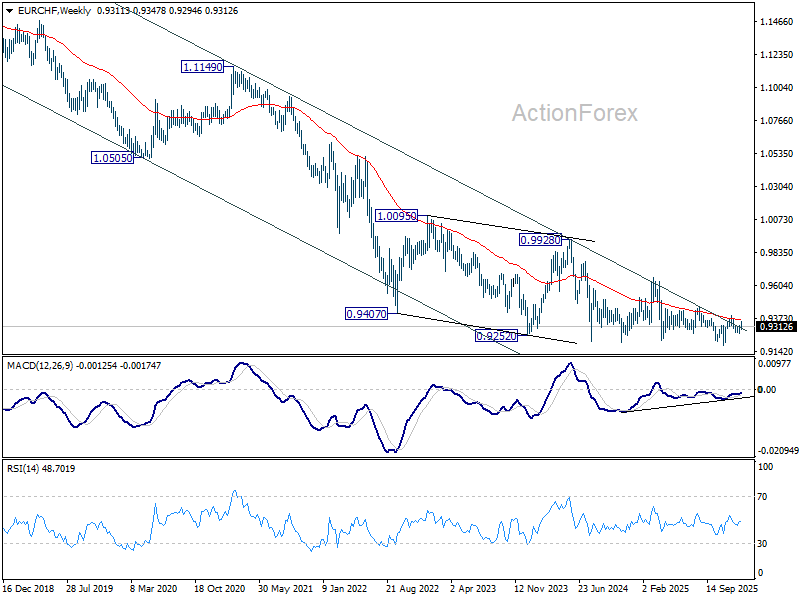
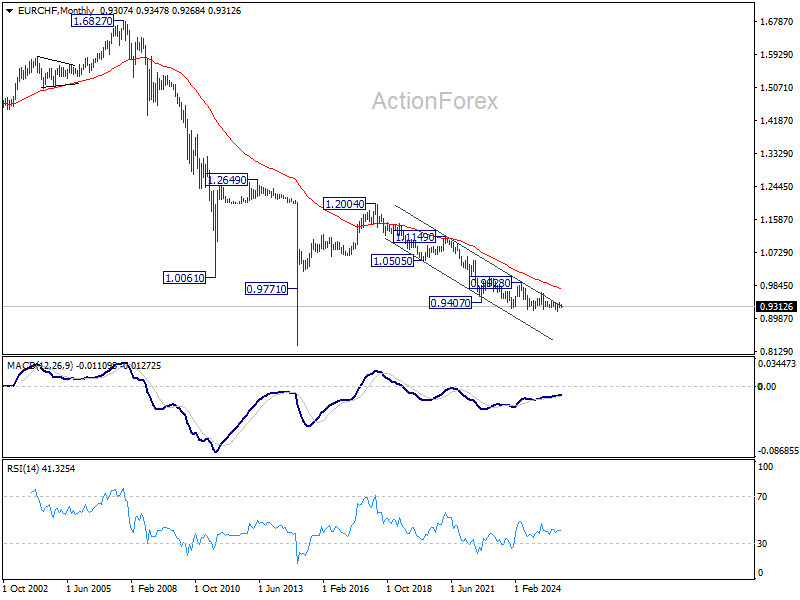
EUR/CHF Weekly Outlook
EUR/CHF gyrated higher to 0.9347 last week but quickly retreated. Initial bias stays neutral this week first. For now, price actions from 0.9178 short term bottom are tentatively seen as a corrective pattern. On the downside, below 0.9268 will bring retest of 0.9178 low. On the upside, above 0.9347 will bring stronger rebound towards 0.9394 resistance.
In the bigger picture, persistent bullish convergence condition in W MACD is a medium term bullish sign. Firm break of 0.9394 resistance should bring sustained trading above 55 W EMA (now at 0.9360). That should indicate medium term bottoming at 0.9178. Further break of 0.9452 resistance will bring stronger medium term rally towards 0.9928 resistance next, even still as a corrective bounce. Nevertheless, rejection by 55 W EMA will retain bearishness for another fall through 0.9178 at a later stage.
In the long term picture, overall long term down trend from 1.2004 (2018 high) is still in progress. Outlook will continue to stay bearish as long as falling 55 M EMA (now at 0.9766) holds.
Markets enter Tension-Mode – Markets Weekly Outlook
- Discover our Weekly Market Outlook, exploring themes and events that forged financial flows throughout the week.
- This week was forged by volatility amid growing political and geopolitical pressures.
- Get ready for next week's action by exploring upcoming events across global Markets.
Week in review – Geopolitical turmoil pursues
The week opened on a nasty surprise:
Donald Trump attempted another attack on Jerome Powell, starting an investigation through the Department of Justice against the Federal Reserve Chair.
Jerome Powell quickly responded in an unusual address (for an unusual issue), published on Sunday evening.
Fortunately, the effect was not long-lasting for the Stock Markets, as reactions to defend the Head of the Central Bank were widespread, spanning from bankers around the world to Republican officials lifting shields against attacks that were going too far.
This naturally led to a massive rebound before the CPI data (after a prior drop in the overnight futures session) – And the Market was proven right.
- First, it seems this investigation will not go very far, given the Senate's heavy backing of the Fed Chair.
- Second, the CPI, which followed on Tuesday, did not surprise to the upside and even led to a positive surprise on the Year-over-year Core CPI measure (at 2.6% ~ still high but far from scary.)
- Third, the event might provide even more reasons for Jerome Powell to remain at the Fed as Governor after his term (as Chair) expires in May.
His term as Governor could extend for two more years, and with the resilience he has shown amid these attacks, it wouldn't be surprising to see him stand as an independent voice in an ever-more politicized Federal Reserve.
The issue is that other elements that had been looming over Markets since the end of December have disrupted the positive sentiment.
Revolts in Iran are continuing, and as the President pledged to fight injustices around the world, he threatened the Regime to intervene, which added further investor angst.
There is an estimated and very tragic +12,000 casualties from brutal repressions from the IRGC and Basij forces.
Oil added a substantial premium, reflecting a larger risk premium, rising 10% from the past week to $62.
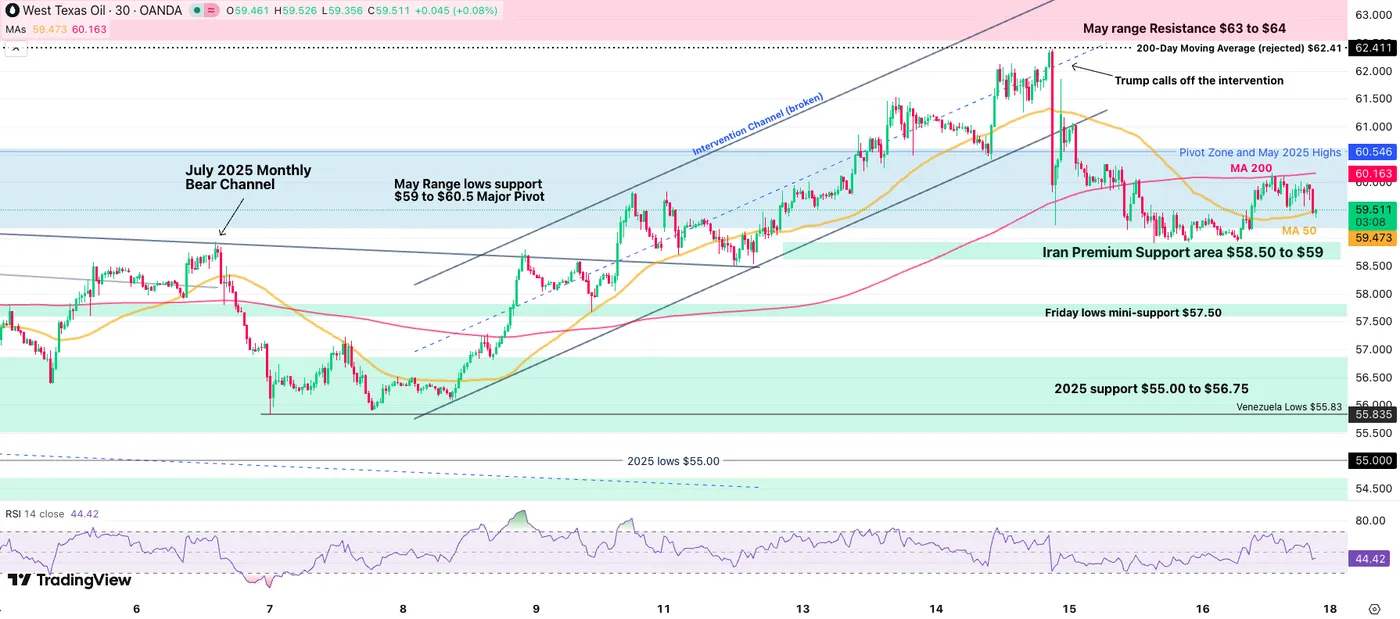
30M WTI Oil Chart, January 16, 2025 – Source: TradingView
Stock Indexes, on the other hand, suffered strong drops but rallied back as the President called off the intervention, saying "the killing has stopped" in Iran.
Oil also corrected back sharply to the low $59 – A risk premium remains in the Market, albeit not a huge one (I invite you to discover why with our in-depth Oil Analysis).
With the U.S.S. Abraham Lincoln, a massive American warship heading to the Middle East, this story could not be entirely over. So keep a close eye on these developments throughout next week.
Weekly Performance across Asset Classes
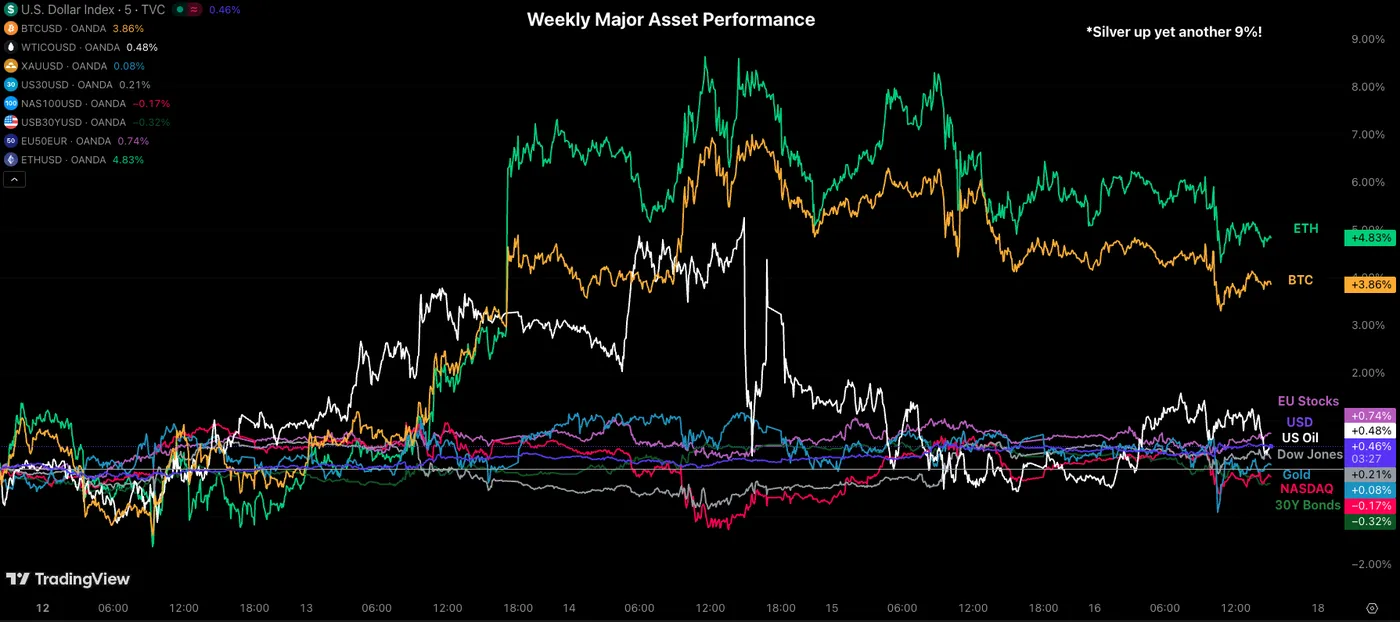
Weekly Asset Performance – January 16, 2026 – Source: TradingView
You can see how volatile this week was, particularly on Wednesday as intervention fears peaked.
The surprising winners here were Cryptocurrencies which had been waiting for catalysts to rise again after staying dormant for couple months.
Silver also reached some new all-time highs to $96! And despite its fall in today's session, concludes the week up 9%. But this is not surprising anymore.
Keep an eye on weakness in the Metals market as the trade reaches a key inflexion point.
For the rest, you can see how confused Investors are for traditional assets, closing the week largely unchanged for the most part (even Oil after a tumultuous week).
The Week Ahead – Davos, Inflation Week and Elevated Spirits
Asia Pacific Markets – Chinese GDP and Bank of Japan
After a massive Chinese Trade Data release, beating their record exports (to $1.2T) despite US tariffs, Investors will be watching closely for the Chinese GDP data, where yearly measures will be published. The release is planned for Sunday evening.
This will also be followed by the PBoC Rate Decision on Monday.
Antipodean releases will also add more complexity to next week's action (as US data is largely absent).
For Australia, traders will await the Inflation Gauge data, Employment Data, and PMIs from Sunday to Thursday.
New Zealand will release key Business Performance data on Monday, followed by its own CPI data on Thursday afternoon.
But the most significant event for APAC trading will surely be the Bank of Japan Rate Decision on Thursday Evening (between 19:00 and 21:00, with no fixed release time per tradition).
No hike is expected for this meeting (Currently about 2 more hikes priced in for the year) – But harsh communications are awaited to defend the Yen as the BoJ gets increasingly frustrated from Inflation coming from their weakening currency.
Failing to communicate would surely rub salt in the wound.
Of course, keep an option for a surprise hike.
Europe and UK Markets – Davos Meeting in Switzerland and CPI
This week will see some high-tier economic events, starting on Monday with the Davos World Economic Forum, where Central Bank heads, Presidents and Bankers exchange opinions on a yearly basis.
Expect tons of Central Bank speeches.
The UK will finally release their Employment Data on the Monday-to-Tuesday night trading (at 2:00 A.M).
The Unemployment Rate is expected to correct to 5% with unofficial forecasts for a -25K release.
*I mistakenly said the UK Jobs data was supposed to be released this week in our past week Weekly Outlook. Pardon me for that if you may.
For the Eurozone, expect CPI data on Monday at 5:00 A.M, PPI data for Germany, and many PMI figures on Thursday.
North American Markets – Canadian CPI and US GDP Figures
The week will be much thinner for North American Markets, concentrated around the end of the week.
The exception will be for Canada which releases their Inflation data on Monday (8:30 A.M) which could either cement odds of a 2026 hike or push them away.
If you just look at expectations, that hike won't go too far – The consensus for the Headline data is at -0.4%!
Except for the Weekly ADP Employment report, there won't be much until Thursday.
American data will release GDP data expected to remain very high (4.3% annualized), combined with the Core PCE release at 10:00 A.M. the same day.
Friday should also be packed for NA Traders, with Canadian Retail Sales, Global PMI data and Michigan Consumer Sentiment spanning the entire morning session.
The Fed also enters its pre-FOMC Blackout Period (The meeting is on January 28, no rate cuts expected).
Finally, keep your notifications on for the geopolitical scene: Iran developments should continue to impact Oil and Global markets.
Next Week's High Tier Economic Events
For all market-moving economic releases and events, see the MarketPulse Economic Calendar. (High-tier data only)
Safe Trades and enjoy your weekend!
Summary 1/19 – 1/23
Monday, Jan 19, 2026
| GMT | Ccy | Events | Cons | Prev |
|---|---|---|---|---|
| 23:50 | JPY | Machinery Orders M/M Nov | -5.10% | 7.00% |
| 00:00 | AUD | TD-MI Inflation Gauge M/M Dec | 0.30% | |
| 02:00 | CNY | GDP Y/Y Q4 | 4.50% | 4.80% |
| 02:00 | CNY | Industrial Production Y/Y Dec | 5.00% | 4.80% |
| 02:00 | CNY | Retail Sales Y/Y Dec | 1.20% | 1.30% |
| 02:00 | CNY | Fixed Asset Investment YTD Y/Y Dec | -3.00% | -2.60% |
| 04:30 | JPY | Tertiary Industry Index M/M Nov | 0.00% | 0.90% |
| 04:30 | JPY | Industrial Production M/M Nov F | -2.60% | -2.60% |
| 10:00 | EUR | Eurozone CPI Y/Y Dec F | 2.00% | 2.00% |
| 10:00 | EUR | Eurozone Core CPI Y/Y Dec F | 2.30% | 2.30% |
| 13:30 | CAD | CPI M/M Dec | -0.40% | 0.10% |
| 13:30 | CAD | CPI Y/Y Dec | 2.20% | 2.20% |
| 13:30 | CAD | CPI Median Y/Y Dec | 2.80% | 2.80% |
| 13:30 | CAD | CPI Trimmed Y/Y Dec | 2.80% | 2.80% |
| 13:30 | CAD | CPI Common Y/Y Dec | 2.80% | 2.80% |
| 15:30 | CAD | BoC Business Outlook Survey |
| 23:50 | JPY |
| Machinery Orders M/M Nov | |
| Consensus | -5.10% |
| Previous | 7.00% |
| 00:00 | AUD |
| TD-MI Inflation Gauge M/M Dec | |
| Consensus | |
| Previous | 0.30% |
| 02:00 | CNY |
| GDP Y/Y Q4 | |
| Consensus | 4.50% |
| Previous | 4.80% |
| 02:00 | CNY |
| Industrial Production Y/Y Dec | |
| Consensus | 5.00% |
| Previous | 4.80% |
| 02:00 | CNY |
| Retail Sales Y/Y Dec | |
| Consensus | 1.20% |
| Previous | 1.30% |
| 02:00 | CNY |
| Fixed Asset Investment YTD Y/Y Dec | |
| Consensus | -3.00% |
| Previous | -2.60% |
| 04:30 | JPY |
| Tertiary Industry Index M/M Nov | |
| Consensus | 0.00% |
| Previous | 0.90% |
| 04:30 | JPY |
| Industrial Production M/M Nov F | |
| Consensus | -2.60% |
| Previous | -2.60% |
| 10:00 | EUR |
| Eurozone CPI Y/Y Dec F | |
| Consensus | 2.00% |
| Previous | 2.00% |
| 10:00 | EUR |
| Eurozone Core CPI Y/Y Dec F | |
| Consensus | 2.30% |
| Previous | 2.30% |
| 13:30 | CAD |
| CPI M/M Dec | |
| Consensus | -0.40% |
| Previous | 0.10% |
| 13:30 | CAD |
| CPI Y/Y Dec | |
| Consensus | 2.20% |
| Previous | 2.20% |
| 13:30 | CAD |
| CPI Median Y/Y Dec | |
| Consensus | 2.80% |
| Previous | 2.80% |
| 13:30 | CAD |
| CPI Trimmed Y/Y Dec | |
| Consensus | 2.80% |
| Previous | 2.80% |
| 13:30 | CAD |
| CPI Common Y/Y Dec | |
| Consensus | 2.80% |
| Previous | 2.80% |
| 15:30 | CAD |
| BoC Business Outlook Survey | |
| Consensus | |
| Previous | |
Tuesday, Jan 20, 2026
| GMT | Ccy | Events | Cons | Prev |
|---|---|---|---|---|
| 21:30 | NZD | Business NZ PSI Dec | 46.9 | |
| 01:00 | CNY | 1-Y Loan Prime Rate | 3.00% | 3.00% |
| 01:00 | CNY | 5-Y Loan Prime Rate | 3.50% | 3.50% |
| 07:00 | EUR | Germany PPI M/M Dec | -0.10% | 0% |
| 07:00 | EUR | Germany PPI Y/Y Dec | -2.40% | -2.30% |
| 07:00 | GBP | Claimant Count Change Dec | 15.6K | 20.1K |
| 07:00 | GBP | ILO Unemployment Rate (3M) Nov | 5.10% | 5.10% |
| 07:00 | GBP | Average Earnings Including Bonus 3M/Y Nov | 4.60% | 4.70% |
| 07:00 | GBP | Average Earnings Excluding Bonus 3M/Y Nov | 4.50% | 4.60% |
| 07:30 | CHF | PPI M/M Dec | 0.20% | -0.50% |
| 07:30 | CHF | PPI Y/Y Dec | -1.60% | |
| 09:00 | EUR | Eurozone Current Account (EUR) Nov | 20.3B | 25.7B |
| 10:00 | EUR | Germany ZEW Economic Sentiment Jan | 49.6 | 45.8 |
| 10:00 | EUR | Germany ZEW Current Situation Jan | -75.5 | -81 |
| 10:00 | EUR | Eurozone ZEW Economic Sentiment Jan | 35.2 | 33.7 |
| 21:30 | NZD |
| Business NZ PSI Dec | |
| Consensus | |
| Previous | 46.9 |
| 01:00 | CNY |
| 1-Y Loan Prime Rate | |
| Consensus | 3.00% |
| Previous | 3.00% |
| 01:00 | CNY |
| 5-Y Loan Prime Rate | |
| Consensus | 3.50% |
| Previous | 3.50% |
| 07:00 | EUR |
| Germany PPI M/M Dec | |
| Consensus | -0.10% |
| Previous | 0% |
| 07:00 | EUR |
| Germany PPI Y/Y Dec | |
| Consensus | -2.40% |
| Previous | -2.30% |
| 07:00 | GBP |
| Claimant Count Change Dec | |
| Consensus | 15.6K |
| Previous | 20.1K |
| 07:00 | GBP |
| ILO Unemployment Rate (3M) Nov | |
| Consensus | 5.10% |
| Previous | 5.10% |
| 07:00 | GBP |
| Average Earnings Including Bonus 3M/Y Nov | |
| Consensus | 4.60% |
| Previous | 4.70% |
| 07:00 | GBP |
| Average Earnings Excluding Bonus 3M/Y Nov | |
| Consensus | 4.50% |
| Previous | 4.60% |
| 07:30 | CHF |
| PPI M/M Dec | |
| Consensus | 0.20% |
| Previous | -0.50% |
| 07:30 | CHF |
| PPI Y/Y Dec | |
| Consensus | |
| Previous | -1.60% |
| 09:00 | EUR |
| Eurozone Current Account (EUR) Nov | |
| Consensus | 20.3B |
| Previous | 25.7B |
| 10:00 | EUR |
| Germany ZEW Economic Sentiment Jan | |
| Consensus | 49.6 |
| Previous | 45.8 |
| 10:00 | EUR |
| Germany ZEW Current Situation Jan | |
| Consensus | -75.5 |
| Previous | -81 |
| 10:00 | EUR |
| Eurozone ZEW Economic Sentiment Jan | |
| Consensus | 35.2 |
| Previous | 33.7 |
Wednesday, Jan 21, 2026
| GMT | Ccy | Events | Cons | Prev |
|---|---|---|---|---|
| 07:00 | GBP | CPI M/M Dec | 0.40% | -0.20% |
| 07:00 | GBP | CPI Y/Y Dec | 3.30% | 3.20% |
| 07:00 | GBP | Core CPI Y/Y Dec | 3.30% | 3.20% |
| 07:00 | GBP | RPI M/M Dec | 0.50% | -0.40% |
| 07:00 | GBP | RPI Y/Y Dec | 4.10% | 3.80% |
| 07:00 | GBP | PPI Input M/M Dec | -0.10% | 0.30% |
| 07:00 | GBP | PPI Input Y/Y Dec | 1.10% | |
| 07:00 | GBP | PPI Output M/M Dec | 0.10% | 0.10% |
| 07:00 | GBP | PPI Output Y/Y Dec | 3.40% | |
| 07:00 | GBP | PPI Core Output M/M Dec | 0.00% | |
| 07:00 | GBP | PPI Core Output Y/Y Dec | 3.50% | |
| 13:30 | CAD | Industrial Product Price M/M Dec | 0.30% | 0.90% |
| 13:30 | CAD | Raw Material Price Index Dec | -0.50% | 0.30% |
| 15:00 | USD | Pending Homeles M/M Dec | -0.30% | 3.30% |
| 07:00 | GBP |
| CPI M/M Dec | |
| Consensus | 0.40% |
| Previous | -0.20% |
| 07:00 | GBP |
| CPI Y/Y Dec | |
| Consensus | 3.30% |
| Previous | 3.20% |
| 07:00 | GBP |
| Core CPI Y/Y Dec | |
| Consensus | 3.30% |
| Previous | 3.20% |
| 07:00 | GBP |
| RPI M/M Dec | |
| Consensus | 0.50% |
| Previous | -0.40% |
| 07:00 | GBP |
| RPI Y/Y Dec | |
| Consensus | 4.10% |
| Previous | 3.80% |
| 07:00 | GBP |
| PPI Input M/M Dec | |
| Consensus | -0.10% |
| Previous | 0.30% |
| 07:00 | GBP |
| PPI Input Y/Y Dec | |
| Consensus | |
| Previous | 1.10% |
| 07:00 | GBP |
| PPI Output M/M Dec | |
| Consensus | 0.10% |
| Previous | 0.10% |
| 07:00 | GBP |
| PPI Output Y/Y Dec | |
| Consensus | |
| Previous | 3.40% |
| 07:00 | GBP |
| PPI Core Output M/M Dec | |
| Consensus | |
| Previous | 0.00% |
| 07:00 | GBP |
| PPI Core Output Y/Y Dec | |
| Consensus | |
| Previous | 3.50% |
| 13:30 | CAD |
| Industrial Product Price M/M Dec | |
| Consensus | 0.30% |
| Previous | 0.90% |
| 13:30 | CAD |
| Raw Material Price Index Dec | |
| Consensus | -0.50% |
| Previous | 0.30% |
| 15:00 | USD |
| Pending Homeles M/M Dec | |
| Consensus | -0.30% |
| Previous | 3.30% |
Thursday, Jan 22, 2026
| GMT | Ccy | Events | Cons | Prev |
|---|---|---|---|---|
| 23:50 | JPY | Trade Balance (JPY) Dec | -0.01T | 0.06T |
| 00:30 | AUD | Employment Change Dec | 26.5K | -21.3K |
| 00:30 | AUD | Unemployment Rate Dec | 4.40% | 4.30% |
| 07:00 | GBP | Public Sector Net Borrowing (GBP) Dec | 13.5B | 11.7B |
| 12:30 | EUR | ECB Monetary Policy Meeting Accounts | ||
| 13:30 | CAD | New Housing Price Index M/M Dec | -0.20% | 0.00% |
| 13:30 | USD | Initial Jobless Claims (Jan 16) | 209K | 198K |
| 13:30 | USD | GDP Annualized Q3 | 4.30% | 4.30% |
| 13:30 | USD | GDP Price Index Q3 | 3.80% | 3.80% |
| 15:00 | USD | Personal Income M/M Nov | 0.40% | 0.10% |
| 15:00 | USD | Personal Spending M/M Nov | 0.50% | 0.50% |
| 15:00 | USD | PCE Price Index M/M Nov | 0.20% | 0.20% |
| 15:00 | USD | PCE Price Index Y/Y Nov | 2.80% | 2.70% |
| 15:00 | USD | Core PCE Price Index M/M Nov | 0.20% | 0.20% |
| 15:00 | USD | Core PCE Price Index Y/Y Nov | 2.80% | 2.70% |
| 15:00 | EUR | Eurozone Consumer Confidence Jan P | -13 | -15 |
| 15:30 | USD | Natural Gas Storage (Jan 16) | -90B | -71B |
| 17:00 | USD | Crude Oil Inventories (Jan 16) | -1.0M | 3.4M |
| 23:50 | JPY |
| Trade Balance (JPY) Dec | |
| Consensus | -0.01T |
| Previous | 0.06T |
| 00:30 | AUD |
| Employment Change Dec | |
| Consensus | 26.5K |
| Previous | -21.3K |
| 00:30 | AUD |
| Unemployment Rate Dec | |
| Consensus | 4.40% |
| Previous | 4.30% |
| 07:00 | GBP |
| Public Sector Net Borrowing (GBP) Dec | |
| Consensus | 13.5B |
| Previous | 11.7B |
| 12:30 | EUR |
| ECB Monetary Policy Meeting Accounts | |
| Consensus | |
| Previous | |
| 13:30 | CAD |
| New Housing Price Index M/M Dec | |
| Consensus | -0.20% |
| Previous | 0.00% |
| 13:30 | USD |
| Initial Jobless Claims (Jan 16) | |
| Consensus | 209K |
| Previous | 198K |
| 13:30 | USD |
| GDP Annualized Q3 | |
| Consensus | 4.30% |
| Previous | 4.30% |
| 13:30 | USD |
| GDP Price Index Q3 | |
| Consensus | 3.80% |
| Previous | 3.80% |
| 15:00 | USD |
| Personal Income M/M Nov | |
| Consensus | 0.40% |
| Previous | 0.10% |
| 15:00 | USD |
| Personal Spending M/M Nov | |
| Consensus | 0.50% |
| Previous | 0.50% |
| 15:00 | USD |
| PCE Price Index M/M Nov | |
| Consensus | 0.20% |
| Previous | 0.20% |
| 15:00 | USD |
| PCE Price Index Y/Y Nov | |
| Consensus | 2.80% |
| Previous | 2.70% |
| 15:00 | USD |
| Core PCE Price Index M/M Nov | |
| Consensus | 0.20% |
| Previous | 0.20% |
| 15:00 | USD |
| Core PCE Price Index Y/Y Nov | |
| Consensus | 2.80% |
| Previous | 2.70% |
| 15:00 | EUR |
| Eurozone Consumer Confidence Jan P | |
| Consensus | -13 |
| Previous | -15 |
| 15:30 | USD |
| Natural Gas Storage (Jan 16) | |
| Consensus | -90B |
| Previous | -71B |
| 17:00 | USD |
| Crude Oil Inventories (Jan 16) | |
| Consensus | -1.0M |
| Previous | 3.4M |
Friday, Jan 23, 2026
| GMT | Ccy | Events | Cons | Prev |
|---|---|---|---|---|
| 21:45 | NZD | CPI Q/Q Q4 | 0.50% | 1.00% |
| 21:45 | NZD | CPI Q/Q Q4 | 3.00% | 3.00% |
| 22:00 | AUD | Manufacturing PMI Jan P | 51.6 | |
| 22:00 | AUD | Services PMI Jan P | 51.1 | |
| 23:30 | JPY | National CPI Y/Y Dec | 2.90% | |
| 23:30 | JPY | National CPI Core Y/Y Dec | 2.40% | 3.00% |
| 23:30 | JPY | National CPI Core-Core Y/Y Dec | 3.00% | |
| 00:01 | GBP | GfK Consumer Confidence Jan | -16 | -17 |
| 00:30 | JPY | Manufacturing PMI Jan P | 50.1 | 50 |
| 00:30 | JPY | Services PMI Jan P | 51.6 | |
| 03:07 | JPY | BoJ Interest Rate Decision | 0.75% | 0.75% |
| 06:30 | JPY | BoJ Press Conference | ||
| 07:00 | GBP | Retail Sales M/M Dec | 0.00% | -0.10% |
| 08:15 | EUR | France Manufacturing PMI Jan P | 50.5 | 50.7 |
| 08:15 | EUR | France Services PMI Jan P | 50.4 | 50.1 |
| 08:30 | EUR | Germany Manufacturing PMI Jan P | 47.6 | 47 |
| 08:30 | EUR | Germany Services PMI Jan P | 52.5 | 52.7 |
| 09:00 | EUR | Eurozone Manufacturing PMI Jan P | 49.3 | 48.8 |
| 09:00 | EUR | Eurozone Services PMI Jan P | 52.6 | 52.4 |
| 09:30 | GBP | Manufacturing PMI Jan P | 50.4 | 50.6 |
| 09:30 | GBP | Services PMI Jan P | 51.7 | 51.4 |
| 13:30 | CAD | Retail Sales M/M Nov | 1.20% | -0.20% |
| 13:30 | CAD | Retail Sales ex Autos M/M Nov | 1.10% | -0.60% |
| 14:45 | USD | Manufacturing PMI Jan P | 52.1 | 51.8 |
| 14:45 | USD | Services PMI Jan P | 52.8 | 52.5 |
| 15:00 | USD | UoM Consumer Sentiment Jan F | 54 | 54 |
| 15:00 | USD | UoM 1-Yr Inflation Expectations Jan F | 4.20% |
| 21:45 | NZD |
| CPI Q/Q Q4 | |
| Consensus | 0.50% |
| Previous | 1.00% |
| 21:45 | NZD |
| CPI Q/Q Q4 | |
| Consensus | 3.00% |
| Previous | 3.00% |
| 22:00 | AUD |
| Manufacturing PMI Jan P | |
| Consensus | |
| Previous | 51.6 |
| 22:00 | AUD |
| Services PMI Jan P | |
| Consensus | |
| Previous | 51.1 |
| 23:30 | JPY |
| National CPI Y/Y Dec | |
| Consensus | |
| Previous | 2.90% |
| 23:30 | JPY |
| National CPI Core Y/Y Dec | |
| Consensus | 2.40% |
| Previous | 3.00% |
| 23:30 | JPY |
| National CPI Core-Core Y/Y Dec | |
| Consensus | |
| Previous | 3.00% |
| 00:01 | GBP |
| GfK Consumer Confidence Jan | |
| Consensus | -16 |
| Previous | -17 |
| 00:30 | JPY |
| Manufacturing PMI Jan P | |
| Consensus | 50.1 |
| Previous | 50 |
| 00:30 | JPY |
| Services PMI Jan P | |
| Consensus | |
| Previous | 51.6 |
| 03:07 | JPY |
| BoJ Interest Rate Decision | |
| Consensus | 0.75% |
| Previous | 0.75% |
| 06:30 | JPY |
| BoJ Press Conference | |
| Consensus | |
| Previous | |
| 07:00 | GBP |
| Retail Sales M/M Dec | |
| Consensus | 0.00% |
| Previous | -0.10% |
| 08:15 | EUR |
| France Manufacturing PMI Jan P | |
| Consensus | 50.5 |
| Previous | 50.7 |
| 08:15 | EUR |
| France Services PMI Jan P | |
| Consensus | 50.4 |
| Previous | 50.1 |
| 08:30 | EUR |
| Germany Manufacturing PMI Jan P | |
| Consensus | 47.6 |
| Previous | 47 |
| 08:30 | EUR |
| Germany Services PMI Jan P | |
| Consensus | 52.5 |
| Previous | 52.7 |
| 09:00 | EUR |
| Eurozone Manufacturing PMI Jan P | |
| Consensus | 49.3 |
| Previous | 48.8 |
| 09:00 | EUR |
| Eurozone Services PMI Jan P | |
| Consensus | 52.6 |
| Previous | 52.4 |
| 09:30 | GBP |
| Manufacturing PMI Jan P | |
| Consensus | 50.4 |
| Previous | 50.6 |
| 09:30 | GBP |
| Services PMI Jan P | |
| Consensus | 51.7 |
| Previous | 51.4 |
| 13:30 | CAD |
| Retail Sales M/M Nov | |
| Consensus | 1.20% |
| Previous | -0.20% |
| 13:30 | CAD |
| Retail Sales ex Autos M/M Nov | |
| Consensus | 1.10% |
| Previous | -0.60% |
| 14:45 | USD |
| Manufacturing PMI Jan P | |
| Consensus | 52.1 |
| Previous | 51.8 |
| 14:45 | USD |
| Services PMI Jan P | |
| Consensus | 52.8 |
| Previous | 52.5 |
| 15:00 | USD |
| UoM Consumer Sentiment Jan F | |
| Consensus | 54 |
| Previous | 54 |
| 15:00 | USD |
| UoM 1-Yr Inflation Expectations Jan F | |
| Consensus | |
| Previous | 4.20% |
The Weekly Bottom Line: Canada Makes a Deal with China
Canadian Highlights
- The housing data offered mixed signals this week. Housing starts came in above the recent trend, while existing home sales declined for the second straight month in December.
- Canada reached a trade deal with China, agreeing to admit up to 49k electric vehicles into the domestic market in exchange for a reduction on of tariffs on canola and other products.
- The two countries also signed an “agreement to collaborate in energy, clean technology and climate competitiveness”. Canada has now struck a more open stance to investment from China in the energy sector.
U.S. Highlights
- Headline retail sales rebounded in November from October’s decline. Sales in the control group rose for the second month in a row, pointing to resilience in consumer spending.
- The housing market finished last year on a firmer footing. Existing home sales have now risen for four consecutive months, reaching the highest since early 2023 in December.
- CPI inflation was steady in December at 2.7% y/y, down from a 3.0% peak in September.
Canada – Canada Makes a Deal with China
In a quiet week for economic data, Canadian market price action was largely driven by external developments. Bond markets remained calm, with yields drifting slightly lower over the week. Equity prices briefly wavered early on, but sentiment improved on optimism around the technology sector. U.S. exceptionalism continued to set the tone, though Canadian equities may see more action as details of the Canada–China trade deal filter through investor expectations.
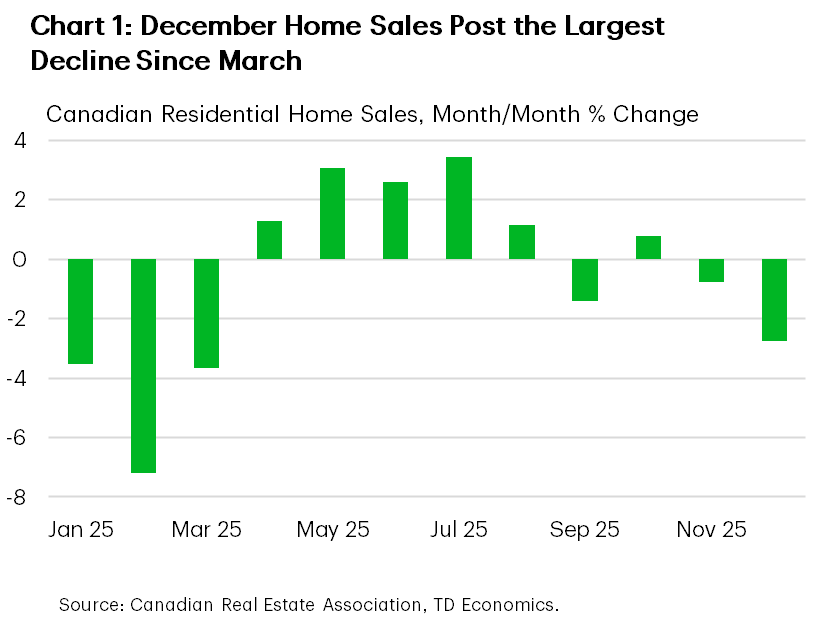
We did get housing market updates for December, with mixed signals from resales versus homebuilding. Housing starts came in above the recent trend, likely reflecting continued momentum in purpose-built rental construction. While this is welcome news, it remains to be seen whether the strength is sustained. Meanwhile, existing home sales declined for the second straight month in December, marking the largest drop since March (Chart 1). Listings also fell, helping ease pressure on prices, with the quality-adjusted home price index now down 4% year-over-year. Our current forecast points to a softer market, reflecting slower population growth, a sluggish economic backdrop, and lingering buyer caution.
Developments on the political front accelerated quickly. The first visit by a Canadian Prime Minister to China since 2017 resulted in a series of agreements on energy, agri-food, and trade. On energy, the countries expressed their intention to strengthen collaboration in energy, clean technology and climate competitiveness. With Canada keen on attracting Chinese investment on renewable energy projects.
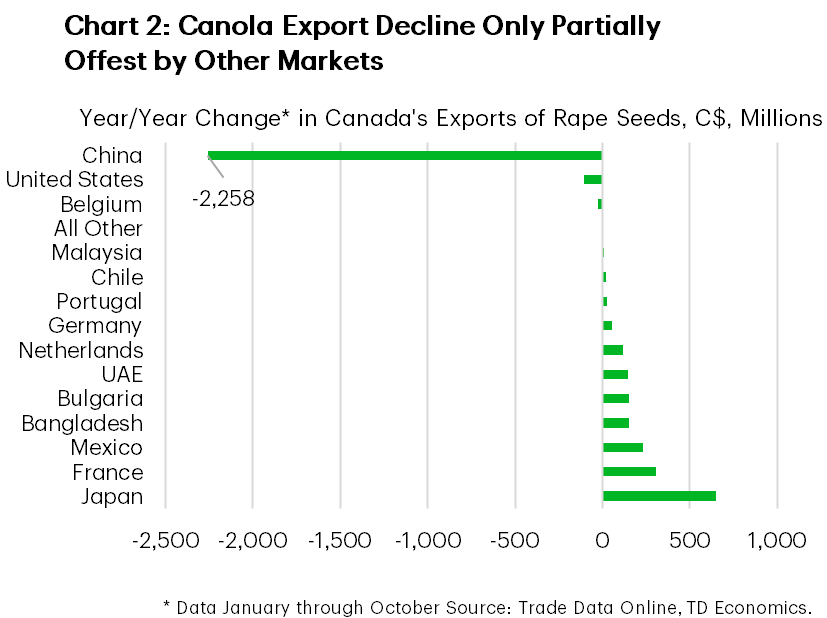
Canada also agreed to admit up to 49k Chinese electric vehicles into the domestic market at a tariff rate of 6.1%, sharply lower than the 100% tariff imposed in 2024. The quota represents roughly 3% of new vehicle sales in Canada, but 30% of EV sales. In return, China will reduce tariffs on Canadian canola seed from roughly 84% to about 15%, while those on canola oil and meal will be eliminated through the end of the year, implying a roughly 12% duty on canola exports overall. Over the past year, Canada’s canola seed exports fell by $2.3 billion, only partially offset by an increase of exports to other countries (Chart 2). With tariff relief on canola and other products, the government expects the deal to unlock nearly C$3 billion in exports.
PM Carney described the outcome as a “preliminary but landmark” agreement, representing a meaningful step toward rebuilding Canada-China economic relations. Further collaboration remains possible, particularly through the Joint Economic and Trade Commission, which is set to meet later this year and will be chaired by trade ministers from both countries. However, the scope for deeper progress may ultimately depend on progress and developments in trade negotiations with the U.S.
Next week brings more economic news. The Bank of Canada’s Business Outlook Survey and inflation data are both out on Monday. Consensus expectations are for inflation to soften on a month-on-month basis, while remaining steady year-on-year. This report is unlikely to move the needle for the Bank of Canada and we expect it to remain on hold for the time being.
U.S. – Economic Resilience Amid Uncertainty
A full economic calendar this week built on last week’s payroll report in underscoring the economy’s resilience through a turbulent fourth quarter marked by the government shutdown. Geopolitical risks escalated amid violent protests in Iran and the prospect of U.S. involvement, sending the VIX index, gold, and oil prices higher mid-week—WTI briefly exceeded $60 per barrel—though prices retreated by week’s end as the threat of direct confrontation diminished. Surprisingly, Fed Chair Powell’s statement Sunday night where he spoke out on threats to the Fed’s ability to set interest rates free from political interference for the first time garnered little reaction from bond markets.
Resilience was evident in the retail sales report, as consumers appeared to have largely shrugged off the effects of the government shutdown. Headline sales rebounded by in November after a flat October, while sales in the control group—used in GDP calculations— were up 1% through the first two months of the quarter. This suggests Q4 2025 consumer spending growth was likely stronger than our earlier 1.1% (annualized) estimate. Next week’s personal income and spending data will provide more detail on households’ November income and spending, especially on services.
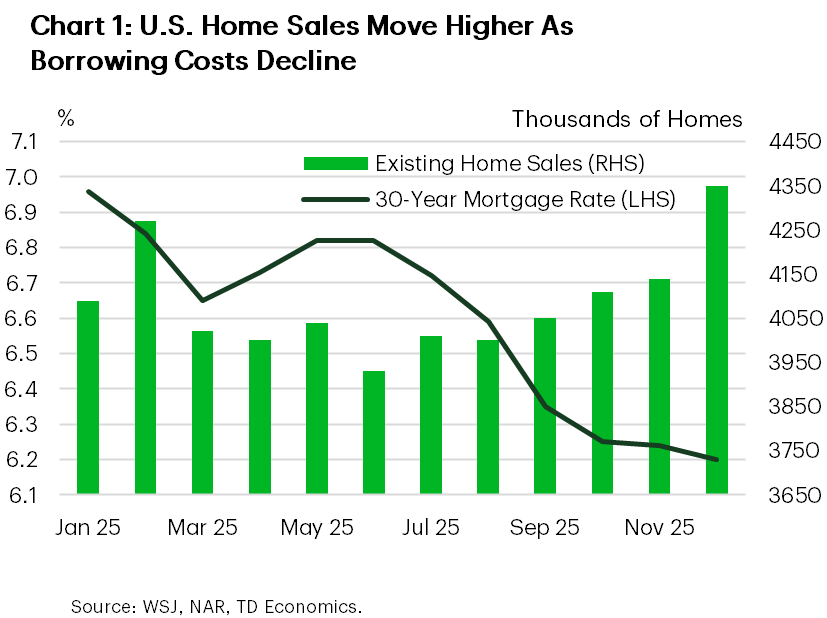
The housing market also finished last year on a firmer footing, with lower mortgage rates drawing more homebuyers off the sidelines (Chart 1). Existing home sales have now risen for four consecutive months, surging 5.1% in December to 4.35 million units—the highest since early 2023. We believe sales will continue to trend gradually higher this year; however, unless addressed, limited supply will continue to impede a stronger rebound.
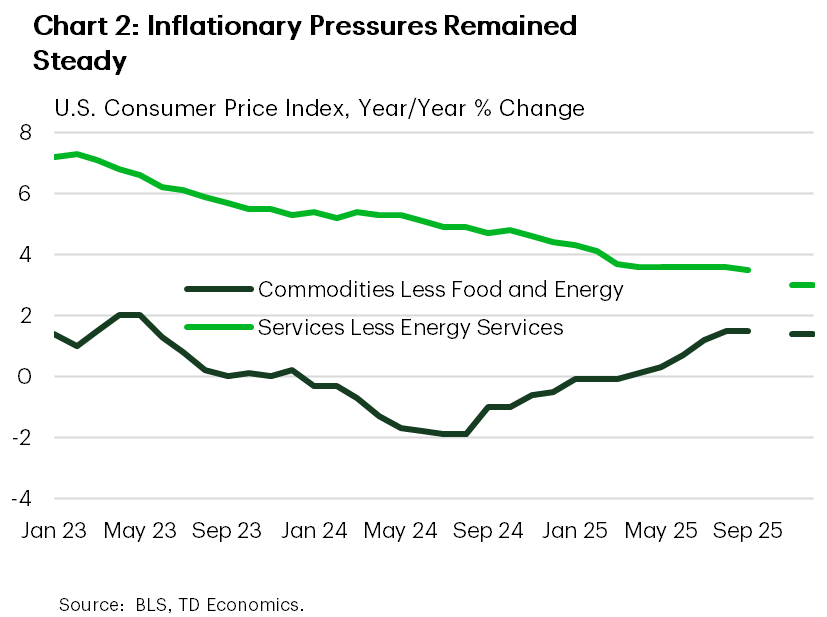
Inflationary pressures remained steady in December. The headline CPI was up 2.7% year-over-year, maintaining its deceleration from the recent high of 3.0% in September. Core goods prices were stable after five consecutive monthly increases (Chart 2). Food prices were somewhat elevated, rising 0.7% month-over-month (up 3.1% year-over-year), remaining a pressure point in households’ budgets.
Although inflation steadied in December, we still expect knock-on effects from tariffs to push it higher in the coming months. FOMC member Williams (voter) expects inflation to “peak at around 2-3/4 to 3 percent during the first half of this year,” but anticipates these will be “one-off” effects. Aside from tariffs, Williams noted that underlying inflation trends have been favourable, supply chain bottlenecks are absent, and the labour market is cooling gradually.
The latest Beige Book also reported both inflation and the labour market as broadly stable, with increased economic activity following the shutdown, and more Fed Districts seeing growth. Overall, recent data gives policymakers more reassurance that the economy stabilized at year-end while price pressures remained contained. This supports a “pause” on rate cuts for a few months, when tariff impacts are more clearly in the rear-view mirror.
Weekly Economic & Financial Commentary: More Pressure on the Federal Reserve Emerges
Summary
United States: A Moderating but Resilient U.S. Economy
- This week's data depict an economy cooling in an orderly fashion: Inflation is easing gradually, consumer spending retains underlying resilience, and housing is finding a foothold as financing costs modestly retreat.
- Next week: Construction Spending (Wed.), Personal Income & Spending (Thu.)
International: Gentle Data Shifts, Anchored Policy Paths
- In an otherwise relatively quiet week for global economic data releases, the U.K.’s November GDP print delivered an upside surprise, though we still expect the Bank of England to remain on a gradual easing path. Meanwhile, India’s December inflation data showed a modest acceleration, unlikely to derail our expectations for one additional rate cut this year.
- Next week: China GDP (Mon.), Australia Employment (Thu.), Bank of Japan Policy Rate (Fri.)
Topic of the Week: More Pressure on the Federal Reserve Emerges
- News broke earlier this week that the Federal Reserve received grand jury subpoenas from the Department of Justice, escalating the Trump administration's pressure on the nation's central bank. While we do not believe this will alter the near-term course of monetary policy, it will make the next Fed Chair's job that much more difficult to build a consensus among the 19 members of the Federal Open Market Committee.
Canada’s Inflation Data to Show It’s Still Running Above BoC’s Target
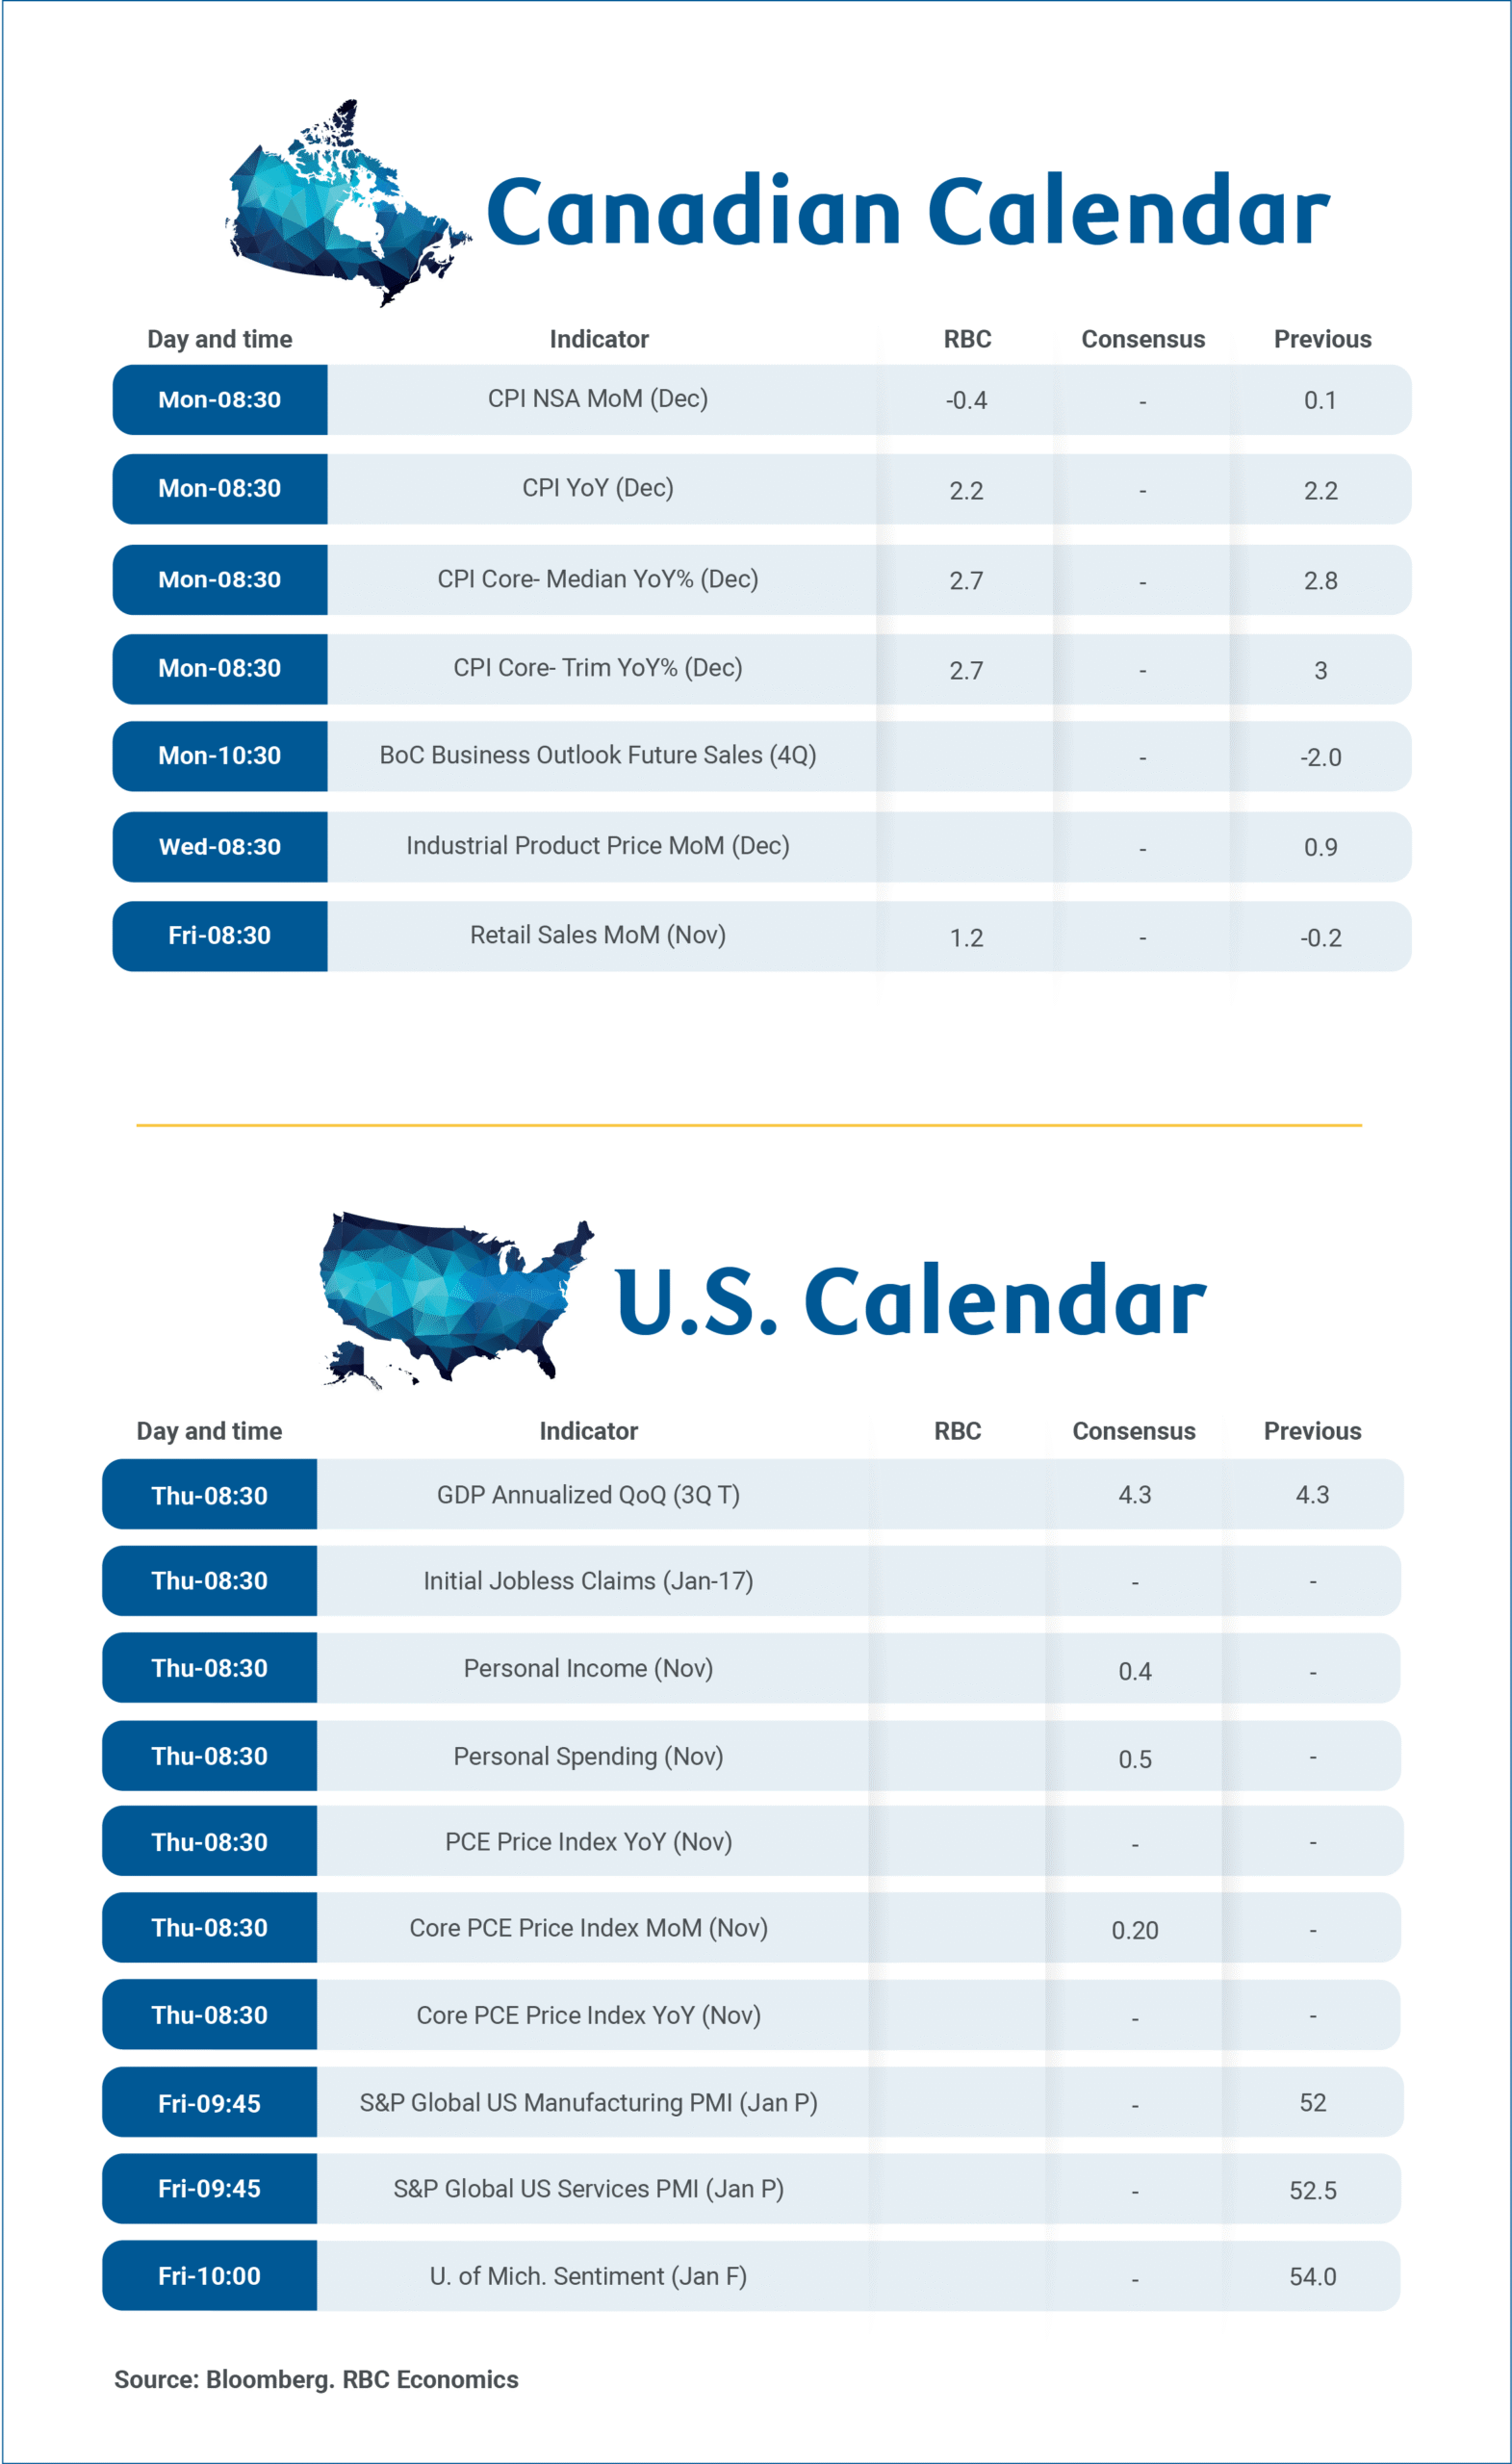
There’s a full slate of Canadian data releases in the coming week kicking off with the final monthly inflation report for 2025 and the Bank of Canada’s closely watched Business Outlook Survey for Q4 on Monday, along with November’s retail sales on Friday.
We expect headline inflation trended broadly sideways in December, matching the 2.2% year-over-year in November. We anticipate little-changed core price growth trends that leave inflation still running moderately above the Bank of Canada’s inflation target.
An 8% drop in December gasoline prices should push energy prices further below a year ago. However, food inflation remained elevated for much of 2025 following short-lived easing late in 2024. We look for food price growth to rise above 5% in December—in part due to low after-tax restaurant prices a year earlier during the GST/HST tax holiday. But, grocery price inflation also remains elevated (4.7% as of November).
Inflation, excluding food and energy products, is expected to edge lower to 2.3% from 2.4% in November. If realized, this would mark a second consecutive month of improvement. The BoC’s median and trim CPI measures were similar year-over-year from the 2.8% increases in November (still above the BoC’s 2% inflation target).
Headline inflation compared to a year ago will continue to be distorted by tax changes. The removal of the consumer carbon tax in most provinces in April 2025 continues to lower annual energy price growth. The temporary GST/HST tax break introduced mid-December 2024 (stretching through mid-February 2025) will artificially raise annual price growth in December. Although, an offsetting rise in pre-tax prices a year ago will limit the impact.
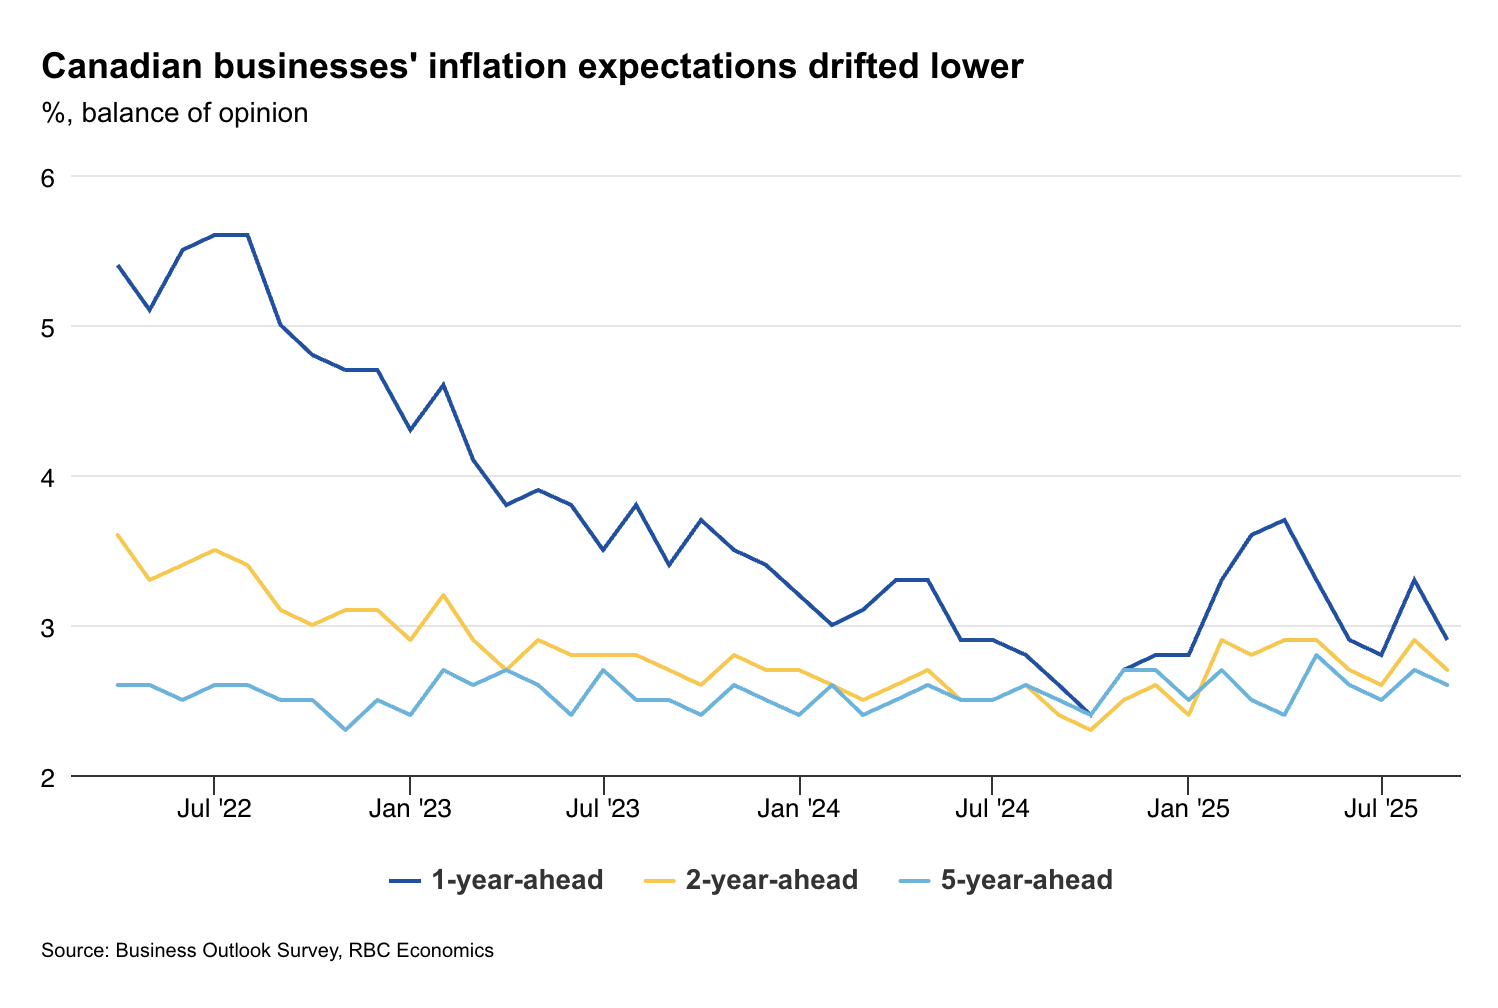
Muted demand, cautious pricing and restrained hiring
The Q4 Business Outlook Survey comes ahead of the next interest rate decision later this month. In Q3, the survey reinforced the picture of an economy stabilizing, albeit at a subdued level. We expect to see more of the same in Q4 with muted demand, cautious pricing behaviour, and restrained hiring plans.
Still, significant downside international trade scenarios feared earlier this year have yet to emerge, and the BoC likely remains cautiously optimistic about the economy. Heavily trade-exposed sectors have continued to underperform, but November’s retail sales should reinforce consumer demand remains relatively resilient (in line with Statistics Canada’s advance estimate for a 1.2% monthly increase). Our cardholder spending tracker showed domestic purchases firming through the holiday shopping season.
We continue to expect the BoC will leave the overnight rate unchanged in 2026 with the next move more likely to be a hike, but we don’t expect until 2027.