Sample Category Title
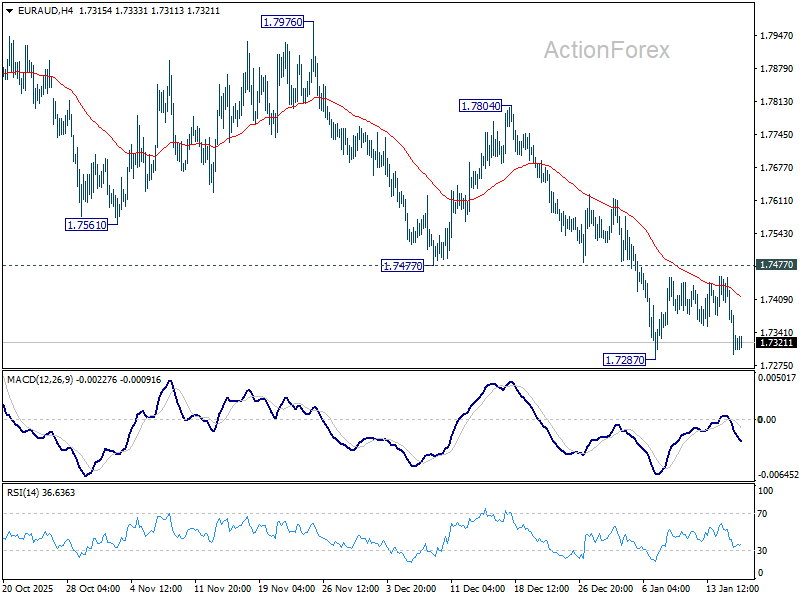
EUR/AUD Daily Outlook
Daily Pivots: (S1) 1.7268; (P) 1.7362; (R1) 1.7426; More...
EUR/AUD is still bounded in range above 1.7287 and intraday bias stays neutral. Further decline is expected with 1.7477 support turned resistance intact. Current fall is seen as the third leg of the corrective pattern from 1.8554. Below 1.7287 will target 1.7245 support, and then 1.6922 fibonacci level. Nevertheless, firm break of 1.7477 will indicate short term bottoming, and bring stronger rebound back to 55 D EMA (now at 1.7602).
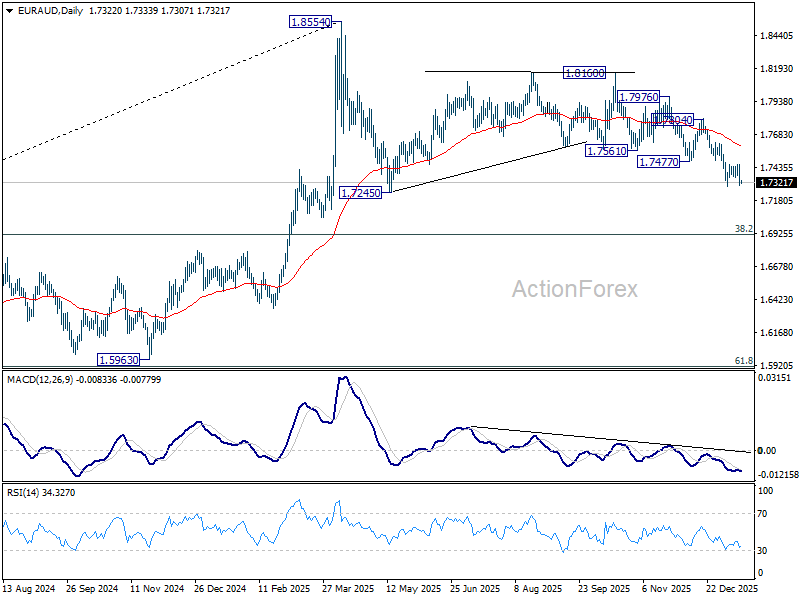
In the bigger picture, the break of 55 W EMA (now at 1.7468) argues that fall from 1.8554 medium term top is already correcting whole up trend from 1.4281 (2022 low). Deeper decline is in favor to 38.2% retracement of 1.4281 to 1.8554 at 1.6922, and possibly below. Risk will stay on the downside as long as 1.8160 resistance holds, in case of strong rebound.
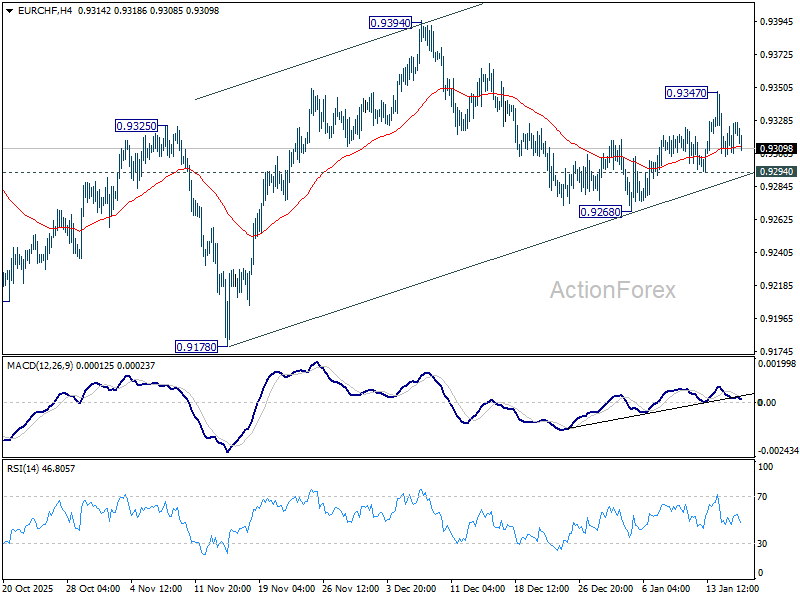
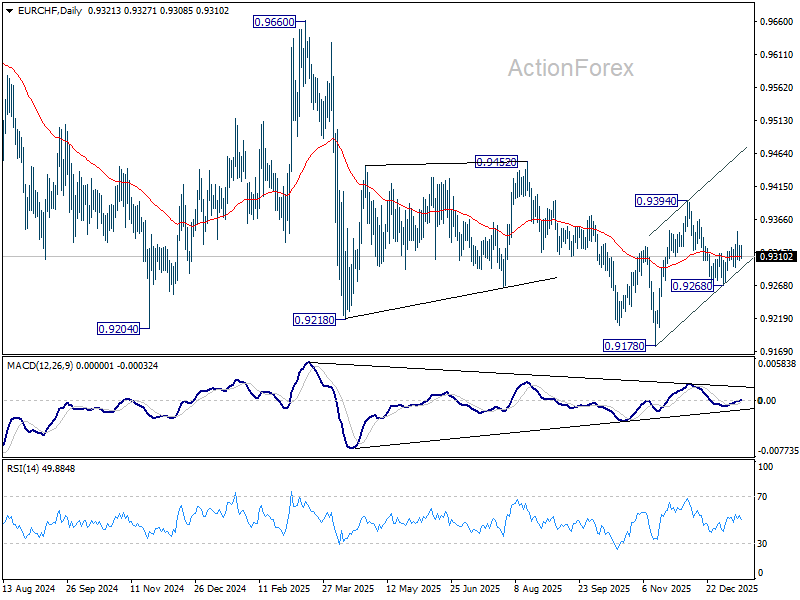
EUR/CHF Daily Outlook
Daily Pivots: (S1) 0.9312; (P) 0.9320; (R1) 0.9335; More....
Intraday bias in EUR/CHF remains neutral for the moment. On the upside, break of 0.9347 will resume the rebound from 0.9268 to retest 0.9394 high. However, break of 0.9294 will bring deeper fall through 0.9268 instead.
In the bigger picture, persistent bullish convergence condition in W MACD is a medium term bullish sign. Firm break of 0.9394 resistance should bring sustained trading above 55 W EMA (now at 0.9362). That should indicate medium term bottoming at 0.9178. Further break of 0.9452 resistance will bring stronger medium term rally towards 0.9928 resistance next, even still as a corrective bounce. Nevertheless, rejection by 55 W EMA will retain bearishness for another fall through 0.9178 at a later stage.
USD/CAD Daily Outlook
Daily Pivots: (S1) 1.3867; (P) 1.3882; (R1) 1.3899; More...
Intraday bias in USD/CAD remains neutral as consolidations from 1.3917 is still extending. In case of another dip, downside should be contained by 1.3789 support to bring rebound. Rise from 1.3641 is seen as the third leg of the corrective pattern from 1.3538. Firm break of 1.3917 will target 1.4139 first. Break there will target 100% projection of 1.3538 to 1.4139 from 1.3641 at 1.4242.
In the bigger picture, price actions from 1.4791 are seen as a corrective pattern to the whole up trend from 1.2005 (2021 low). Deeper fall could be seen as the pattern extends, and break of 1.3538 will target 61.8% retracement of 1.2005 to 1.4791 at 1.3069. For now, medium term outlook will be neutral until there are signs that the correction has completed.
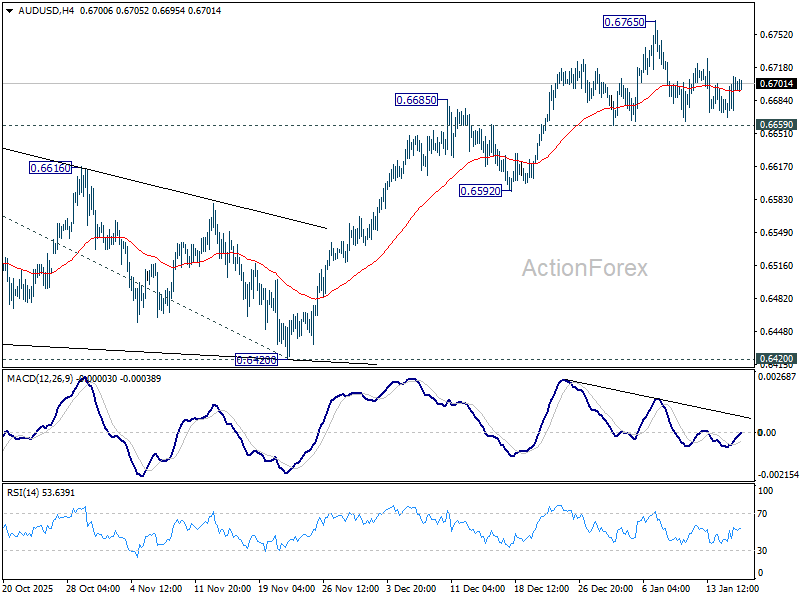
AUD/USD Daily Report
Daily Pivots: (S1) 0.6670; (P) 0.6686; (R1) 0.6699; More...
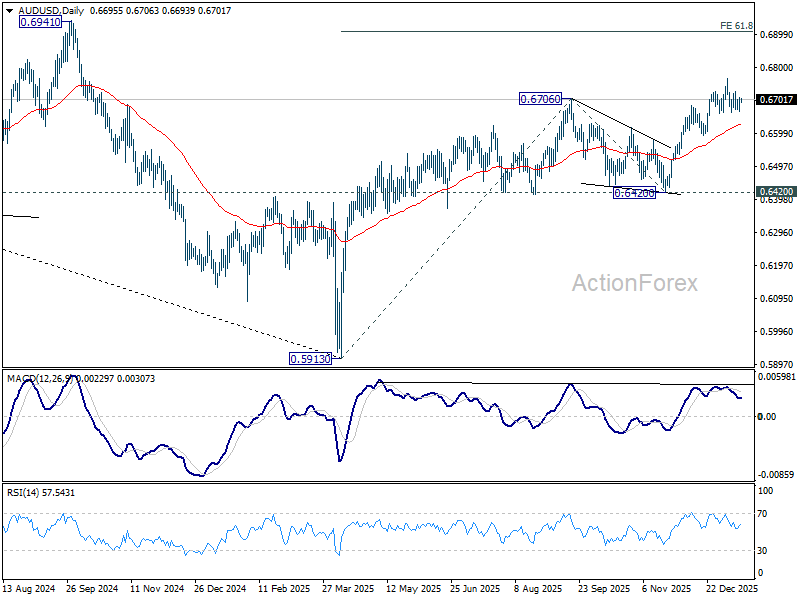
No change in AUD/USD's outlook as consolidations continue below 0.6765 short term top. Intraday bias stays neutral at this point. Further rally is in favor with 0.6659 support intact. On the upside, break of 0.6765 will resume the whole rise from 0.5913 and target 61.8% projection of 0.5913 to 0.6706 from 0.6420 at 0.6910. However, considering bearish divergence condition in 4H MACD, firm break of 0.6659 will confirm short term topping, and bring deeper correction back towards 0.6592 support.
In the bigger picture, current development argues that rise from 0.5913 (2024 low) is reversing whole down trend from 0.8006 (2021 high). Further rally should be seen to 61.8% retracement of 0.8006 to 0.5913 at 0.7206. This will remain the favored case as long as 0.6420 support holds.
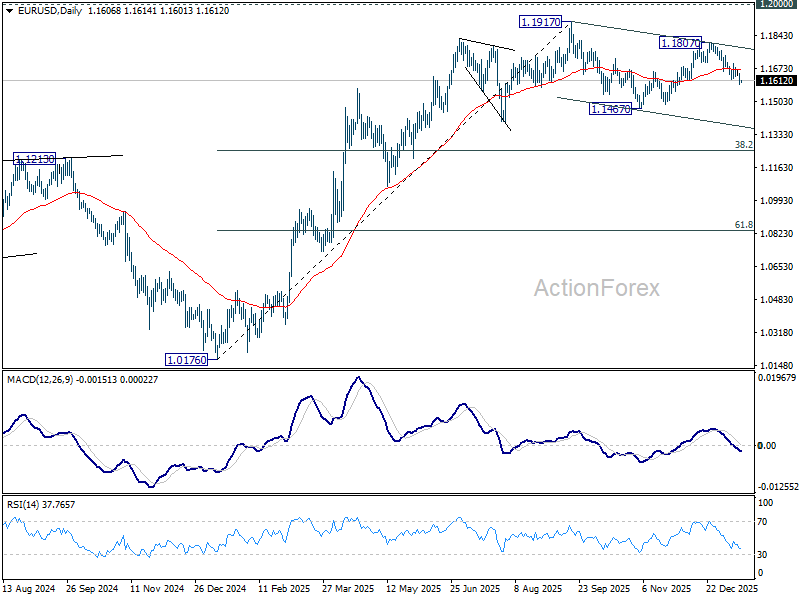
EUR/USD Daily Outlook
Daily Pivots: (S1) 1.1585; (P) 1.1617; (R1) 1.1642; More….
Intraday bias in EUR/USD remains on the downside for the moment, as fall from 1.1807 is extending. The decline is seen as the third leg of the corrective pattern from 1.1917, and should target 1.1467 support and below. Risk will now stay on the downside as long as 1.1698 resistance holds, in case of recovery.
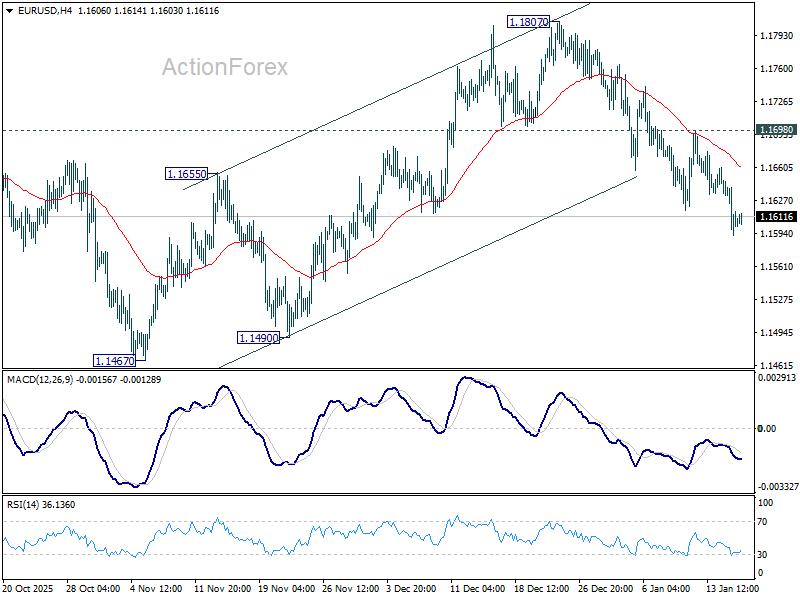
In the bigger picture, as long as 55 W EMA (now at 1.1416) holds, up trend from 0.9534 (2022 low) is still in favor to continue. Decisive break of 1.2 key psychological level will carry larger bullish implication. However, sustained trading below 55 W EMA will argue that rise from 0.9534 has completed as a three wave corrective bounce, and keep long term outlook bearish.
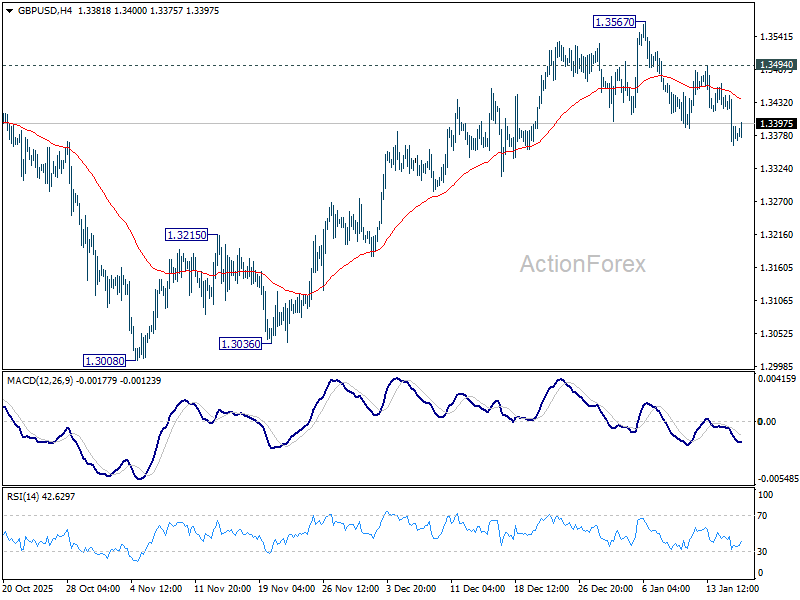
GBP/USD Daily Outlook
Daily Pivots: (S1) 1.3347; (P) 1.3397; (R1) 1.3431; More...
Intraday bias in GBP/USD remains mildly on the downside as fall from 1.3567 is in progress. Sustained break of 55 D EMA (now at 1.3375) will argue that the decline is another falling leg in the corrective pattern from 1.3787. In this case, deeper fall should be seen back to 1.3008 support. For now, risk will stay on the downside as long as 1.3494 resistance holds, in case of recovery.
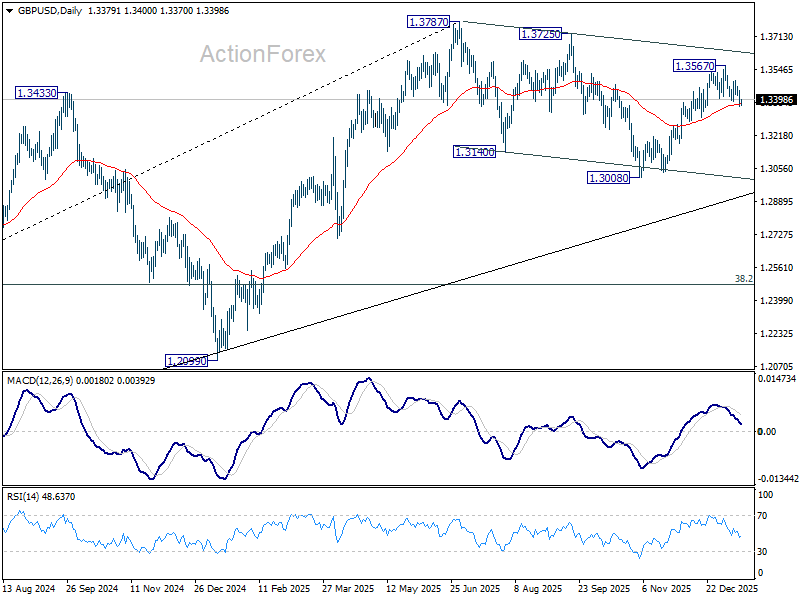
In the bigger picture, price actions from 1.3787 (2025 high) are seen as a correction to the larger up trend from 1.3051 (2022 low). Deeper decline could be seen as the pattern extends, but downside should be contained by 38.2% retracement of 1.0351 to 1.3787 at 1.2474 to bring rebound. Break of 1.3787 for up trend resumption is expected at a later stage.
USD/CHF Daily Outlook
Daily Pivots: (S1) 0.7996; (P) 0.8019; (R1) 0.8055; More….
No change in USD/CHF's outlook as rise from 0.7860 is in progress. Intraday bias remains mildly on the upside for 0.8123 resistance. On the downside, below 0.7983 minor support will turn intraday bias neutral again first. Overall, corrective pattern from 0.7828 low is in progress and would extend further.
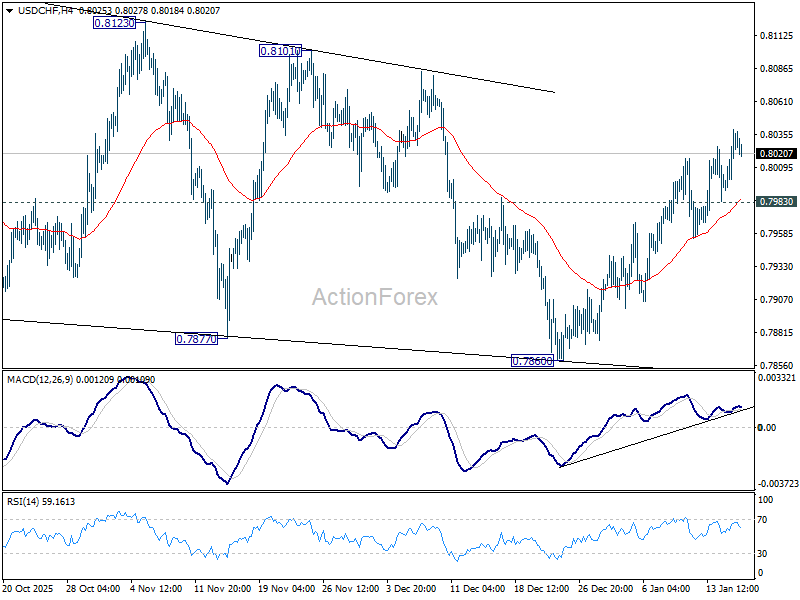
In the bigger picture, price actions from 0.7828 are seen as a correction. Larger down trend from 1.0342 (2017 high) is in still in progress. Break of 0.7828 will target 100% projection of 1.0146 (2022 high) to 0.8332 from 0.9200 at 0.7382. In any case, outlook will stay bearish as long as 0.8332 support turned resistance holds (2023 low).
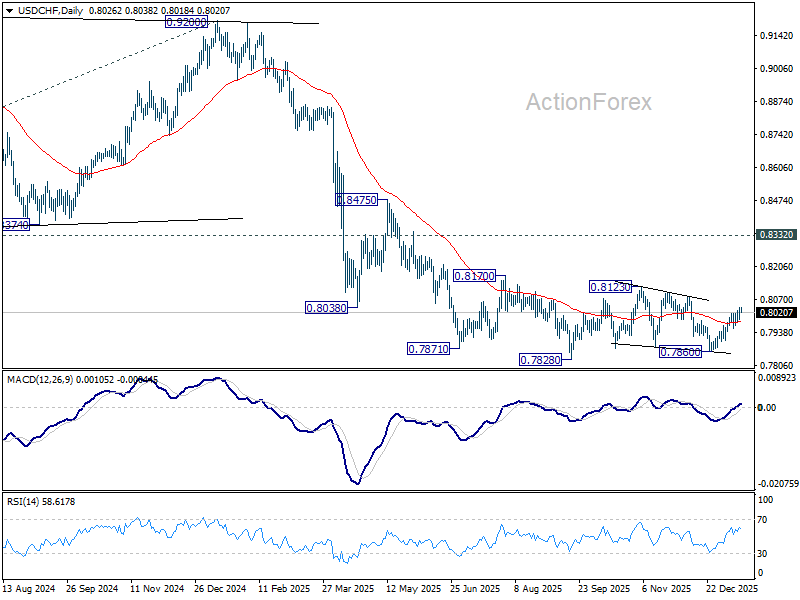
Chart Alert: Japanese Yen Short Squeeze Risk,158.15 Key USD/JPY Trigger
Key takeaways
- Intervention risk is rising: USD/JPY stalled near the 159.45–159.75 resistance zone, levels historically linked to BoJ intervention, triggering sharp yen volatility as officials escalated verbal warnings, including the possibility of joint US–Japan action.
- JPY short squeeze risk is elevated: Speculative positioning in JPY futures has fallen to a one-year low, signalling crowded bearish bets. Any sustained USD/JPY downside could force short covering and amplify yen strength.
- Near-term technical bias turning lower: Bullish momentum in USD/JPY is fading, with a break below 158.15 likely to trigger a minor bearish reversal toward 157.50–156.12, while only a decisive move above 159.75 would revive upside risk.
The price actions of the USD/JPY have staged the expected push up and hit the lower limit of the first immediate resistance zone of 159.45/159.75 (printed an intraday high of 159.45 on Wednesday,14 January 2026. Coincidentally, it was also the same intraday high of 159.45 on 12 July 2024 that the Bank of Japan (BoJ) last intervened in the FX market to sell down the US dollar.
The Japanese yen has been the most volatile among major currencies in the last three trading sessions. The JPY hit an 18-month low against the greenback on Tuesday, 13 January 2026, at 159.17 per US dollar, despite a slew of verbal interventions from Japanese authorities at the start of this week.
USD/JPY K-shaped performance evaporated as intervention risk intensified
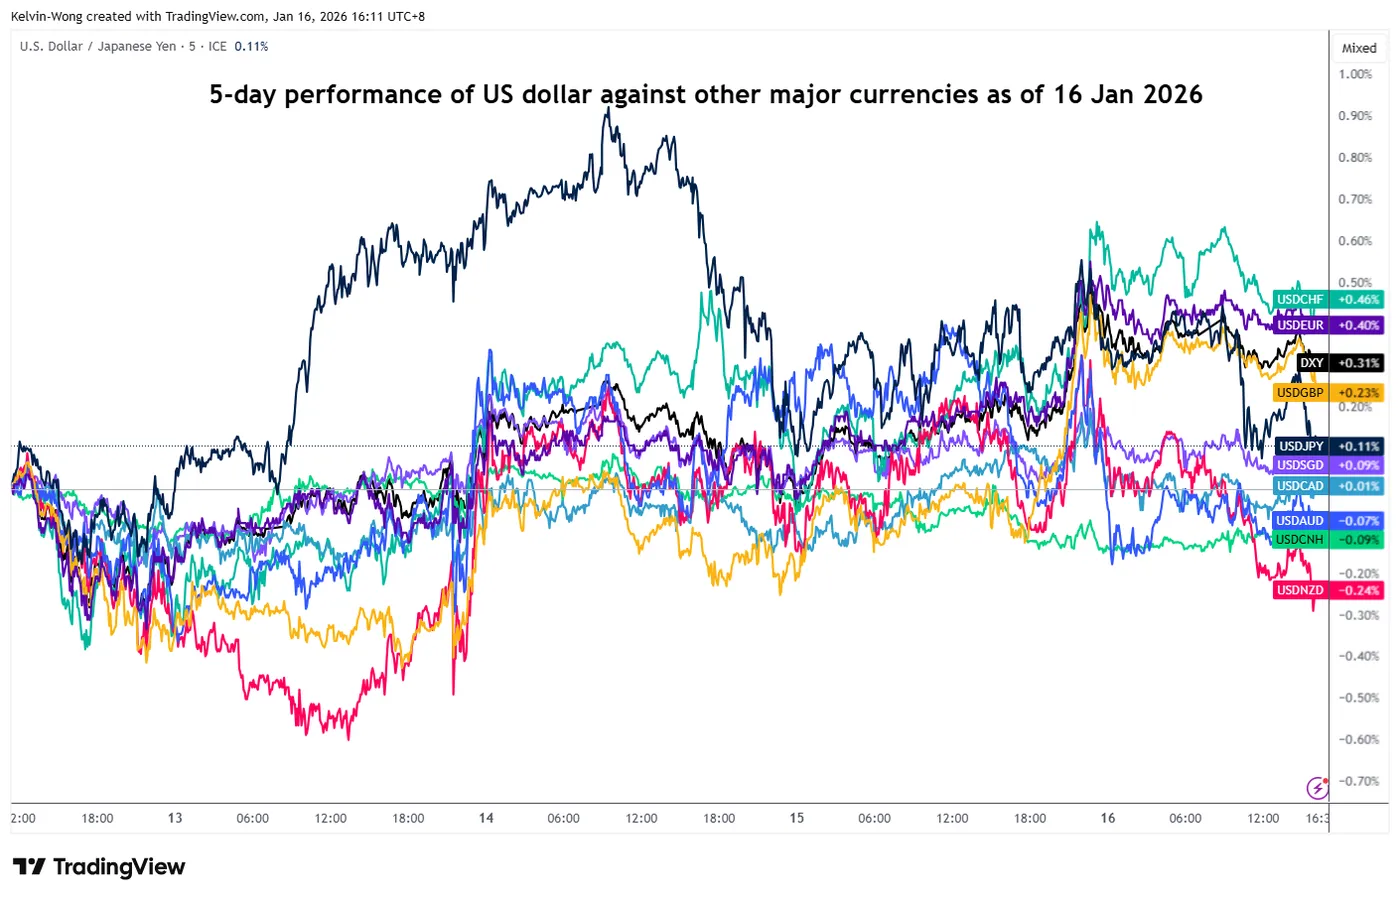
Fig. 1: 5-day rolling performance of the US dollar against major currencies as of 16 Jan 2026 (Source: TradingView)
The “strongest form of verbal intervention” comes in today’s Asia session (Friday, 16 January 2026), where Japan’s Finance Minister Katayama reiterated Tokyo’s readiness to act against excessive yen moves and, for the first time this week, highlighted the possibility of a US-Japan joint intervention in the FX market ahead of a thinning liquidity environment today (ahead of the weekend as well as the closure of US stock market on next Monday, 19 January for Martin Luther King, Jr. Day).
The USD/JPY dropped by 0.4% to hit an intraday low of 157.95 and erased its earlier “K-shaped” performance in the FX market before it rebounded slightly to 158.20 at the time of writing (see Fig. 1).
JPY futures positioning points to the risk of a short squeeze
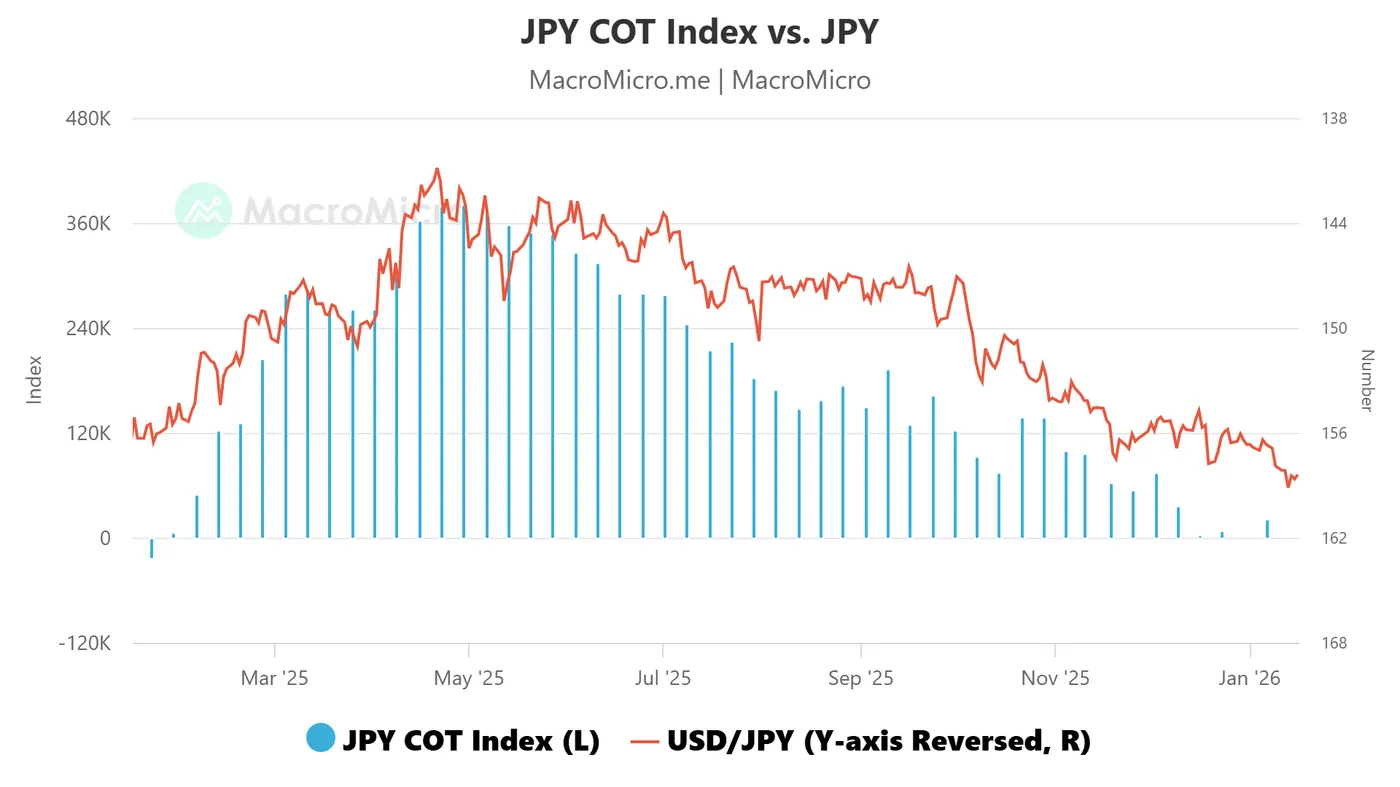
Fig. 2: JPY futures large speculators net positions, excluding commercials net positions as of 6 Jan 2026 (Source: MacroMicro)
Based on the Commitment of Traders report compiled by the US Commodity Futures Trading Commission as of 6 January 2026, the number of large speculators’ net long positions in the JPY futures market, excluding commercials (hedgers) net positions, has declined to a 1-year low at 20,983 contracts (see Fig. 2).
Being a contrary opinion indicator, the positioning by large speculators in the JPY futures has skewed towards a significant degree of bearish bias on the JPY, and a minor bullish reversal in the price action of the JPY can amplify the risk of a short squeeze due to “JPY shorts” scrambling to exit in light of the intervention risk as highlighted above.
Let’s now highlight the short-term (1 to 3 days) trend bias and key technical levels to watch on the USD/JPY.
Bullish momentum is fading for USD/JPY, at risk of minor bearish reversal
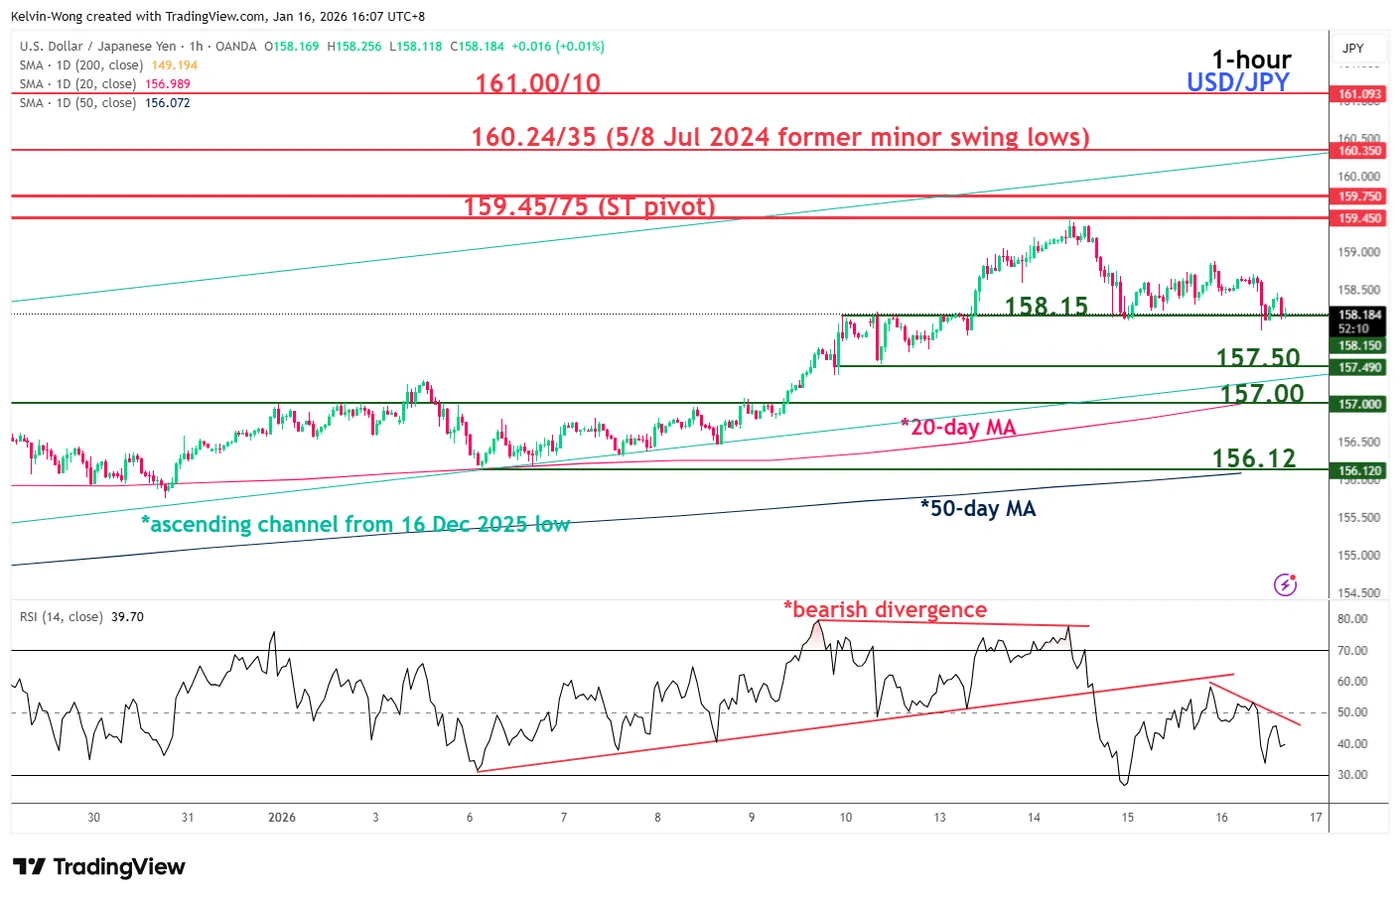
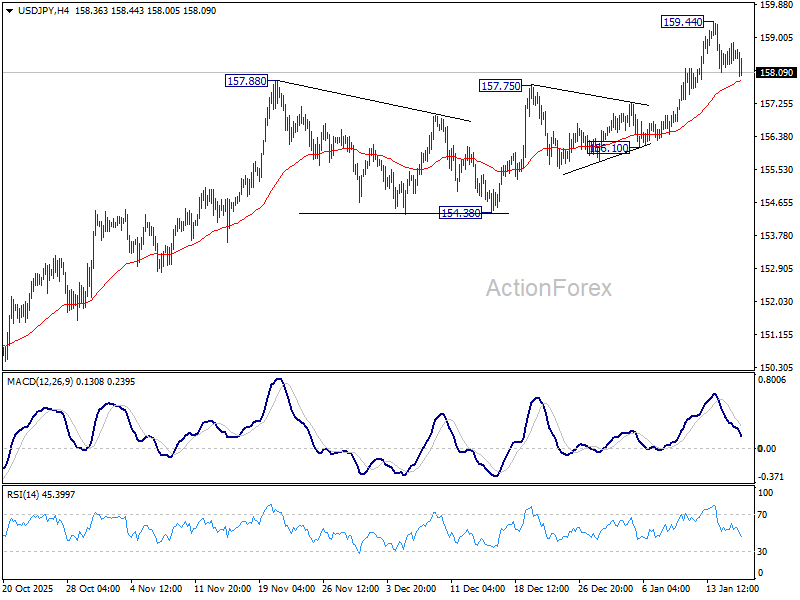
Fig. 3: USD/JPY minor trend as of 16 Jan 2026 (Source: TradingView)
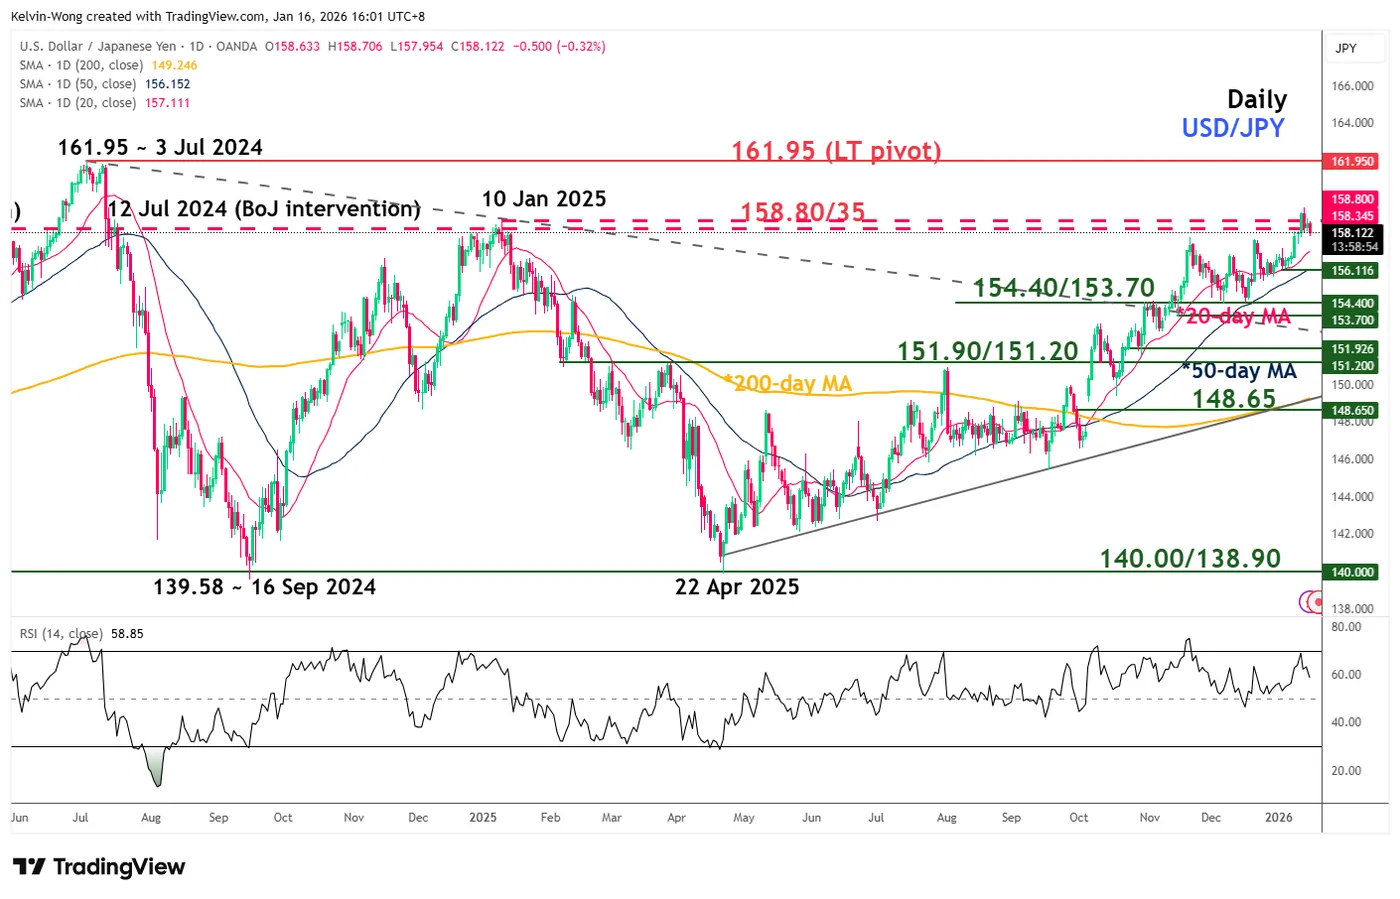
Fig. 4: USD/JPY major and medium-term trends as of 16 Jan 2026 (Source: TradingView)
The reintegration back below 158.30/158.35 on the USD/JPY, coupled with the bearish divergence condition and the bearish breakdown of its former parallel ascending support on the 1-hour RSI momentum indicator, suggests that a potential minor bearish reversal is brewing (see Fig. 3).
Watch the 159.45/159.75 short-term pivotal resistance on the USD/JPY. A break below 158.15 opens scope for a minor bearish reversal to expose the next intermediate supports at 157.50, 157.00 (20-day moving average), followed by 156.12 (50-day moving average).
On the other hand, a clearance above 159.75 invalidates the bearish scenario for a further squeeze up towards the next intermediate resistances at 160.24/160.35 and 161.00/161.10.
Bitcoin Has Not Crossed the Correction Line
Market Overview
The crypto market has fallen 1.5% over the past 24 hours to $3.23 trillion as the market regains strength after the growth momentum at the beginning of the week. The top five cryptocurrencies by market capitalisation are down less than 1%, while smaller altcoins are experiencing more significant declines. The exception is Tron, which is up about 1% on the day and has been steadily gaining weight since the end of December.
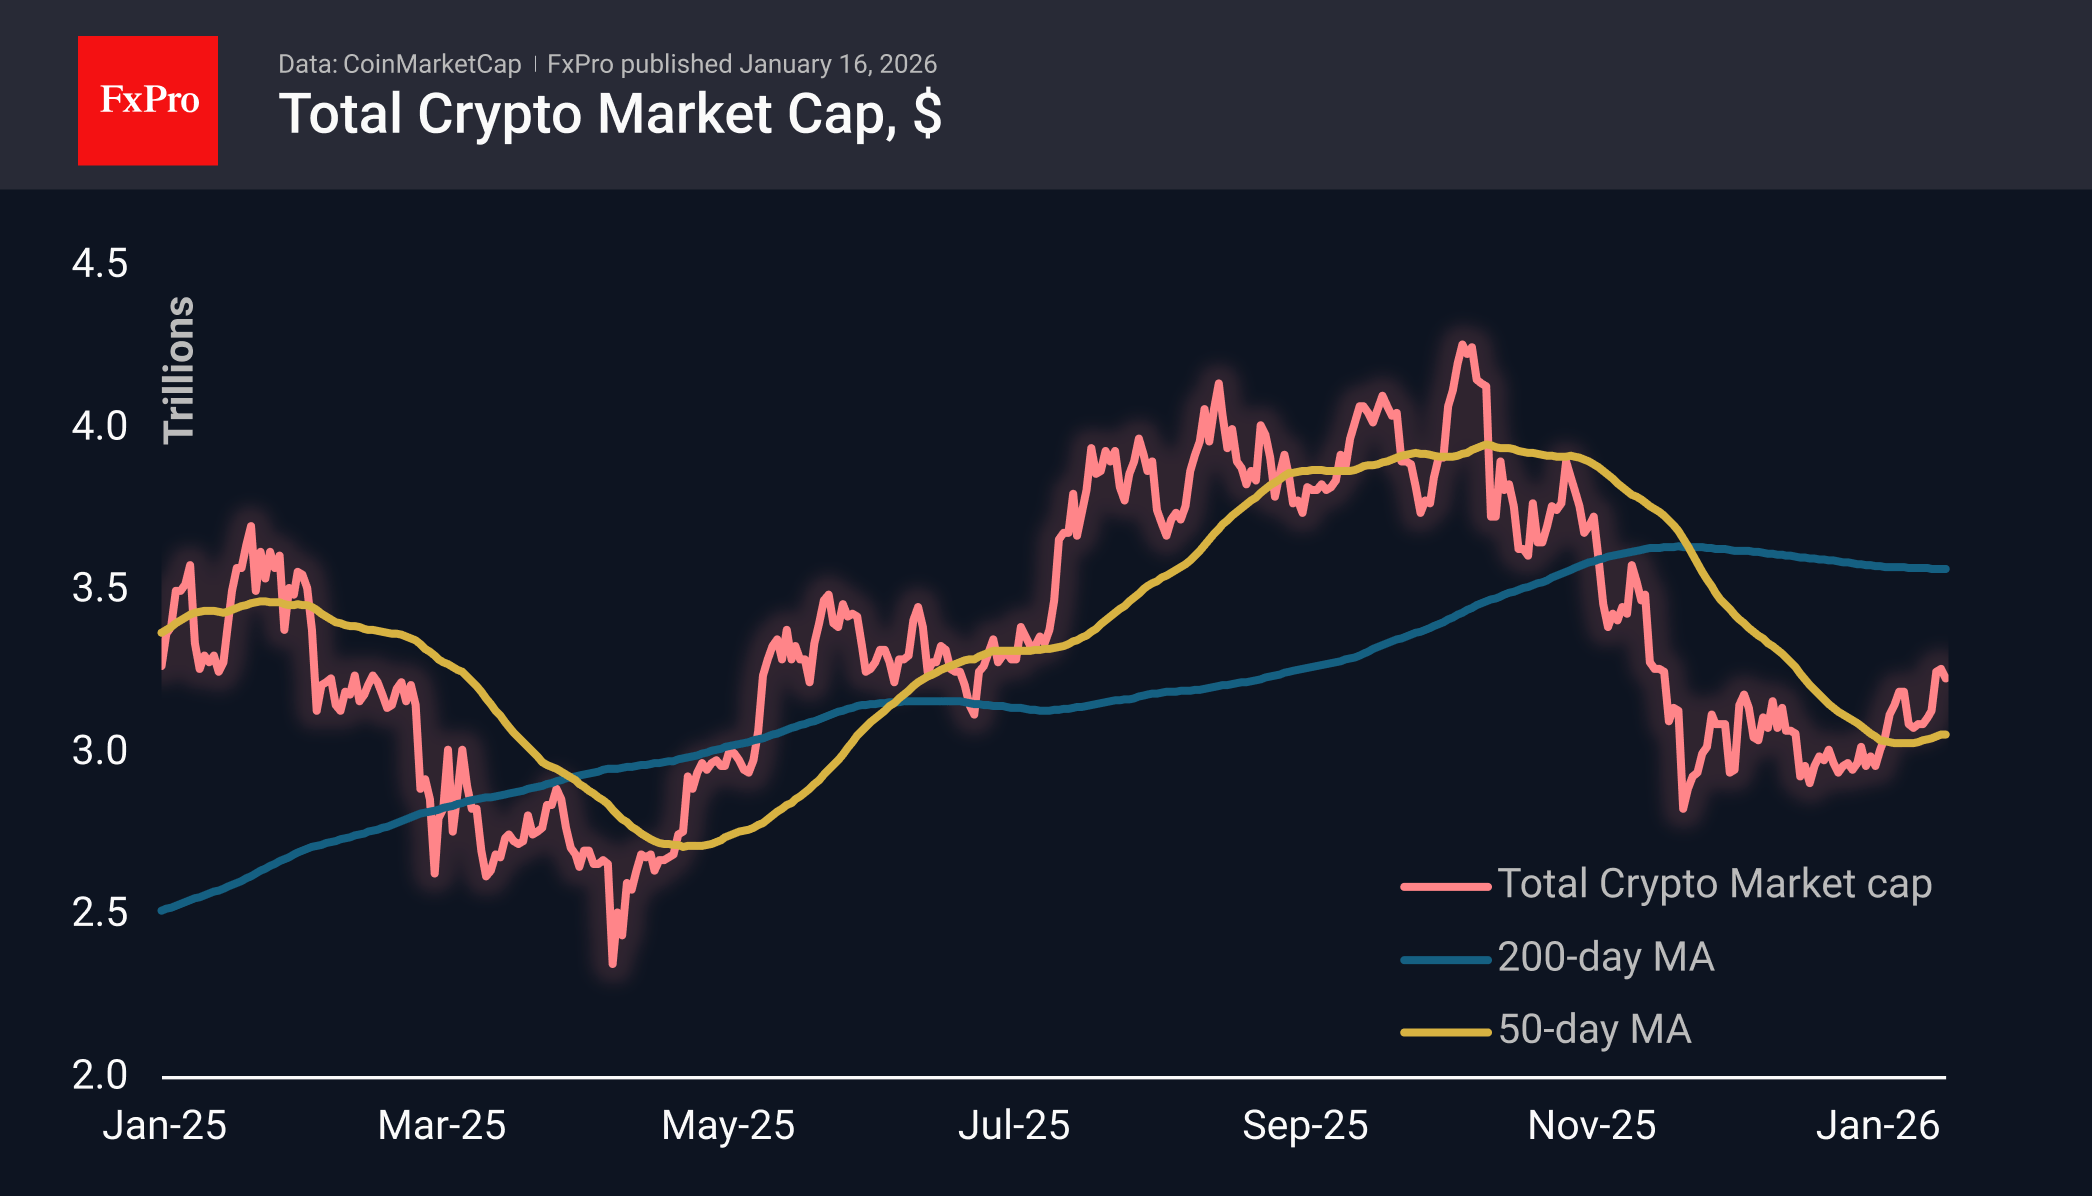
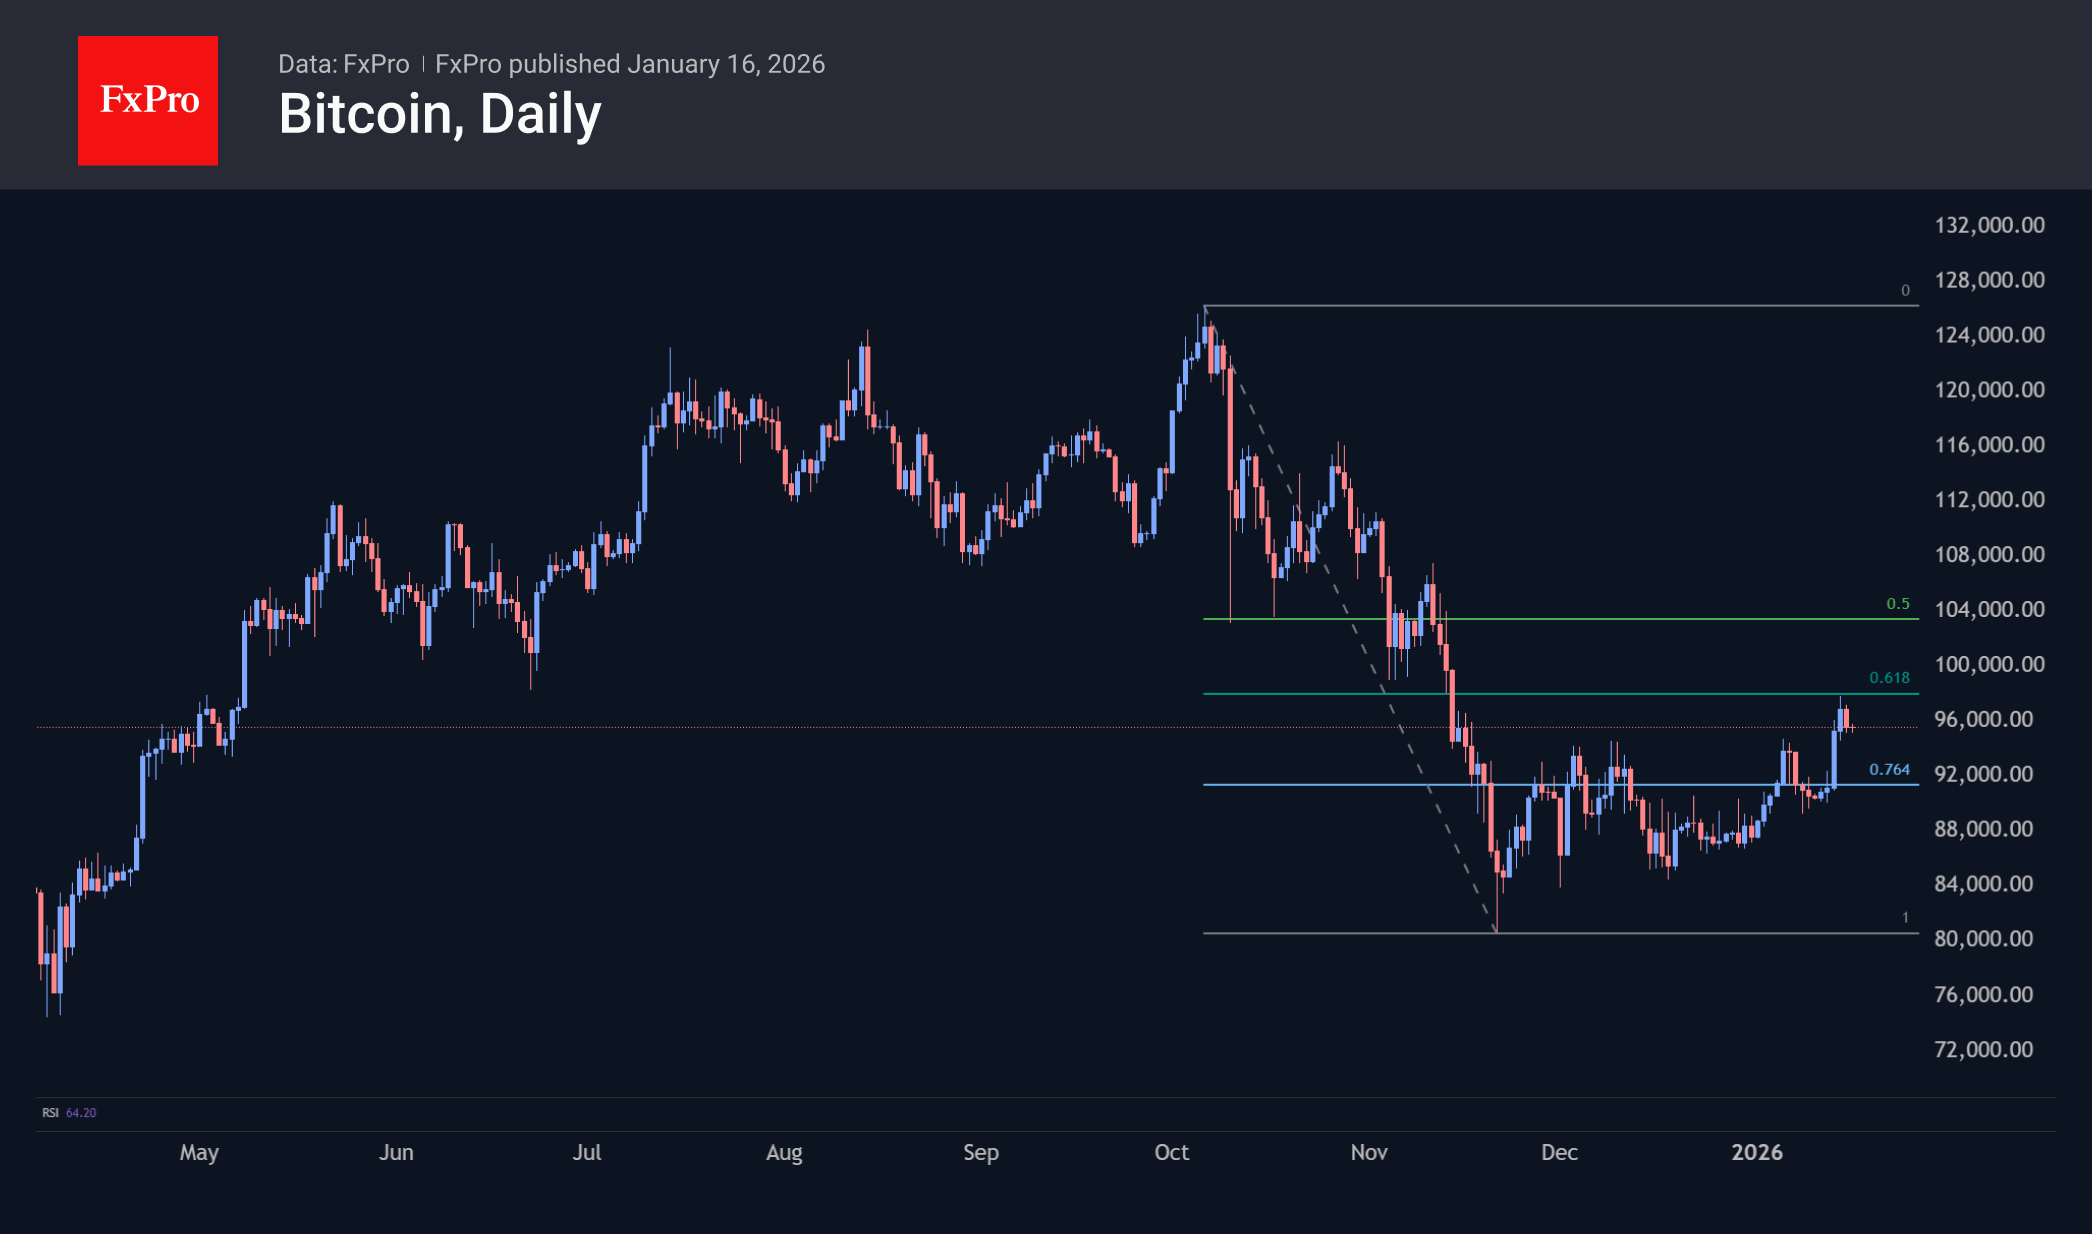
Bitcoin is trading near $95.5K, retreating from levels near $98K, where the 61.8% Fibonacci retracement level also passes. The first cryptocurrency has reached the retracement line, waiting for further momentum to determine its direction. No critical macroeconomic publications are scheduled for the near future, so BTC will have to follow the highly unpredictable geopolitics and market reaction to quarterly reports.
News Background
Over the past three days, more than 47,000 retail investors have left the market due to fear, doubt and uncertainty. The price rebound was supported by a seven-month low in the volume of bitcoins on exchanges, according to Santiment.
The dynamics of the Value Days Destroyed indicator suggest that long-term holders are refraining from taking profits despite the rise in prices. The current growth is based on fundamental market strength rather than speculation, according to CryptoQuant.
According to CoinGlass, the total open interest in Bitcoin derivatives on all exchanges is now 28% below its peak in early October. A large-scale ‘cleansing’ of the market from excessive leverage could signal a recovery for BTC.
Despite the optimism, the derivatives segment has not yet entered a full-fledged growth phase, according to Greeks Live.
The recent growth was caused by a short squeeze in the futures market amid low trading volumes, rather than an influx of fresh capital, according to Glassnode. Despite the local positive, the options market signals that risks remain.
The US Securities and Exchange Commission (SEC) has closed a case initiated in August 2023 against the non-profit organisation Zcash Foundation, which is behind the development of the private coin.
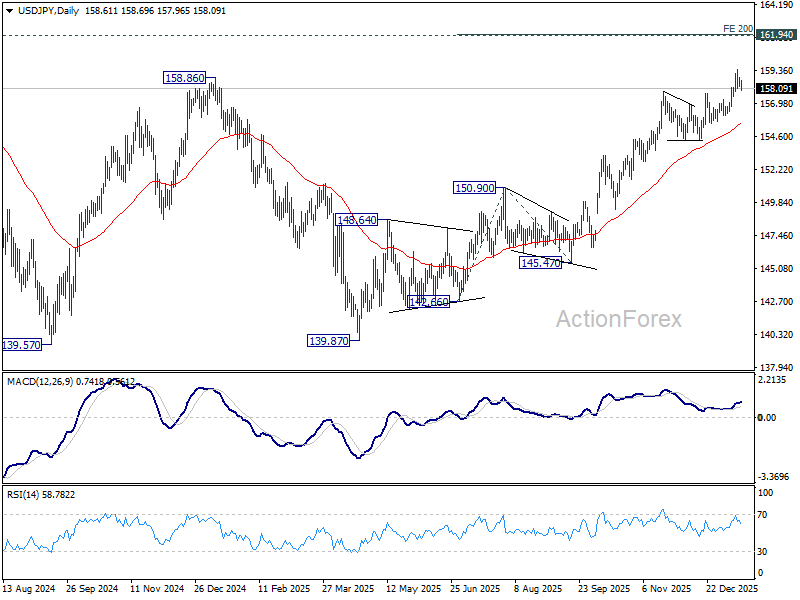
USD/JPY Daily Outlook
Daily Pivots: (S1) 158.26; (P) 158.57; (R1) 158.94; More...
USD/JPY's retreat from 159.44 extends lower today. Intraday bias remains neutral for the moment, and deeper fall could be seen. But downside should be contained above 156.10 support to bring another rally. On the upside, above 159.44 will resume larger rise from 139.87. Next target is 200% projection of 142.66 to 150.90 from 145.47 at 161.95, which is close to 161.94 high.
In the bigger picture, corrective pattern from 161.94 (2024 high) could have completed with three waves at 139.87. Larger up trend from 102.58 (2021 low) could be ready to resume through 161.94. Decisive break of 158.85 structural resistance will solidify this bullish case and target 161.94 for confirmation. On the downside, break of 154.38 support will dampen this bullish view and extend the corrective range pattern with another falling leg.