

Sample Category Title
WTI Oil Sinks as Iran Tensions Abate – Where to Look Now?
- Oil gives back its Iran-led premium as tensions abate
- Exploring Technical Analysis to see where things currently stand
- Looking at how any possible surprise could affect WTI prices
Prices were indeed reaching extremes. Yesterday's surge to $62 was met with a sharp, one-way correction back to the low $59s, with the commodity actually finishing the session lower by 1%.
The premium was built on the perception that a US intervention in Iran was imminent.
The movement of US Army assets from nearby bases, including Al-Udeid in Qatar, was seen as a concrete sign of incoming action, as these foreign bases could be targets for shorter-range Iranian missiles.
However, recent reports suggest that Gulf leaders—including those from Qatar, Saudi Arabia, and Oman—persuaded the US President to walk back his threats.
The compromise stems from US reluctance to get bogged down in a prolonged war if limited intervention fails to trigger regime change—a risk heavily emphasized by US strategic counselors.
Still, the revolts show no signs of easing. The pain for Iranian civilians is real, as they face the weakest Rial in history amidst extreme inflation, power and water outages, and record air pollution.
Looking at betting markets, this dynamic is far from over. Odds for an attack before the end of the month still hover around 30%.
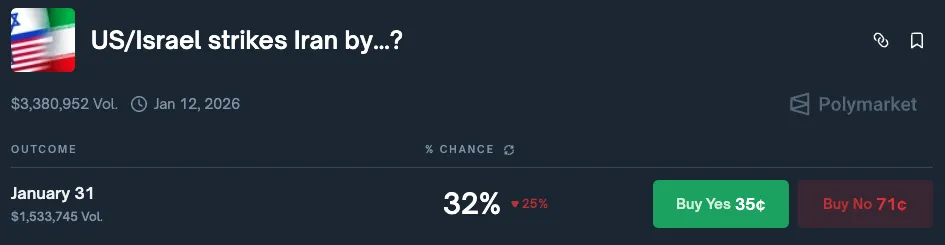
Betting Odds of a US intervention in Iran – Source: Polymarket
The Trump Admin calls for an emergency UN Security Council meeting regarding the issue. Keep a close eye on the headlines regarding such.
We will dive into a multi-timeframe analysis of the WTI (US) Oil to determine potential price levels in the event of an US intervention or lack thereof.
US Oil Intraday Timeframe Analysis
WTI 4H Chart and Technical Levels
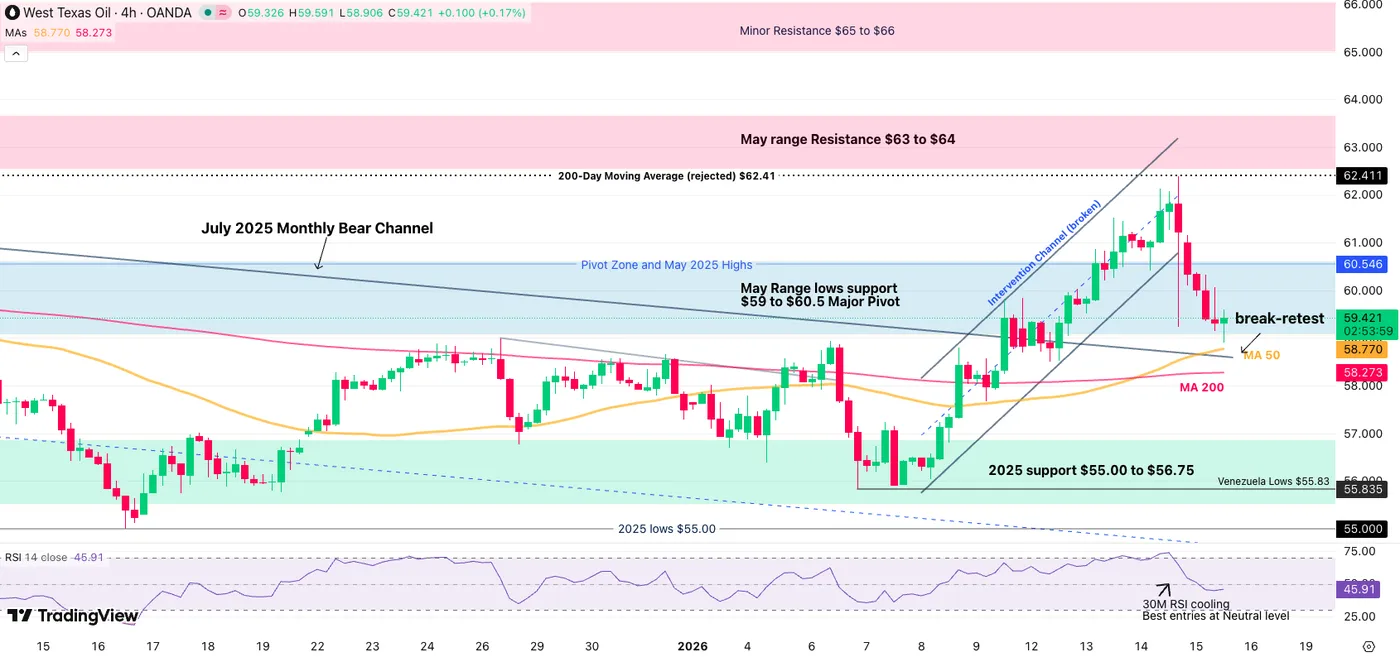
WTI Oil 4H Chart – January 15, 2026. Source: TradingView
After yesterday's scenario analysis, WTI prices did really respond to the 200-Day Moving Average at $62.40 as the dynamic for an immediate intervention stalled.
In event-based trading, it is essential to mark upper and lower bounds for scenarios; From yesterday's example:
- Breaking above the 200-Day MA implied heightened volatility expectations
- Rejecting it would mean lower tensions
So where are we today?
Having broken the upward impulse, the premium unwinding is leading to the immediate retest of the July Monthly Bear Channel which provides support and a lower bound for action.
- Holding the channel highs ($58.50 to $59.30) implies that traders still haven't given up entirely on the event
- Breaking below (re-entering the bear channel), translates into an intervention that is not a high-probability event anymore.
- Any surprise rally above yesterday's highs ($62.41), particularly on high volume and pace, is a trigger to know that the hammer is going down.
WTI Technical Levels
Levels to place on your WTI charts:
Resistance Levels
- $60.50 Pivot Zone top
- $62.40 Past day highs (Above mean tensions)
- Resistance May 2025 Range $63 to $64
- Key September Resistance $65 to $66
Support Levels
- $58.50 to $59.30 Break-Retest Zone at Bear Channel Highs (+ 4H 50-MA)
- $57.70 Friday lows mini support
- Venezuela Lows $55.83
- $55 to $56.50 2025 Support and Channel lows
30M Chart and Trading Setups
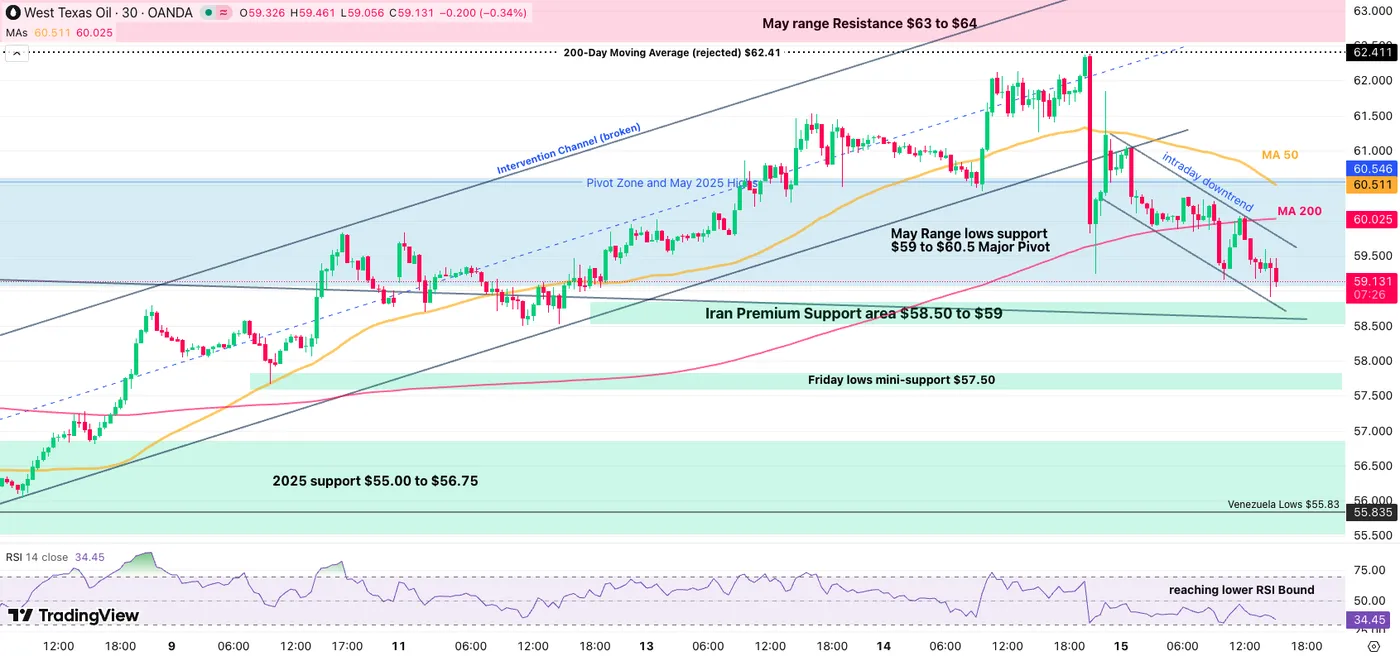
WTI Oil 30M Chart – January 15, 2026. Source: TradingView
Looking closer to short-timeframes, the premium is progressively decreasing in a downward intraday trend – A small bear channel.
Breaking below the Iran Premium Support area $58.50 to $59 would be the final level to assume that the event is fully done.
However, breaking above the intraday channel however doesn't necessarily mean that the event is fully back: It will depend on the pace of the breakout.
- With traders exposing themselves again as prices correct, plus a technical break-retest, a rebound here would not be surprising.
- A slow grind higher could establish a range to $60.50
- A sudden explosion higher however confirms that things are heating up
- In the event of a breakout above the previous day highs, WTI prices could easily go between $65 (conservative) to $80 for the most extreme case.
- Holding the channel to break below the support would lead to a re-entering of the July bear channel.
Safe Trades and Stay in Touch with the Latest News!
Goolsbee warns Fed independence under threat risks inflation surge
Chicago Fed President Austan Goolsbee delivered a blunt warning on central bank independence, saying any attempt to undermine the Fed would have severe economic consequences. “Anything that’s infringing or attacking the independence of the central bank is a mess,” he told CNBC.
Goolsbee cautioned that political interference in monetary policy would almost certainly reignite inflation pressures. “You’re going to get inflation come roaring back if you try to take away the independence of the central bank,” he said.
Drawing an international comparison, Goolsbee noted that criminal investigations targeting central banks are typically seen in countries such as Zimbabwe, Russia, and Turkey. He said these examples are not ones “you would characterize as advanced economies”.
Fed’s Bostic: Strong economy warrants restrictive policy
Atlanta Fed President Raphael Bostic reiterated today that the Federal Reserve needs to keep policy restrictive to address inflation that remains above target. While acknowledging that the labor market has loosened over the past year, Bostic said an unemployment rate of 4.4% still reflects a strong employment backdrop.
Bostic said he expects US GDP growth “north of 2%” this year, adding that growth in the mid-2% range would not surprise him. From a historical perspective, he described that pace as “incredibly strong,” arguing that the US economy continues to operate above its "long-run potential" and that this momentum should extend into 2026.
He attributed the outlook to resilient consumer, stronger household balance sheets than before the pandemic, and policy support from last year’s tax bill. With growth that firm, Bostic warned price pressures are likely to persist, noting that inflation risks extend beyond tariffs to areas such as medical insurance.
Sunset Market Commentary
Markets
Some of the largest intraday market moves were to be found in commodities. For starters, oil. The black gold slides from prices just south of $67 yesterday to $63.7 per barrel today (4.5%), snapping a five day winning streak. Losses followed on reports that president Trump received assurances that the killing of Iranian protesters is stopping. Markets concluded military action by the US in Iran, thereby potentially disrupting oil flows, is now less likely. It’s highly uncertain whether such military escalation is indeed off the table with Trump prior to the B2-bomber attacks last summer having created a smokescreen too. Gold loses some modest ground (-0.7%) to sub $4600/ounce, perhaps linked to this geopolitical de-escalation. Silver prices drop back below $90 (-4.7%), again on Trump-news that the president doesn’t plan to impose tariffs on critical metals, including silver but also platinum (-3%). Instead the president floated the idea of price floors. Both gold & silver (and platinum for that matter) remain near historical highs though. We’re seeing other metals catching a breather as well after rallying at breakneck pace for reasons varying from a general preference for hard assets that are limited in supply (dollar debasement trade) to high demand linked to AI and the electrification. Copper (-2.5%), nickel (-4%) or zinc (-3% intraday move) all slip.
The bull flattening in FI yesterday made way for some bear flattening today. Core bond yields rise 0.1-2.3 bps in Germany and 0.5-4 bps in the US. Treasuries started underperforming (at the front) following a sub 200k jobless claims print, which was the second lowest in two years. It strengthens last week’s payrolls message that the labour market is not dramatically deteriorating, or in any case not as much that it requires further rate cuts in the short run (ie next week). Other second-tier US data was strong too with both the Empire Manufacturing and Philly Fed Business Outlook indicators rebounding much more than expected (to 7.7 and 12.6 respectively from -3.9 and -10.2). Germany meanwhile posted its first annual GDP growth since 2022 as the effects of its spending spree begin to unfold. Private & government consumption rose by 1.4% and 1.5% respectively. UK yields added 2.4-3.7 bps across the curve with industrial production, services activity and the monthly GDP indicator are topping estimates. It failed to help sterling though. EUR/GBP appreciates to 0.867. The US dollar strengthens against most G10 peers. EUR/USD drops to 1.1607, the lowest in a month. DXY is nearing a first resistance around 99.51 (23.6% recovery on the 2025 decline). JPY is unimpressed by a Bloomberg report that’s citing people familiar with the matter that the BoJ pays increasing attention to the weak yen’s potential impact on inflation. While the sources don’t expect a rate hike this month, it could impact policy going forward. USD/JPY is filling bids around 158.77. Strong earnings from Taiwan’s TSMC rekindles AI optimism, leading the Nasdaq to almost fully recover yesterday’s 1% loss at the open today.
News & Views
The Peoples Bank of China today announced that it will cut interest rate on its structural monetary policy tools by 25 bps starting on Monday. The rate on one year loans will be reduced to 1.25%. The move eases financing conditions for specific sectors in the economy rather than a broad monetary easing. The bank also announced that it will expand a relending programme for tech innovation and provide additional financing facilities for the agricultural sector and small private firms. During a briefing, Deputy governor Zou Lan indicated that there is room for the PBOC to cut its policy rate and the reserve requirement ratio (RRR) later this year. Maybe considerations on financial stability (including on stock market valuations) were a reason for the bank not the ease policy on a broader scale. On the yuan, the deputy governor indicated that yuan is currently evaluated as being stable an is no constraint for interest rate cuts. The recent decline in the USD/CNY rate was seen as driven by USD weakness. After some intraday volatility, the yuan again trades near the strongest levels since May 2023 (6.97 area).
German IFO sentiment on the construction sector turned more gloomy at the end of 2025. The index declined from -19.3 to -20.6. Companies assessed their current situation and expectations for the coming months as worse. Ifo commented that “Residential construction can’t quite make any headway”. The share of residential construction companies reporting too few orders rose further to 47.7%. Companies also reported higher cancelations (11% to 11.5%.). The gloomy outcome comes even as residential building permits have been rising recently. However it takes time for this to translate into actual orders.
XAU/USD: Gold Eases on Calmer Geopolitical Situation, But Larger Bulls Hold Grip
Gold price edged lower on Thursday after hitting a series of new marginally higher highs in past three days ($4630/34/43).
Today’s calmer rhetoric from President Trump over Iran crisis and conflict with Fed Chief Powell, cooled the sentiment and paused recent rally for now.
Trump opted for wait and see strategy instead of military action in Iran, as he initially signaled and sidelined the story about removing Powell from his position before his mandate ends in May.
However, overall picture remains bullish, with no significant changes in the key factors that drive metal’s price, suggesting that bulls may take some time for consolidation before resuming.
Today’s dip was so far limited, with price holding above $4600 after a brief dip to $4581, although overbought daily studies (also RSI bearish divergence), keep the downside vulnerable.
First significant supports lay at $4550 (former top / broken bull-channel upper line), followed by $ 4500 zone (psychological / 10DMA / Fibo 38.2% of $4274/$4643 upleg) where extended dips should find firm ground.
Res: 4643; 4687; 4700; 4720.
Sup: 4581; 4550; 4500; 4458.
USD/CHF Mid-Day Outlook
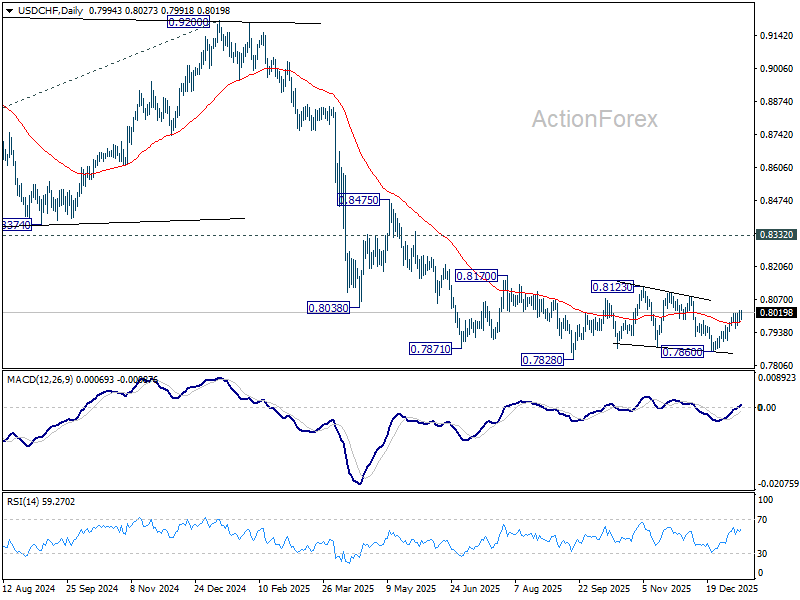
Daily Pivots: (S1) 0.7980; (P) 0.8004; (R1) 0.8024; More….
USD?CHF"s rise from 0.7860 is still in progress. Intraday bias stays on the upside for 0.8123 resistance. On the downside, below 0.7983 minor support will turn intraday bias neutral again first. Overall, corrective pattern from 0.7828 low is in progress and would extend further.
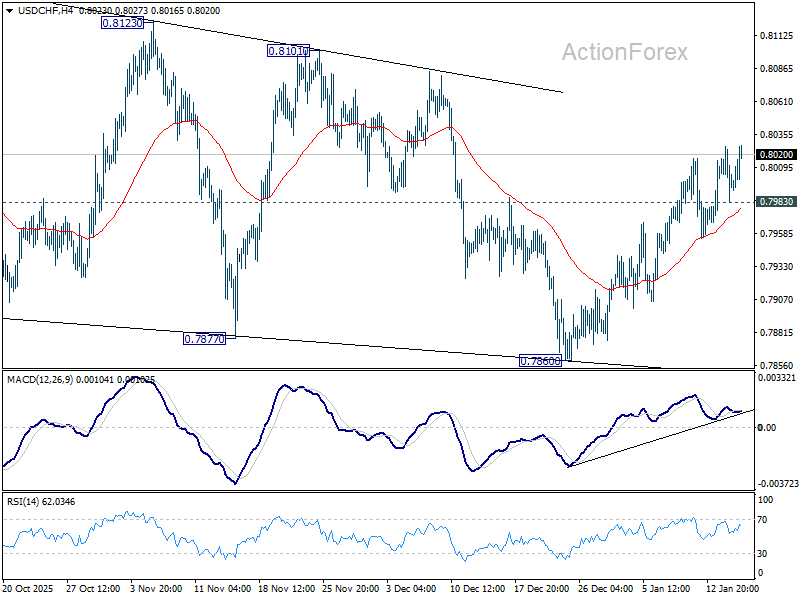
In the bigger picture, price actions from 0.7828 are seen as a correction. Larger down trend from 1.0342 (2017 high) is in still in progress. Break of 0.7828 will target 100% projection of 1.0146 (2022 high) to 0.8332 from 0.9200 at 0.7382. In any case, outlook will stay bearish as long as 0.8332 support turned resistance holds (2023 low).
USD/JPY Mid-Day Outlook
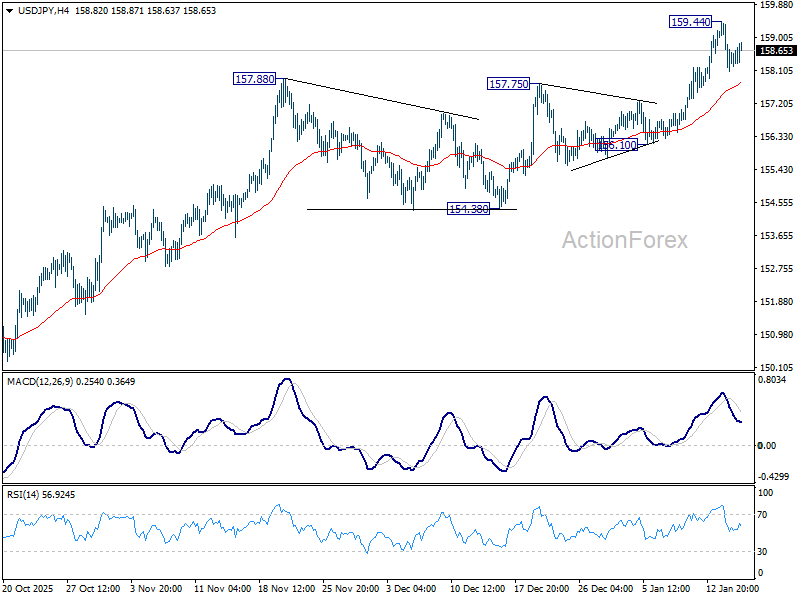
Daily Pivots: (S1) 157.87; (P) 158.66; (R1) 159.23; More...
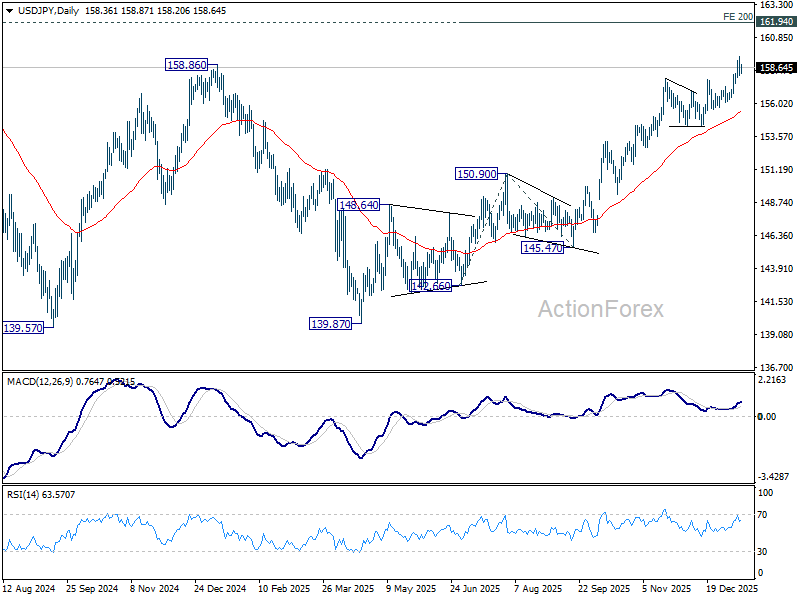
Intraday bias in USD/JPY remains neutral and more consolidations could be seen below 159.44. Deeper retreat could be seen but downside should be contained above 156.10 support to bring another rally. On the upside, above 159.44 will resume larger rise from 139.87. Next target is 200% projection of 142.66 to 150.90 from 145.47 at 161.95, which is close to 161.94 high.
In the bigger picture, corrective pattern from 161.94 (2024 high) could have completed with three waves at 139.87. Larger up trend from 102.58 (2021 low) could be ready to resume through 161.94. Decisive break of 158.85 structural resistance will solidify this bullish case and target 161.94 for confirmation. On the downside, break of 154.38 support will dampen this bullish view and extend the corrective range pattern with another falling leg.
GBP/USD Mid-Day Outlook
Daily Pivots: (S1) 1.3423; (P) 1.3443; (R1) 1.3467; More...
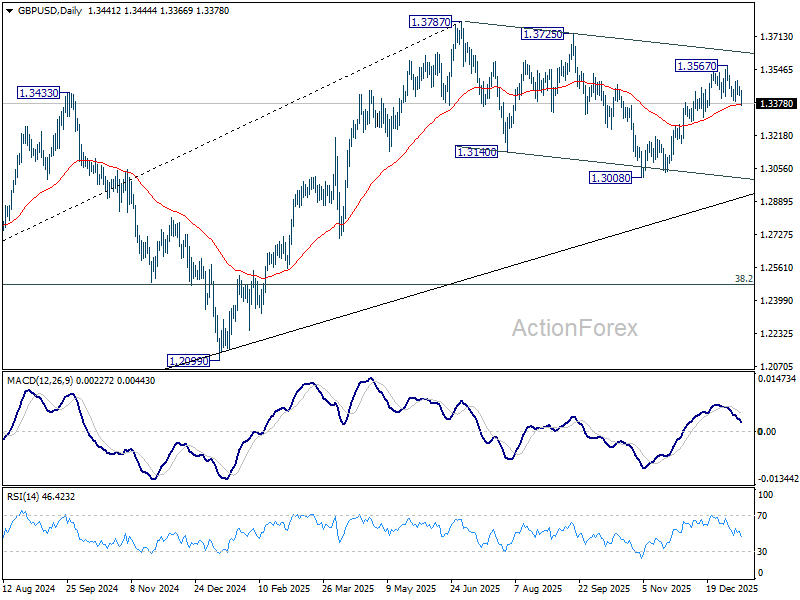
GBP/USD's fall from 1.3567 resumed by breaking through 1.3389 temporary low and intraday bias is back on the downside. Sustained break of 55 D EMA (now at 1.3375) will argue that the decline is another falling leg in the corrective pattern from 1.3787. In this case, deeper fall should be seen back to 1.3008 support. For now, risk will stay on the downside as long as 1.3494 resistance holds, in case of recovery.
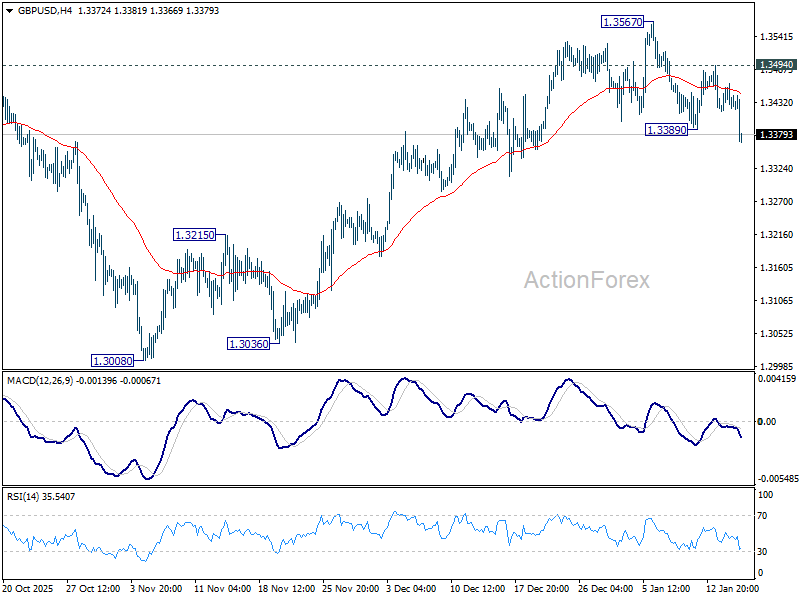
In the bigger picture, price actions from 1.3787 (2025 high) are seen as a correction to the larger up trend from 1.3051 (2022 low). Deeper decline could be seen as the pattern extends, but downside should be contained by 38.2% retracement of 1.0351 to 1.3787 at 1.2474 to bring rebound. Break of 1.3787 for up trend resumption is expected at a later stage.
EUR/USD Mid-Day Outlook
Daily Pivots: (S1) 1.1633; (P) 1.1648; (R1) 1.1659; More….
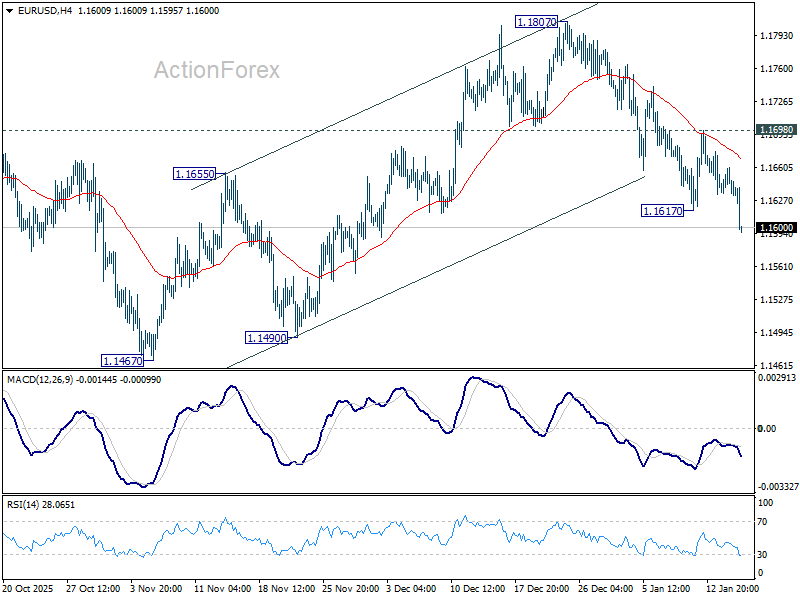
EUR/USD's fall from 1.1807 resumed by breaking through 1.1617 temporary low and intraday bias is back on the downside. Current development revived the case that corrective pattern from 1.1917 is already in its third leg. Deeper fall would be seen to 1.1467 support and below. Risk will now stay on the downside as long as 1.1698 resistance holds, in case of recovery.
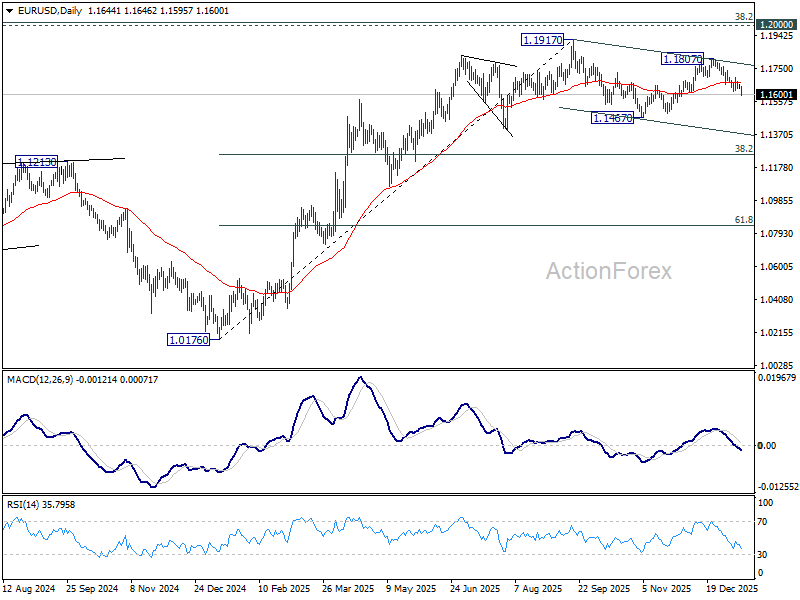
In the bigger picture, as long as 55 W EMA (now at 1.1416) holds, up trend from 0.9534 (2022 low) is still in favor to continue. Decisive break of 1.2 key psychological level will carry larger bullish implication. However, sustained trading below 55 W EMA will argue that rise from 0.9534 has completed as a three wave corrective bounce, and keep long term outlook bearish.
Dollar Surges, Fed Cut Bets Slide, as Jobless Claims Drop Below Key 200k Mark
Dollar climbed sharply in early US session as markets continued to pare back bets on a Fed rate cut in Q1 2026, a move driven by stronger-than-expected labor market data. Initial jobless claims fell back below the psychological 200k mark, countering dovish concerns about extended labor-market deterioration.
Odds of a March rate cut have collapsed further to below 22%. Also, markets now see roughly a two-in-three chance that a rate cut will occur by the end of the first half — down sharply from near 80% just a week ago. The first easing move might come only after a leadership transition at the Fed.
Across FX markets today so far, Dollar is the best performer, followed by Aussie and Loonie. Sterling is struggling the most amid benign UK data that hasn’t materially lifted the Pound, with Euro and Swiss Franc also lagging. Yen and Kiwi sit in the middle of the performance table.
Elsewhere in commodities, oil prices tumbled from multi-month highs after US President Donald Trump’s remarks eased fears of imminent US military action against Iran, a catalyst that had recently underpinned energy markets. Adding to the supply picture, Venezuelan crude shipments have resumed. That supply increase is seen contributing to the sentiment that near-term oversupply risks would outweigh geopolitical pressures, keeping a lid on prices.
In Europe, at the time of writing, FTSE is up 0.47%. DAX is up 0.02%. CAC is down -0.18%. UK 10-year yield is up 0.036 at 4.38. Germany 10-year is up 0.011 at 2.829. Earlier in Asia, Nikkei fell -0.42%. Hong Kong HSI fell -0.28%. China Shanghai SSE fell -0.33%. Singapore Strait Times rose 0.43%. Japan 10-year JGB yield fell -0.017 to 2.169.
US initial jobless claims fall to 198k, signal little labor market stress
US labor market conditions showed renewed firmness, with initial jobless claims falling more than expected in the latest week. Claims dropped by -9k to 198k in the week ending January 10, below expectations of 208k and marking one of the lowest readings of the past year.
The four-week moving average of initial claims declined by -6.5k to 205k, the lowest level since January 20, 2024. The smoothing measure confirms that layoffs remain limited, with little evidence of sustained deterioration in hiring conditions.
Continuing claims also edged lower, falling 19k to 1.884 million in the week ending January 3. The four-week average was broadly unchanged at 1.889 million.
Eurozone exports fall -3.4% yoy in Nov, EU down -4.4%, external demand drags
Eurozone trade data for November pointed to weakening external demand, even as the bloc maintained a modest surplus. Goods exports fell -3.4% yoy to EUR 240.2B, while imports declined -1.3% to EUR 230.3B, leaving a trade surplus of EUR 9.9B. The resilience came from within the bloc. Intra-Eurozone trade rose 0.8% yoy to EUR 220.9B, partially offsetting softness in extra-Eurozone flows.
At the broader EU level, goods exports dropped -4.4% yoy to EUR 213.8B and imports fell -2.9% to EUR 205.7B, resulting in a EUR 8.1B trade surplus.
By trading partner, exports to the US fell sharply by -20.3% year-on-year, while shipments to the UK declined -6.0%. Trade with China was broadly stable, with exports down just -1.2% despite stronger imports, keeping the bilateral deficit large. Switzerland stood out as a relative bright spot, with EU exports rising 6.7%.
Eurozone industrial output rises 0.7% mom in November, led by capital goods
Eurozone industrial production rose 0.7% mom in November, outperforming expectations for a 0.5% gain. The gains, however, were uneven across categories.
Capital goods output jumped 2.8%, providing the main lift, while intermediate goods rose a modest 0.3%. By contrast, energy production fell sharply by -2.2%, while durable and non-durable consumer goods declined -1.3% and -0.6% respectively, pointing to still-soft consumer demand.
Across the wider EU, industrial production increased just 0.2% on the month. Estonia (6.0%), Lithuania (5.8%), and Czechia (2.8%) recorded the strongest gains, while Luxembourg (-7.3%), Denmark (-5.1%), and Portugal (-3.0%) posted the steepest declines.
UK GDP beats with 0.3% mom growth in November, services lead
UK economic output surprised to the upside in November, offering a modest boost to the growth outlook late in the year. GDP rose 0.3% mom, beating expectations for flat growth, with strength concentrated in services and production.
Services output increased 0.3% mom, while production jumped 1.1% mom, offsetting a sharp -1.3% mom decline in construction activity. The data points to improving momentum in consumer- and business-facing sectors, even as construction continues to struggle.
Over the three months to November, GDP edged up 0.1%. Services grew 0.2%, while production slipped -0.1% due largely to weaker motor vehicle manufacturing, and construction fell -1.1%. On a year-on-year basis, GDP expanded 1.3%, led by services growth of 1.4%. Production rose 0.4% and construction rose 0.7%.
EUR/USD Mid-Day Outlook
Daily Pivots: (S1) 1.1633; (P) 1.1648; (R1) 1.1659; More….
EUR/USD's fall from 1.1807 resumed by breaking through 1.1617 temporary low and intraday bias is back on the downside. Current development revived the case that corrective pattern from 1.1917 is already in its third leg. Deeper fall would be seen to 1.1467 support and below. Risk will now stay on the downside as long as 1.1698 resistance holds, in case of recovery.
In the bigger picture, as long as 55 W EMA (now at 1.1416) holds, up trend from 0.9534 (2022 low) is still in favor to continue. Decisive break of 1.2 key psychological level will carry larger bullish implication. However, sustained trading below 55 W EMA will argue that rise from 0.9534 has completed as a three wave corrective bounce, and keep long term outlook bearish.