Sample Category Title
Fed: Beige Book Points to Improved Economic Activity During the Holiday Period
Today's Beige Book showed that the overall economic activity improved during the latest reporting period (information collected on or before January 5th 2026). Across the twelve Fed Districts, eight Districts reported slight-to-modest growth (up from one in November), one noted a modest decline (down from two in November), and the remaining three saw no change (down from nine in November). The report noted that this performance marks an improvement from the previous three report cycles where majority of Districts reported no change. Some of the rebound in activity at the end the 2025 is likely due to the ending of the government shutdown.
Most districts reported "slight to modest growth" in consumer spending. The report also noted the K-shaped nature of the consumer spending with stronger spending among higher-income consumers, and increased price sensitivity and hesitancy to spend by low- and middle-income consumers. Residential real estate activity softened in most Districts, which runs counter to existing home sales data, which shows a pickup in sales in recent months.
Banking conditions were said to be "stable or improving", with increased credit demand for home equity loans, credit cards, and commercial loans.
The labor market remained stable, with employment mostly unchanged. This is consistent with the modest pace of hiring in November and December. Firms were reported to rely more on temporary workers "to stay flexible in uncertain times" and were mostly backfilling vacancies rather than creating new positions. Encouragingly, even as many firms were exploring AI implementation, the report notes that "AI's current impact on employment was limited" with more significant effects expected in the coming years. Wage growth was moderate, returning to "normal" levels as labor market cooled off.
There was little change on the inflation front. Prices grew at a moderate pace, unchanged relative to the previous reporting period. Cost pressure due to tariffs also remained a consistent theme across Districts. Some firms were starting to pass higher costs via higher prices to consumers, but others – particularly in retail and restaurant industries – were hesitant to do so for the fear of alienating price-sensitive consumers.
Key Implications
The anecdotal evidence from today's Beige Book report points to a rebound in economic activity at the end of last year as the government reopened. Recent economic data also suggests that the impact of the lengthy government shutdown was smaller than feared. Recent reports on retail sales, inflation and employment have been encouraging, painting a picture of relative resilience across key economic indicators during the turbulent fourth quarter.
Taken together with other economic data points, today's report provides policymakers with further reassurance that the economy stabilized at the end of the year while price pressures remained contained. This supports the case for a "pause" on rate cuts until the summer.
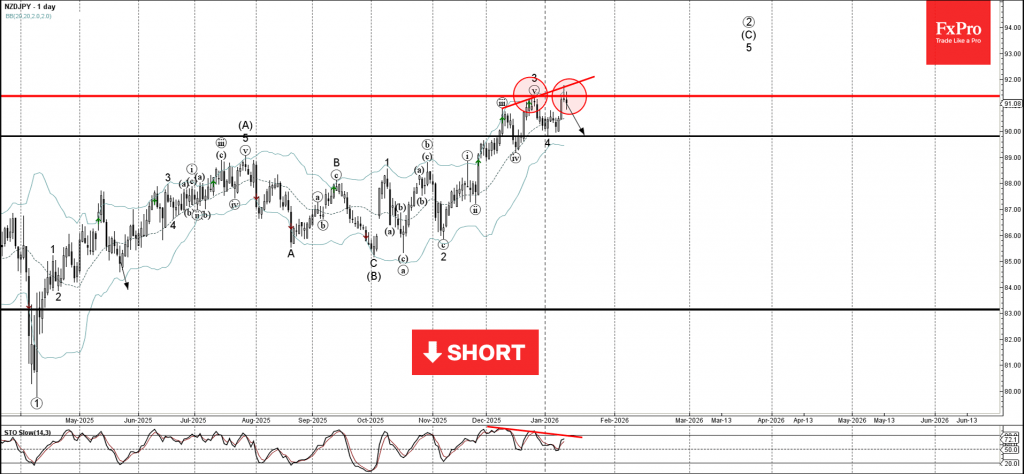
NZDJPY Wave Analysis
NZDJPY: ⬇️ Sell
- NZDJPY reversed down from the resistance area
- Likely to fall to support level 90.00
NZDJPY currency pair recently reversed down from the resistance area between the pivotal resistance level 91.35 (which stopped the previous impulse wave 3 at the end of December) and the upper daily Bollinger Band.
The downward reversal from this resistance area created the daily Japanese candlesticks reversal pattern Shooting Star Doji.
Given the strength of the resistance level 91.35 and the bearish divergence on the daily Stochastic, NZDJPY currency pair cryptocurrency can be expected to fall to the next support level 90.00 (which reversed the previous correction 4).
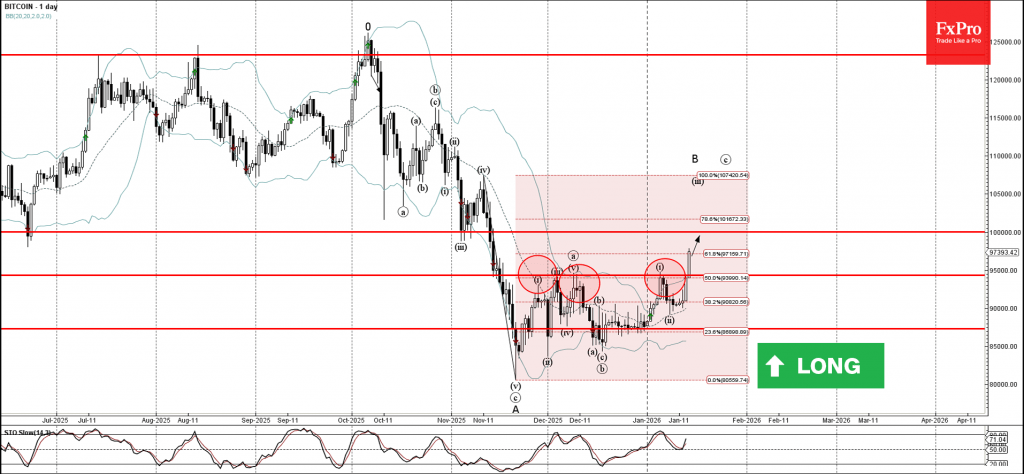
Bitcoin Wave Analysis
Bitcoin: ⬆️ Buy
- Bitcoin broke resistance area
- Likely to rise to resistance level 100000.00
Bitcoin cryptocurrency recently broke the resistance area between the pivotal resistance level 95000.00 (which has been reversing the price from November) and the 50% Fibonacci correction of the downward impulse from November.
The breakout of this resistance area accelerated the active impulse wave iii – which belongs to the medium-term impulse wave B from November.
Bitcoin cryptocurrency can be expected to rise to the next major resistance level 100000.00 (former support from June and November).
Eco Data 1/15/26
| GMT | Ccy | Events | Act | Cons | Prev | Rev |
|---|---|---|---|---|---|---|
| 23:50 | JPY | PPI Y/Y Dec | 2.40% | 2.40% | 2.70% | |
| 00:00 | AUD | Consumer Inflation Expectations Jan | 4.60% | 4.70% | ||
| 07:00 | GBP | GDP M/M Nov | 0.30% | 0.00% | -0.10% | |
| 07:00 | GBP | Manufacturing Production M/M Nov | 2.10% | 0.50% | 0.50% | 0.40% |
| 07:00 | GBP | Manufacturing Production Y/Y Nov | 2.10% | -0.30% | -0.80% | -0.20% |
| 07:00 | GBP | Industrial Production M/M Nov | 1.10% | 0.10% | 1.10% | 1.30% |
| 07:00 | GBP | Industrial Production Y/Y Nov | 2.30% | -0.80% | -0.80% | 0.40% |
| 07:00 | GBP | Goods Trade Balance (GBP) Nov | -23.7B | -20.4B | -22.5B | |
| 10:00 | EUR | Eurozone Trade Balance (EUR) Nov | 10.7B | 15.2B | 14.0B | 13.7B |
| 10:00 | EUR | Eurozone Industrial Production M/M Nov | 0.70% | 0.50% | 0.80% | 0.70% |
| 13:30 | CAD | Manufacturing Sales M/M Nov | -1.20% | -1.10% | -1% | |
| 13:30 | CAD | Wholesales Sales M/M Nov | -1.80% | 0.10% | 0.10% | 0.40% |
| 13:30 | USD | Initial Jobless Claims (Jan 9) | 198K | 208K | 208K | 207K |
| 13:30 | USD | Empire State Manufacturing Jan | 7.7 | 1 | -3.9 | |
| 13:30 | USD | Philadelphia Fed Manufacturing Jan | 12.6 | -5 | -10.2 | |
| 13:30 | USD | Import Price Index M/M Nov | 0.40% | -0.20% | 0.00% | |
| 15:30 | USD | Natural Gas Storage (Jan 9) | -71B | -89B | -119B |
| 23:50 | JPY |
| PPI Y/Y Dec | |
| Actual | 2.40% |
| Consensus | 2.40% |
| Previous | 2.70% |
| 00:00 | AUD |
| Consumer Inflation Expectations Jan | |
| Actual | 4.60% |
| Consensus | |
| Previous | 4.70% |
| 07:00 | GBP |
| GDP M/M Nov | |
| Actual | 0.30% |
| Consensus | 0.00% |
| Previous | -0.10% |
| 07:00 | GBP |
| Manufacturing Production M/M Nov | |
| Actual | 2.10% |
| Consensus | 0.50% |
| Previous | 0.50% |
| Revised | 0.40% |
| 07:00 | GBP |
| Manufacturing Production Y/Y Nov | |
| Actual | 2.10% |
| Consensus | -0.30% |
| Previous | -0.80% |
| Revised | -0.20% |
| 07:00 | GBP |
| Industrial Production M/M Nov | |
| Actual | 1.10% |
| Consensus | 0.10% |
| Previous | 1.10% |
| Revised | 1.30% |
| 07:00 | GBP |
| Industrial Production Y/Y Nov | |
| Actual | 2.30% |
| Consensus | -0.80% |
| Previous | -0.80% |
| Revised | 0.40% |
| 07:00 | GBP |
| Goods Trade Balance (GBP) Nov | |
| Actual | -23.7B |
| Consensus | -20.4B |
| Previous | -22.5B |
| 10:00 | EUR |
| Eurozone Trade Balance (EUR) Nov | |
| Actual | 10.7B |
| Consensus | 15.2B |
| Previous | 14.0B |
| Revised | 13.7B |
| 10:00 | EUR |
| Eurozone Industrial Production M/M Nov | |
| Actual | 0.70% |
| Consensus | 0.50% |
| Previous | 0.80% |
| Revised | 0.70% |
| 13:30 | CAD |
| Manufacturing Sales M/M Nov | |
| Actual | -1.20% |
| Consensus | -1.10% |
| Previous | -1% |
| 13:30 | CAD |
| Wholesales Sales M/M Nov | |
| Actual | -1.80% |
| Consensus | 0.10% |
| Previous | 0.10% |
| Revised | 0.40% |
| 13:30 | USD |
| Initial Jobless Claims (Jan 9) | |
| Actual | 198K |
| Consensus | 208K |
| Previous | 208K |
| Revised | 207K |
| 13:30 | USD |
| Empire State Manufacturing Jan | |
| Actual | 7.7 |
| Consensus | 1 |
| Previous | -3.9 |
| 13:30 | USD |
| Philadelphia Fed Manufacturing Jan | |
| Actual | 12.6 |
| Consensus | -5 |
| Previous | -10.2 |
| 13:30 | USD |
| Import Price Index M/M Nov | |
| Actual | 0.40% |
| Consensus | -0.20% |
| Previous | 0.00% |
| 15:30 | USD |
| Natural Gas Storage (Jan 9) | |
| Actual | -71B |
| Consensus | -89B |
| Previous | -119B |
Fed’s Beige Book signals steady jobs, moderating price pressures
The latest Beige Book from the Fed showed US economic activity improving modestly, with eight of twelve Districts reporting growth at a "slight to modest pace". Three Districts saw no change and one reported a modest decline, marking a better backdrop than recent cycles where stagnation dominated.
Consumer spending firmed modestly, supported by the holiday shopping season, while business activity presented a mixed picture. Manufacturing remained uneven, with five Districts reporting growth and six citing contraction.
Labor market conditions were "mostly unchanged". Eight Districts reported flat hiring, though multiple contacts noted increased use of temporary workers as firms seek flexibility amid uncertainty. Wage growth continued at a "moderate pace", with several businesses saying wage pressures have normalized.
Price pressures remained elevated, rising at a moderate pace across most Districts. Tariff-related cost increases were a common theme, and while firms expect "some moderation in price growth ahead", many anticipate prices will stay high as they pass through accumulated cost increases.
US Stocks Plummet as Iran Tensions Mount – Dow Jones and US Stock Index Outlook
- After yesterday's not-so-bullish CPI trading (despite a positive report), US Indexes are plummeting.
- The move reflects overbought conditions amid rising geopolitical tensions and ongoing diversification
- Exploring Technical Levels for the Dow Jones, Nasdaq and S&P 500
Yesterday sent a clear warning shot to US Traders: even a positive CPI report—arguably the Fed's primary concern—failed to hold the bid.
Indexes finished in the red, leaving sell-the-news hints.
And that hesitation is materializing into a full-blown pullback in today's session.
Nasdaq is leading US Indexes in their fall, down 1.50% as I write this.
After the relentless Freedom Rallies across equities last week, the market shrugged off everything, including the unprecedented investigation into Chair Powell.
However, the escalating tensions in Iran are now being used as the pretext for a significant selloff in equities.
On paper, the past week rally made perfect sense: record low credit spreads, record high bond issuance (signaling robust economic confidence), and solid earnings from early reporters all supported the bull case.
But the tone has shifted.
With Oil bouncing above $62—up 10% since the Maduro capture—volatility has returned, and it is rarely an investor's best friend.
As JP Morgan's Jamie Dimon noted, geopolitical risk remains the single biggest headwind for equities across asset classes.
This focus naturally overshadows Black Swan risks, such as potential credit distress or fears of an AI peak – Keep a close eye on those throughout 2026.
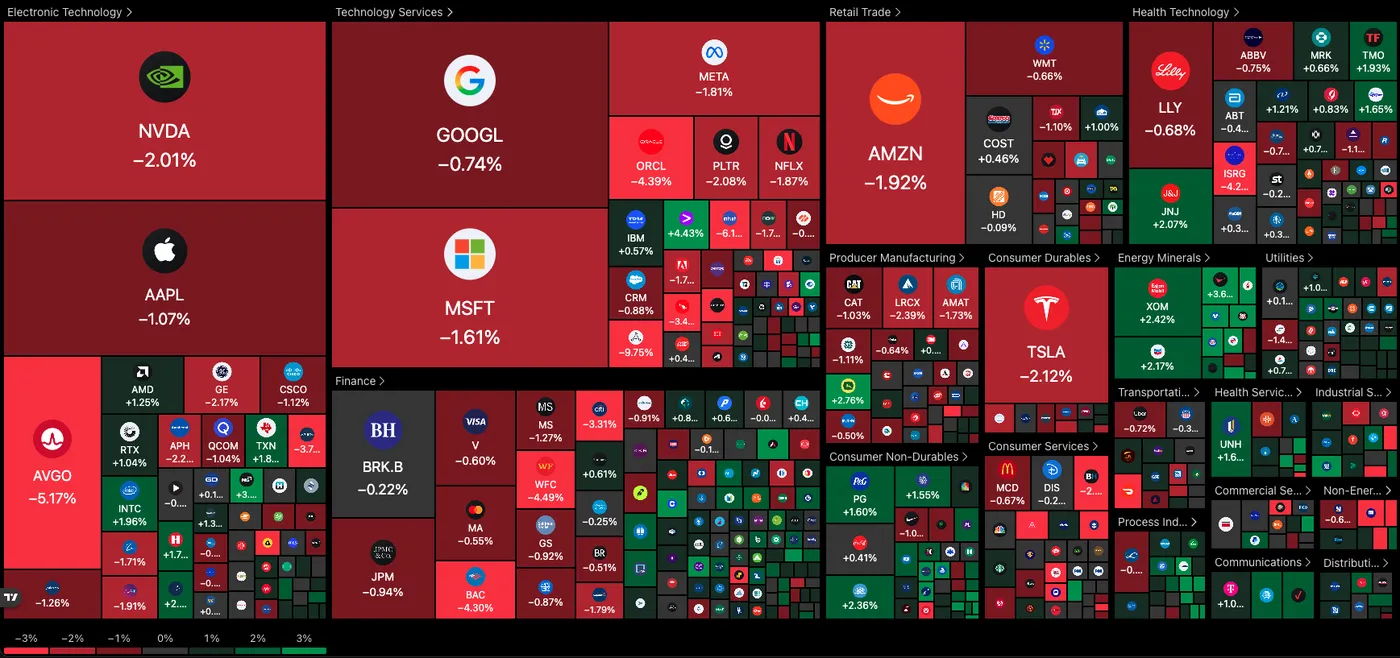
Current picture for the Stock Market (11:39 P.M. ET) – Source: TradingView – January 14, 2026
Looking at the tape today, the Magnificent 7 are taking a hit, with losses ranging from -0.85% for Google to -2.30% for Nvidia. The broader market picture isn't faring much better.
Energy stocks are the lone outperformers, profiting from the WTI surge despite high inventory levels. Outside of the oil patch, capital is rotating strictly into defensive havens, with Household Products and select Healthcare names holding the line.
Let's dive into our daily intra-session charts and trading levels for the major US Indexes: Dow Jones, Nasdaq, and S&P 500.
Dow Jones 4H Chart
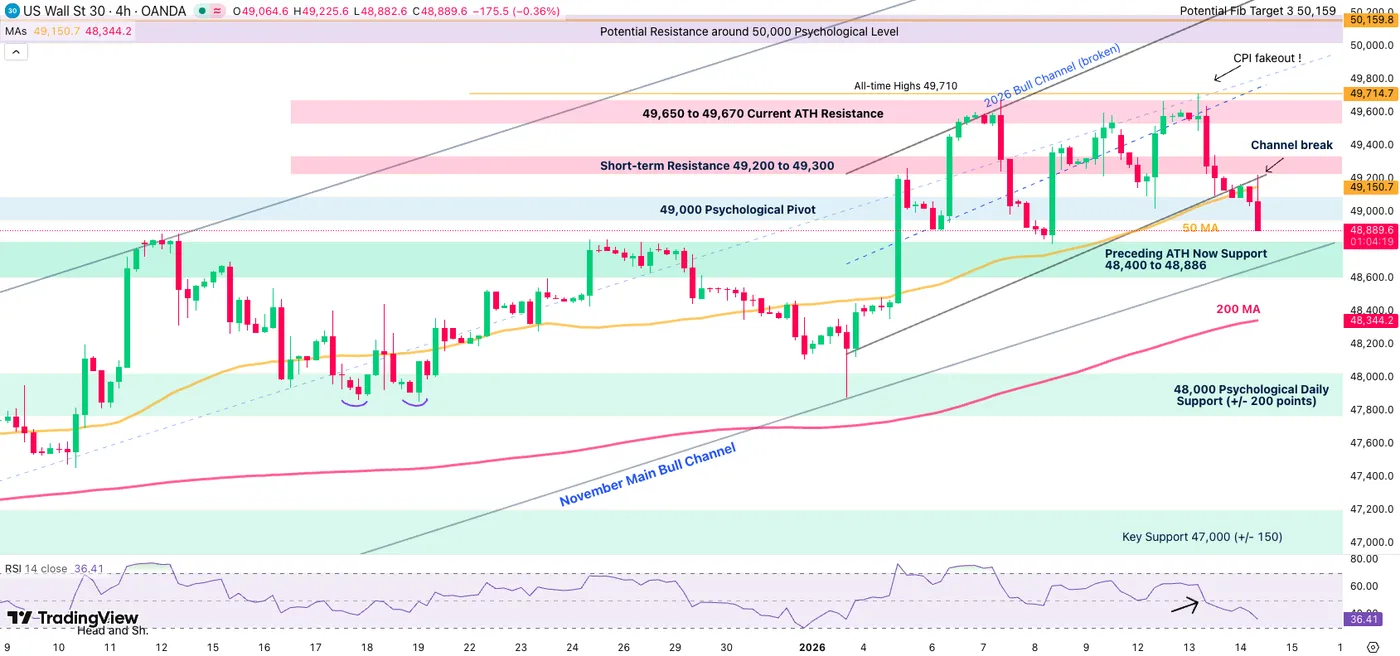
Dow Jones (CFD) 4H Chart – January 14, 2026 – Source: TradingView
Dow Jones is suddenly turning bearish after yesterday's All-Time High fakeout.
Now breaking its 2026 rising channel and passing below its 4H 50-Period MA, momentum is turning bearish – Confirmed with the descending RSI.
As the selloff attempts to ram through the 49,000 Psychological, look at the November Channel lows:
- Bouncing from there could provide a decent dip-buying opportunity if sentiment gets better
- The Channel and 48,600 Support Zone breaks, hinting at pursued downside (which could lead to 45,000 being retested)
- Still far but this scenario is rising in probability. Be careful for extreme long positions.
Dow Jones technical levels for trading:
Resistance Levels
- 49,151 4H 50-MA
- Short-term Resistance 49,200 to 49,300
- 49,650 to 49,670 Current ATH Resistance
- 46,710 All-Time Highs
- 50,000 Potential Psychological Resistance
Support Levels
- 48,600 to 48,800 Major Support and November Channel Lows
- Psychological Support at 48,000
- 45,000 psychological level (Main Support on higher timeframe)
Nasdaq 4H Chart
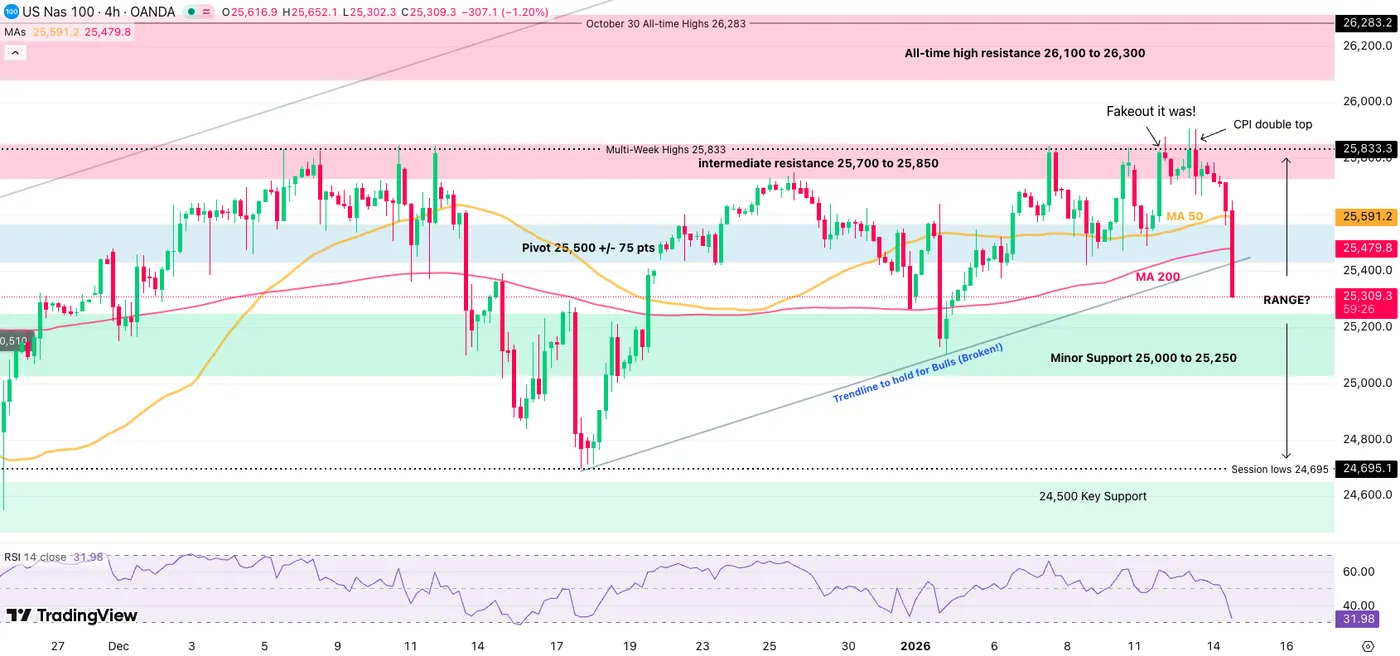
Nasdaq (CFD) 4H Chart – January 14, 2026 – Source: TradingView
The picture is looking very grim for Nasdaq despite its stronger performance yesterday:
Bears are now fully in control after a double top fakeout at the CPI release and a break of its 2026 upward trendline.
Looking out, it seems that the Nasdaq is stuck in a 24,700 to 25,800 large consolidation, but as Supports are breaking, keep a close eye on Higher Timeframe charts to see if things materialize into something worse.
On the immediate picture, the selloff is showing oversold on the 4H CPI – Hence, look at whether a pullback higher comes at the 25,500 Minor Support or if lower consolidation points to continued downside.
Nasdaq technical levels of interest:
Resistance Levels
- 4H MA 200 (25,480)
- intermediate resistance 25,700 to 25,850 Fakeout
- Momentum Pivot 25,500 +/- 75 pts
- Session highs 25,877
- All-time high resistance zone 26,100 to 26,300
- Current ATH 26,182
Support Levels
- Minor Support 25,000 to 25,250 (immediate test)
- 25,850 Mini Support
- 24,500 Main support
- Early 2025 ATH at 22,000 to 22,229 Support
S&P 500 4H Chart
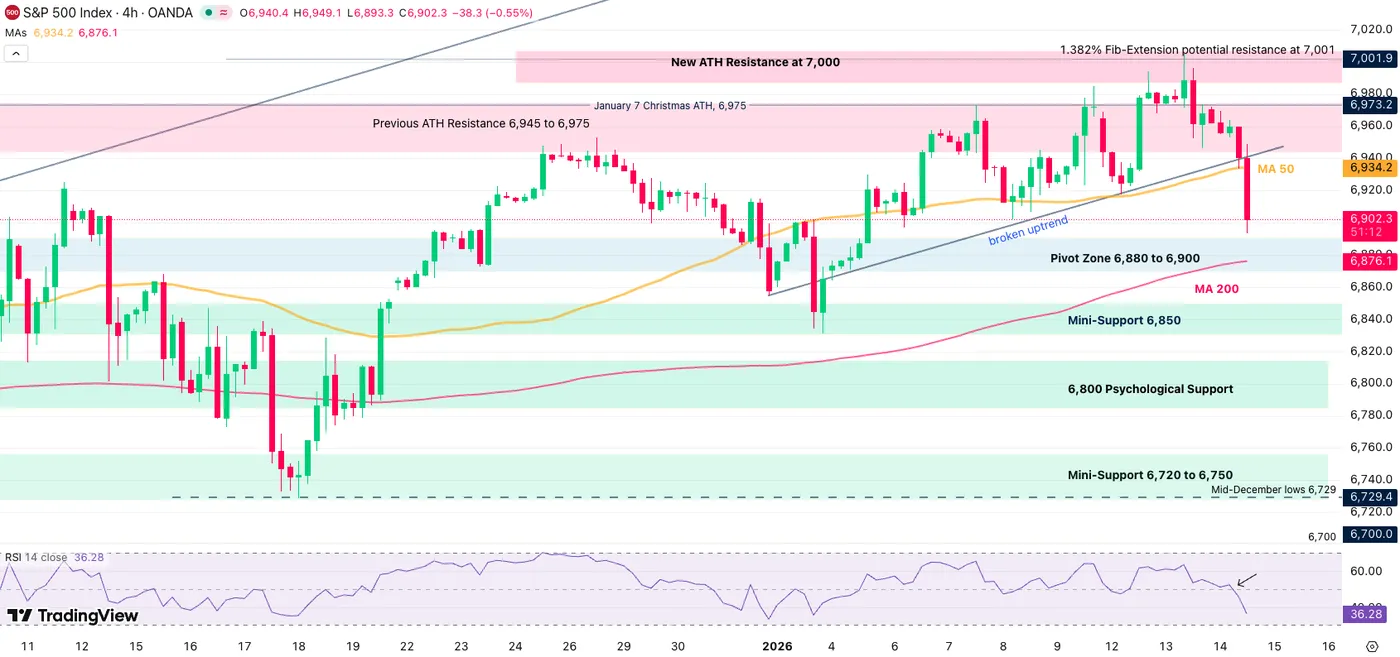
S&P 500 (CFD) 4H Chart – January 14, 2026 – Source: TradingView
Now rejecting its 7,000 new Major All-Time Highs, the S&P 500 picture is also looking grim.
Bulls will face a key test at the 6,880 to 6,900 Psychological Pivot after breaching the 4H 50-MA (6,935).
Breaking below will lead to a fully bearish price action.
Holding there would hint at a simple yet scary retracement.
S&P 500 technical levels of interest:
Resistance Levels
- 4H 50 MA at 6,935
- Previous ATH Resistance 6,945 to 6,975
- Current ATH Resistance at 7,000
Support Levels
- Pivot Zone 6,880 to 6,900
- Session lows 6,893
- 6,800 Psychological Support
- Support 6,720 to 6,750
- 6,400 Major psychological support
Safe Trades!
The Iran Risk Premium: WTI Hits $62 as Revolts Continue – US Oil Outlook
- Oil explodes higher from Iran tensions and supply fears
- Exploring Technical Analysis for a rally in the commodity
- WTI faces headwinds of catalysts across the globe, with Venezuela and the Middle East
2026 is shaping up to be a chaotic year for traders.
Between record corporate issuance signaling high-paced economic activity, the US capture of a head of state in Venezuela (combined with threats to other nations), and now revolts in Iran, geopolitics has firmly taken the lead in driving volatility.
Our recent edition on Black Gold suggested that despite higher supply expectations following the Maduro capture—which pointed toward better exploitation of Venezuela's vast reserves—structural catalysts would emerge to prevent a slide to fresh 2025-2026 lows.
And emerge they did.
The biggest catalyst, of course, is the turmoil in Iran.
Despite sanctions from OECD countries, Iran remains a critical supplier to the world's largest consumers, particularly China, which regularly absorbs 80% to 90% of the nation's ~4M barrels per day production.
The risk premium, however, extends beyond simple production figures which haven't shown much change for now.
Iran holds immense strategic leverage over the Strait of Hormuz, a choke point they have used to block oil tankers and global sea traffic in the past.
This threat adds a geographic premium to the price of every barrel, even if domestic production continues uninterrupted.
Looking back to the "12-Day War," WTI surged from $62 to $76 in a matter of days. With that precedent in mind, traders are actively positioning themselves for a potential price explosion.
Looking back to the 1979 revolution, participants fear that Oil workers may join the Revolt, as the Iranian government already killed an estimated +10,000 civilians in the protests.
Let's dive into a multi-timeframe analysis of the WTI (US) Oil to determine if technicals point to continued upside or if prices are approaching relative extremes.
US Oil Multi-Timeframe Analysis
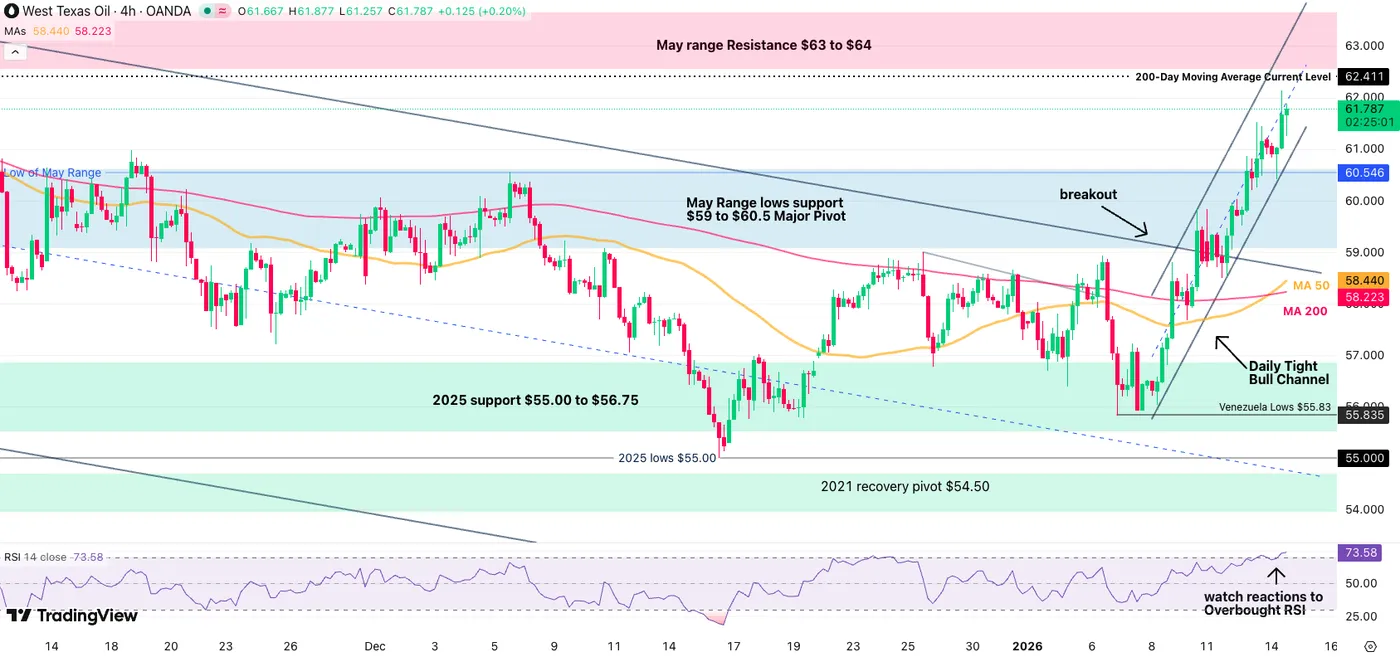
WTI Daily Chart
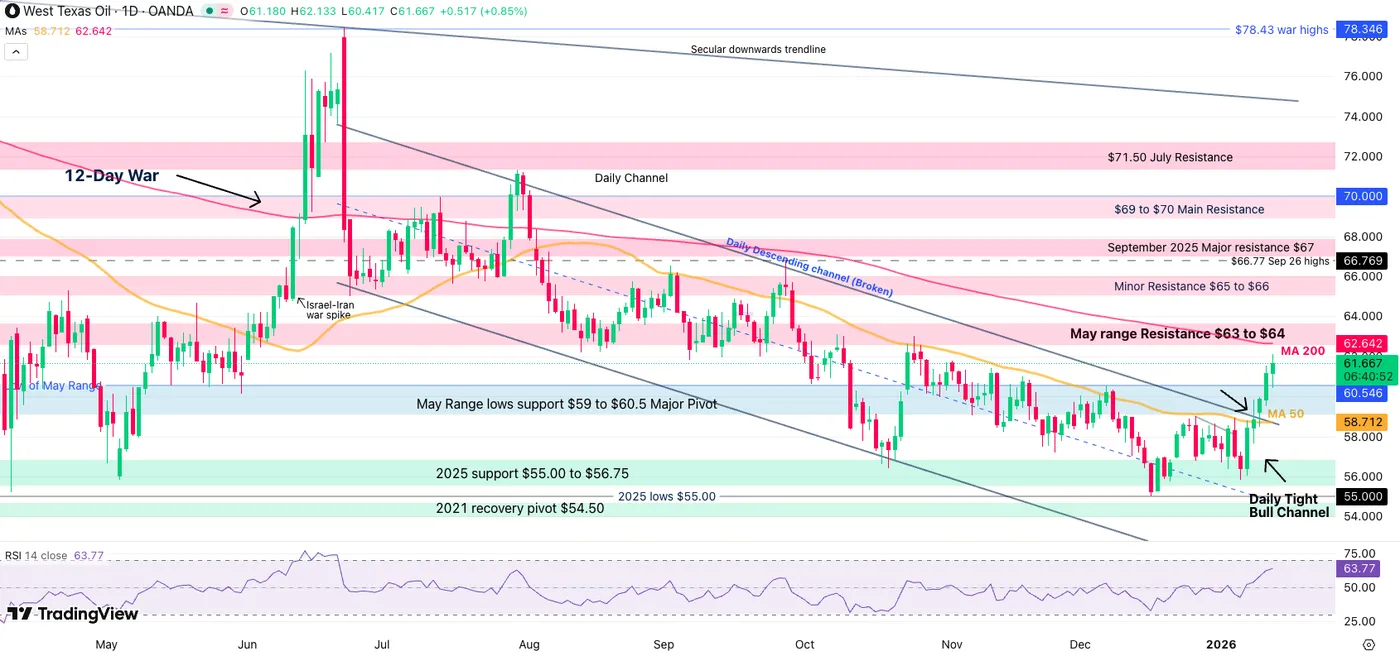
WTI Oil Daily Chart – January 14, 2026. Source: TradingView
WTI has officially broken out of its major descending channel that led the price action from after the 12-War to the current rally.
Now forming a tight-bull daily channel, bears have disappeared from the immediate action as the risk-premium takes over.
A tight bull channel occurs when green candles succeed one after the other. The pattern breaks if a bear candle closes below the previous.
There won't be anything to stop the rally until the 200-Day Moving Average at $62.43.
To see what the next step will be:
- Can bulls manage a break above the 200-Day MA? To assume so, look for a daily close above the indicator
- A break without retest would point to even more bull pressure
- Will sellers re-appear at the MA? If they do so, look for long entries at the Pivot Zone retest ($60.00 to $60.50)
WTI 4H Chart and Technical Levels
WTI Oil 4H Chart – January 14, 2026. Source: TradingView
Reactions will be interesting around here as the price action reaches overbought levels on the 4H RSI.
The morning rally is stalling slightly which prompts either consolidation or retracement – No retracements hints at further one-way continuation.
In the event of a correction, look at $60.80 for short-term entries, lows of the Tight Bull Channel.
WTI Technical Levels
Levels to place on your WTI charts:
Resistance Levels
- $62.13 Session Highs
- $62.43 200-Day MA (to break for real breakout)
- Next Resistance May 2025 Range $63 to $64
- Key September Resistance $65 to $66
Support Levels
- $60.80 Aggressive Support (intraday)
- $60.50 Pivot Zone retest Support
- $59 Pivot Zone lows
- $55 to $56.50 2025 Support and Channel lows
30M Chart and Trading Setups
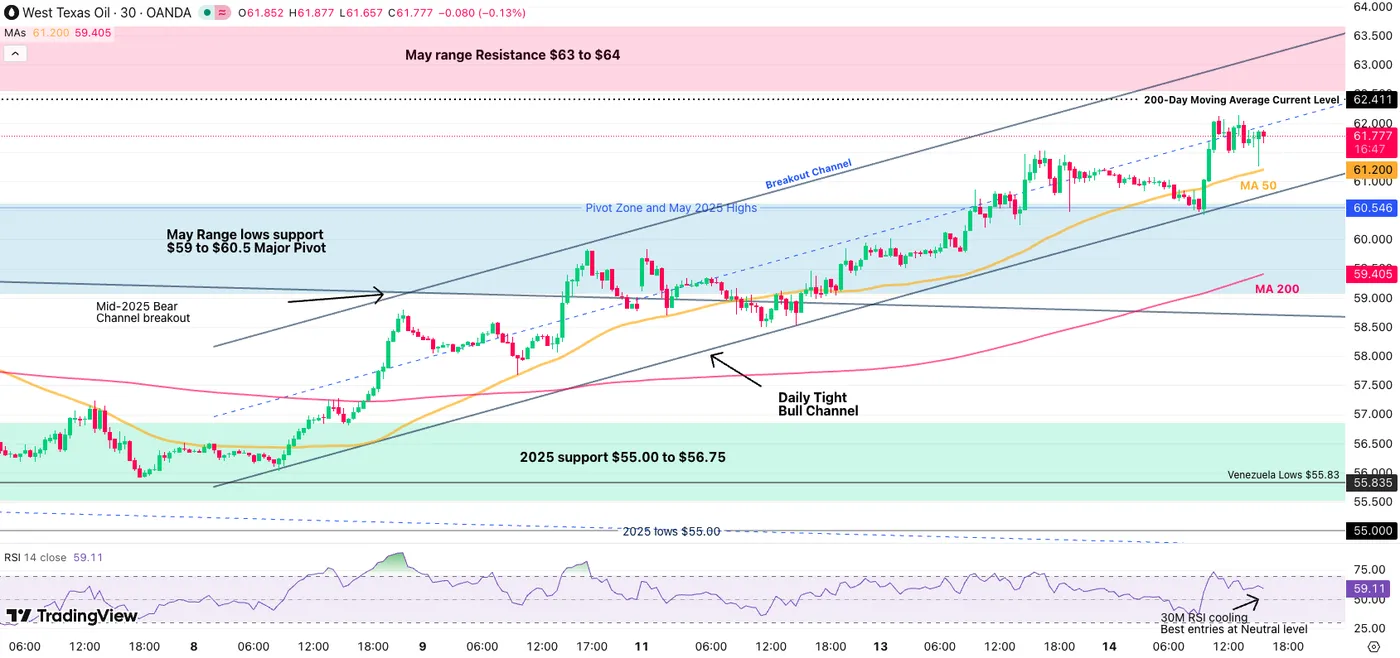
WTI Oil 30M Chart – January 14, 2026. Source: TradingView
The rally is stalling and consolidating at its relative highs.
With the action rangebound on short-timeframes, remain patient for these three signs:
- 30M RSI corrects back to the Neutral Level (40)
- Bulls manage to break above session highs ($62.13) with volume, pointing to a 200-Day MA test – Very bullish above
- Breaks manage a correction to $60.80
- Breaking below would lead at least to $60.00
Safe Trades and Stay in Touch with the Latest News!
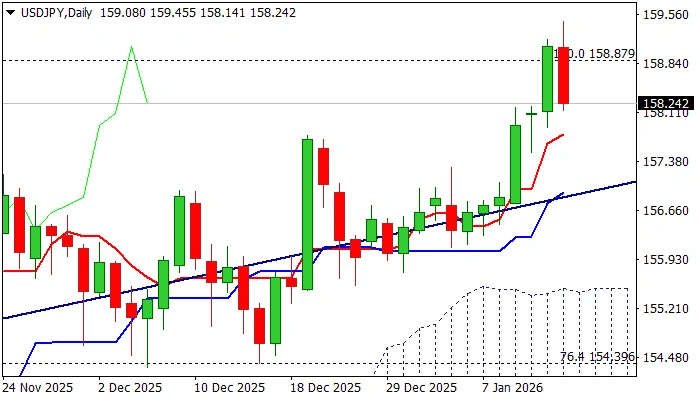
USDJPY: Dips from the Area Near 160 on Renewed Intervention Talks
USDJPY eases from new multi-month high (159.45, the highest since mid-July 2024) on Wednesday.
The news that Japan’s PM is to call snap election in February, further deflated yen, but the following comments from Fin Min about intervention against yen’s excessive losses, cooled the situation and lifted Japan’s currency.
As expected, the pair faced strong headwinds on approach to 160 level, where market participants speculate Japan’s authorities could intervene, to support weakening currency.
Daily technical studies remain bullish overall but fading positive momentum and stochastic about to exit overbought zone, show space for further easing.
Former tops at 157.89/76 offer initial support, followed by broken upper boundary of larger bull-channel (157.00) which should ideally contain dips, to guard the top of rising daily Ichimoku cloud (155.50).
Violation of 160 barrier (in case Japan’s authorities do not intervene) could spark stronger acceleration higher, as large number of stops has been placed above this level.
Res: 157.53; 157.89; 158.20; 158.87
Sup: 157.76; 157.00; 156.11; 155.50
Sunset Market Commentary
Markets
Economic data, including key US labour market and inflation data, of late mostly failed to inspire any directional trading trends. Multiple (political) event risk, including the US military action in Venezuela, protests challenging the government in Iran, a flaring up of the fight on Fed independence and an expected ruling by the US supreme Court on president Trump’s tariffs, for now also fail to trigger any major market volatility. Or, are they seen as too unpredictable for investors to set up outright directional bets, especially in FX and interest rate markets? Until now this agnosticism also kept equity markets ‘paralyzed’ near record levels. Admittedly, anticipating that any of these risks would unsettle reigning risk-on sentiment didn’t yield anything. On the contrary. In this context, metals turned out to gain some kind of safe haven status, combining the feature of scarcity together with a narrative of LT indispensability to address needs related to energy transition and/or AI development. Underlying uncertainty on the dollar also supports the case for holding these metals. At least one regional ‘event risk’ was clarified today. According to the leader of the LDP party, Japanese PM Takaichi will call snap elections in the parliamentary session next week. Market anticipation that new elections would only reinforce Takaichi’s aim for ample deficit spending recently weight on both Japanese government bonds and the yen. The yen before the announcement at USD/JPY 159.45 touched the weakest level against the US currency since July 2024. A potential attack on the 160 barrier, at least of now, was blocked as both Fin Min Katayama and FX official Mimura warned they might take action as yen moves become excessive and not in line with economic fundamentals. The yen rebounded slightly to currently trade near USD/JPY 158.65.
In the US, both PPI producer prices (final demand at 0.2% M/M and 3% Y/Y, ex food and energy 0.0% M/M and 3% Y/Y) and November retail sales (0.6% M/M) printed on the stronger side of expectations, but hardly left any traces on interest rate markets. US yields are ceding 2-3 bps across the curve, probably driven by a mild risk-off. For EMU/Germans yields daily changes are less than 2 bps. Interesting as a pointer for investor appetite for sovereign credit, France today launched a €10 bln 20-y OAT (May 2046) at a spread of 5 bps over the May 2045 OAT and with books said to have been well in excess of € 100 bln! The Eurostoxx 50 (currently -0.2%) this morning even touched a minor now record. US indices show a more hesitant picture (S&P 500 -0.6%) as the earnings season kicks off with major US banks reporting. Investors also look out whether the US Supreme Court today will give an opinion on the Trump tariffs. Oil extends its rebound as markets are pondering the political developments in Iran, annex a potential reaction of the US. Brent oil at $66 p/b trades at the highest levels since end October and to be compared with a December low below $59 p/b. Except for the moves in the yen, there is very little to report on most other major FX cross rates. DXY eases slightly (99.05). EUR/USD is locked in a tight range near 1.165.
News & Views
Hungarian central bank (MNB) deputy governor Kirali pushed back against rapid rate cut bets after yesterday’s inflation numbers. Inflation slowed from 3.8% Y/Y to 3.2% Y/Y but the MNB is looking for a more consistent move towards the 3% target rather than the current one-off. He highlighted the importance of the central bank’s credibility and underscored the support of recent HUF stability in moderating inflation. On the political side, a new opinion poll with a margin of error of 3.5 ppt showed Hungarian opposition party Tisza extending its lead over PM Orban’s Fidesz party to 51% vs 39%. Back in November, Tisza had a 10-point lead for elections which have yesterday been set for April 12. Hungarian swap rates extend yesterday’s comeback, rebounding by up to 3 bps at the front end of the curve. EUR/HUF is unchanged at 386.50.
US Treasury Secretary Bessent today met with South Korean deputy PM and finance minister Koo Yun Cheol to discuss the critical minerals ministerial meeting and ongoing market developments in Korea. The latter centered around the recent depreciation of the Korean won which Bessent believes is not in line with Korea’s strong economic fundamentals. USD/KRW fell from recent highs/key resistance around 1480 towards 1470. Earlier today, Koo Yun Cheol said that the government will focus on improving economic fundamentals, short-term market measures and flow management to curb excessive one-way moves in the won.
EUR/USD Mid-Day Outlook
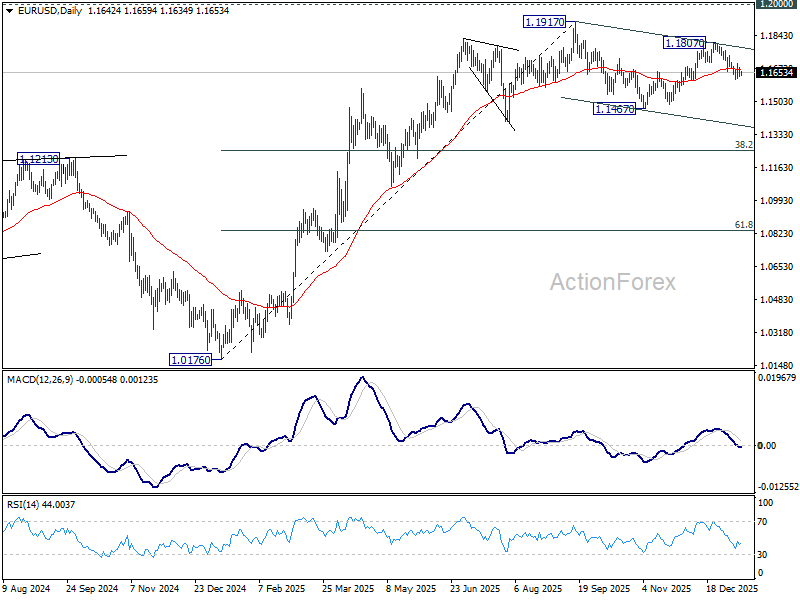
Daily Pivots: (S1) 1.1626; (P) 1.1652; (R1) 1.1669; More….
Outlook in EUR/USD is unchanged as sideway trading continues, and intraday bias remains neutral. On the upside break of 1.1742 resistance will argue that pullback from 1.1807 has completed. Rise from 1.1467 should then be ready to resume. Further break of 1.1807 will pave the way to retest 1.1817 high. Nevertheless, on the downside, below 1.1617 will target 1.1467 support. Overall, price actions from 1.1917 are seen as a corrective pattern that might extend further.
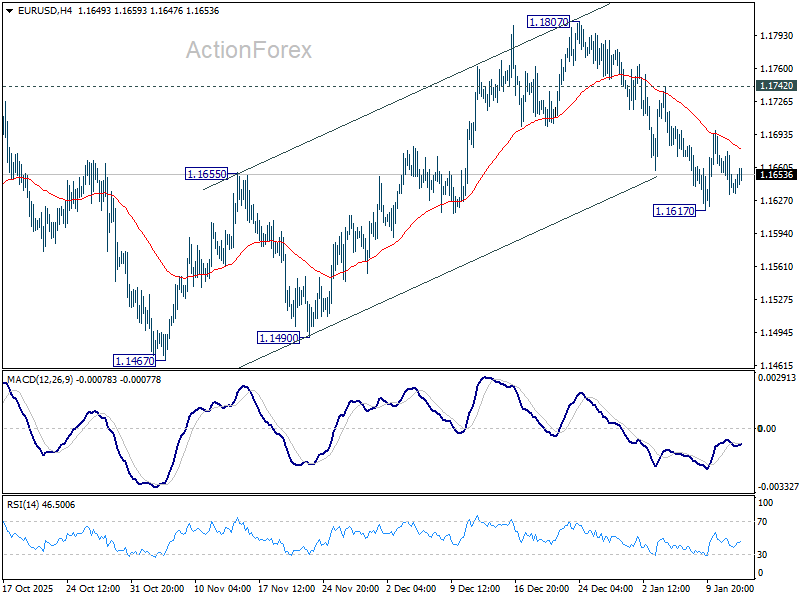
In the bigger picture, as long as 55 W EMA (now at 1.1416) holds, up trend from 0.9534 (2022 low) is still in favor to continue. Decisive break of 1.2 key psychological level will carry larger bullish implication. However, sustained trading below 55 W EMA will argue that rise from 0.9534 has completed as a three wave corrective bounce, and keep long term outlook bearish.