
Sample Category Title
GBP/USD Daily Outlook
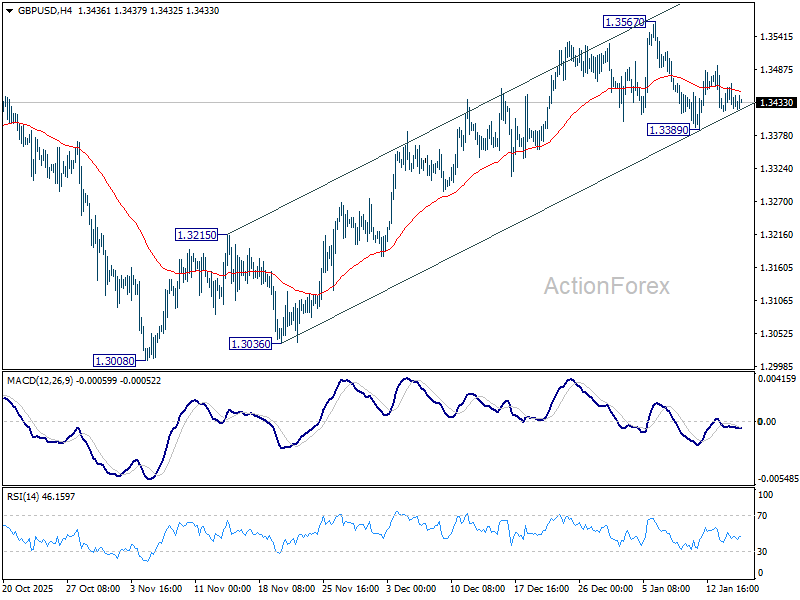
Daily Pivots: (S1) 1.3423; (P) 1.3443; (R1) 1.3467; More...
GBP/USD is still bounded in range trading and intraday bias stays neutral. On the upside, break of 1.3567 will resume the rally from 1.3008 towards 1.3787 high. On the downside, break of 1.3389 will resume the fall from 1.3567. Sustained break of 55 D EMA (now at 1.3375) will argue that the decline is another falling leg in the corrective pattern from 1.3787. In this case, deeper fall should be seen back to 1.3008 support.
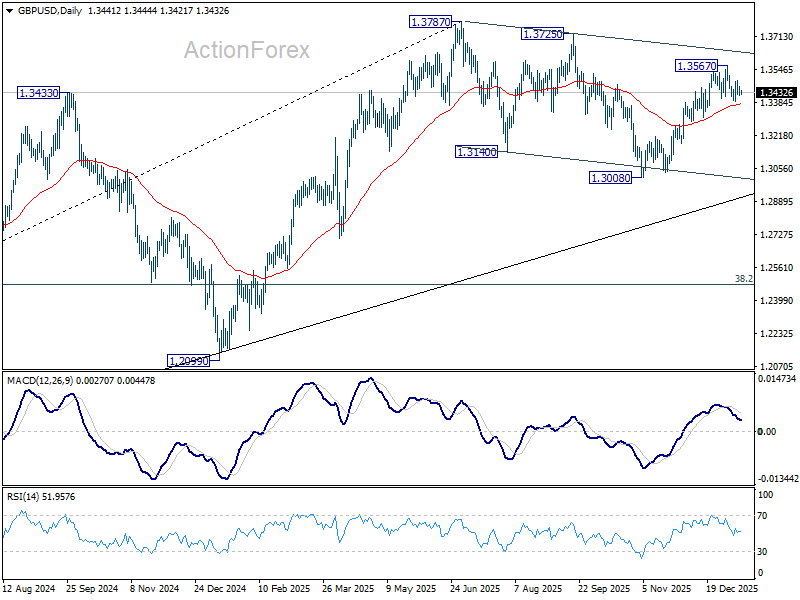
In the bigger picture, price actions from 1.3787 (2025 high) are seen as a correction to the larger up trend from 1.3051 (2022 low). Deeper decline could be seen as the pattern extends, but downside should be contained by 38.2% retracement of 1.0351 to 1.3787 at 1.2474 to bring rebound. Break of 1.3787 for up trend resumption is expected at a later stage.
USD/CHF Daily Outlook
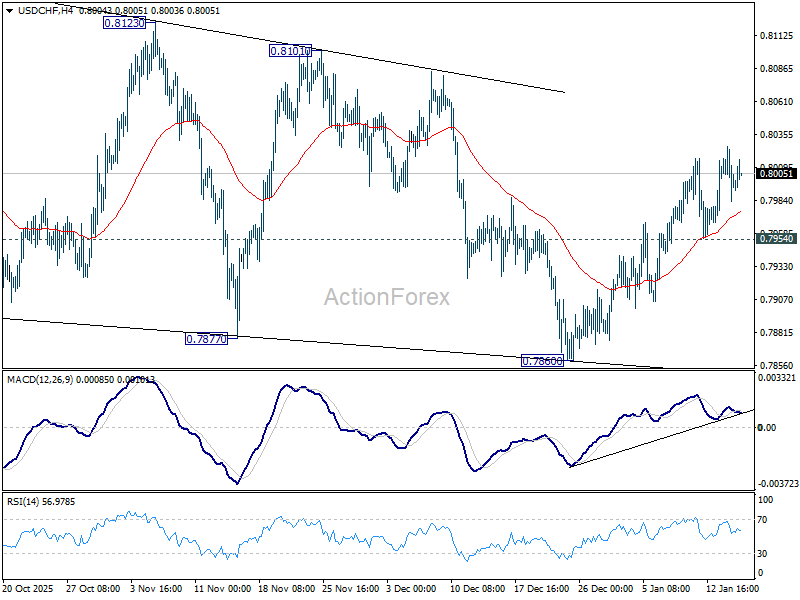
Daily Pivots: (S1) 0.7980; (P) 0.8004; (R1) 0.8024; More….
Intraday bias in USD/CHF remains mildly on the upside at this point. Rebound from 0.7860 is in progress and would target 0.8123 resistance. On the downside, below 0.7954 support will turn intraday bias neutral again first. Overall, corrective pattern from 0.7828 low is in progress and would extend further.
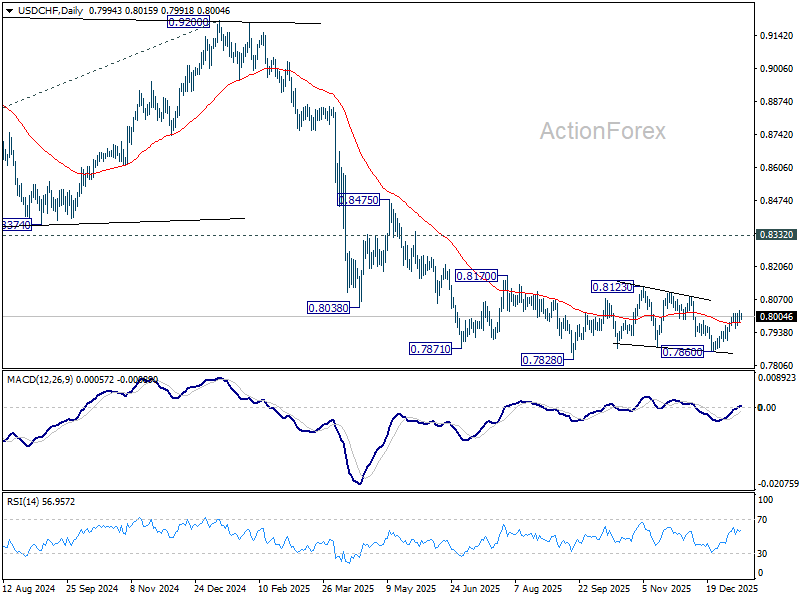
In the bigger picture, price actions from 0.7828 are seen as a correction. Larger down trend from 1.0342 (2017 high) is in still in progress. Break of 0.7828 will target 100% projection of 1.0146 (2022 high) to 0.8332 from 0.9200 at 0.7382. In any case, outlook will stay bearish as long as 0.8332 support turned resistance holds (2023 low).
AUD/USD Daily Report
Daily Pivots: (S1) 0.6670; (P) 0.6686; (R1) 0.6699; More...
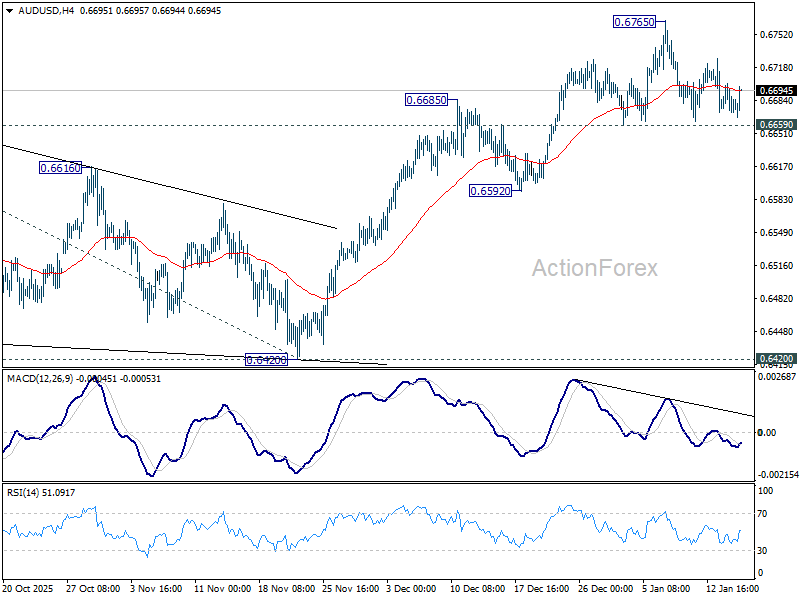
AUD/USD is still extending consolidations below 0.6765 and intraday bias stays neutral. Further rally is in favor with 0.6659 support intact. On the upside, break of 0.6765 will resume the whole rise from 0.5913 and target 61.8% projection of 0.5913 to 0.6706 from 0.6420 at 0.6910. However, considering bearish divergence condition in 4H MACD, firm break of 0.6659 will confirm short term topping, and bring deeper correction back towards 0.6592 support.
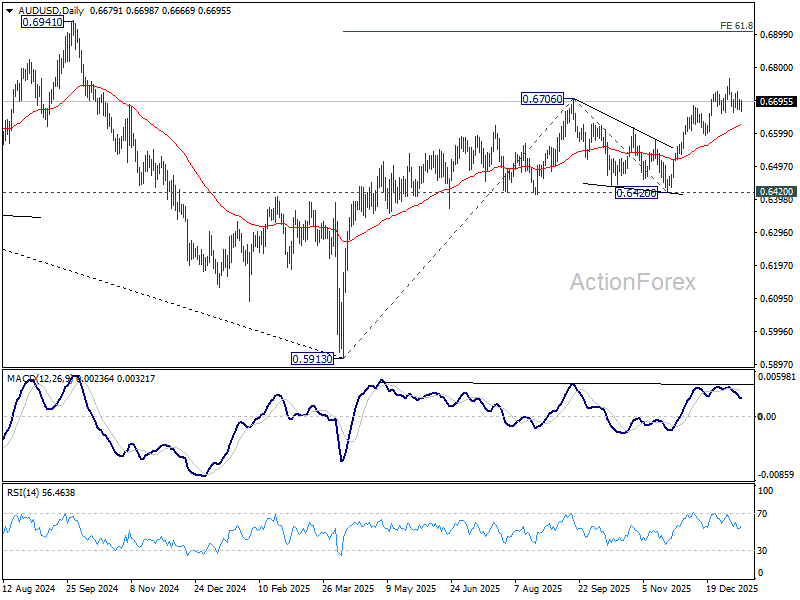
In the bigger picture, current development argues that rise from 0.5913 (2024 low) is reversing whole down trend from 0.8006 (2021 high). Further rally should be seen to 61.8% retracement of 0.8006 to 0.5913 at 0.7206. This will remain the favored case as long as 0.6420 support holds.
USD/CAD Daily Outlook
Daily Pivots: (S1) 1.3867; (P) 1.3882; (R1) 1.3899; More...
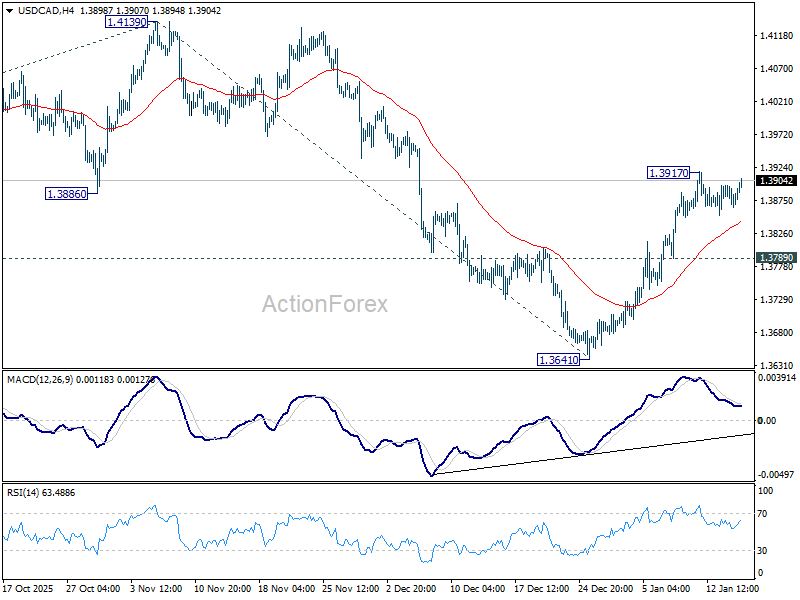
USD/CAD is extending consolidations below 1.3917 temporary top and intraday bias remains neutral. In case of another dip, downside should be contained by 1.3789 support to bring rebound. Rise from 1.3641 is seen as the third leg of the corrective pattern from 1.3538. Above 1.3917 will target 1.4139 first. Break there will target 100% projection of 1.3538 to 1.4139 from 1.3641 at 1.4242.
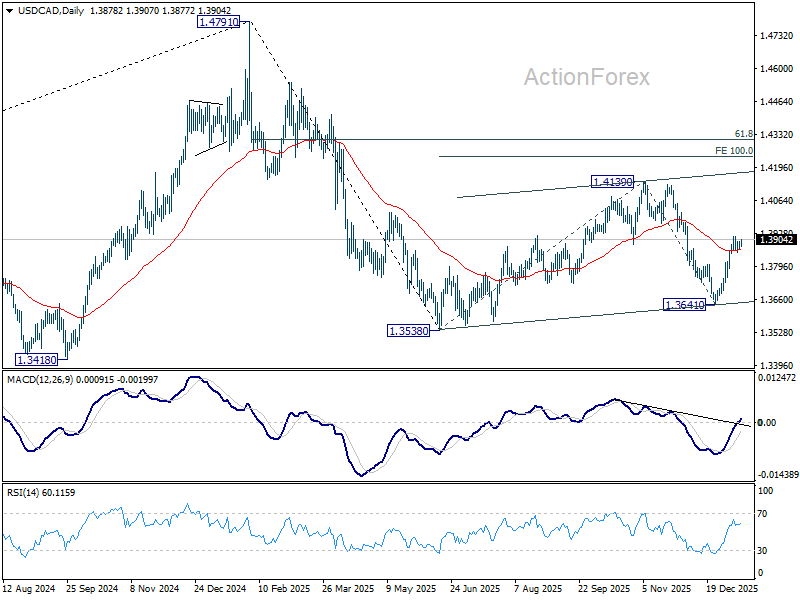
In the bigger picture, price actions from 1.4791 are seen as a corrective pattern to the whole up trend from 1.2005 (2021 low). Deeper fall could be seen as the pattern extends, and break of 1.3538 will target 61.8% retracement of 1.2005 to 1.4791 at 1.3069. For now, medium term outlook will be neutral until there are signs that the correction has completed.
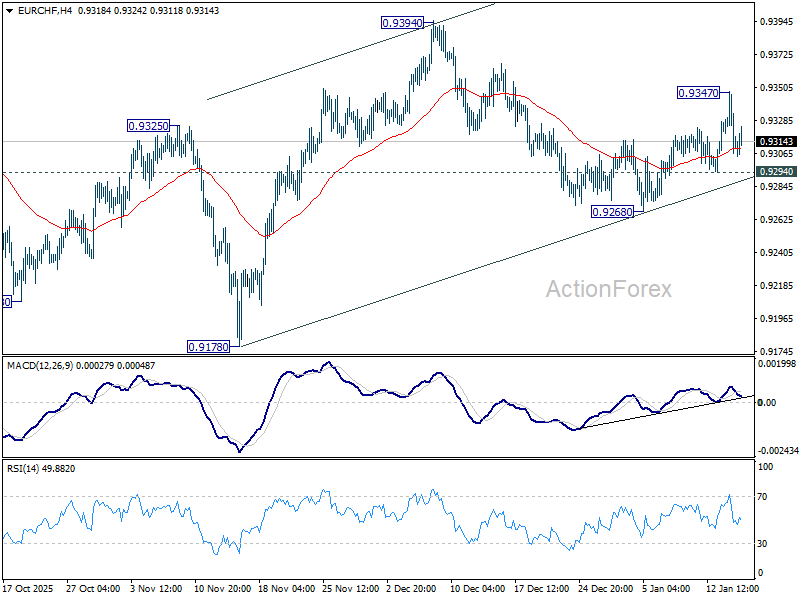
EUR/CHF Daily Outlook
Daily Pivots: (S1) 0.9299; (P) 0.9325; (R1) 0.9341; More....
EURCHF retreated sharply after hitting 0.9347 and intraday bias is turned neutral again. On the upside, break of 0.9347 will resume the rebound from 0.9268 to retest 0.9394 high. However, break of 0.9294 will bring deeper fall through 0.9268 instead.
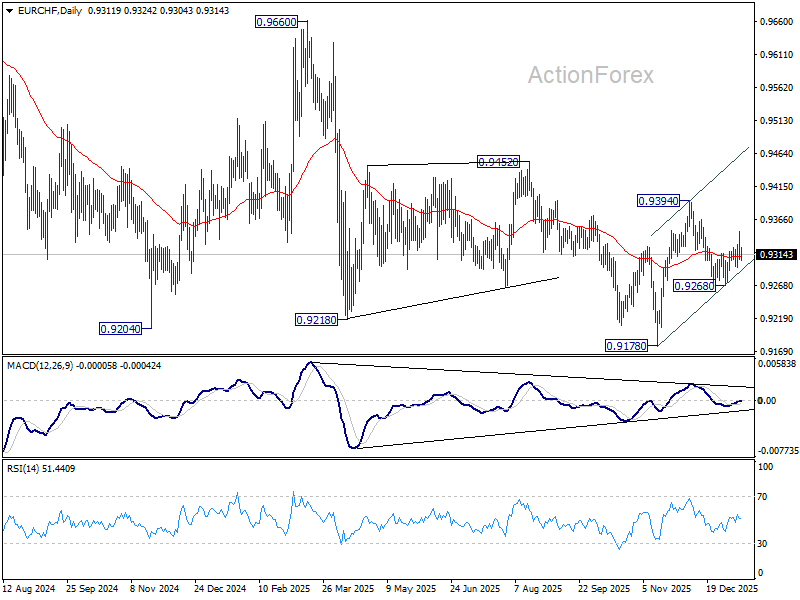
In the bigger picture, persistent bullish convergence condition in W MACD is a medium term bullish sign. Firm break of 0.9394 resistance should bring sustained trading above 55 W EMA (now at 0.9362). That should indicate medium term bottoming at 0.9178. Further break of 0.9452 resistance will bring stronger medium term rally towards 0.9928 resistance next, even still as a corrective bounce. Nevertheless, rejection by 55 W EMA will retain bearishness for another fall through 0.9178 at a later stage.
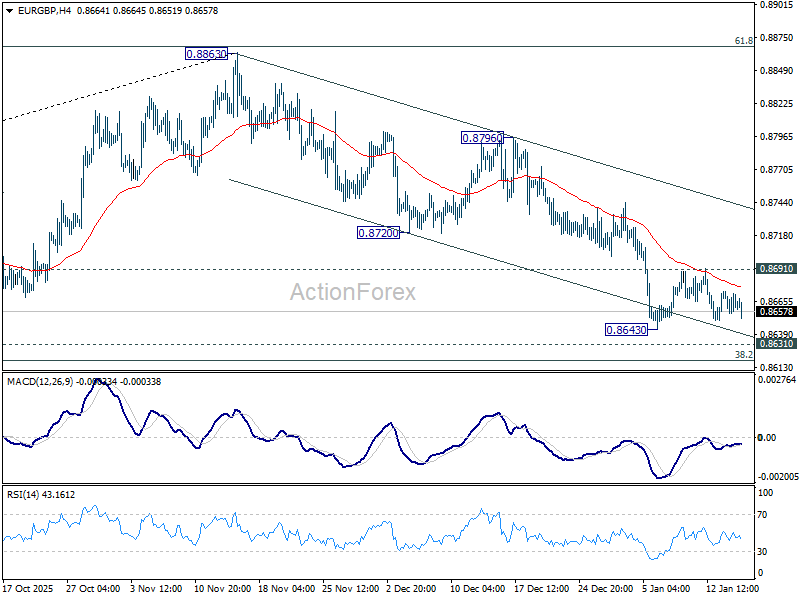
EUR/GBP Daily Outlook
Daily Pivots: (S1) 0.8652; (P) 0.8665; (R1) 0.8672; More…
Intraday bias in EUR/GBP stays neutral and more consolidations could be seen above 0.8643. Further decline is expected and decisive break of 0.8631 cluster support (38.2% retracement of 0.8221 to 0.8663 at 0.8618) will pave the way to 61.8% retracement at 0.8466. However, break of 0.8691 resistance will turn bias to the upside, for stronger rebound to 55 D EMA (now at 0.8719) first.
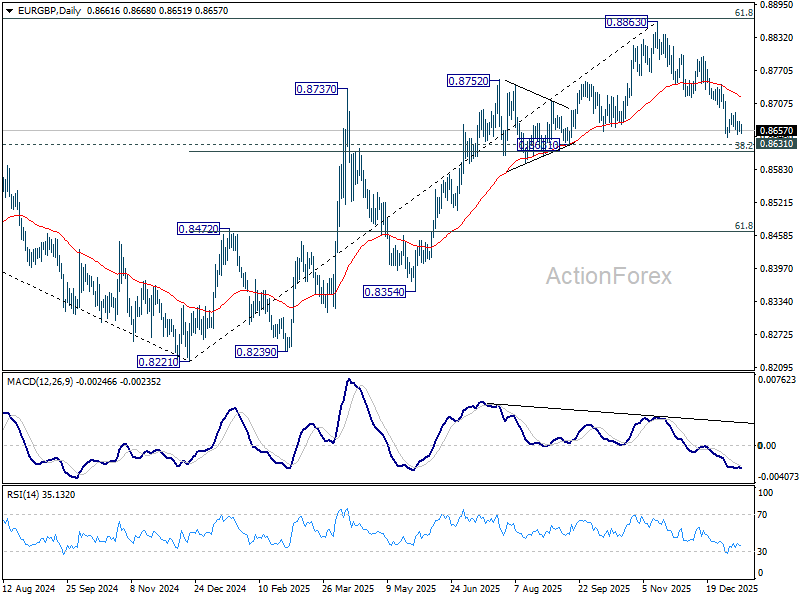
In the bigger picture, rise from 0.8221 medium term bottom (2024 low) is seen as a corrective move. Upside should be limited by 61.8% retracement of 0.9267 to 0.8221 at 0.8867. Sustained trading below 55 W EMA (now at 0.8622) should confirm that this corrective bounce has completed. In this case, deeper fall would be seen back to 0.8201/21 key support zone. However, decisive break of 0.8867 will suggest that EUR/GBP is already reversing whole decline from 0.9267 (2022 high). That should pave the way back to 0.9267.
EUR/AUD Daily Outlook
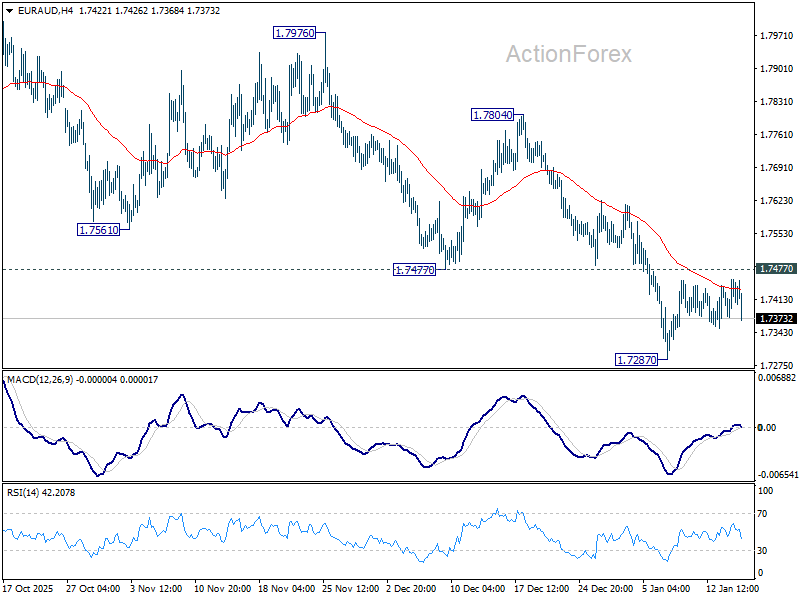
Daily Pivots: (S1) 1.7384; (P) 1.7421; (R1) 1.7462; More...+
Intraday bias in EUR/AUD remains neutral as consolidations continue above 1.7287. Risk will stay on the downside as long as 1.7477 support turned resistance holds. Current decline is seen as the third leg of the corrective pattern from 1.8554. Below 1.7287 will target 1.7245 support, and then 1.6922 fibonacci level. Nevertheless, firm break of 1.7477 will indicate short term bottoming, and bring stronger rebound back to 55 D EMA (now at 1.7604).
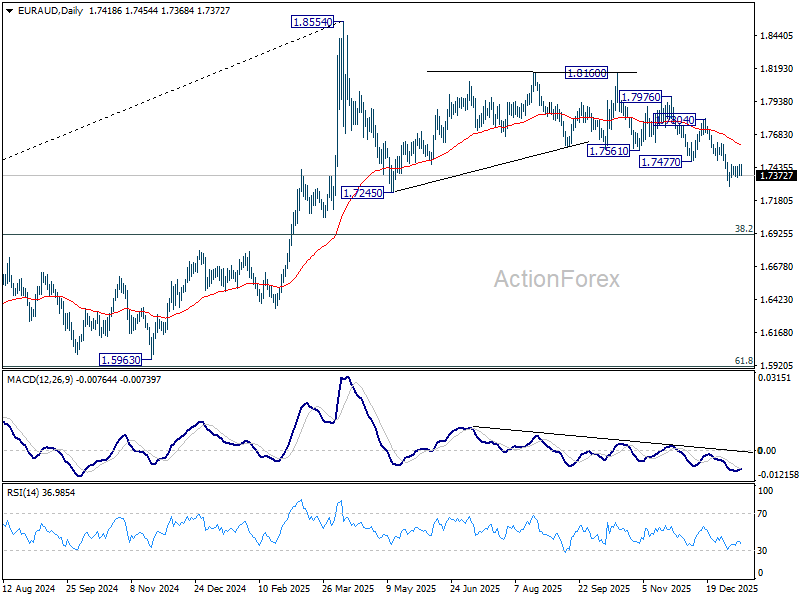
In the bigger picture, the break of 55 W EMA (now at 1.7468) argues that fall from 1.8554 medium term top is already correcting whole up trend from 1.4281 (2022 low). Deeper decline is in favor to 38.2% retracement of 1.4281 to 1.8554 at 1.6922, and possibly below. Risk will stay on the downside as long as 1.8160 resistance holds, in case of strong rebound.
EUR/JPY Daily Outlook
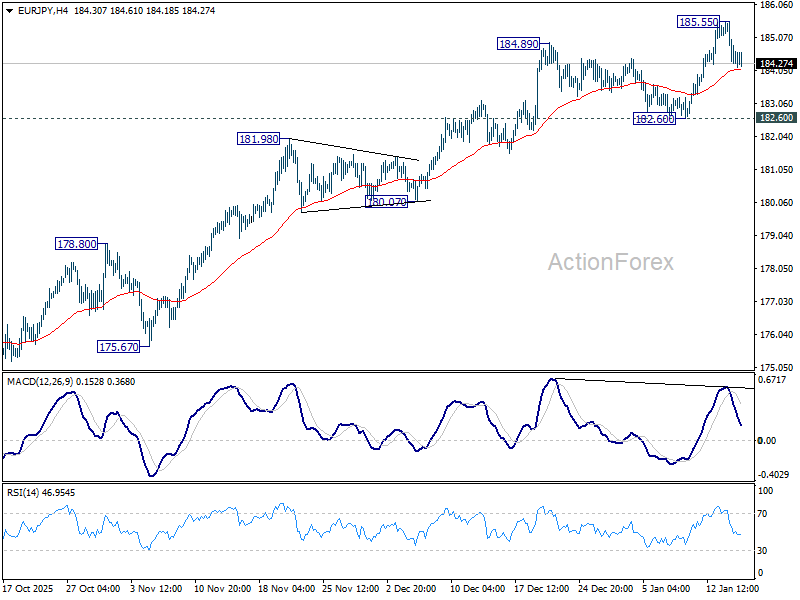
Daily Pivots: (S1) 184.02; (P) 184.79; (R1) 185.30; More...
Intraday bias in EUR/JPY remains neutral and more consolidations could be seen below 185.55 temporary top. Further rally is expected with 182.60 support intact. Above 185.55 will resume larger up trend to is 186.31 fibonacci level. Firm break there will pave the way to 138.2% projection of 151.06 to 173.87 from 172.24 at 189.94. However, considering bearish divergence condition in 4H MACD, firm break of 182.60 will confirm short term topping, and turn bias back to the downside for deeper pullback.
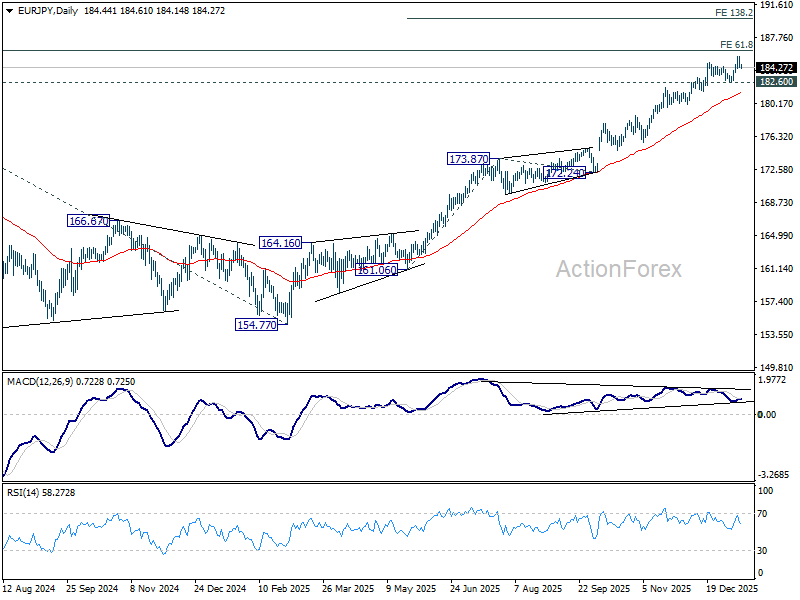
In the bigger picture, up trend from 114.42 (2020 low) is in progress and should target 61.8% projection of 124.37 (2021 low) to 175.41 (2024 high) from 154.77 (2025 low) at 186.31. Firm break there will target 78.6% projection at 194.88. Outlook will remain bullish as long as 175.41 resistance turned support holds, even in case of deep pullback.
GBP/JPY Daily Outlook
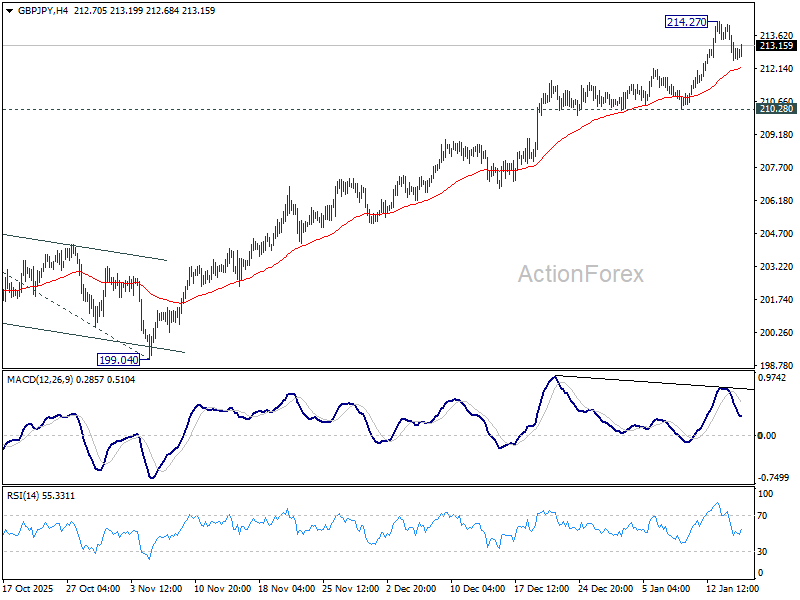
Daily Pivots: (S1) 212.37; (P) 213.25; (R1) 213.93; More...
A temporary top was formed at 214.27 with current retreat. Intraday bias in GBP/JPY is turned neutral first for consolidations. Downside should be contained by 210.28 support to bring another rally. Break of 214.27 will resume larger up trend to 100% projection of 184.35 to 205.30 from 199.04 at 219.99 next. Nevertheless, considering bearish divergence condition in 4H MACD, firm break of 210.28 will confirm short term topping, and turn bias to the downside for deeper pullback.
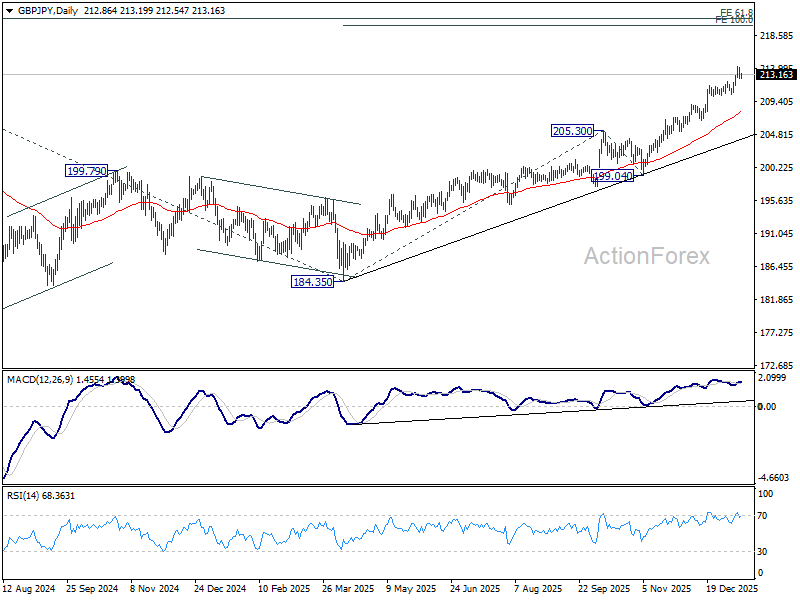
In the bigger picture, up trend from 123.94 (2020 low) is in progress. Next target is 61.8% projection of 148.93 (2022 low) to 208.09 (2024 high) from 184.35 at 220.90. On the downside, break of 205.30 resistance turned support is needed to indicate medium term topping. Otherwise, outlook will stay bullish even in case of deep pullback.
Markets Breathe Easier After Trump Signals Restraint on Iran
Early market nervousness over a potential escalation in the Middle East eased as investors reassessed the likelihood of near-term US military intervention in Iran. Initial risk-off moves faded quickly, helping stabilize broader sentiment. A key factor was messaging from US President Donald Trump, who signaled that Washington may not intervene militarily in Iran, at least for now. His comments helped temper fears of an immediate escalation and reduced demand for safe havens. Gold retreated from its record highs, while WTI crude oil slipped back toward the 60 level as the immediate geopolitical risk premium was partially unwound.
Tensions remain elevated, however. Iran’s leadership is grappling with its worst domestic unrest in decades, and Tehran has threatened US military bases in the region in an attempt to deter American involvement. At the White House, Trump struck a cautious tone. He cited reports from “very important sources” suggesting that killings in Iran’s crackdown were subsiding. While Trump did not rule out military action outright, he said the administration would “watch what the process is,” noting that the US had received what he described as a “very good statement” from Iran.
Separately, Trump sought to talk down concerns over his standoff with Fed Chair Jerome Powell, saying he had “no plan” to fire Powell. Asked whether the investigation into Powell could change that stance, Trump said the administration was in a “holding pattern” and that it was “too soon” to decide. Trump also offered no new clarity on succession planning at the Fed, as he was inclined to nominate either former Fed Governor Kevin Warsh or National Economic Council Director Kevin Hassett when Powell’s term ends. Announcement is expected "over the next couple of weeks."
On trade, Trump unveiled a new tariff mechanism targeting NVIDIA and Advanced Micro Devices, designed to enforce a 25% cut of AI chip sales to China. The move follows December’s decision to allow Nvidia’s H200 chips to be shipped to China, reversing an outright ban but attaching a revenue-sharing requirement. The tariff applies to AI chips imported into the US and then transshipped globally, including Nvidia’s H200 and AMD’s MI325X. The move highlights the administration’s preference for deal-based, transactional trade enforcement.
In FX markets this week, Sterling is the top performer so far, though stronger-than-expected UK GDP has failed to add fresh momentum. Kiwi and Loonie follow, largely stabilizing after recent losses. Yen remains pinned at the bottom despite a brief bounce on intensified verbal intervention, while Aussie and Euro lag. Dollar and Swiss Franc sit in the middle of the pack.
In Asia, Nikkei fell -0.42%. Hong Kong HSI fell -0.28%. China Shanghai SSE fell -0.33%. Singapore Strait Times is up 0.20%. Japan 10-year JGB yield fell -0.018 to 2.169. Overnight, DOW fell -0.09%. S&P 500 fell -0.53%. NASASQ fell -1.00%. 10-year yield fell -0.031 to 4.140.
UK GDP beats with 0.3% mom growth in November, services lead
UK economic output surprised to the upside in November, offering a modest boost to the growth outlook late in the year. GDP rose 0.3% mom, beating expectations for flat growth, with strength concentrated in services and production.
Services output increased 0.3% mom, while production jumped 1.1% mom, offsetting a sharp -1.3% mom decline in construction activity. The data points to improving momentum in consumer- and business-facing sectors, even as construction continues to struggle.
Over the three months to November, GDP edged up 0.1%. Services grew 0.2%, while production slipped -0.1% due largely to weaker motor vehicle manufacturing, and construction fell -1.1%. On a year-on-year basis, GDP expanded 1.3%, led by services growth of 1.4%. Production rose 0.4% and construction rose 0.7%.
Fed’s Beige Book signals steady jobs, moderating price pressures
The latest Beige Book from the Fed showed US economic activity improving modestly, with eight of twelve Districts reporting growth at a "slight to modest pace". Three Districts saw no change and one reported a modest decline, marking a better backdrop than recent cycles where stagnation dominated.
Consumer spending firmed modestly, supported by the holiday shopping season, while business activity presented a mixed picture. Manufacturing remained uneven, with five Districts reporting growth and six citing contraction.
Labor market conditions were "mostly unchanged". Eight Districts reported flat hiring, though multiple contacts noted increased use of temporary workers as firms seek flexibility amid uncertainty. Wage growth continued at a "moderate pace", with several businesses saying wage pressures have normalized.
Price pressures remained elevated, rising at a moderate pace across most Districts. Tariff-related cost increases were a common theme, and while firms expect "some moderation in price growth ahead", many anticipate prices will stay high as they pass through accumulated cost increases.
GBP/JPY Daily Outlook
Daily Pivots: (S1) 212.37; (P) 213.25; (R1) 213.93; More...
A temporary top was formed at 214.27 with current retreat. Intraday bias in GBP/JPY is turned neutral first for consolidations. Downside should be contained by 210.28 support to bring another rally. Break of 214.27 will resume larger up trend to 100% projection of 184.35 to 205.30 from 199.04 at 219.99 next. Nevertheless, considering bearish divergence condition in 4H MACD, firm break of 210.28 will confirm short term topping, and turn bias to the downside for deeper pullback.
In the bigger picture, up trend from 123.94 (2020 low) is in progress. Next target is 61.8% projection of 148.93 (2022 low) to 208.09 (2024 high) from 184.35 at 220.90. On the downside, break of 205.30 resistance turned support is needed to indicate medium term topping. Otherwise, outlook will stay bullish even in case of deep pullback.