
Sample Category Title
USD/JPY Daily Outlook
Daily Pivots: (S1) 158.32; (P) 158.75; (R1) 159.61; More...
Intraday bias in USD/JPY is turned neutral with current retreat and some consolidations would be seen below 159.44 temporary top. Downside should be contained above 156.10 support to bring another rally. On the upside, above 159.44 will resume larger rise from 139.87. Next target is 200% projection of 142.66 to 150.90 from 145.47 at 161.95, which is close to 161.94 high.
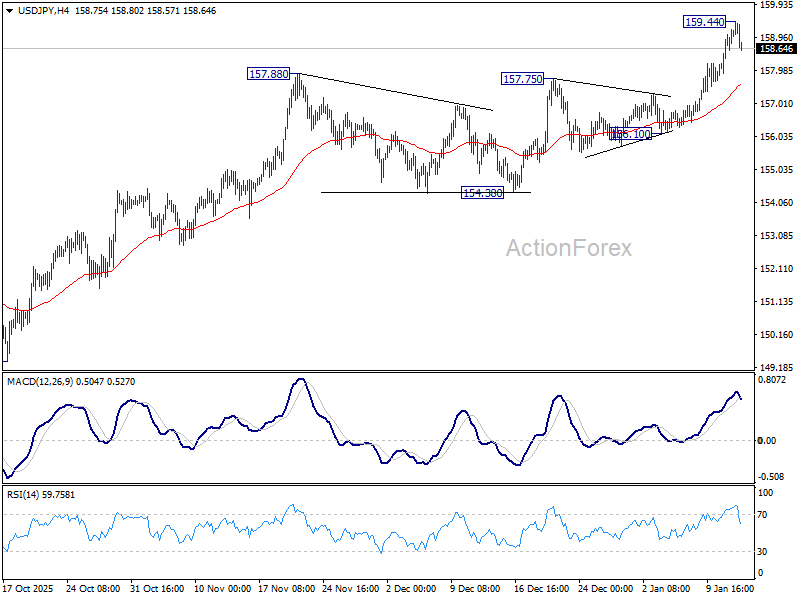
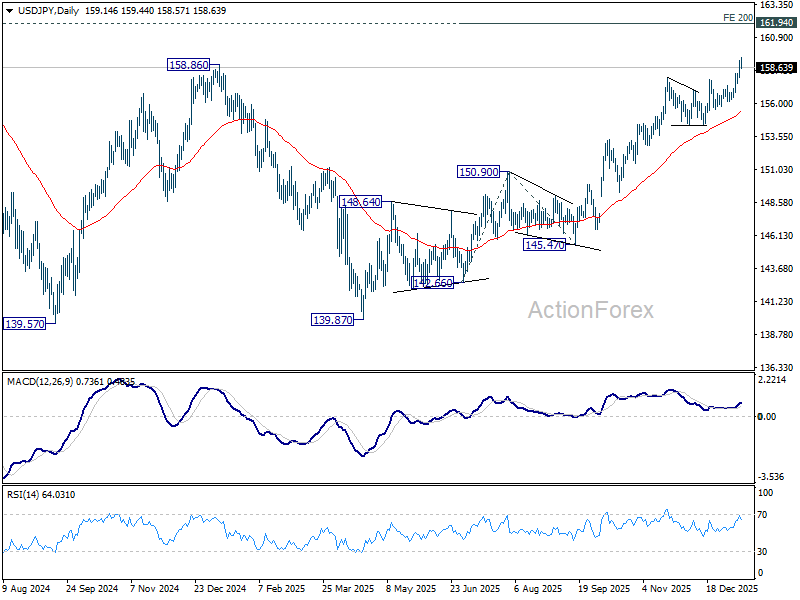
In the bigger picture, corrective pattern from 161.94 (2024 high) could have completed with three waves at 139.87. Larger up trend from 102.58 (2021 low) could be ready to resume through 161.94. Decisive break of 158.85 structural resistance will solidify this bullish case and target 161.94 for confirmation. On the downside, break of 154.38 support will dampen this bullish view and extend the corrective range pattern with another falling leg.
GBP/USD Daily Outlook
Daily Pivots: (S1) 1.3397; (P) 1.3446; (R1) 1.3471; More...
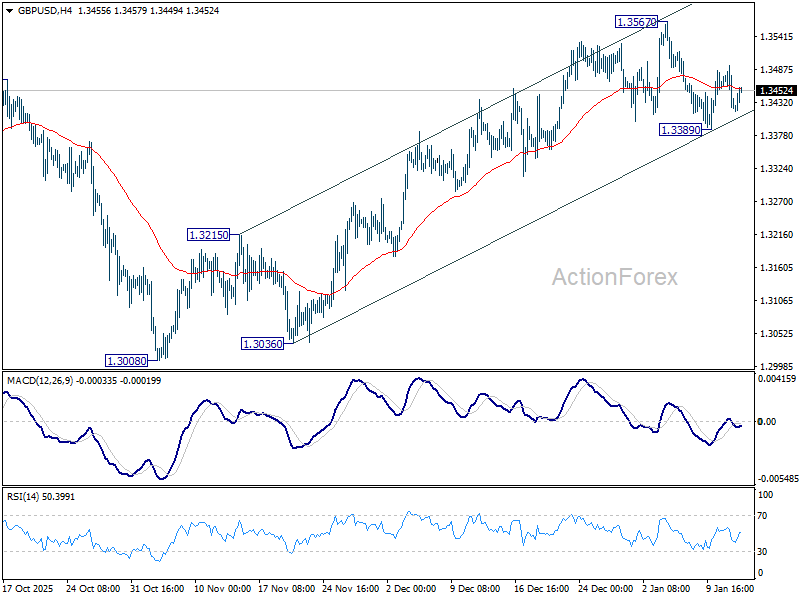
Intraday bias in GBP/USD remains neutral as range trading continues inside 1.3389/3567. On the upside, break of 1.3567 will resume the rally from 1.3008 towards 1.3787 high. On the downside, break of 1.3389 will resume the fall from 1.3567. Sustained break of 55 D EMA (now at 1.3375) will argue that the decline is another falling leg in the corrective pattern from 1.3787. In this case, deeper fall should be seen back to 1.3008 support.
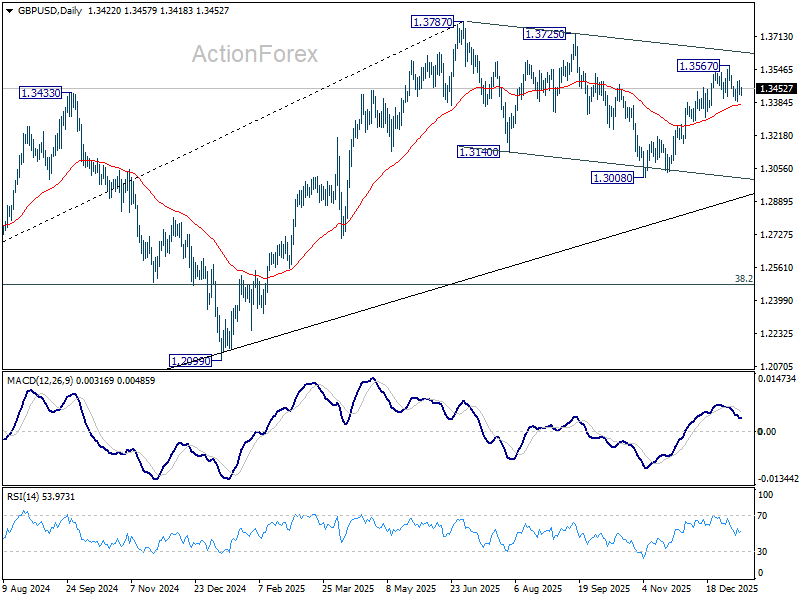
In the bigger picture, price actions from 1.3787 (2025 high) are seen as a correction to the larger up trend from 1.3051 (2022 low). Deeper decline could be seen as the pattern extends, but downside should be contained by 38.2% retracement of 1.0351 to 1.3787 at 1.2474 to bring rebound. Break of 1.3787 for up trend resumption is expected at a later stage.
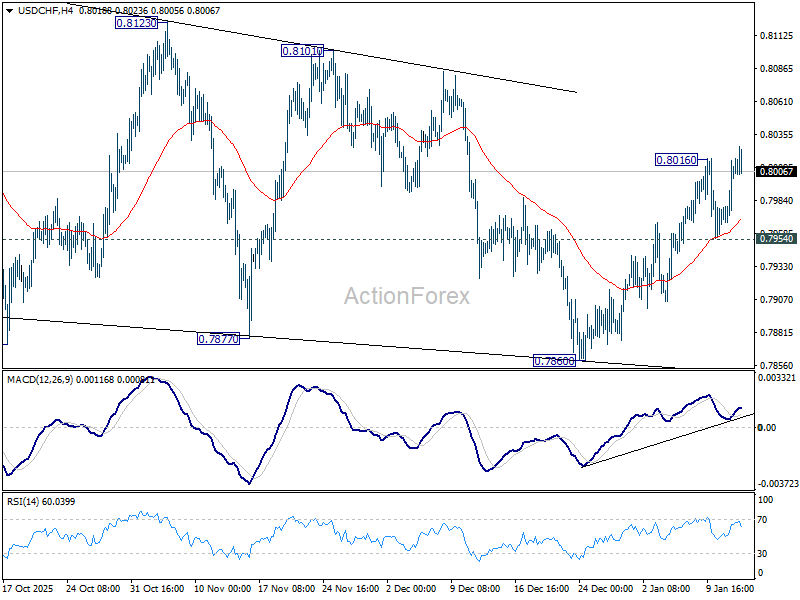
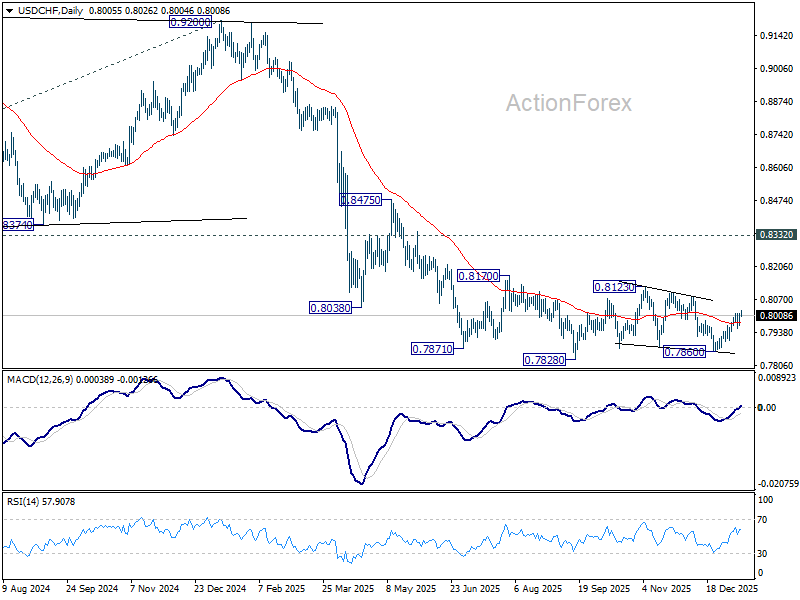
USD/CHF Daily Outlook
Daily Pivots: (S1) 0.7981; (P) 0.7998; (R1) 0.8029; More….
USD/CHF's rebound from 0.7860 resumed by breaking through 0.8016. Intraday bias is back on the upside for 0.8123 resistance. On the downside, below 0.7954 support will turn intraday bias neutral again first. Overall, corrective pattern from 0.7828 low is in progress and would extend further.
In the bigger picture, price actions from 0.7828 are seen as a correction. Larger down trend from 1.0342 (2017 high) is in still in progress. Break of 0.7828 will target 100% projection of 1.0146 (2022 high) to 0.8332 from 0.9200 at 0.7382. In any case, outlook will stay bearish as long as 0.8332 support turned resistance holds (2023 low).
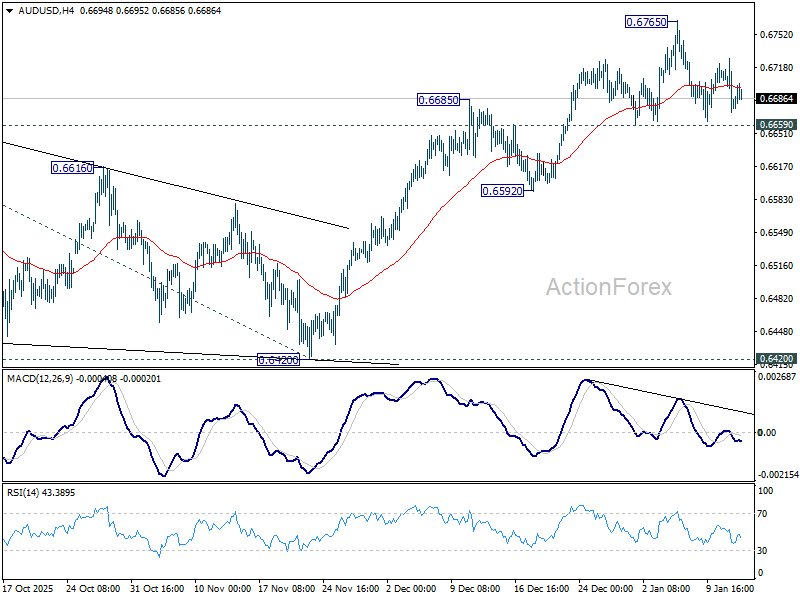
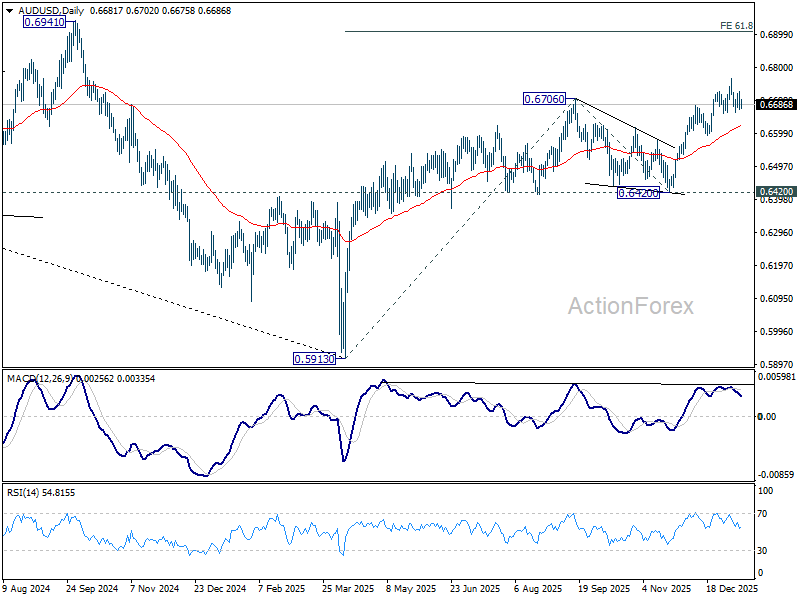
AUD/USD Daily Report
Daily Pivots: (S1) 0.6660; (P) 0.6693; (R1) 0.6714; More...
Intraday bias in AUD/USD remains neutral as consolidations continue below 0.6765. Further rally is in favor with 0.6659 support intact. On the upside, break of 0.6765 will resume the whole rise from 0.5913 and target 61.8% projection of 0.5913 to 0.6706 from 0.6420 at 0.6910. However, considering bearish divergence condition in 4H MACD, firm break of 0.6659 will confirm short term topping, and bring deeper correction back towards 0.6592 support.
In the bigger picture, current development argues that rise from 0.5913 (2024 low) is reversing whole down trend from 0.8006 (2021 high). Further rally should be seen to 61.8% retracement of 0.8006 to 0.5913 at 0.7206. This will remain the favored case as long as 0.6420 support holds.
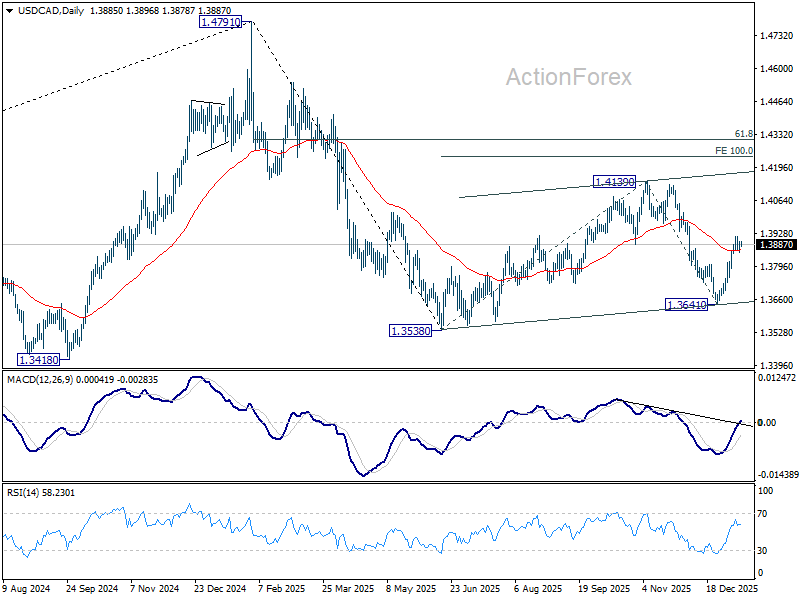
USD/CAD Daily Outlook
Daily Pivots: (S1) 1.3865; (P) 1.3882; (R1) 1.3907; More...
Intraday bias in USD/CAD remains neutral as consolidations continue below 1.3917 temporary top. Further rise is expected as long as 1.3789 minor support holds. Rise from 1.3641 is seen as the third leg of the corrective pattern from 1.3538. Above 1.3917 will target 1.4139 first. Break there will target 100% projection of 1.3538 to 1.4139 from 1.3641 at 1.4242.
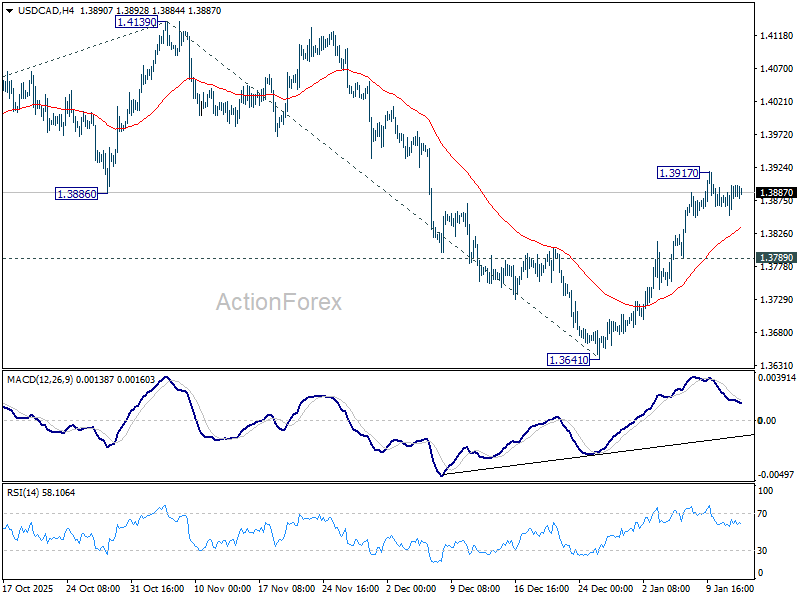
In the bigger picture, price actions from 1.4791 are seen as a corrective pattern to the whole up trend from 1.2005 (2021 low). Deeper fall could be seen as the pattern extends, and break of 1.3538 will target 61.8% retracement of 1.2005 to 1.4791 at 1.3069. For now, medium term outlook will be neutral until there are signs that the correction has completed.
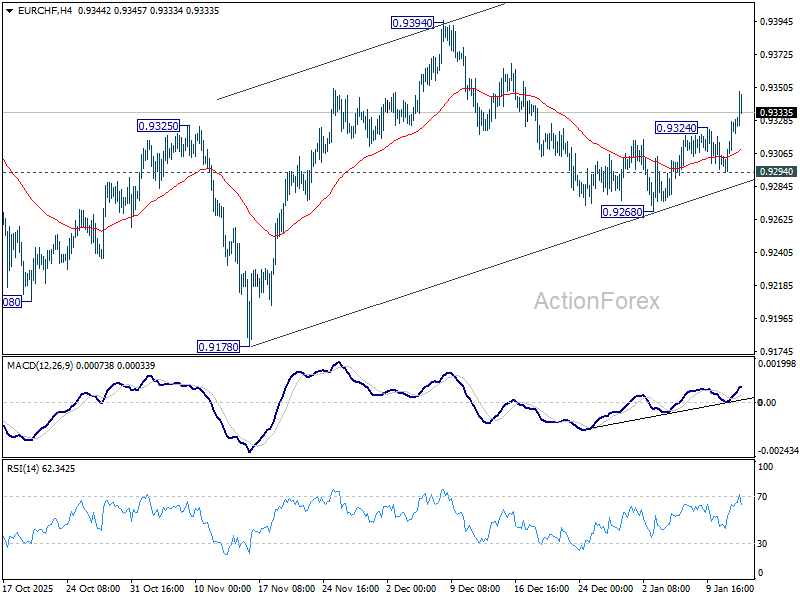
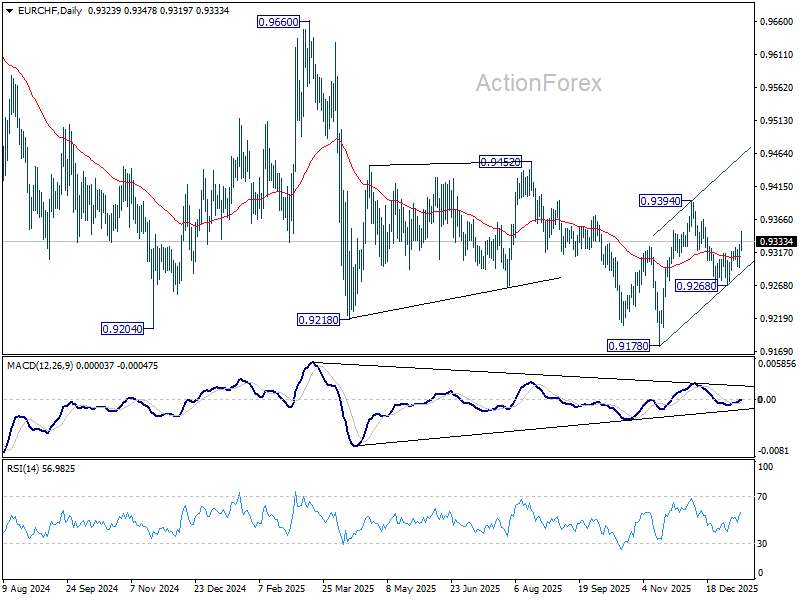
EUR/CHF Daily Outlook
Daily Pivots: (S1) 0.9305; (P) 0.9317; (R1) 0.9338; More....
EUR/CHF's rebound from 0.9268 resumed by breaking through 0.9324 and intraday bias is back on the upside. Pullback from 0.9394 should have completed, and further rise should be seen to retest this resistance next. For now, risk will stay mildly on the upside as long as 0.9294 support holds, in case of retreat.
In the bigger picture, persistent bullish convergence condition in W MACD is a medium term bullish sign. Firm break of 0.9394 resistance should bring sustained trading above 55 W EMA (now at 0.9362). That should indicate medium term bottoming at 0.9178. Further break of 0.9452 resistance will bring stronger medium term rally towards 0.9928 resistance next, even still as a corrective bounce. Nevertheless, rejection by 55 W EMA will retain bearishness for another fall through 0.9178 at a later stage.
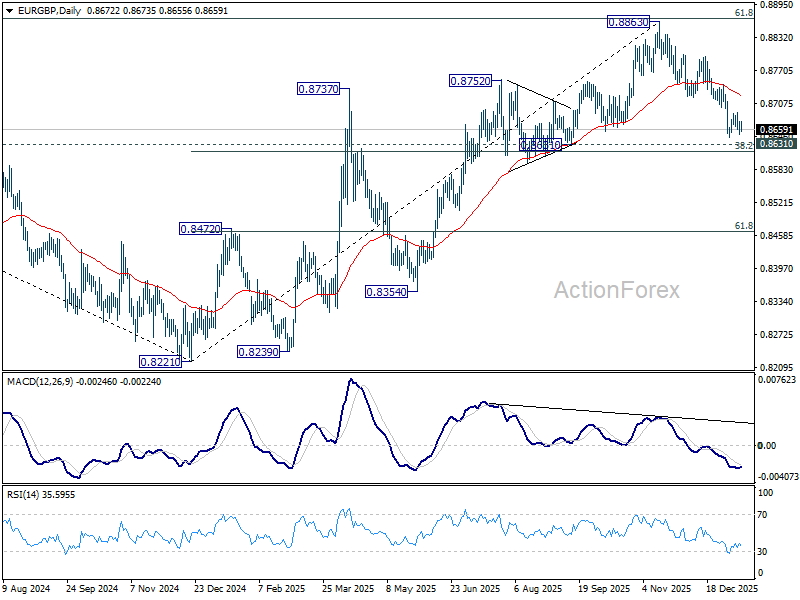
EUR/GBP Daily Outlook
Daily Pivots: (S1) 0.8659; (P) 0.8667; (R1) 0.8682; More…
Intraday bias in EUR/GBP remains neutral as consolidations continue above 0.8643. Risk stays on the downside with 0.8720 support turned resistance intact. On the downside, decisive break of 0.8631 cluster support (38.2% retracement of 0.8221 to 0.8663 at 0.8618) will pave the way to 61.8% retracement at 0.8466. Nevertheless, sustained break of 0.8720 will bring stronger rally back to 0.8796 resistance instead.
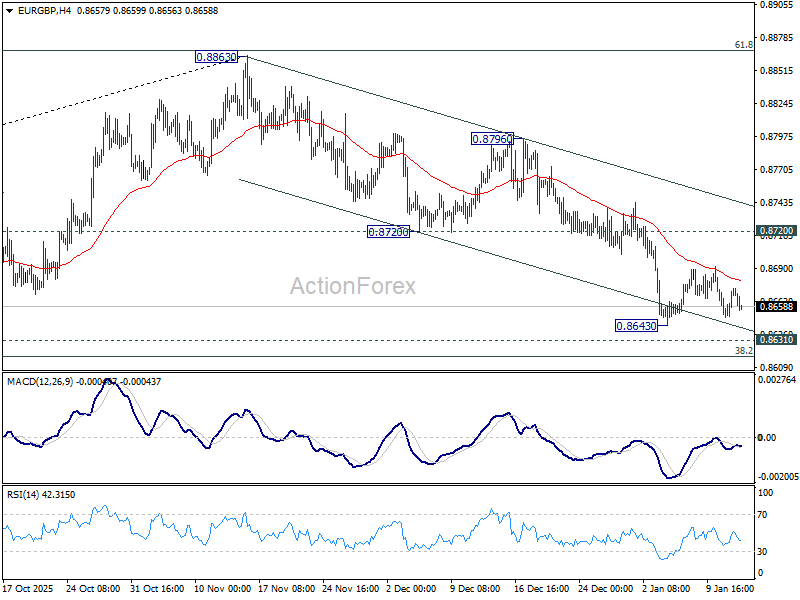
In the bigger picture, rise from 0.8221 medium term bottom (2024 low) is seen as a corrective move. Upside should be limited by 61.8% retracement of 0.9267 to 0.8221 at 0.8867. Sustained trading below 55 W EMA (now at 0.8622) should confirm that this corrective bounce has completed. In this case, deeper fall would be seen back to 0.8201/21 key support zone. However, decisive break of 0.8867 will suggest that EUR/GBP is already reversing whole decline from 0.9267 (2022 high). That should pave the way back to 0.9267.
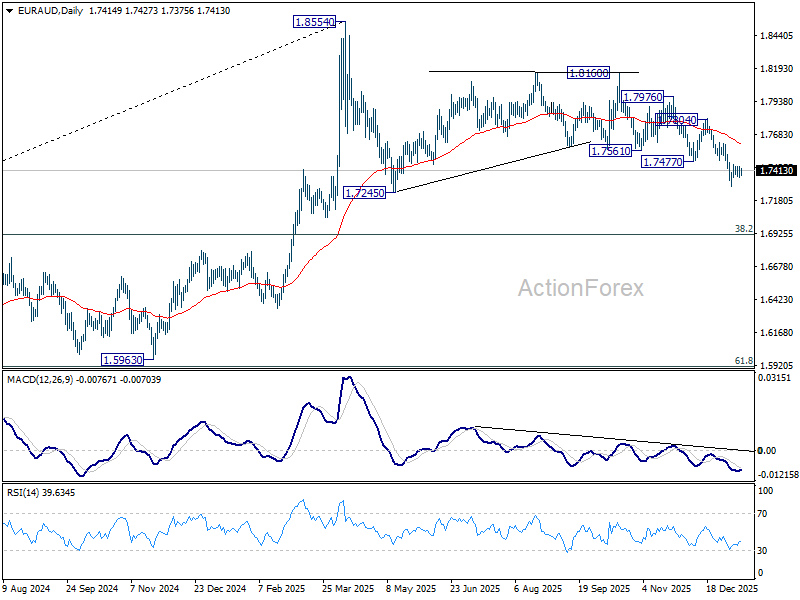
EUR/AUD Daily Outlook
Daily Pivots: (S1) 1.7374; (P) 1.7410; (R1) 1.7464; More...
EUR/AUD is staying in consolidations from 1.7287 and intraday bias stays neutral at this point. Risk will stay on the downside as long as 1.7477 support turned resistance holds. Current decline is seen as the third leg of the corrective pattern from 1.8554. Below 1.7287 will target 1.7245 support, and then 1.6922 fibonacci level. Nevertheless, firm break of 1.7477 will indicate short term bottoming, and bring stronger rebound back to 55 D EMA (now at 1.7619).
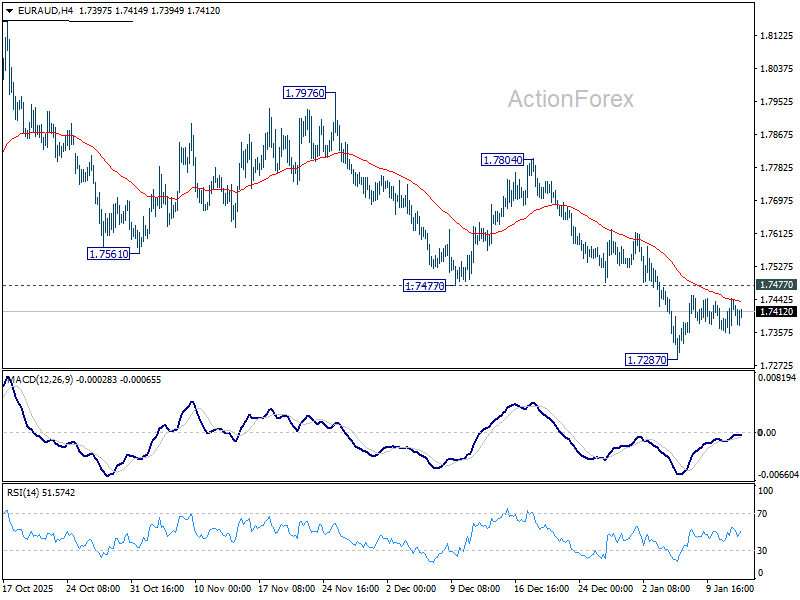
In the bigger picture, the break of 55 W EMA (now at 1.7468) argues that fall from 1.8554 medium term top is already correcting whole up trend from 1.4281 (2022 low). Deeper decline is in favor to 38.2% retracement of 1.4281 to 1.8554 at 1.6922, and possibly below. Risk will stay on the downside as long as 1.8160 resistance holds, in case of strong rebound.
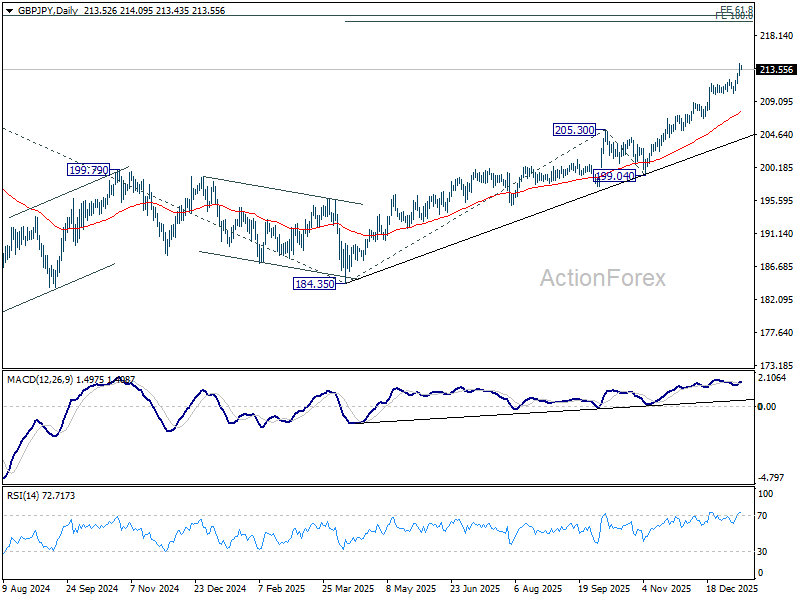
GBP/JPY Daily Outlook
Daily Pivots: (S1) 212.75; (P) 213.53; (R1) 214.39; More...
Intraday bias in GBP/JPY remains on the upside for the moment. Current up trend should now target 100% projection of 184.35 to 205.30 from 199.04 at 219.99 next. For now, outlook will stay bullish as long as 210.28 support holds, in case of retreat.
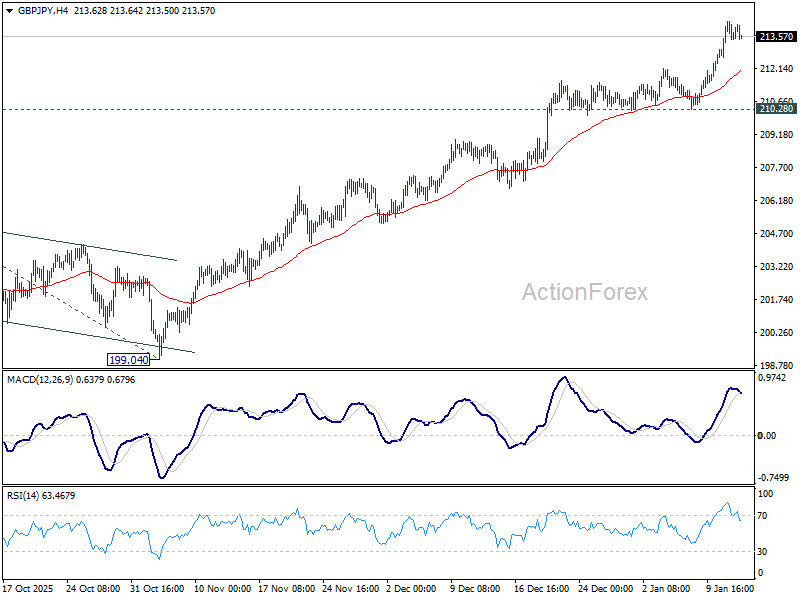
In the bigger picture, up trend from 123.94 (2020 low) is in progress. Next target is 61.8% projection of 148.93 (2022 low) to 208.09 (2024 high) from 184.35 at 220.90. On the downside, break of 205.30 resistance turned support is needed to indicate medium term topping. Otherwise, outlook will stay bullish even in case of deep pullback.
Gold Sets New Highs, With Further Gains Ahead
Gold prices rose above 4,622 USD per ounce on Wednesday, challenging previous record levels. The rally is underpinned by growing expectations of US interest rate cuts this year and heightened demand for defensive assets.
December data pointed to a moderation in core US inflation, confirming a gradual easing of price pressures and clarifying the economic picture following earlier disruptions.
In this environment, interest rate futures reflect a divergence in expectations: investors are pricing in two to three rate cuts from the Federal Reserve in 2025, exceeding the median forecast from policymakers themselves, which signals only one reduction.
Safe-haven demand has also been reinforced by concerns over the Fed’s independence following the launch of a criminal investigation related to Chair Jerome Powell’s congressional testimony in June.
Geopolitical tensions remain elevated, with markets closely monitoring the risk of US involvement in political instability in Iran amid recurring warnings of potential military action.
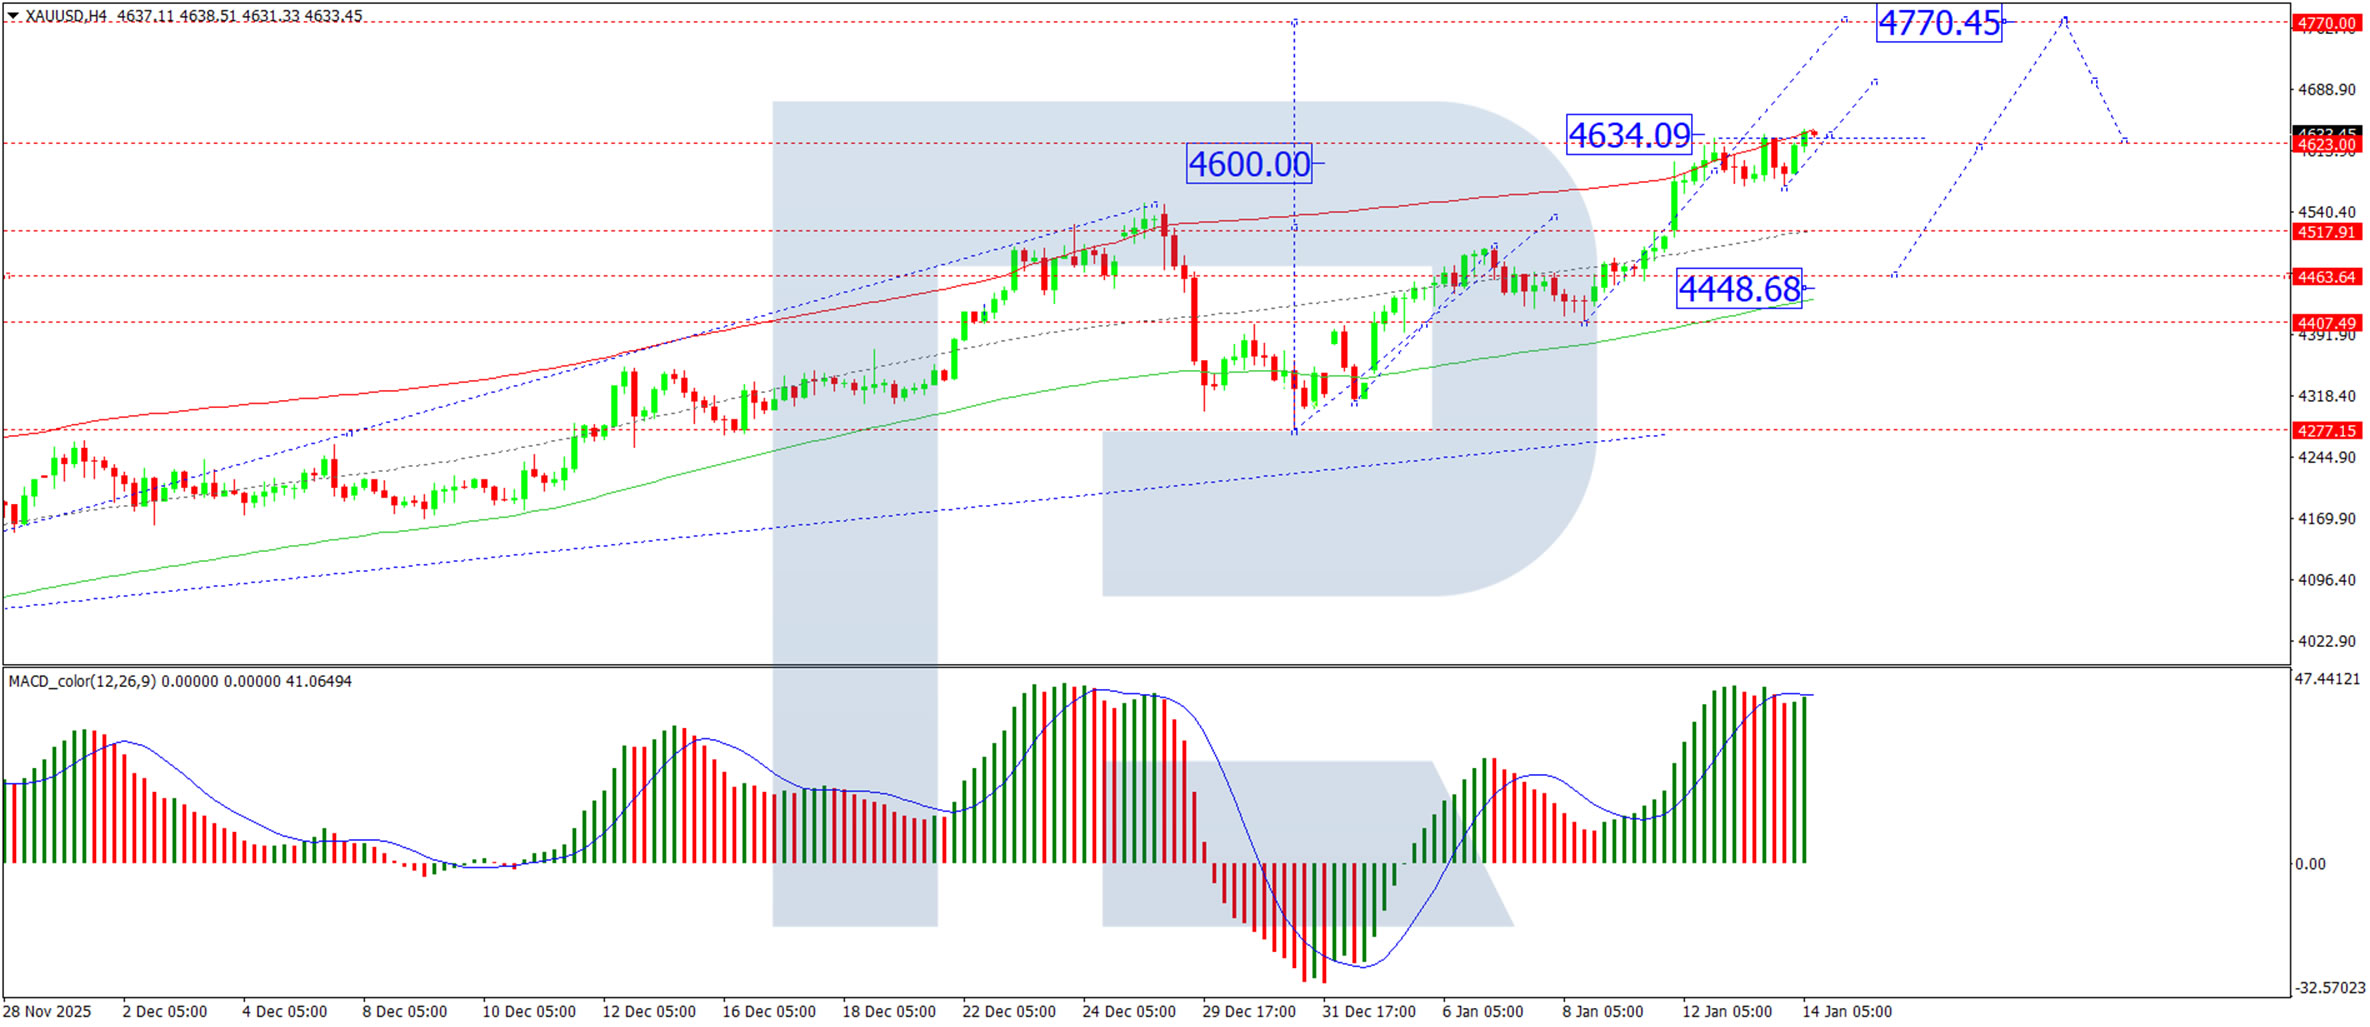
Technical Analysis: XAU/USD
H4 Chart:
On the H4 chart, XAU/USD is consolidating around 4,623 USD. An upward expansion of this range towards 4,770 USD is anticipated, likely to be followed by a corrective pullback towards 4,620 USD. A break below this level would open the door to a deeper correction towards 4,520 USD.
The MACD indicator supports the bullish outlook, with its signal line turning upward and pressing towards new highs, indicating sustained upward momentum.
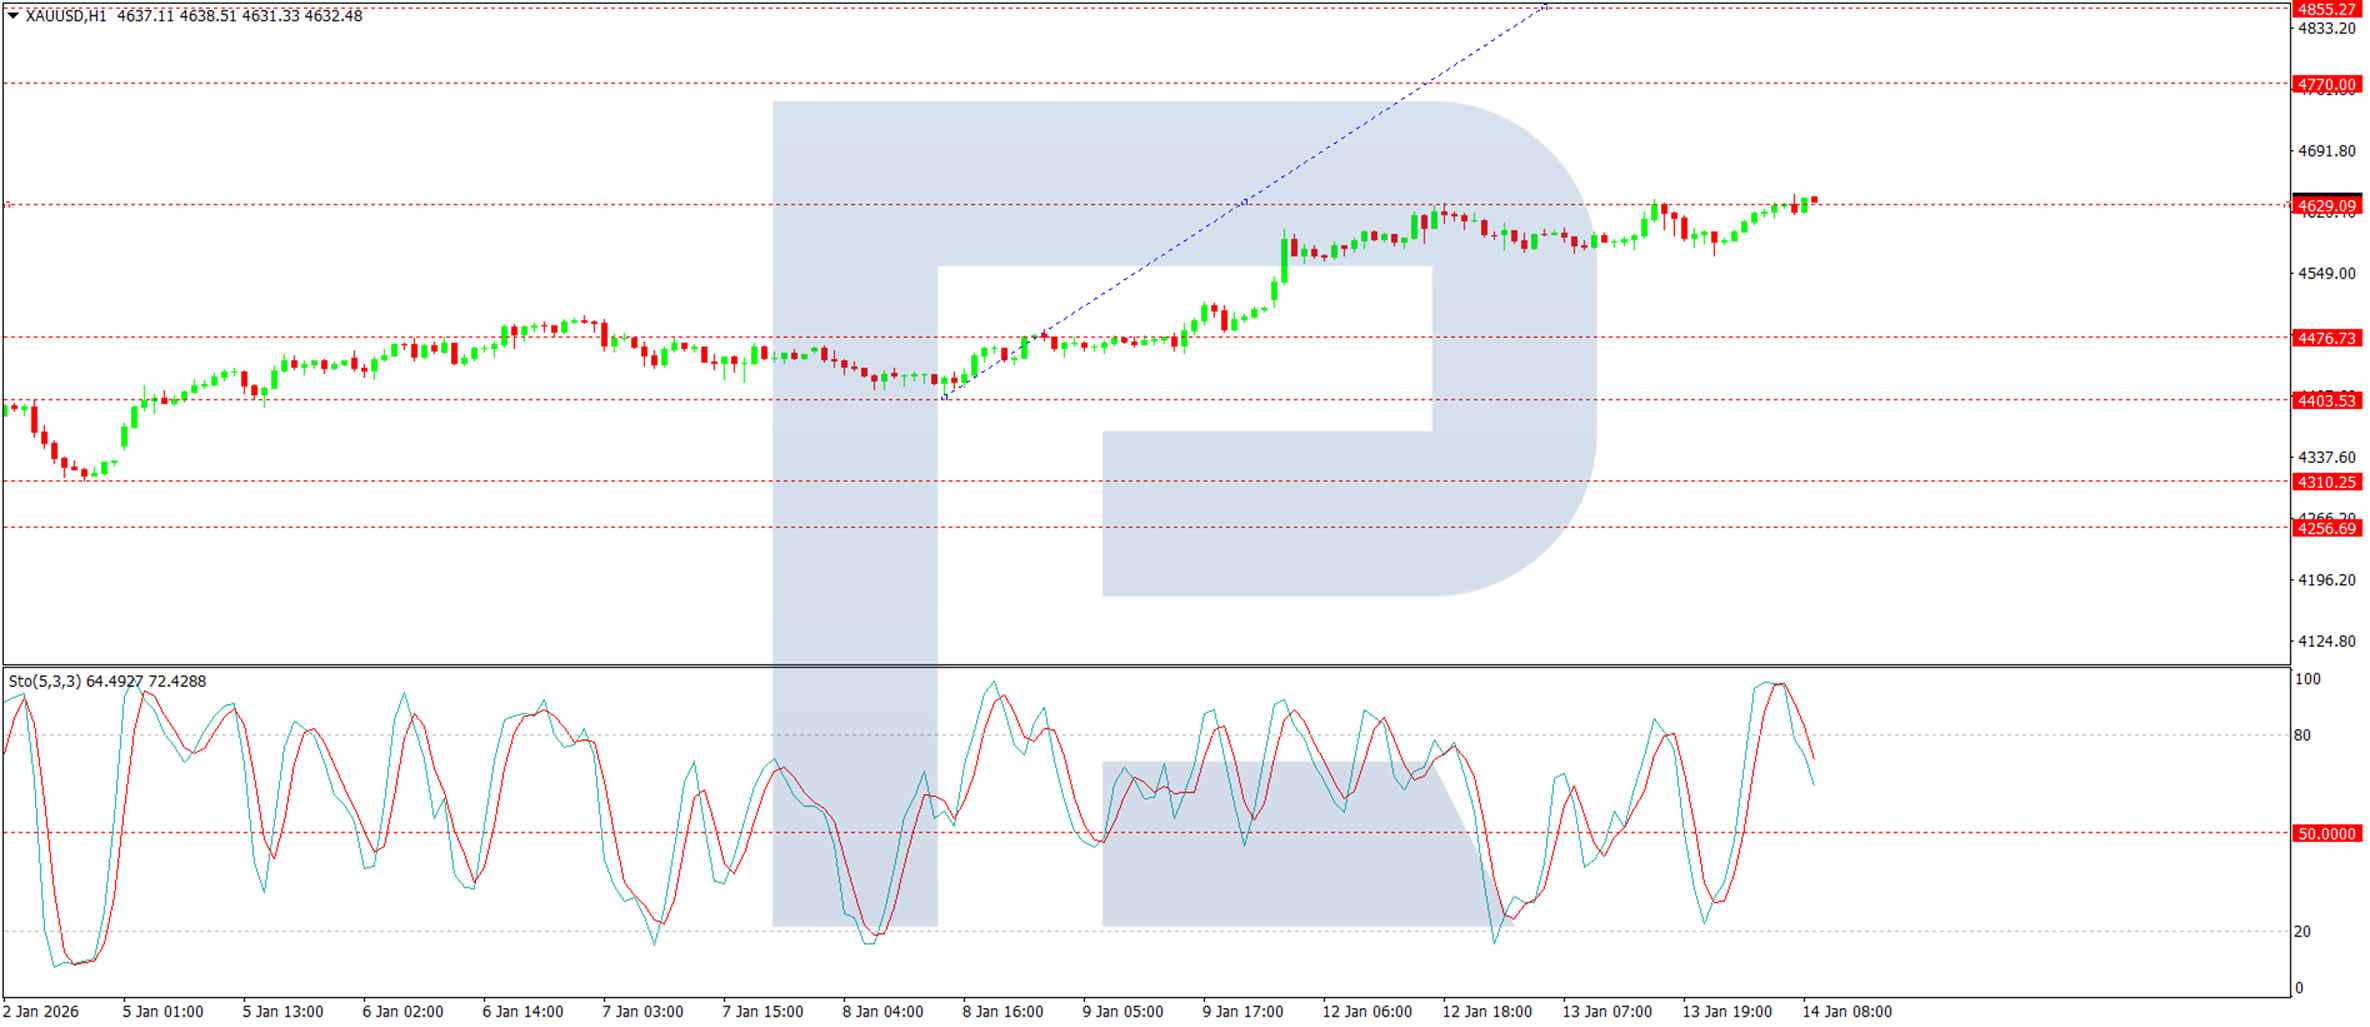
H1 Chart:
On the H1 chart, the market has formed a consolidation range around 4,629 USD and is now building the next leg higher, targeting at least 4,770 USD. This structure reinforces the broader uptrend.
The Stochastic oscillator aligns with this view, as its signal line is positioned at 80 and continues to point upward, signalling strong near-term bullish momentum.
Conclusion
Gold continues to draw strength from shifting rate expectations, political uncertainty, and persistent geopolitical risks. While the near-term technical structure suggests potential for further gains towards 4,770 USD, traders should remain mindful of overextended conditions and the likelihood of a corrective pullback thereafter. A sustained move above current levels would reinforce the longer-term bullish narrative, while a break below 4,620 USD could signal a deeper retracement before the next leg higher.