Sample Category Title
USDJPY Wave Analysis
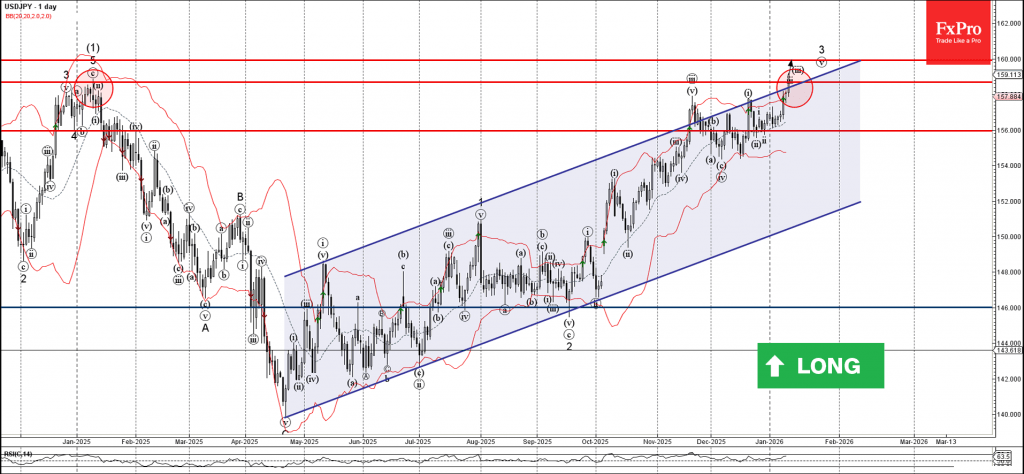
USDJPY ⬆️ Buy
- USDJPY broke resistance area
- Likely to rise to resistance level 160.00
USDJPY currency pair recently broke the resistance area between the long-term resistance level 158.70 (which started the sharp downtrend in January) and the resistance trendline of the weekly up channel from April.
The breakout of this resistance area accelerated the active impulse waves v and 3 – which belong to the extended impulse wave (3) from April.
Given the clear daily uptrend, USDJPY currency pair can be expected to rise to the next resistance level 160.00 (target for the completion of the active impulse waves v and 3).
Eco Data 1/14/26
| GMT | Ccy | Events | Act | Cons | Prev | Rev |
|---|---|---|---|---|---|---|
| 21:45 | NZD | Building Permit Nov | 2.80% | -0.90% | -0.70% | |
| 03:00 | CNY | Trade Balance (USD) Dec | 114.1B | 114.2B | 111.7B | |
| 06:00 | JPY | Machine Tool Orders Y/Y Dec P | 10.60% | 14.20% | 14.20% | 14.80% |
| 13:30 | USD | Current Account (USD) Q3 | -226B | -240B | -251B | -249B |
| 13:30 | USD | Retail Sales M/M Nov | 0.60% | 0.40% | 0.00% | -0.10% |
| 13:30 | USD | Retail Sales ex Autos M/M Nov | 0.50% | 0.40% | 0.40% | 0.20% |
| 15:00 | USD | Existing Home Sales Dec | 4.35M | 4.20M | 4.13M | 4.14M |
| 15:00 | USD | Business Inventories Oct | 0.30% | 0.30% | 0.20% | |
| 15:30 | USD | Crude Oil Inventories (Jan 9) | 3.4M | -1.7M | -3.8M | |
| 19:00 | USD | Fed's Beige Book |
| 21:45 | NZD |
| Building Permit Nov | |
| Actual | 2.80% |
| Consensus | |
| Previous | -0.90% |
| Revised | -0.70% |
| 03:00 | CNY |
| Trade Balance (USD) Dec | |
| Actual | 114.1B |
| Consensus | 114.2B |
| Previous | 111.7B |
| 06:00 | JPY |
| Machine Tool Orders Y/Y Dec P | |
| Actual | 10.60% |
| Consensus | 14.20% |
| Previous | 14.20% |
| Revised | 14.80% |
| 13:30 | USD |
| Current Account (USD) Q3 | |
| Actual | -226B |
| Consensus | -240B |
| Previous | -251B |
| Revised | -249B |
| 13:30 | USD |
| Retail Sales M/M Nov | |
| Actual | 0.60% |
| Consensus | 0.40% |
| Previous | 0.00% |
| Revised | -0.10% |
| 13:30 | USD |
| Retail Sales ex Autos M/M Nov | |
| Actual | 0.50% |
| Consensus | 0.40% |
| Previous | 0.40% |
| Revised | 0.20% |
| 15:00 | USD |
| Existing Home Sales Dec | |
| Actual | 4.35M |
| Consensus | 4.20M |
| Previous | 4.13M |
| Revised | 4.14M |
| 15:00 | USD |
| Business Inventories Oct | |
| Actual | 0.30% |
| Consensus | 0.30% |
| Previous | 0.20% |
| 15:30 | USD |
| Crude Oil Inventories (Jan 9) | |
| Actual | 3.4M |
| Consensus | -1.7M |
| Previous | -3.8M |
| 19:00 | USD |
| Fed's Beige Book | |
| Actual | |
| Consensus | |
| Previous | |
WTI smashes through 60 as on intensifying Iran risk, bullish reversal underway?
Oil prices accelerated higher today, with WTI decisively breaking above 60 level as markets rebuilt geopolitical risk premium. Traders are factoring in a cluster of geopolitical risks, including potential exclusion of Iranian exports, renewed supply uncertainty around Venezuela, ongoing talks surrounding the Russia-Ukraine war, and broader strategic tensions linked to Greenland.
In particular, Iran is central to the current repricing. As one of the top producers within OPEC, Iran has been hit by its largest anti-government protests in years. Economists estimate that unrest in Iran has already added roughly USD 3–4 per barrel in geopolitical risk premium.
Additionally, the forceful government crackdown has drawn sharp warnings the US, including the threat of possible military action. The late upleg in oil prices appeared to be triggered right after President Donald Trump warned any country doing business with Iran would face a 25% tariff on all trade conducted with the US, a move that risks tightening Iran’s effective export channels.
Technically, WTI is clearly in near-term upside acceleration as the rebound from 54.98 extends. It's now targeting 161.8% projection of 54.98 to 58.96 from 55.79 at 62.21. If the move is corrective as currently seen, that 62.21 area should act as a natural cap.
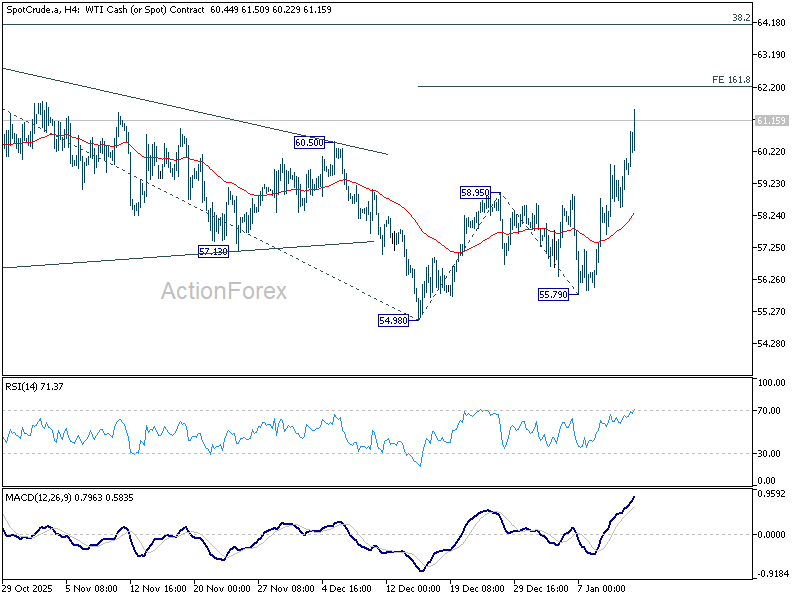
However, sustained break above 62.21 would argue the rally is impulsive rather than corrective, opening the case for a broader bullish trend reversal. Such a development would mark a significant shift in market structure.
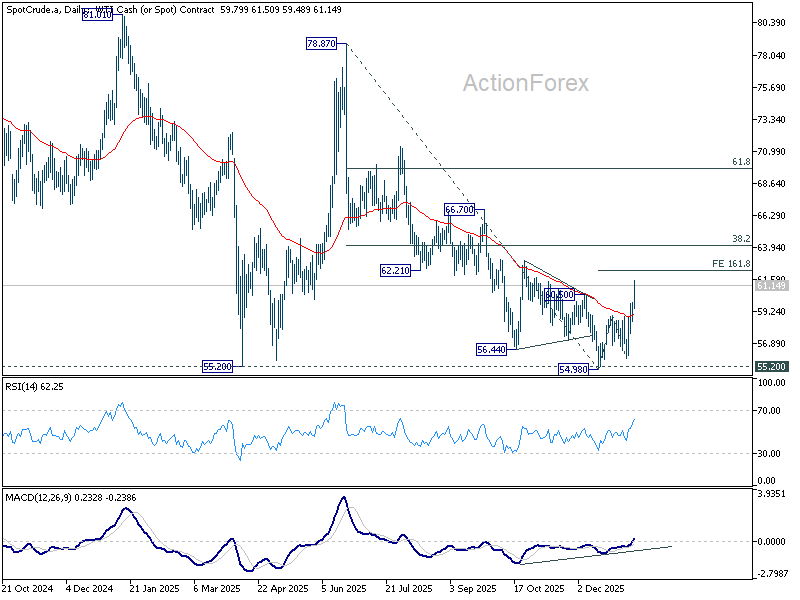
Indeed, the daily chart signals support that possibility. WTI has successfully defended key support at 55.20 (2025 low), formed bullish convergence on D MACD, and reclaimed the 55 D EMA decisively. A confirmed break above 62.21 would raise the probability that the entire decline from 78.87 (2025 high) is reversing. That would open up further rise through 38.2% retracement of 78.87 to 54.98 at 64.10.
Fed’s Musalem sees little need for near-term easing
St. Louis Fed President Alberto Musalem said he sees little justification for further near-term easing, arguing that the Fed’s policy rate is already “right around neutral.” Excluding inflation, Musalem estimates the real policy rate at roughly 1%, and warned it would be "inadvisable" to push policy into an accommodative stance at this stage.
Musalem said he supported the December rate cut due to a slightly elevated risk to the labor market alongside moderating concerns about accelerating inflation. However, he emphasized that additional easing would only be warranted if the labor market weakens more than expected and inflation falls below 2%, allowing policy to be eased without becoming stimulative.
Looking ahead, Musalem expects the US economy to grow at or above potential in 2026, supported by "robust tailwinds" from fiscal stimulus and the lagged effects of prior rate cuts. He said the labor market as cooling in an orderly fashion and remaining resilient, with unemployment near its neutral level and job growth around breakeven rates of roughly 30k to 80k per month.
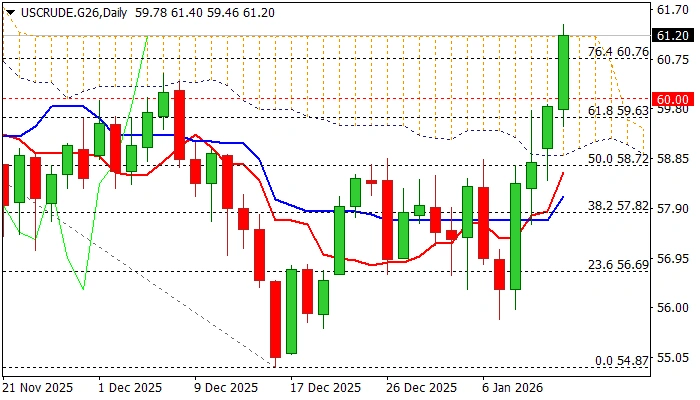
WTI: Oil Prices Rise Further on Iran Uncertainty and Growing Supply Fears
WTI Oil price extends steep rally into fourth consecutive day, as growing tensions over Iran fuel fears of potential supply disruptions. Adding to strong uncertainty was the latest threat from President Trump that he will impose a 25% tax to all countries that buy oil from Iran.
Slight optimism from Venezuela, where the situation is calmer and outlook for normalization of oil supply, did not make significant counter effect that kept oil prices rising.
Today’s rally (oil was up around 2.7% for the day) broke important barriers at $60 (psychological), 60.25 (100DMA) $60.76 (Fibo 76.4% of $62.58/$54.87 descend) and $61.00 (round figure) and probed above the top of descending daily Ichimoku cloud ($61.18).
Improving daily studies support the action, though stretched indicators suggest that bulls may take a breather.
Limited dips are likely to mark positioning for fresh push higher, as geopolitical situation is fragile with serious risk of further escalation, which would spark stronger rally of oil prices.
Potential dips should find firm ground above broken $60 level to keep bulls alive, with sustained break above daily cloud to unmask targets at $62.24 (200DMA) and $62.58/80 (tops of Oct 24 / Oct 9).
Res: 61.18; 61.40; 62.24; 62.58.
Sup: 60.76; 60.25; 60.00; 59.46.
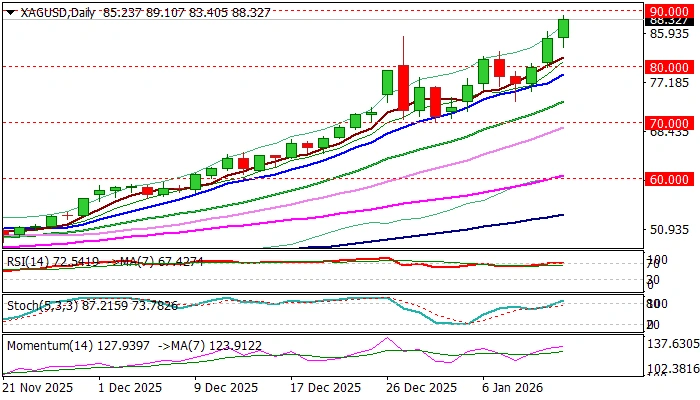
XAG/USD: Silver Hits New Record High, Nears $90 Barrier and Eyes $100
Silver continues to trend higher despite warnings from overbought daily studies and hit new record high ($89.10) on Tuesday, following daily advance of nearly $6.
Precious metals continue to benefit from growing safe-haven demand, with silver being additionally supported by strong industrial demand and insufficient supply.
Bulls approach $90 level (round-figure), with psychological $100 barrier being unmasked.
Technical studies remain firmly bullish but overbought on all larger timeframes and traders should anticipate headwinds at $90 zone, but also to be aware of possible stronger dips on approach to $100 level, which marks very significant resistance.
Res: 89.10; 90.00; 91.30; 93.11
Sup: 87.22; 85.42; 83.40; 82.73
What Does a Snap Election in Japan Mean for Yen?
- Yen falls sharply on reports PM Takaichi is planning election.
- The slide triggers fresh intervention warnings.
- Investors push back their BoJ rate hike bets.
- Intervention alone may not be enough to save the day.
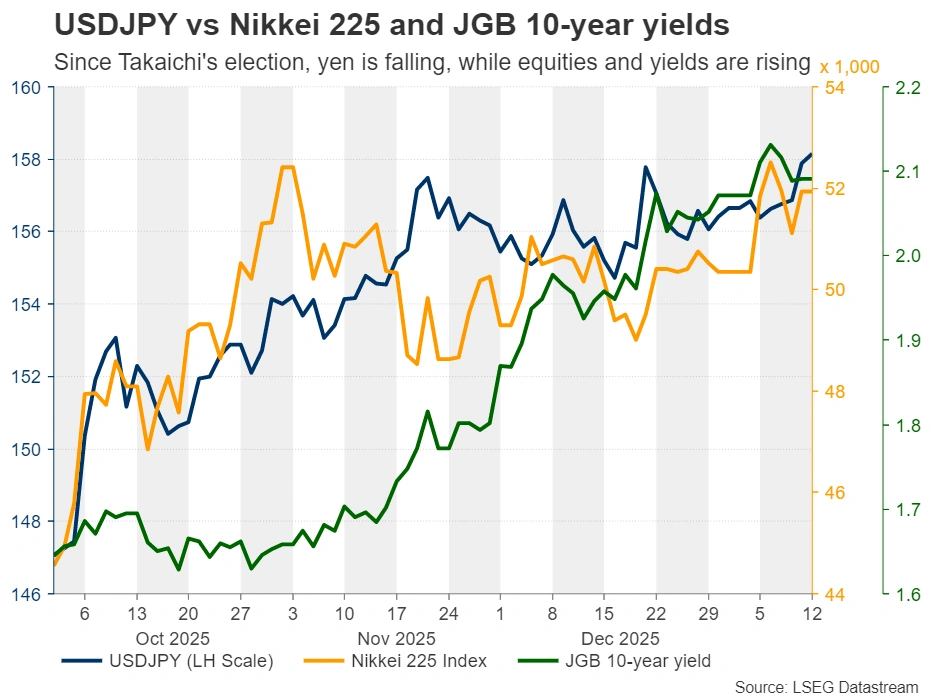
Yen accelerates downtrend amid Japan election jitters
Bank of Japan policymakers left 2025 wearing their hawkish suits after they raised interest rates to the highest level in three decades and signaled willingness to take them even higher. However, the Japanese yen was not able to capitalize on the Bank’s hawkish decision, perhaps as traders wanted more specific clues as to when officials were planning to hit the hike button next.
To make things even worse, the yen accelerated its downfall to territories last seen back in July 2024 after Kyodo News reported that Prime Minister Sanae Takaichi has told a senior member of the Liberal Democratic Party that she is thinking about calling a snap election in February.
With an approval rating of around 70%, she may be confident about a victory that will allow her to proceed more freely with her spending plans, which would add to the already ballooned government debt. That’s maybe why the yen is tumbling, while equities and Japanese Government Bond (JGB) yields are skyrocketing. This is the so-called “Takaichi trade” and may be intensified should the scenario of the LDP securing a single-party majority becomes even more likely.
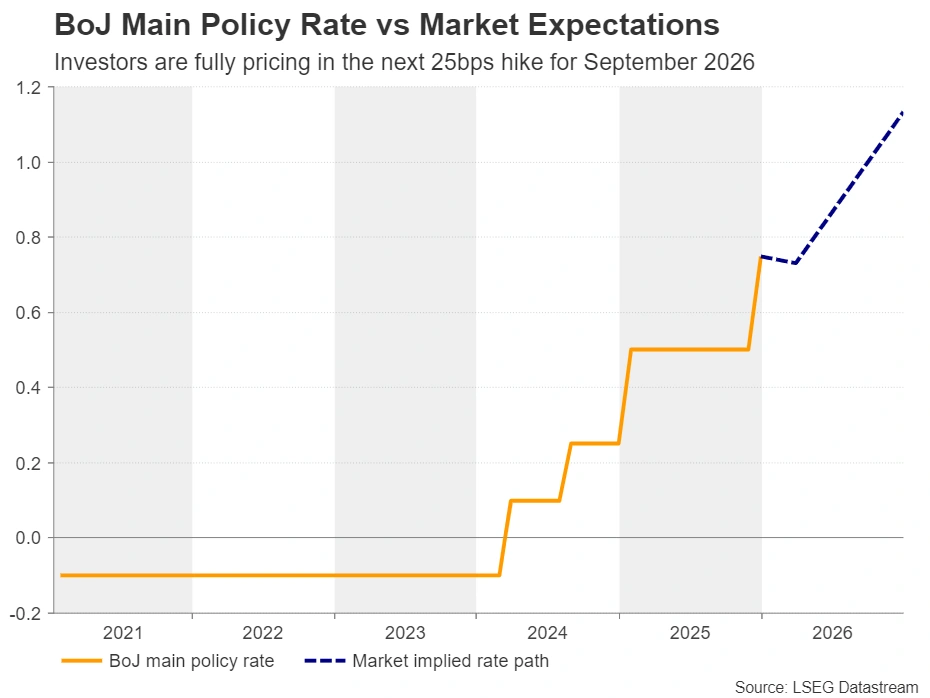
Besides the prospect of a piling debt, what is also driving the yen lower may be expectations that the BoJ’s hands will be tied ahead of the election. The next interest rate hike may be delivered after the spring wage negotiations, and only if the negotiations result in satisfying salary increases.
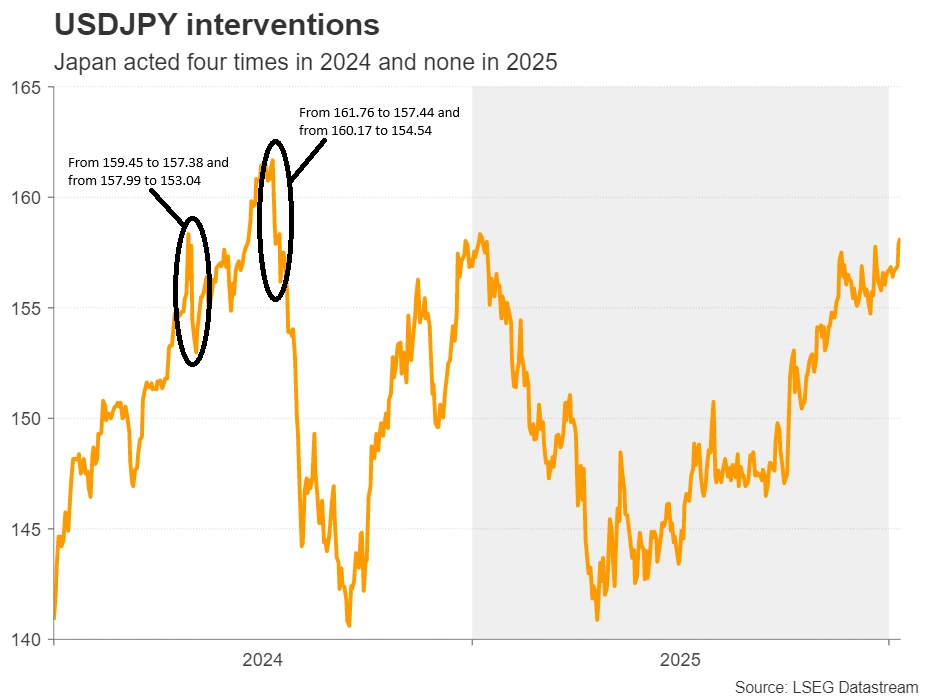
Yen tumble reignites intervention talk
However, with dollar/yen headed towards the psychological zone of 160.00 again, the intervention discussion is back on the table. Finance Minister Satsuki Katayama said at a meeting with US Treasury Secretary Scott Bessent that she remains concerned about the “one-way weakening of the yen,” with Bessent sharing those concerns and calling for the BoJ to raise interest rates.
Katayama warned about intervention back in December, when dollar/yen emerged above 157.00, noting that Japan has a “free hand” to take action. Maybe she met with Bessent to get the green light, which means that an intervention episode near the 160.00 zone is more likely than previously thought.
However, even the new warning was not enough to stop the yen’s bleeding, which raises the question whether actual action could do the work. In 2024, Japanese authorities stepped into the market to prop up the yen four times, twice in April and twice in July. In April, the impact was temporary, with the yen soon resuming its slide. In July, the effect was more meaningful, with dollar/yen falling from around 162.00 to below 140.00 by September. The difference is that in the second case, the intervention actions were followed by a BoJ rate hike.
Will a possible election delay BoJ rate hikes?
Therefore, with Takaichi planning to increase spending and thereby pile up more debt, any intervention episode could also have limited and short-lived impact. A BoJ rate hike may also be needed, as a weaker yen could fuel inflation through higher export costs; and this could eventually weigh on economic growth.
Currently, according to Japan’s Overnight Index Swaps market (OIS), a 25bps rate hike is not fully pencilled in until September and if the Bank is indeed not planning to act soon, the yen is likely to continue suffering, with intervention not being able to change its fate. Yields are likely to continue rallying, as fewer investors will be willing to finance Japan’s ballooning debt. However, equities are unlikely to continue cheering Takaichi’s spending plans indefinitely. At some point, worries about inflation and economic slowdown could prompt investors to abandon Japanese stocks as well, in a so-called “Sell Japan” episode.
Therefore, unless the Finance Ministry decides to intervene and the BoJ to hike interest rates soon, the yen may be destined to extend its downtrend, and dollar yen may easily find itself trading above 160.00 soon.
Dollar/Yen may extend uptrend even after intervention
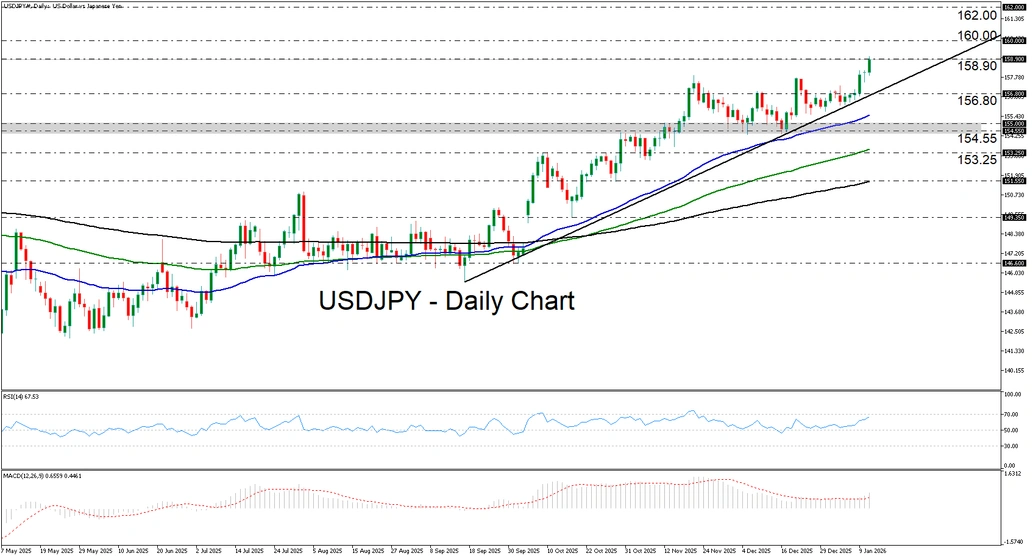
From a technical standpoint, dollar/yen is currently flirting with the 158.90 resistance, marked by the peak of January 10, 2025, where a clear close higher could encourage a test at the round figure of 160.00. The prevailing uptrend remains intact as marked by the uptrend line drawn from the low of September 17. A break above 160.00 could pave the way towards the high of July 3, 2024, at around 162.00. For a bearish reversal to start being considered, a decisive break below the 154.55 zone may be needed.
EUR/USD: Near-Term Studies Remain Bearishly Aligned
The Euro trades in a slower mode on Tuesday after previous day’s bounce temporarily sidelined larger bears (off 1.1808 peak).
Mixed signals from daily candlestick (bullish engulfing / strong upside rejection left bullish daily candle with long upper shadow) contribute to overall technical picture.
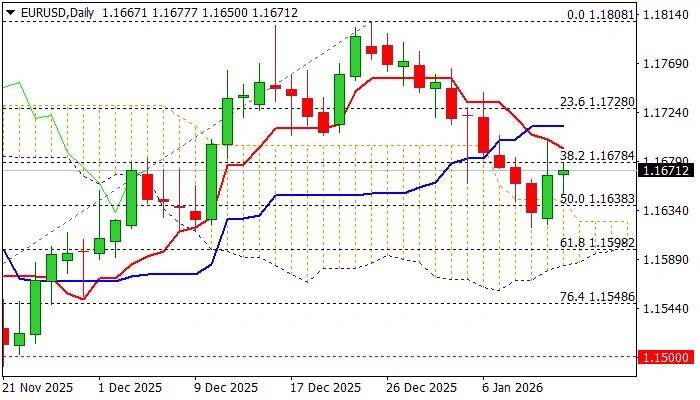
Momentum studies remain bearishly aligned and daily Tenkan/Kijun-sen formed bear-cross, along with still magnetic daily cloud twist, signal that near-term risk is still shifted to the downside.
Retest of cracked 50% retracement of 1.1468/1.1808 ascend (1.1638) and potential extension towards the top of thinning daily cloud (1.1623) might be likely near-term scenario, as long as the action is fueled by Monday’s bull-trap (above broken Fibo 38.2% at 1.1679) which also capped today’s action.
Although the dollar was hurt by fresh rally into safety that favored precious metals, today’s release of US economic data showed that inflation was practically unchanged and increased slightly less than expected in December, adding to expectations that the Fed would leave rates unchanged this month and keep the greenback underpinned.
Res: 1.1698; 1.1730; 1.1765; 1.1780.
Sup: 1.1650; 1.1638; 1.1618; 1.1598.
Sunset Market Commentary
Markets
Distorted or not, that’s the question. It’s anyone’s guess at the moment which specific items in the CPI basket still face an impact from the US government shutdown which led the Bureau of Labour Statistics to skip the November CPI report. So markets simply responded Pavlov-style. Headline December inflation printed bang in line with consensus at 0.3% M/M and stabilizing at 2.7% Y/Y, but core CPI was marginally more benign than feared at 0.2% M/M and 2.6% Y/Y (unchanged). Consensus expected the core print similar to the headline one. Monthly details showed lower prices for gas (-0.5%), used cars & trucks (-1.1%) and education (-1%) being compensated by amongst others higher prices for rent (+0.4%), recreation (+1.2%) and airline fares (+5.2%). Overall services prices increased by 0.3% M/M and 3.3% Y/Y. US Treasuries and US equity futures spiked higher on the lower core CPI move but the move doesn’t really stick. Daily changes on the US yield curve are currently near unchanged. We continue to keep a close eye on the US 10-yr yield which seems on the verge of breaking through 4.2% resistance. The same goes for a very temporary dip in the US dollar. Focus for US investors now turns to US President Trump’s scheduled address at the Detroit Economic Club’s annual “Michigan Economic Outlook” session (8pm CET) where he might double down on (populist) proposals to boost affordability going into this year’s mid-term elections. JPMorgan Chase today warned already that Trump’s call for a 10% cap on credit card rates threatens to significantly change its business. They pushed back against the proposal when publishing robust Q4 2025 results. Bank of America, Wells Fargo and Citi report tomorrow.
USD/JPY rose just above the 2025 top (158.87) as the Takaichi trade gathers steam. The Japanese PM seems willing to exploit her popularity by calling snap elections in the lower house. The LDP currently lacks an outright majority but Takaichi hopes to secure that, helping to enroll her (stimulative) fiscal agenda. JPY weakens prompting first minor FX intervention warnings. USD/JPY 160(+) levels proved to be a trigger back in April-July 2024. The Japanese Nikkei rallied over 3% in a combination (with FI & FX) you don’t see that often. The Japanese yield curve bear steepened with yields rising by up to 8.7 bps at the 30-yr tenor which now surpasses the level of the German one (3.5% vs 3.46%). There are modest spillover effects to Europe and the UK as well though. Rising oil prices are at play as well at the long end of the curve with Brent crude topping $65/b for the first time since early October over rising geopolitical risks. US President Trump warned that Iran will pay a big price for killing protesters and cancelling all meeting with Iranian officials until the killing ends.
News & Views
Hungarian inflation in December slightly surprised to the upside with a 0.1% m/m increase and 3.3% annual print. The latter nevertheless marks a slowdown from 3.8% in November and in doing so closes in on the central bank’s 3% (+/- 1ppt) midpoint target. Central bank (MNB) measures of core inflation varied between 3.6% and 5.2% with most of them showing a deceleration from November as well. With favorable base effects kicking in these next few months and the central bank at the December meeting dialing back its hawkish tone, chances for additional rate cuts in the near future are growing. Markets, however, were running a bit ahead of themselves lately in terms of MNB expectations with the likes of the 2-yr swap hitting the lowest levels since October 2024 just yesterday. This stretched positioning helps explain today’s 7 bps increase at the short end of the curve. The forint swapped earlier losses from EUR/HUF 388+ to 386.7 currently.
Final Czech CPI confirmed the preliminary release at -0.3% m/m and 2.1% for December, bringing the average annual rate at 2.5% (slightly up from 2.4% in 2024). The numbers were accompanied by the central bank’s (CNB) core measure, which showed the monthly series rising by 0.2% to be up 2.8% in yearly terms. Within the core basket, goods price rises picked up from 0.2% in November to 0.4%, as did services from 4.3% to 4.5%. The CNB described services inflation as “elevated” and closely monitors the cost of owner-occupied housing (5% from 4.8% in the previous months). The CNB is forecasting a headline CPI drop below 2% this year, perhaps even for a longer period, but added that core inflation would remain broadly unchanged, at least at the start of 2026. The latter, mainly driven through services, shows that “price developments in the domestic economy have not yet fully stabilized and require tight monetary conditions.” The Czech koruna strengthens a tad to EUR/CZK 24.23. Swap yields rise 2.5 bps at the front.
USD/JPY Mid-Day Outlook
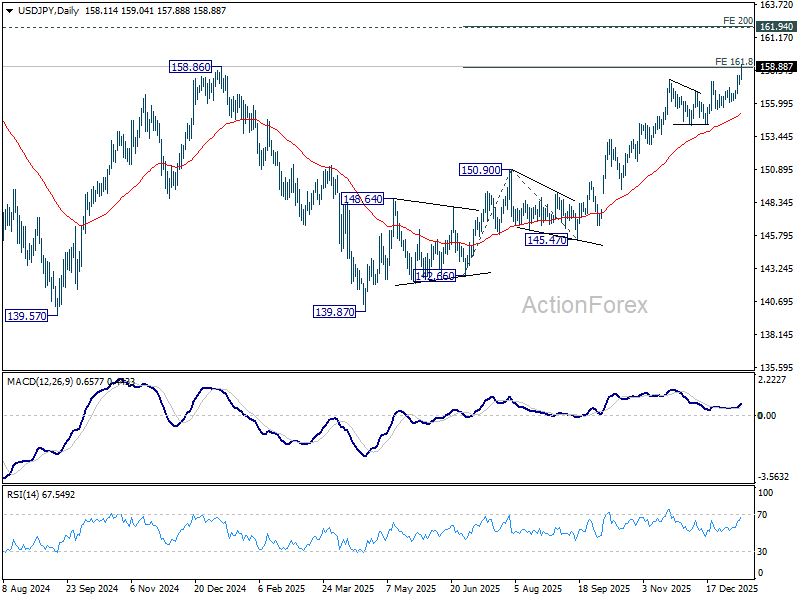
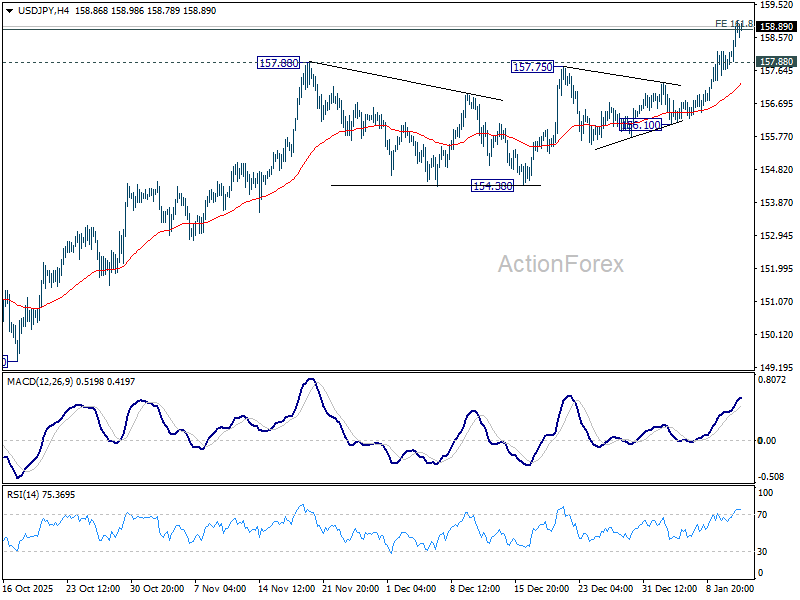
Daily Pivots: (S1) 157.73; (P) 157.96; (R1) 158.41; More...
Intraday bias in USD/JPY remains on the upside for the moment. Sustained trading above 161.8% projection of 142.66 to 150.90 from 145.47 at 158.80 will pave the way to 200% projection at 161.95, which is close to 161.94 high. On the downside, below 157.88 minor support will turn intraday bias neutral first. But outlook will stay bullish as long as 156.10 support holds, in case of retreat.
In the bigger picture, corrective pattern from 161.94 (2024 high) could have completed with three waves at 139.87. Larger up trend from 102.58 (2021 low) could be ready to resume through 161.94. Decisive break of 158.85 structural resistance will solidify this bullish case and target 161.94 for confirmation. On the downside, break of 154.38 support will dampen this bullish view and extend the corrective range pattern with another falling leg.