Sample Category Title
CHF/JPY breaks records as Yen rout meets Fed worries, targets 205 if momentum builds further
CHF/JPY surged to a fresh record high today, driven primarily by accelerating Yen weakness and, to a lesser extent, renewed support for the Swiss Franc. The cross has become a focal point for markets expressing both Japan-specific political risk and broader institutional unease centered on the US.
The Yen leg of the move was triggered by widespread reports that Japanese Prime Minister Sanae Takaichi intends to dissolve the House of Representatives at the outset of the regular Diet session on January 23, paving the way for a snap general election. The decision was reportedly conveyed to senior members of the ruling Liberal Democratic Party.
With Takaichi’s cabinet enjoying strong approval ratings nearly three months into her term, markets see the move as a calculated gamble to stabilize a fragile governing position. The ruling coalition currently holds only a razor-thin majority in the lower house, raising incentives to seek a fresh mandate while political momentum remains favorable.
If the lower house is dissolved on January 23, official campaigning could begin as early as January 27 or February 3, with voting widely expected on February 8 or February 15. An early election would allow Takaichi to push her agenda of expansionary fiscal spending.
Beyond domestic economics, a renewed mandate could also strengthen Takaichi’s hand on foreign policy. Her recent parliamentary remarks on Japan’s potential response to a Taiwan contingency have already contributed to deteriorating Japan–China relations, and an election win would give her greater backing to confront diplomatic challenges.
At the same time, the Swiss Franc has found support from safe-haven demand as confidence in the US Dollar softens. The Donald Trump administration’s threat of criminal indictment against Fed Chair Jerome Powell has raised concerns about the durability of US institutional credibility, diverting some defensive flows toward the Franc.
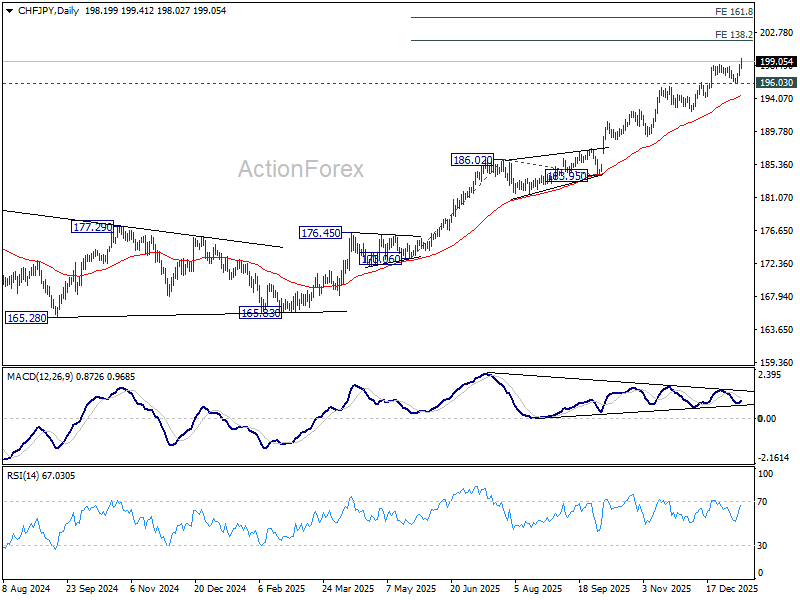
Technically, CHF/JPY’s uptrend resumed decisively this week with a break above 198.53. Near-term outlook remains bullish as long as 196.03 support holds, with the next target at the 138.2% projection of 173.06 to 186.02 from 183.95 at 201.86. A break higher in D MACD above its signal line would confirm strengthening momentum and open scope for further gains toward 161.8% projection at 204.91.
EUR/USD Awaiting US Inflation Data for Direction
The EUR/USD pair stabilised around 1.1658 on Tuesday, following a period of volatility over the preceding two sessions.
Market focus remains firmly on the forthcoming US inflation data, which is expected to provide crucial clarity on the future path of Federal Reserve policy. Currently, the market is pricing in two rate cuts this year, with the first anticipated in June. However, any upside surprise in inflation could significantly temper expectations for policy easing.
Supporting a more dovish outlook was last week’s disappointing Non-Farm Payrolls (NFP) report for December, which revealed weaker-than-expected job growth.
Investors are also monitoring developments in the US Supreme Court, which is expected to rule on the legality of President Donald Trump’s tariff policy as early as Wednesday.
Earlier this week, the US dollar faced additional headwinds following reports that Fed Chair Jerome Powell could face scrutiny over his congressional testimony related to a building renovation project. This has raised concerns, albeit limited, regarding the perceived independence of the Federal Reserve.
Technical Analysis: EUR/USD
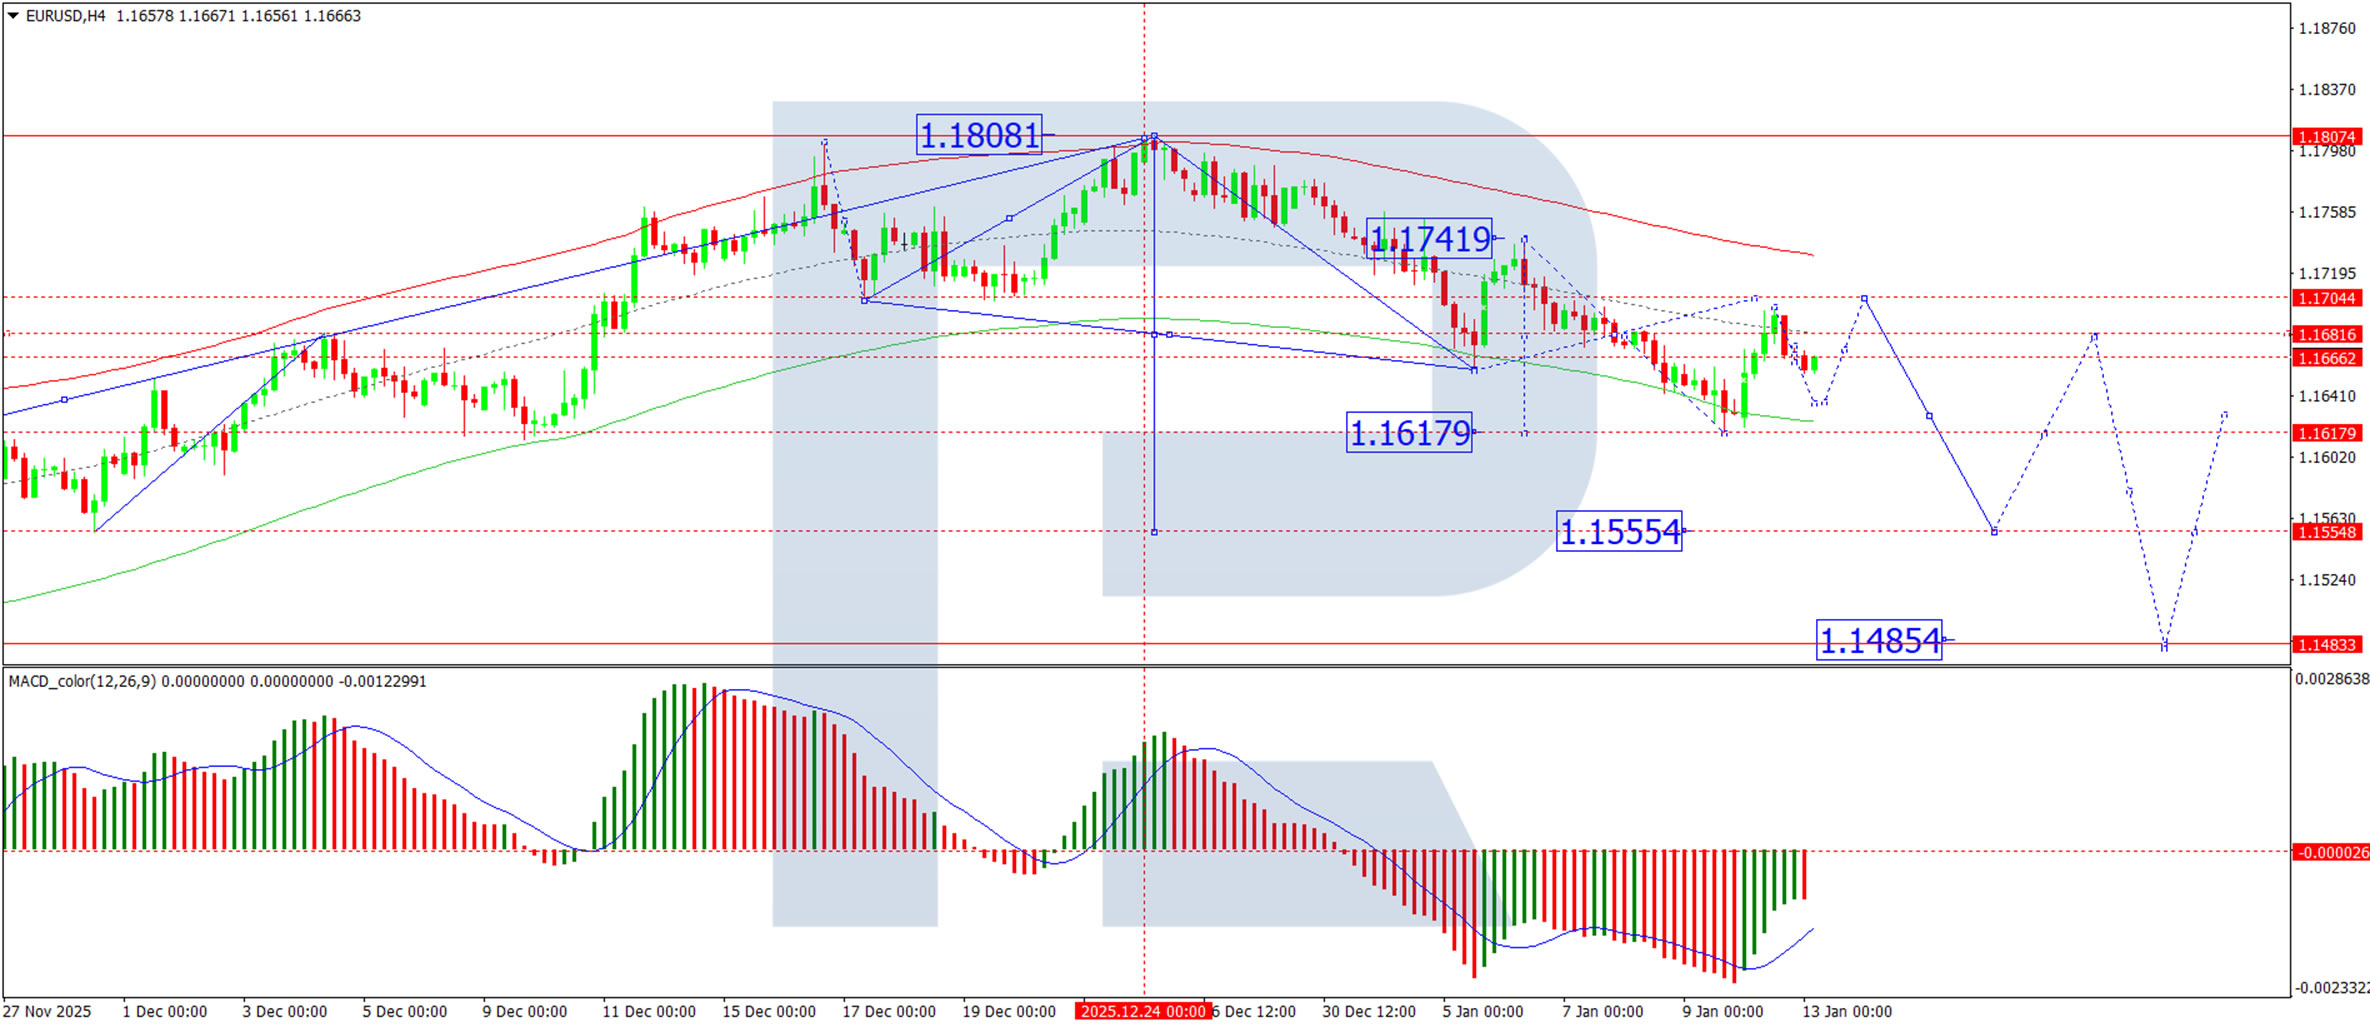
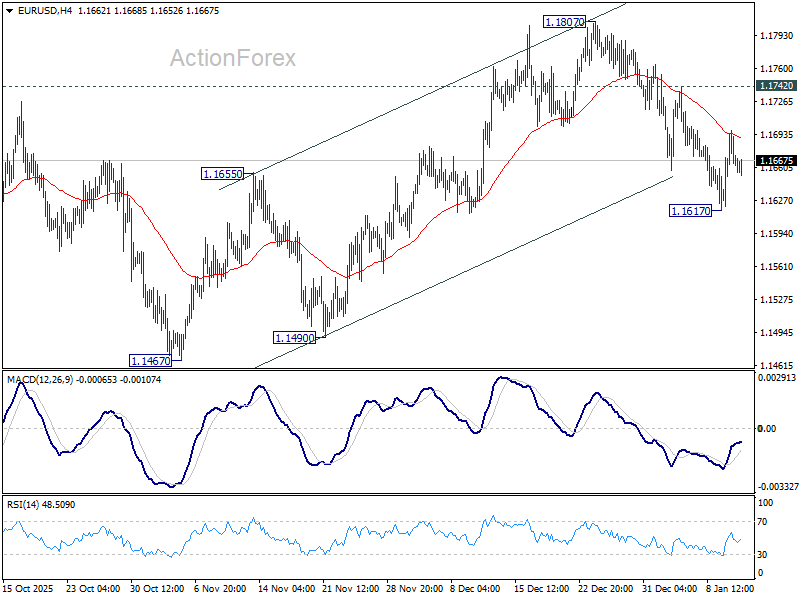
H4 Chart:
On the H4 chart, the pair is forming a corrective retracement within the context of the second downward impulse. The immediate corrective target stands at 1.1700. Once this correction concludes, we anticipate the resumption of the downtrend, with the next bearish target at 1.1555. This scenario is supported by the MACD indicator, whose signal line is below zero and pointing decisively downward, reinforcing the ongoing bearish momentum and potential for further downside.
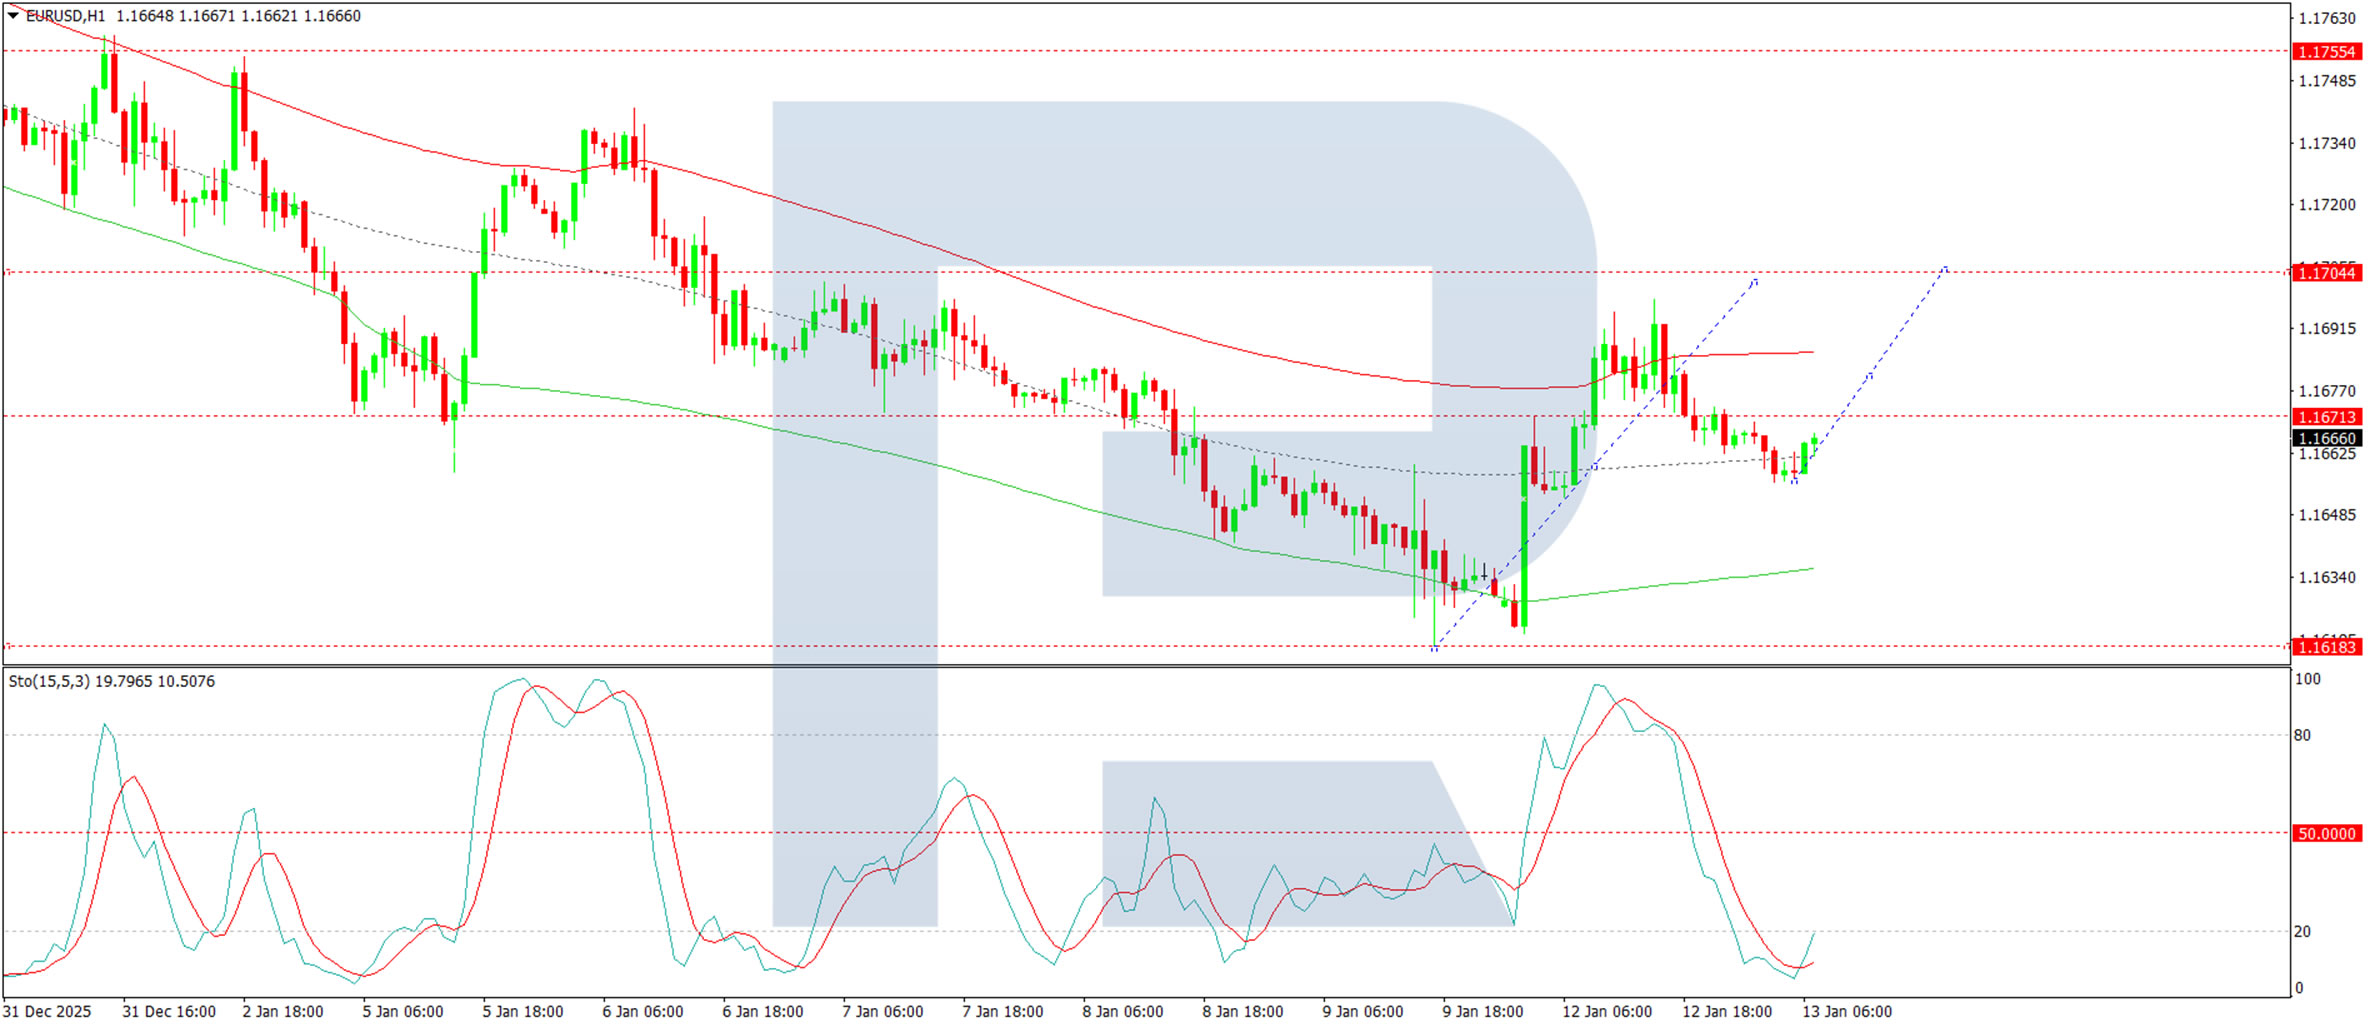
H1 Chart:
On the H1 chart, the market has completed a decline to 1.1655 and is now forming an upward corrective impulse towards 1.1700. Upon reaching this level, we expect a renewed wave of selling pressure to emerge. The Stochastic oscillator aligns with this view, as its signal line is currently below 20 but is turning upward towards 80, indicating room for a short-term rebound before the next potential decline.
Conclusion
The EUR/USD pair is in a holding pattern ahead of key US inflation data, which will likely dictate the near-term direction of the pair. While the technical structure remains bearish, a corrective bounce towards 1.1700 appears likely before sellers potentially regain control. A stronger-than-expected inflation print could reinforce the dollar’s strength and accelerate the move towards 1.1555.
Disclaimer:
Any forecasts contained herein are based on the author’s particular opinion. This analysis may not be treated as trading advice. RoboForex bears no responsibility for trading results based on trading recommendations and reviews contained herein.
Yen Returns to Takaichi Trade
- The dollar resumed its growth after the lawsuit against the Fed chairman.
- Rumours of early elections in Japan drove up USDJPY quotes.
‘We’re screwed!’ — that’s how Donald Trump described the possible Supreme Court’s ruling against his tariffs. The US will have to return hundreds of billions of dollars, not to mention the cancellation of investments that other countries intended to make in exchange for lower import duties.
In fact, the White House screwed up a little earlier when the Justice Department informed Jerome Powell about the lawsuit. The Fed chairman and the markets perceive this event as a factor putting pressure on the central bank. Lowering rates under pressure from the president could lead to uncontrolled inflation, as has occurred in several emerging market countries in the past. Investors will demand a higher risk premium on bonds. Higher Treasury yields will weigh on the economy.
The greenback is poised to benefit from both the Supreme Court’s repeal of tariffs and the lawsuit against Jerome Powell. The latter led to a rise in EURUSD and allowed the euro to be sold at a higher price. The refund of previously paid fees could be seen as a fiscal stimulus that will boost the US economy.
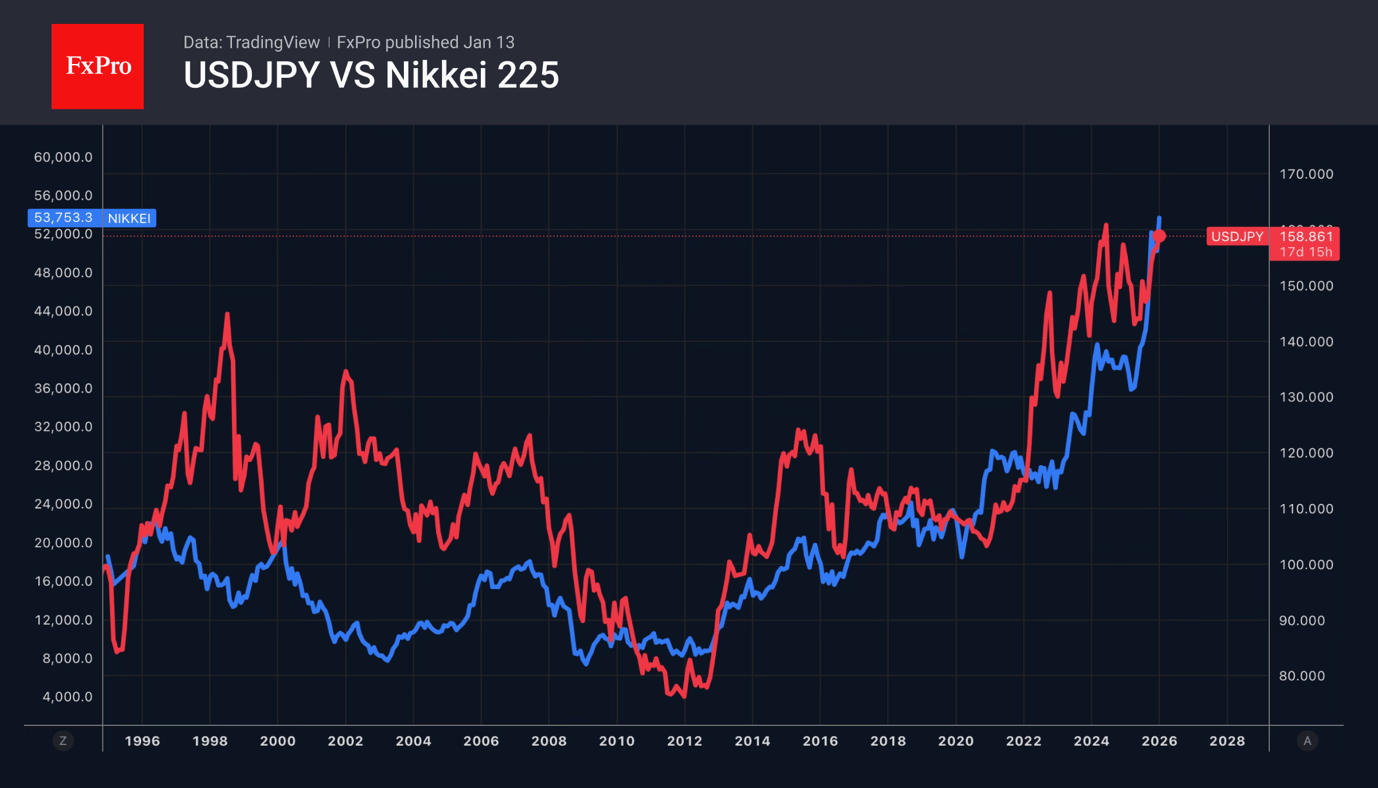
The strength of the dollar was one of the reasons for the USDJPY’s surge to its highest level since July 2024. The second factor was rumours of early elections in Japan. The new prime minister’s ratings are high, and she intends to strengthen the Liberal Democratic Party’s position in parliament. As a result, investors are returning to a so-called ‘Takaichi trade’ with stocks rising while the yen is weakening.
The USDJPY rally is forcing the government to return to verbal interventions. Japanese Finance Minister Satsuki Katayama expressed concern about the speculative nature of the yen’s weakening at a meeting with her American counterpart. She said that Scott Bessent is also unhappy with what is happening on Forex.
Now the markets are trying to determine the levels of Tokyo’s potential intervention in the international currency market. In 2024, it resorted to currency interventions four times near the 160 level, a very close call with 159 now.
Gold took advantage of the growing distrust of fiat currencies. It reached a new record high. As a result, CME changed its margin calculation methodology to reduce volatility. Its increase at the end of 2025 caused precious metals to retreat.
Dow Jones (DJIA) Forecast: Eyeing New All-Time High as Banks’ Earnings Loom
Key takeaways
Rotation favours DJIA: Sector rotation since late December has driven the Dow Jones and Russell 2000 to outperform the S&P 500 and Nasdaq 100, reinforcing near-term relative strength in the DJIA.
Bank earnings are the catalyst: With financials sector making up around 28% of the DJIA and heavyweights like Goldman Sachs and JPMorgan reporting, Q4 bank earnings could amplify volatility and act as the next directional trigger.
Bullish technical structure intact: The US Wall Street 30 CFD index remains in a rising channel above key moving averages, with momentum improving; a break above the current all-time high opens the door to further upside, while 49,250/49,096 is the key support to defend.
Since late December 2025, a clear sector rotation has taken hold in the US equity market, with former laggards—the Dow Jones Industrial Average and small-cap Russell 2000 outperforming AI-heavy mega-cap technology stocks that dominate the Nasdaq 100 and S&P 500.
Year-to-date as of 12 January 2026, the Russell 2000 and Dow Jones Industrial Average have gained 6.2% and 3.2% respectively, decisively outpacing the S&P 500 (+1.9%) and Nasdaq 100 (+2.1%) (see Fig. 1).
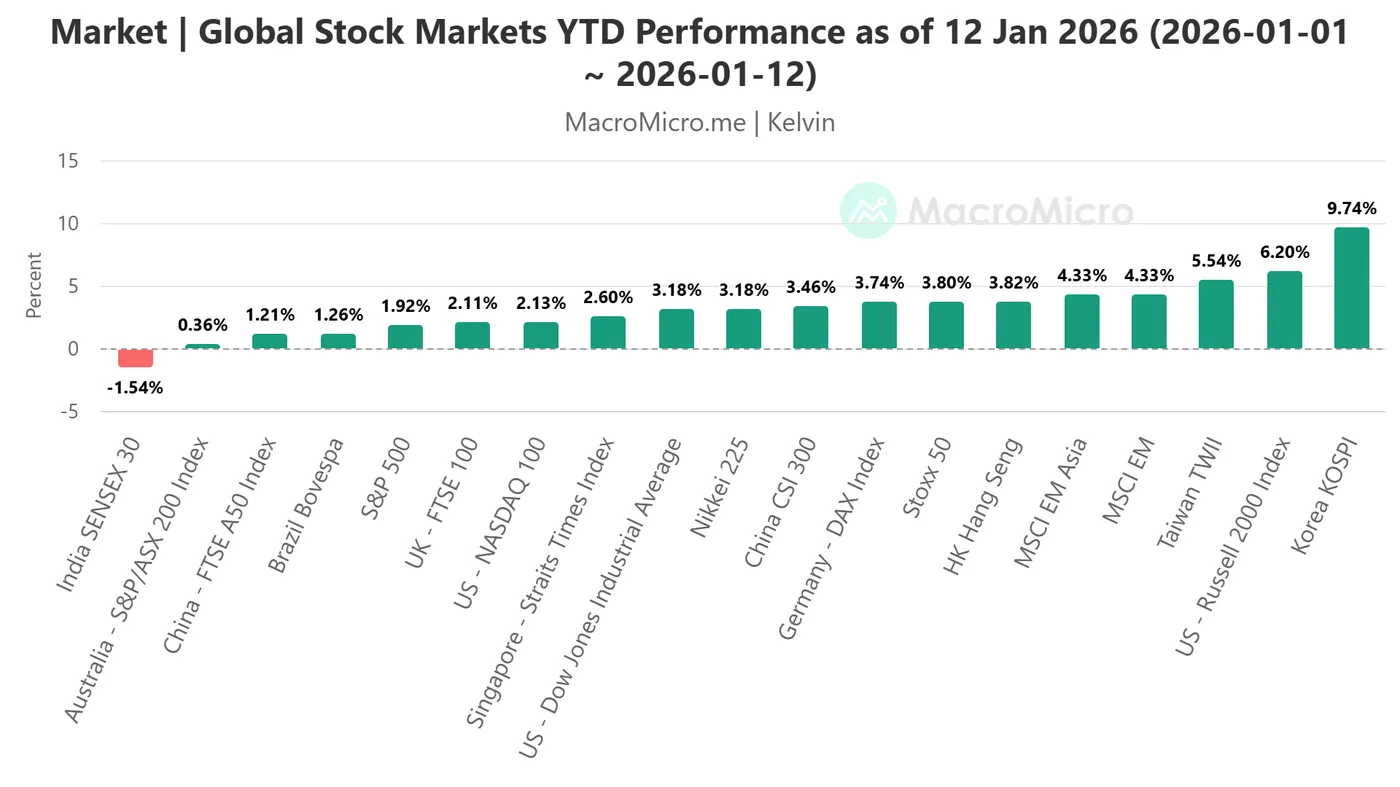
Fig. 1: YTD performance of major global stock indices as of 12 Jan 2026 (Source: MacroMicro)
Key US financials’ earnings are the current key drivers for the DJIA
This week, several major US financial institutions will report their Q4 2025 earnings results: JPMorgan (Tuesday, January 13), Bank of America, Citigroup, and Wells Fargo (Wednesday, January 14), and Morgan Stanley, Goldman Sachs, and BlackRock (Thursday, January 15).
The US financial sector, with a weightage of around 28%, is the largest weighted component in the Dow Jones Industrial Average (DJIA).
In addition, the top price-weighted component stock in the DJIA is Goldman Sachs, with a weight of around 11.8%, and another major US financial institution, JPMorgan, ranks in the 10th spot in the DJIA with a weight of 4%.
Hence, the earnings release of the aforementioned US financial institutions may trigger a more volatile movement in the Dow Jones Industrial Average for this week.
Let’s now dissect the movement of the US Wall Street 30 CFD index (a proxy of the Dow Jones Industrial Average futures) from a technical analysis perspective.
Evolving into an accelerating bullish trend
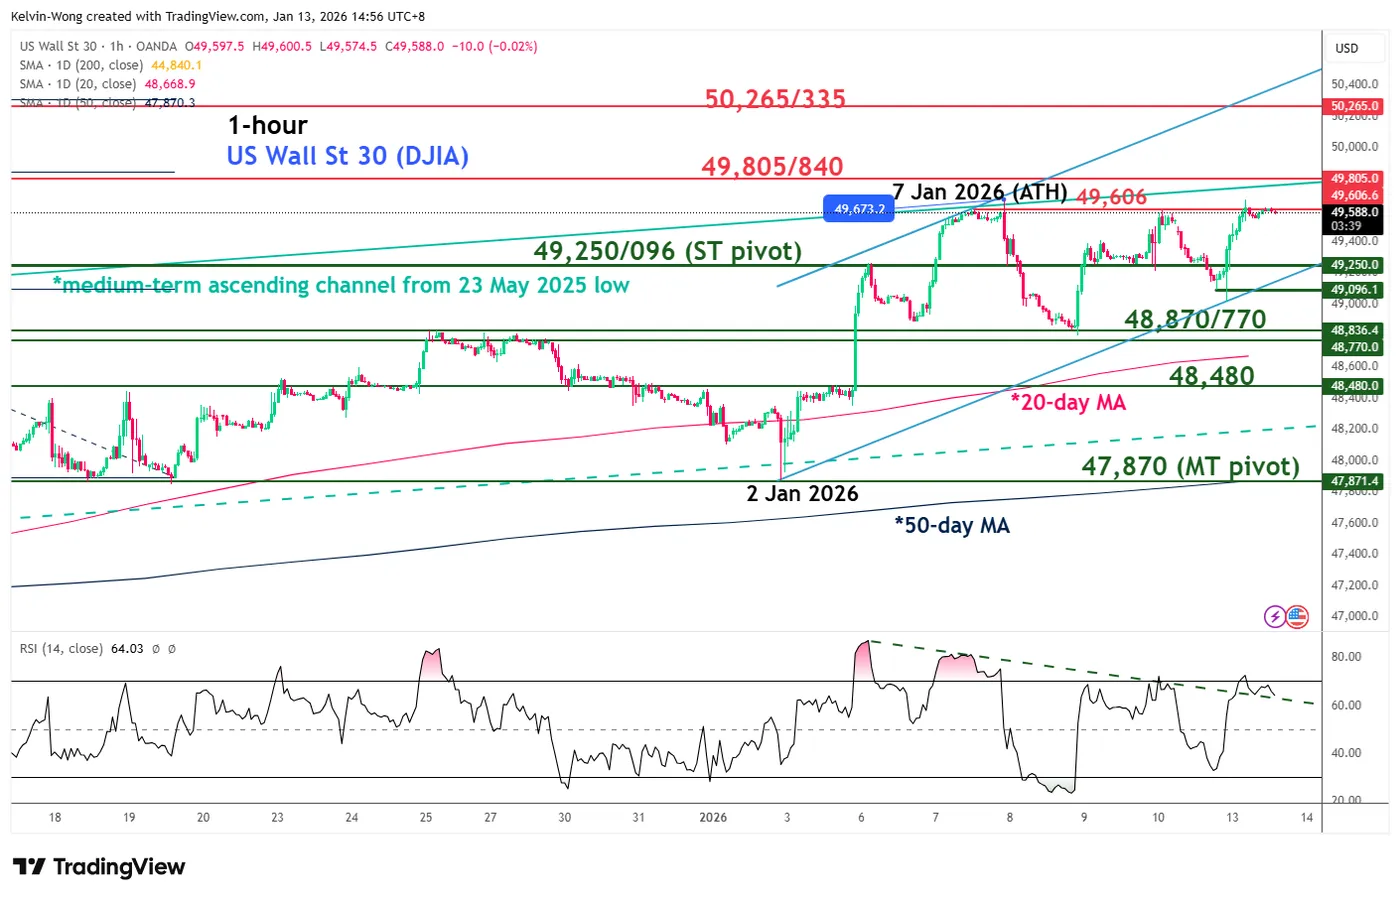
Fig. 2: US Wall Street 30 CFD index minor trend as of 13 Jan 2026 (Source: TradingView)
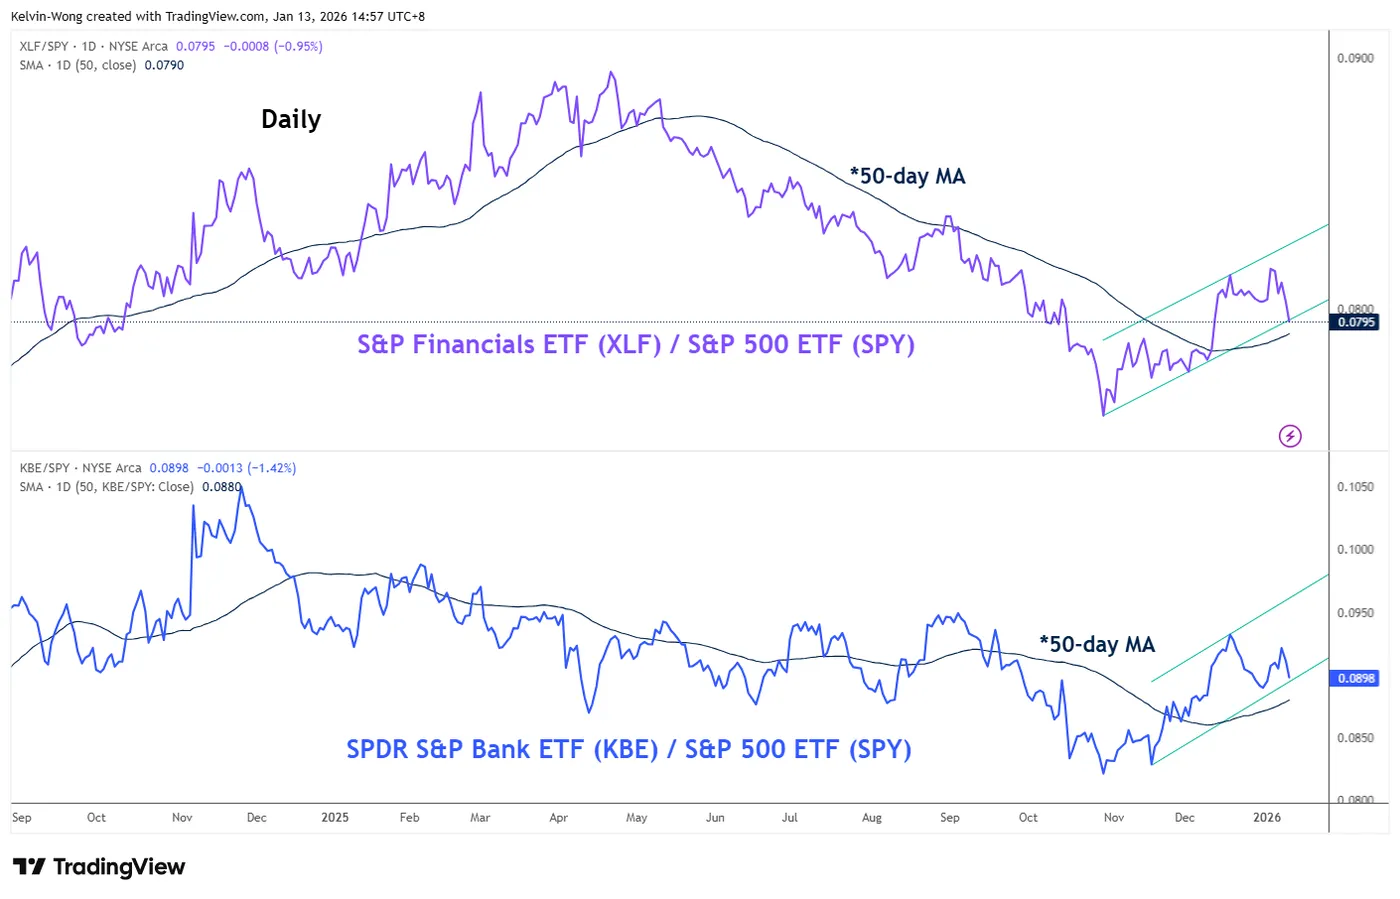
Fig. 3: Ratios of S&P Financials & S&P Banks ETFs over S&P 500 ETF as of 12 Jan 2026 (Source: TradingView)
The price actions of the US Wall Street 30 CFD index have evolved into a steeper minor ascending channel after it hit a low of 47,875 on 2 January 2026, and it continues to trade above its 20-day and 50-day moving averages at the time of writing (see Fig. 2).
In conjunction, the hourly RSI momentum indicator has staged a bullish breakout on Monday, 12 January 2026, above a parallel descending trendline resistance, and has not reached an extreme overbought condition.
These observations suggest that the US Wall Street 30 CFD index is likely in the process of transitioning into a potential bullish acceleration sequence within its medium-term uptrend phase that has remained intact since the 23 May 2025 low.
Tthe ratio charts of the S&P Financials exchange-traded fund (ETF) and the SPDR S&P Bank ETF over the S&P 500 ETF have traded above their respective 50-day moving averages decisively in November and December, which suggests a potential medium-term outperformance of US banks (see Fig. 3).
Watch the 49,250/49,096 key short-term pivotal support, and a clearance above 49,606 (current all-time high area) sees the next intermediate resistances coming in at 49,805/49,840 and 50,265/50,335 (upper boundary of the minor ascending channel and Fibonacci extension).
However, failure to hold at 49,250/49,096 negates the bullish tone for another round of minor corrective decline to expose the next intermediate supports at 48,870/48,770 (close to the 20-day moving average), and 48,480.
S&P 500 Hits a Record – But Is Everything Really So Positive?
As the S&P 500 chart shows (US SPX 500 mini on FXOpen), the index touched 6,990 yesterday, marking an all-time high for the first time. The psychological 7,000 level is now within close reach. Optimism may be driven by the start of the earnings season, which could confirm continued growth in corporate profits.
But is the outlook entirely positive?
From a fundamental perspective, several factors could raise concerns:
→ News surrounding a criminal case involving Jerome Powell. This may be perceived as pressure on the Fed Chair and a threat to the central bank’s independence, potentially undermining the investment climate.
→ The upcoming release of CPI data (scheduled for today at 16:30 GMT+3). A scenario in which the figures point to rising inflation cannot be ruled out, which could trigger a sharp sell-off in equity markets.
→ Risks of the US becoming involved in new military conflicts.
From a technical standpoint, bearish signals are also emerging on the chart.
Technical analysis of the S&P 500
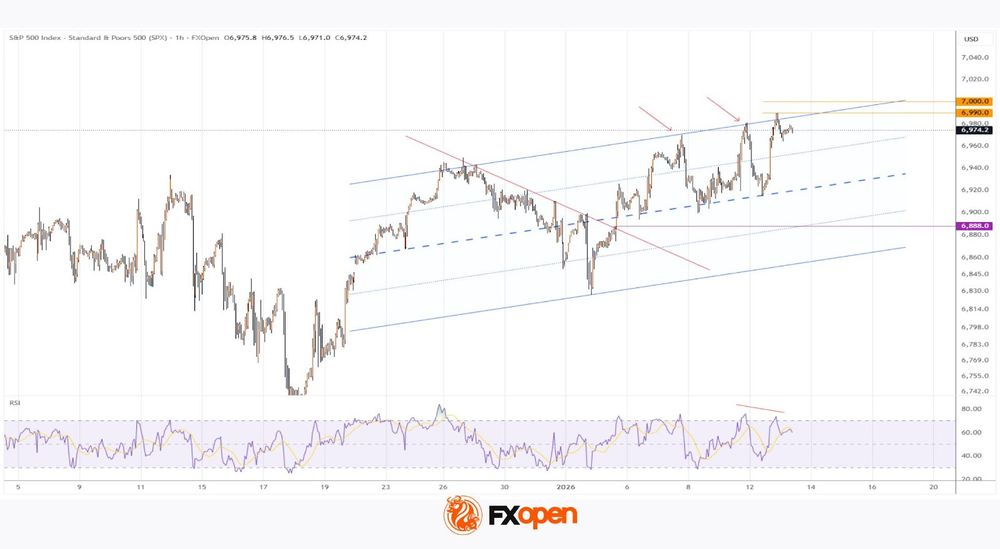
Price action in the S&P 500 (US SPX 500 mini on FXOpen) is forming an ascending channel. However, it is worth noting the market’s reaction after reaching the upper boundary of this channel: on two occasions (as indicated by the arrows), the index has seen sharp pullbacks towards the median line. This behaviour suggests aggressive selling pressure. At the same time, the RSI indicator is showing bearish divergence.
The channel median has so far acted as solid support. Nevertheless, with bears successfully defending the psychological 7,000 level and the fundamental backdrop capable of delivering negative surprises, sharper declines in the S&P 500 cannot be ruled out.
In such a scenario, potential downside targets may include:
→ the 6,888 support level, where the red trendline was broken;
→ the lower boundary of the ascending channel.
Trade global index CFDs with zero commission and tight spreads (additional fees may apply). Open your FXOpen account now or learn more about trading index CFDs with FXOpen.
This article represents the opinion of the Companies operating under the FXOpen brand only. It is not to be construed as an offer, solicitation, or recommendation with respect to products and services provided by the Companies operating under the FXOpen brand, nor is it to be considered financial advice.
USD/JPY Daily Outlook
Daily Pivots: (S1) 157.73; (P) 157.96; (R1) 158.41; More...
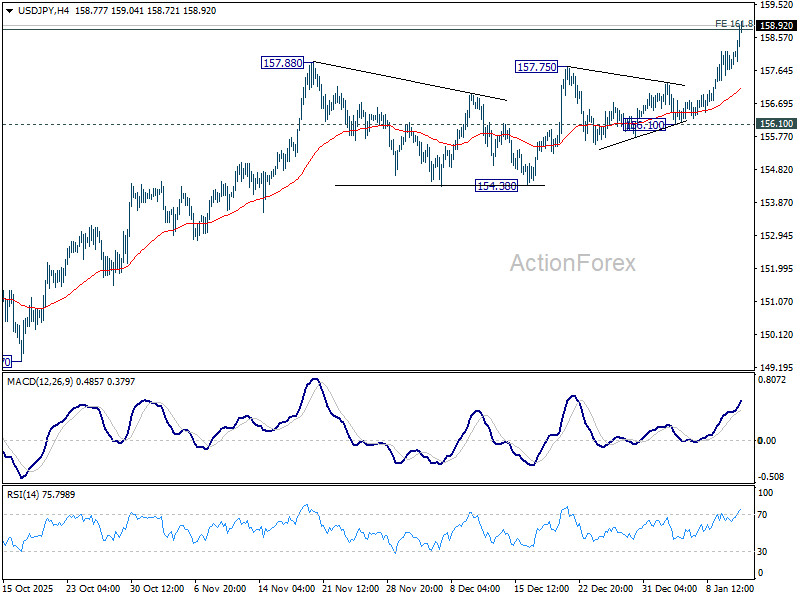
USD/JPY's rally accelerates higher today and intraday bias stays on the upside. Sustained trading above 161.8% projection of 142.66 to 150.90 from 145.47 at 158.80 will pave the way to 200% projection at 161.95, which is close to 161.94 high. For now, outlook will stay bullish as long as 156.10 support holds, in case of retreat.
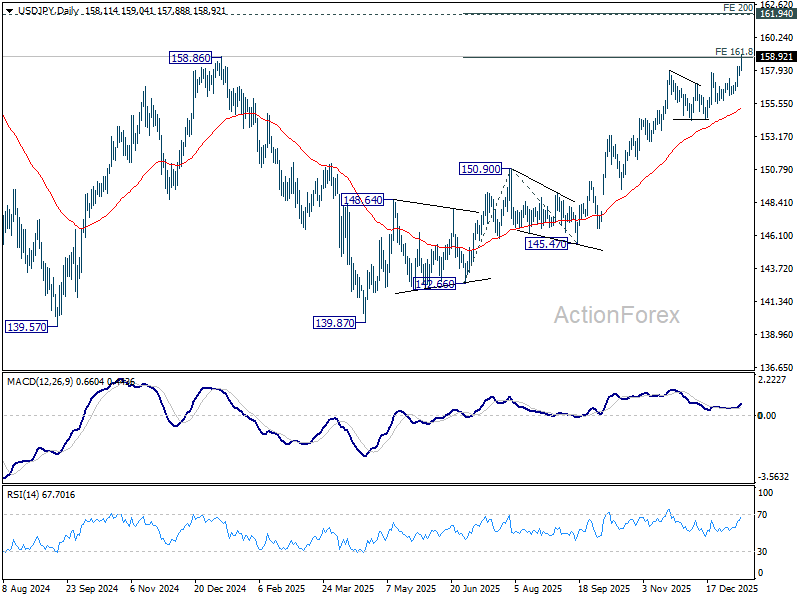
In the bigger picture, corrective pattern from 161.94 (2024 high) could have completed with three waves at 139.87. Larger up trend from 102.58 (2021 low) could be ready to resume through 161.94. Decisive break of 158.85 structural resistance will solidify this bullish case and target 161.94 for confirmation. On the downside, break of 154.38 support will dampen this bullish view and extend the corrective range pattern with another falling leg.
EUR/USD Daily Outlook
Daily Pivots: (S1) 1.1625; (P) 1.1662; (R1) 1.1702; More….
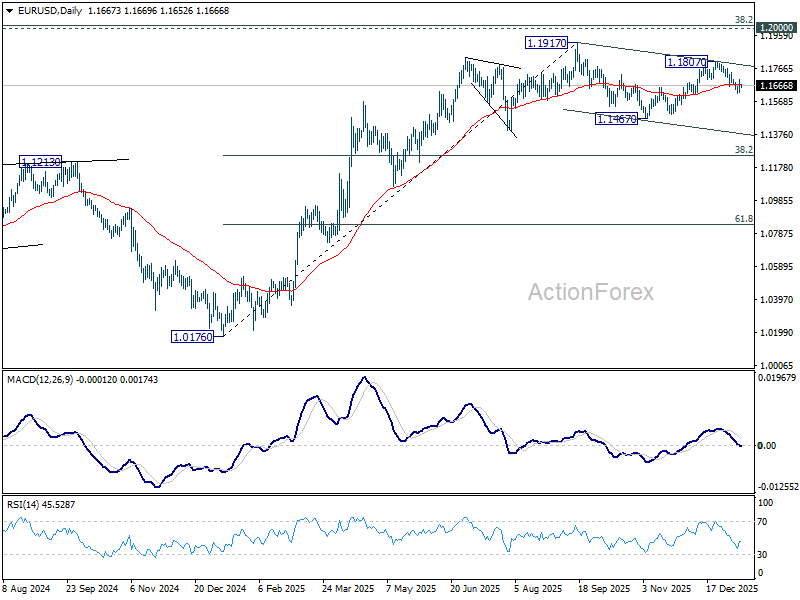
Intraday bias in EUR/USD remains neutral for the moment. On the upside break of 1.1742 resistance will argue that pullback from 1.1807 has completed. Rise from 1.1467 should then be ready to resume. Further break of 1.1807 will pave the way to retest 1.1817 high. Nevertheless, on the downside, below 1.1617 will target 1.1467 support. Overall, price actions from 1.1917 are seen as a corrective pattern that might extend further.
In the bigger picture, as long as 55 W EMA (now at 1.1416) holds, up trend from 0.9534 (2022 low) is still in favor to continue. Decisive break of 1.2 key psychological level will carry larger bullish implication. However, sustained trading below 55 W EMA will argue that rise from 0.9534 has completed as a three wave corrective bounce, and keep long term outlook bearish.
GBP/USD Daily Outlook
Daily Pivots: (S1) 1.3409; (P) 1.3447; (R1) 1.3504; More...
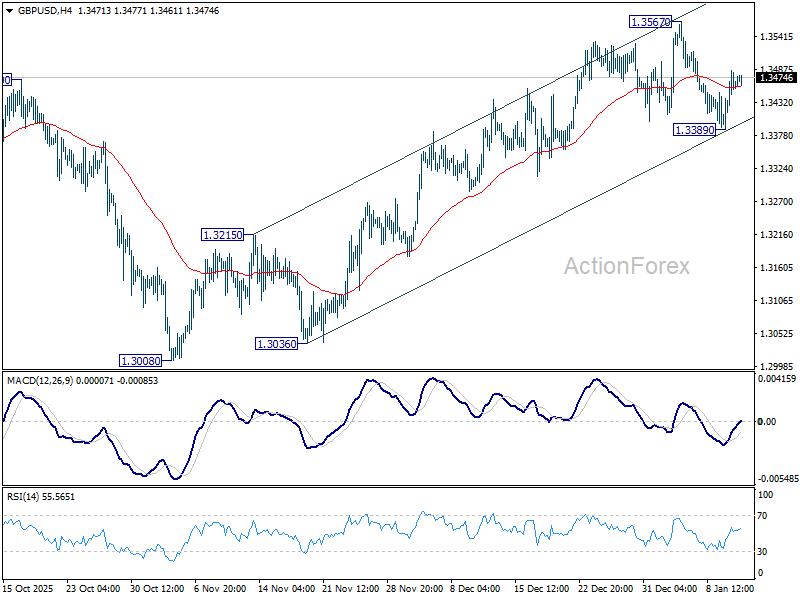
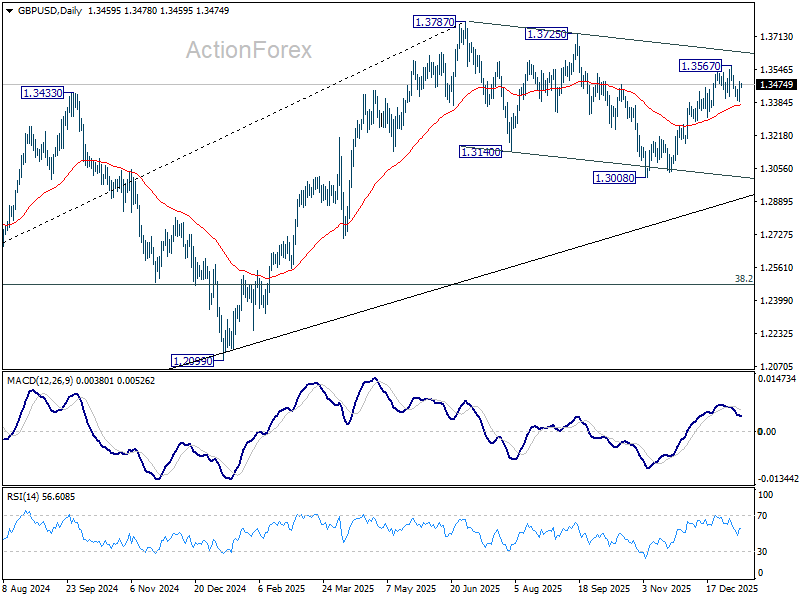
Intraday bias in GBP/USD remains neutral at this point. On the upside, break of 1.3567 will resume the rally from 1.3008 towards 1.3787 high. On the downside, break of 1.3389 will resume the fall from 1.3567. Sustained break of 55 D EMA (now at 1.3374) will argue that the decline is another falling leg in the corrective pattern from 1.3787. In this case, deeper fall should be seen back to 1.3008 support.
In the bigger picture, price actions from 1.3787 (2025 high) are seen as a correction to the larger up trend from 1.3051 (2022 low). Deeper decline could be seen as the pattern extends, but downside should be contained by 38.2% retracement of 1.0351 to 1.3787 at 1.2474 to bring rebound. Break of 1.3787 for up trend resumption is expected at a later stage.
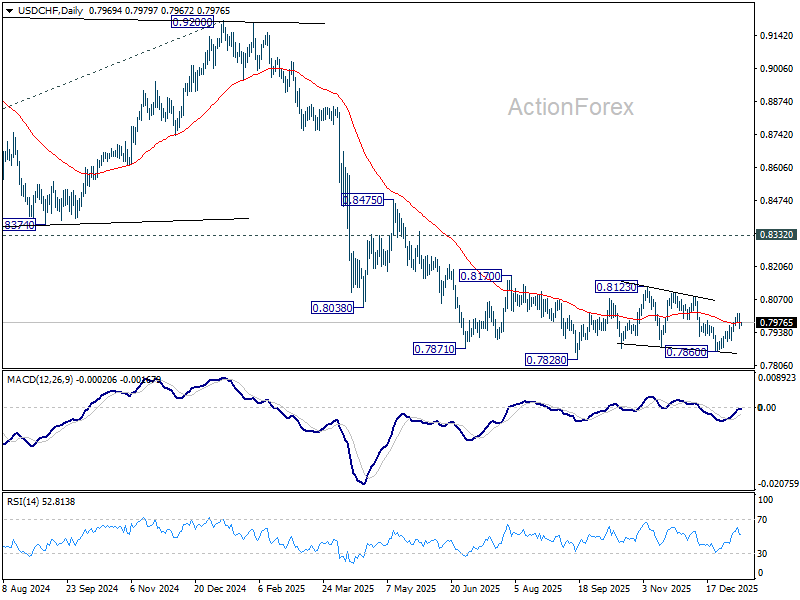
USD/CHF Daily Outlook
Daily Pivots: (S1) 0.7949; (P) 0.7984; (R1) 0.8011; More….
No change in USD/CHF's outlook and intraday bias remains neutral at this point. Corrective pattern from 0.7828 low is extending. On the upside, above 0.8016 will target 0.8123 resistance next. Nevertheless, break of 0.7905 support will resume the fall from 0.8123 to retest 0.7828 low. Firm break there will resume larger down trend.
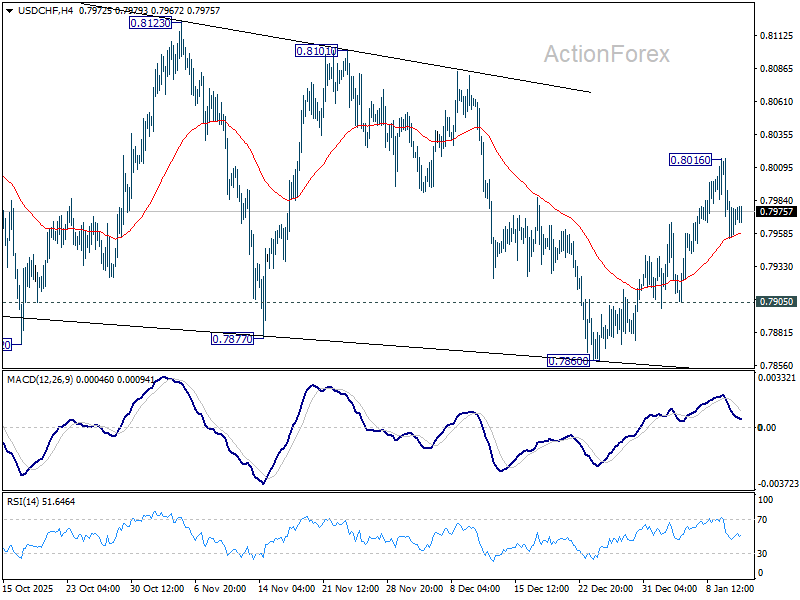
In the bigger picture, price actions from 0.7828 are seen as a correction. Larger down trend from 1.0342 (2017 high) is in still in progress. Break of 0.7828 will target 100% projection of 1.0146 (2022 high) to 0.8332 from 0.9200 at 0.7382. In any case, outlook will stay bearish as long as 0.8332 support turned resistance holds (2023 low).
AUD/USD Daily Report
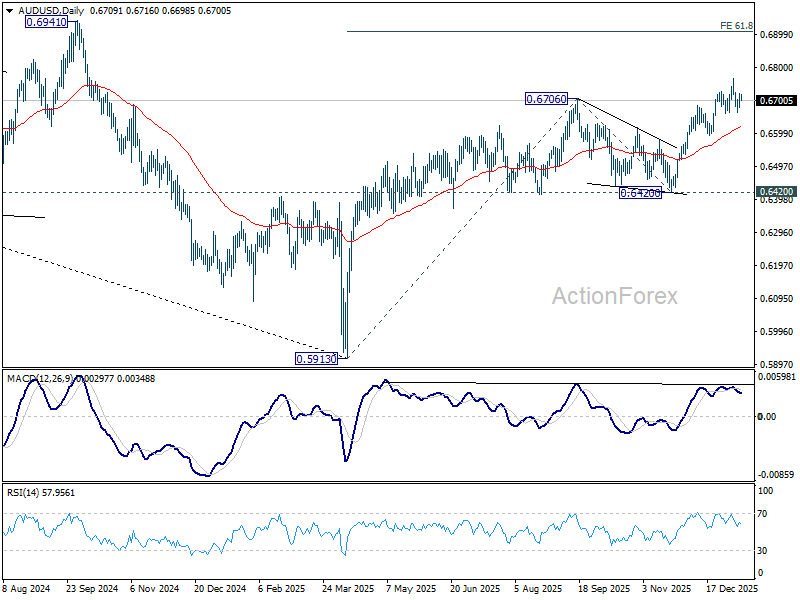
Daily Pivots: (S1) 0.6686; (P) 0.6704; (R1) 0.6729; More...
AUD/USD is still bounded in consolidations below 0.6765 and intraday bias remains neutral. Further rally is in favor with 0.6659 support intact. On the upside, break of 0.6765 will resume the whole rise from 0.5913 and target 61.8% projection of 0.5913 to 0.6706 from 0.6420 at 0.6910. However, considering bearish divergence condition in 4H MACD, firm break of 0.6659 will confirm short term topping, and bring deeper correction back towards 0.6592 support.
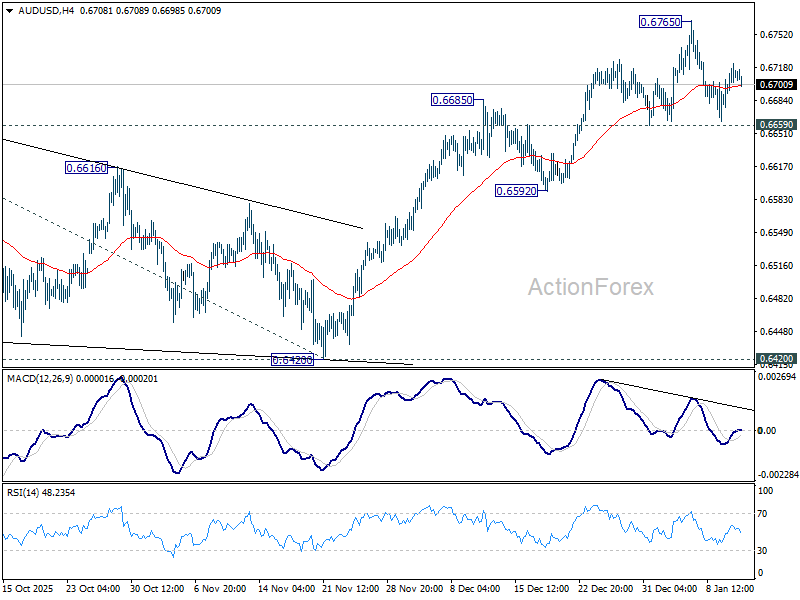
In the bigger picture, current development argues that rise from 0.5913 (2024 low) is reversing whole down trend from 0.8006 (2021 high). Further rally should be seen to 61.8% retracement of 0.8006 to 0.5913 at 0.7206. This will remain the favored case as long as 0.6420 support holds.