
Sample Category Title
Australia Westpac consumer sentiment deteriorates, RBA won’t tighten precipitously
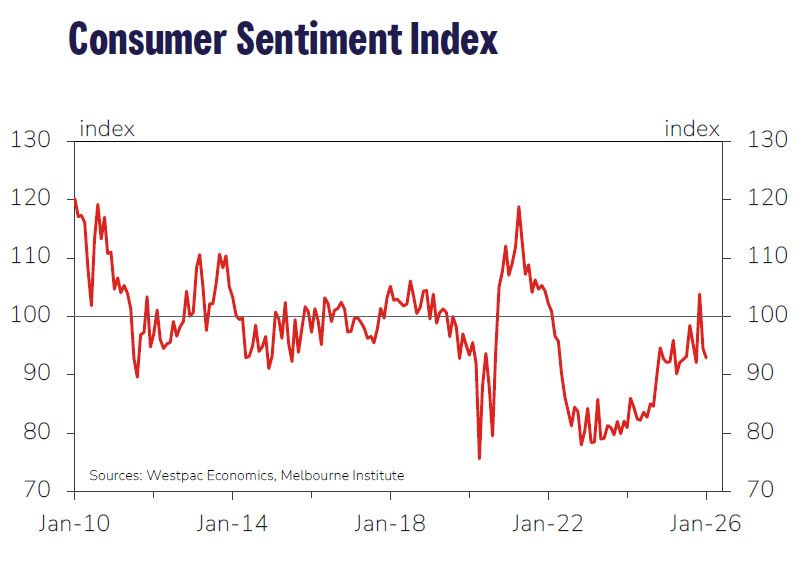
Australian consumer sentiment weakened further at the start of the year, highlighting growing anxiety over the interest-rate outlook. The Westpac Consumer Sentiment Index fell -1.7% mom to 92.9 in January, pushing sentiment deeper into pessimistic territory.
Westpac pointed to a sharp shift in rate expectations as the main drag. Nearly two-thirds of consumers who expressed a view now expect mortgage rates to rise over the next 12 months, more than double the share seen back in September.
For policy, Westpac expects the RBA to stay on hold when it meets on February 2–3, and through the remainder of 2026. While the RBA has flagged readiness to tighten if inflation proves stubborn, softer labor market conditions and limited price pressures across many goods and services should allow inflation to drift back into the 2–3% target range without the need to "tighten precipitously."
NZIER confidence hits 10-year high, RBNZ to hold until H2 hike
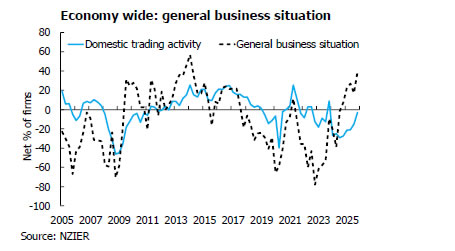
New Zealand business confidence surged in Q4, reinforcing signs that an economic recovery is starting to form. The New Zealand Institute of Economic Research (NZIER) said a net 39% of firms expect better general economic conditions in the months ahead, a sharp rise from 17% in the September quarter and the strongest reading since March 2014.
NZIER noted that while a gap remains between headline confidence and firms’ own domestic trading activity, the direction of travel is clearly improving. The survey suggests the impact of earlier interest-rate cuts is now filtering through the broader economy, lifting sentiment even as activity indicators lag.
Inflation signals was reassuring. Cost and pricing indicators point to broadly contained pressures in the December quarter, with cost pressures easing and a net 37% of firms reporting higher costs.
With demand recovering but inflation subdued, NZIER expects no further OCR cuts this cycle, forecasting the RBNZ’s Official Cash Rate to trough at 2.25% before hikes begin in the second half of 2026.
Gold Rewrites Records Above $4,600, CPI Set to Decide Next Move
Key Highlights
- Gold started a fresh surge and traded to a new all-time high above $4,600.
- It cleared a key contracting triangle with resistance at $4,480 on the 4-hour chart.
- WTI Crude Oil prices are still struggling to recover above $60.00.
- The US CPI could increase 2.7% in Dec 2025 (YoY).
Gold Price Technical Analysis
Gold prices started a fresh rally above $4,450 and $4,500 against the US Dollar. It settled above $4,500 and gained momentum for a new uptrend.
The 4-hour chart of XAU/USD indicates that the price cleared a key contracting triangle with resistance at $4,480. The bulls took control and pushed the price to a new all-time high above $4,610. The price tested the 1.236 Fib extension level of the last downside correction from the $4,549 swing high to the $4,275 low.
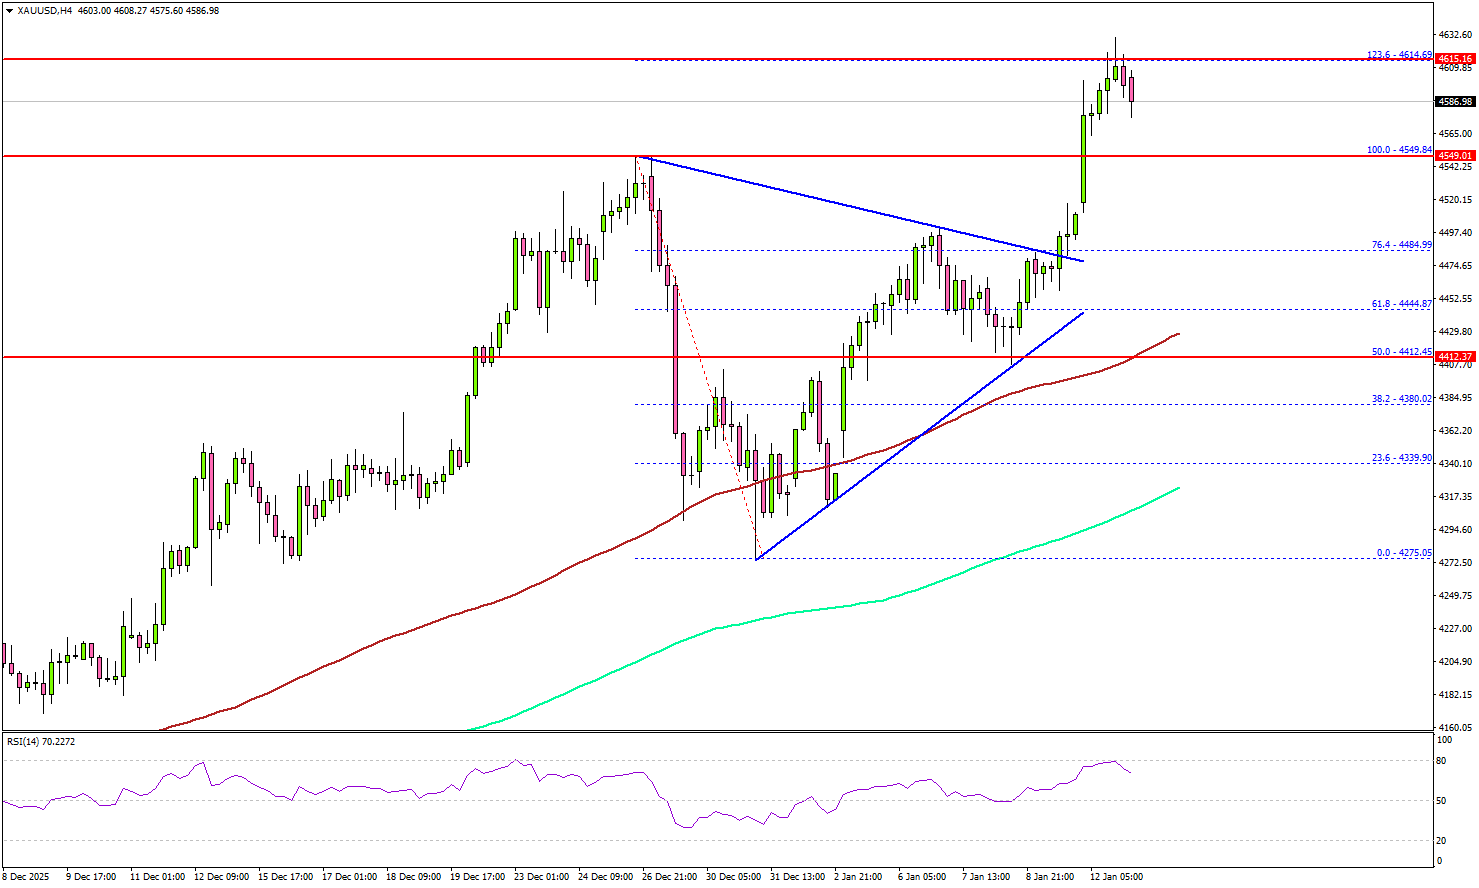
On the upside, immediate resistance is near the $4,615 level. The next major resistance sits near the $4,650 level. A clear move above $4,650 could open the doors for more upside. In the stated case, the bulls could aim for a move toward $4,720. It coincides with the 1.618 Fib extension level.
If there is a pullback, Gold might find bids near the $4,550 level. The first major support sits at $4,520, below which the price might slide to $4,500.
The main support sits at $4,480. Any more losses might call for a test of the 100 Simple Moving Average (red, 4 hours) at $4,420 or even the 200 Simple Moving Average (green, 4 hours) at $4,320.
Looking at WTI Crude Oil, the price started a recovery wave, but it continues to face heavy resistance near the $60.00 hurdle.
Economic Releases to Watch Today
- US Consumer Price Index for Dec 2025 (MoM) – Forecast +0.3%, versus +0.3% previous.
- US Consumer Price Index for Dec 2025 (YoY) – Forecast +2.7%, versus +2.7% previous.
- US Consumer Price Index Ex Food & Energy for Dec 2025 (YoY) – Forecast +2.7%, versus +2.6% previous.
Elliott Wave Structure: Gold (XAUUSD) Targeting Final Leg of Wave 5
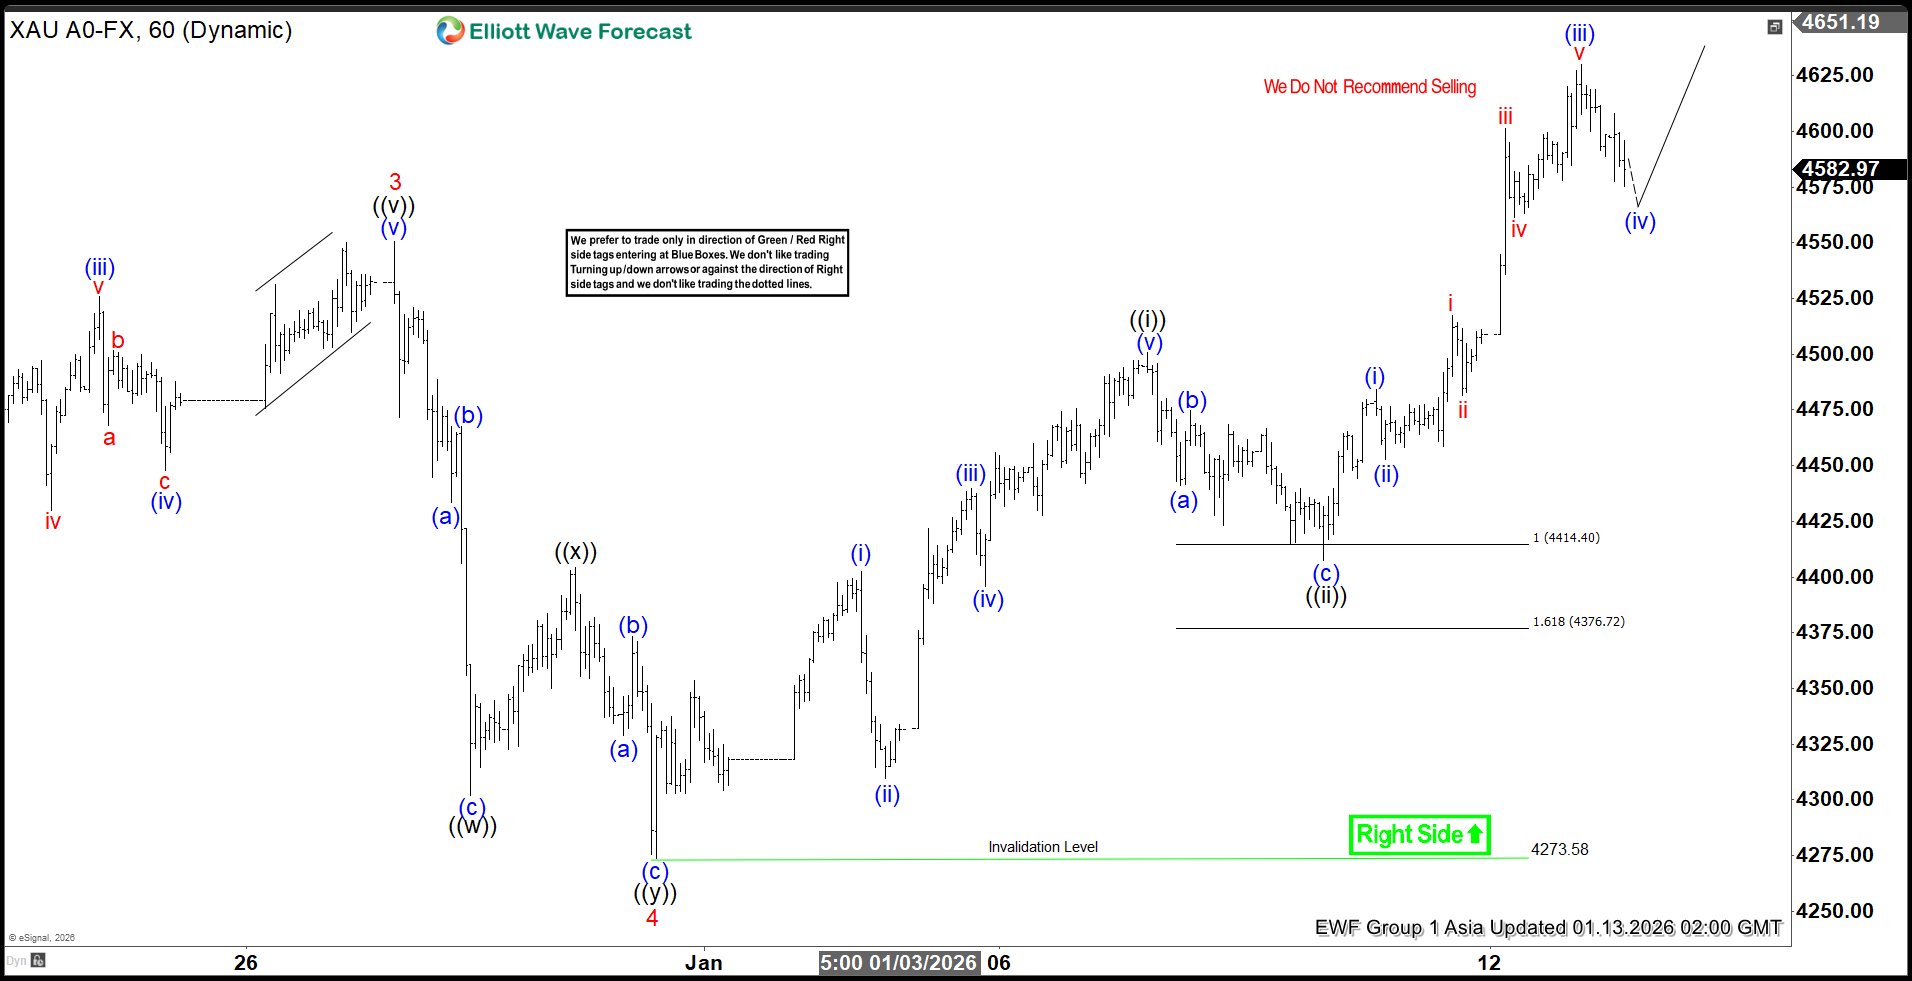
Gold (XAUUSD) continues to advance to fresh all‑time highs, reinforcing a firmly bullish trend across the broader market. The metal is now progressing toward the completion of wave 5 within the Elliott Wave framework. The rally to $4550.52 marked the termination of wave 3, after which a corrective phase unfolded. Wave 4 developed as a double three structure, reflecting a complex but orderly consolidation. From the peak of wave 3, wave ((w)) concluded at $4301.79, followed by wave ((x)) at $4404.41. The final leg, wave ((y)), ended at $4273.58, thereby completing wave 4 at a higher degree.
Following this correction, gold resumed its upward trajectory in wave 5. The current advance is unfolding as an impulsive sequence in lesser degree. From the base of wave 4, wave (i) finished at $4402.35, while the subsequent dip in wave (ii) reached $4309.42. Momentum carried wave (iii) to $4439.90, before a modest pullback in wave (iv) ended at $4395.92. The final push in wave (v) reached $4500.64, completing wave ((i)) of higher degree. A corrective zigzag in wave ((ii)) then ended at $4407.44.
The metal has since resumed higher in wave ((iii)). From that point, wave (i) concluded at $4483.99, while wave (ii) retraced to $4452.58. Strong buying pressure lifted wave (iii) to $4630.24, confirming renewed bullish momentum. In the near term, as long as the pivot at $4273.58 remains intact, dips are expected to find support. These supports typically emerge in three, seven, or eleven swing sequences, offering traders opportunities to align with the prevailing upside trend.
Gold (XAUUSD) 60 minute chart from 01.13.2026 update
XAUUSD Elliott Wave video:
https://www.youtube.com/watch?v=bwNVe5l0ENs
Key Support Holds for GBP/USD as Traders Eye US Inflation and UK GDP
The Great British Pound has found support of a key confluence area around the 1.3380 handle The move has come as the US Dollar facing a selloff over Fed independence fears
Powell vs Trump 2.0
Over the weekend, Federal Reserve Chair Jerome Powell announced that the Justice Department has served the central bank with legal orders (subpoenas) and is threatening criminal charges.
Powell claims this is part of a larger campaign by the White House to pressure the bank. He explicitly stated that these threats are a punishment because the Fed refused to follow President Trump's demands to lower interest rates, choosing instead to make decisions based on what is best for the public.
While President Trump denies knowing anything about the investigation, he has a long history of attacking Powell for not cutting rates as quickly as he wants.
This move has brought Fed independence fears to the forefront once more. As a result the US Dollar struggled for the majority of the day.
The DXY does however face a crucial support test which may prove a tough nut to crack around the 98.70 handle.
US Dollar Index Daily Chart, January 12, 2026
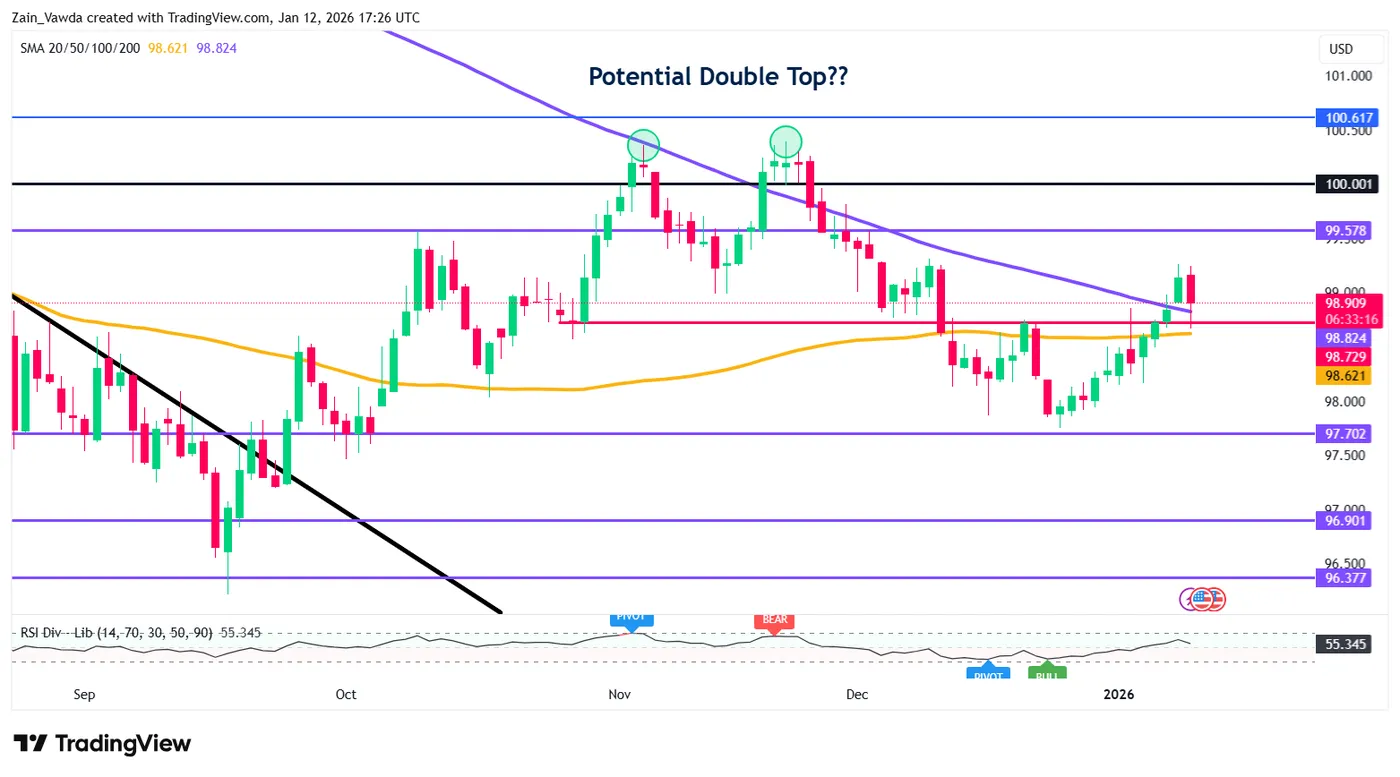
Source: TradingView
Catalysts Ahead with US Inflation & UK GDP Data
Traders are closely watching the UK's economic growth report on Thursday but before that tomorrow's US inflation report is expected to be higher than most experts predict (rising 0.4%). Investors are feeling calmer about the American job market after the unemployment rate dropped to 4.4% on Friday, even though the underlying details aren't entirely positive.
Finally, the dollar was expected to get a boost from the US Supreme Court, which is likely to rule against President Trump's tariffs sometime between Tuesday and Thursday. If not the Dollar may remain under pressure with the next catalyst likely to be Thursday UK GDP release.
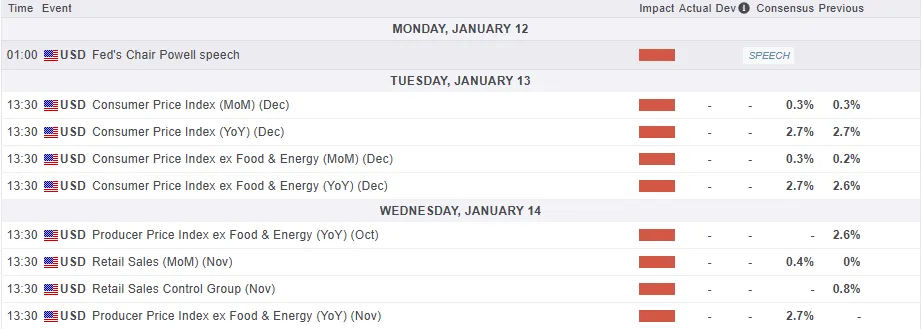
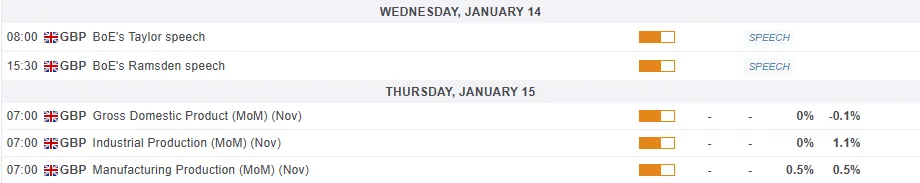
For all market-moving economic releases and events, see the MarketPulse Economic Calendar. (click to enlarge)
Technical Analysis - GBP/USD
From a technical perspective, GBP/USD did bounce off a key confluence area around the 1.3380 zone.
This area plays host to the 100 and 200-day MAs while also being a key area of support and resistance in the past.
The move today was further helped by fundamentals around the US dollar which has experienced a selloff.
The bullish move has also seen GBP/USD bounce off the 50 level on the period-14 RSI. This hints at bullish momentum.
On the upside cable does face some significant hurdles as well with the 1.3500 handle before the recent highs at 1.3568 comes into focus.
GBP/USD Daily Chart, January 12, 2026
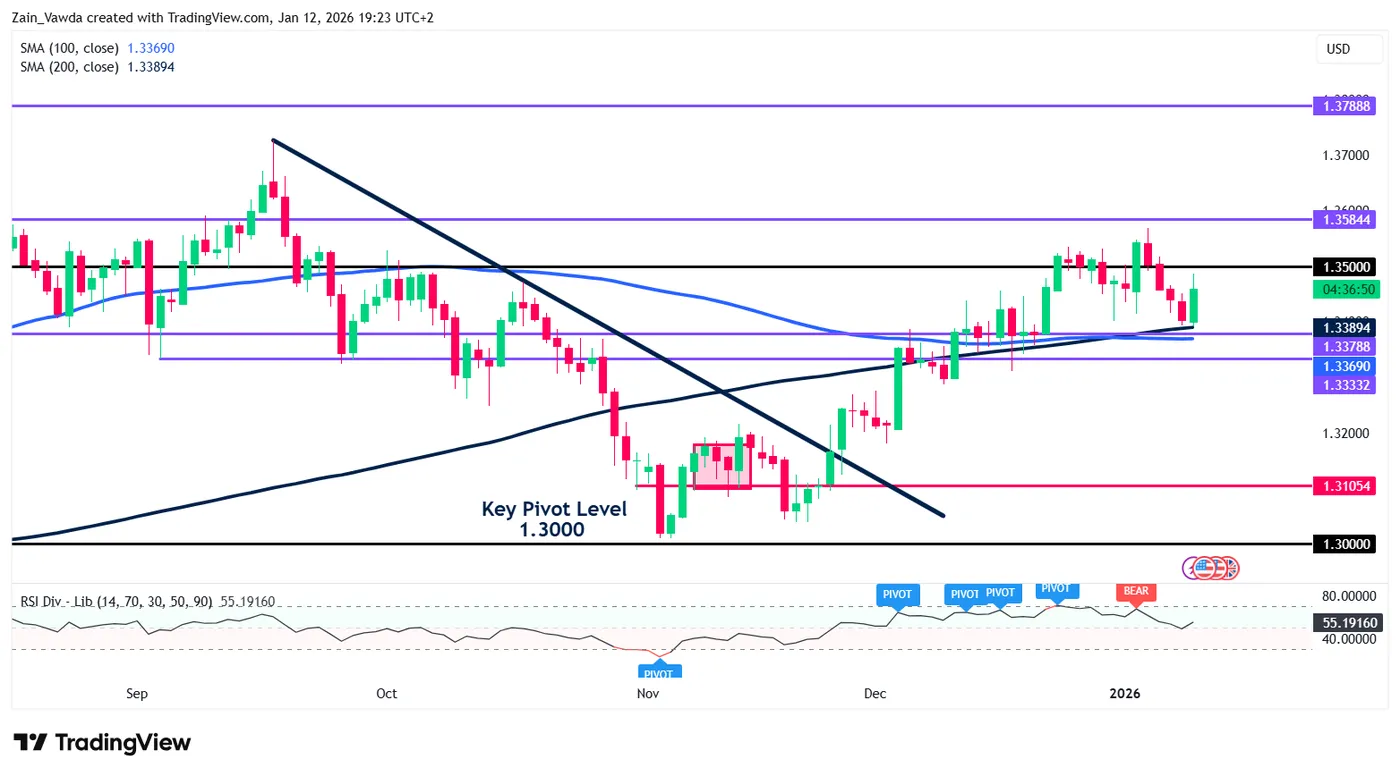
Source:TradingView.com
Traders are Moving Past Powell’s Investigation – US Stock Index Outlook & Pre-CPI Trading Levels
The morning session was nothing short of volatile.
Overnight futures took a hit following news of the DOJ's investigation into Jerome Powell, once again casting a shadow over the Federal Reserve's independence. Yet, this market—and its traders—should never be underestimated.
Stocks caught a bid immediately after the open as participants shrugged off the headlines, using the early drop as yet another buying opportunity.
Despite modest percentage gains on the day, the technical achievements are significant: the Dow is pacing for another record close, the Nasdaq is breaching monthly highs, and the S&P 500 is trading at fresh All-Time Highs.
Individual names are also making history, with Google (Alphabet) recently breaking the $4T market cap milestone as Apple officially announced that they would require Google services for Apple Intelligence.
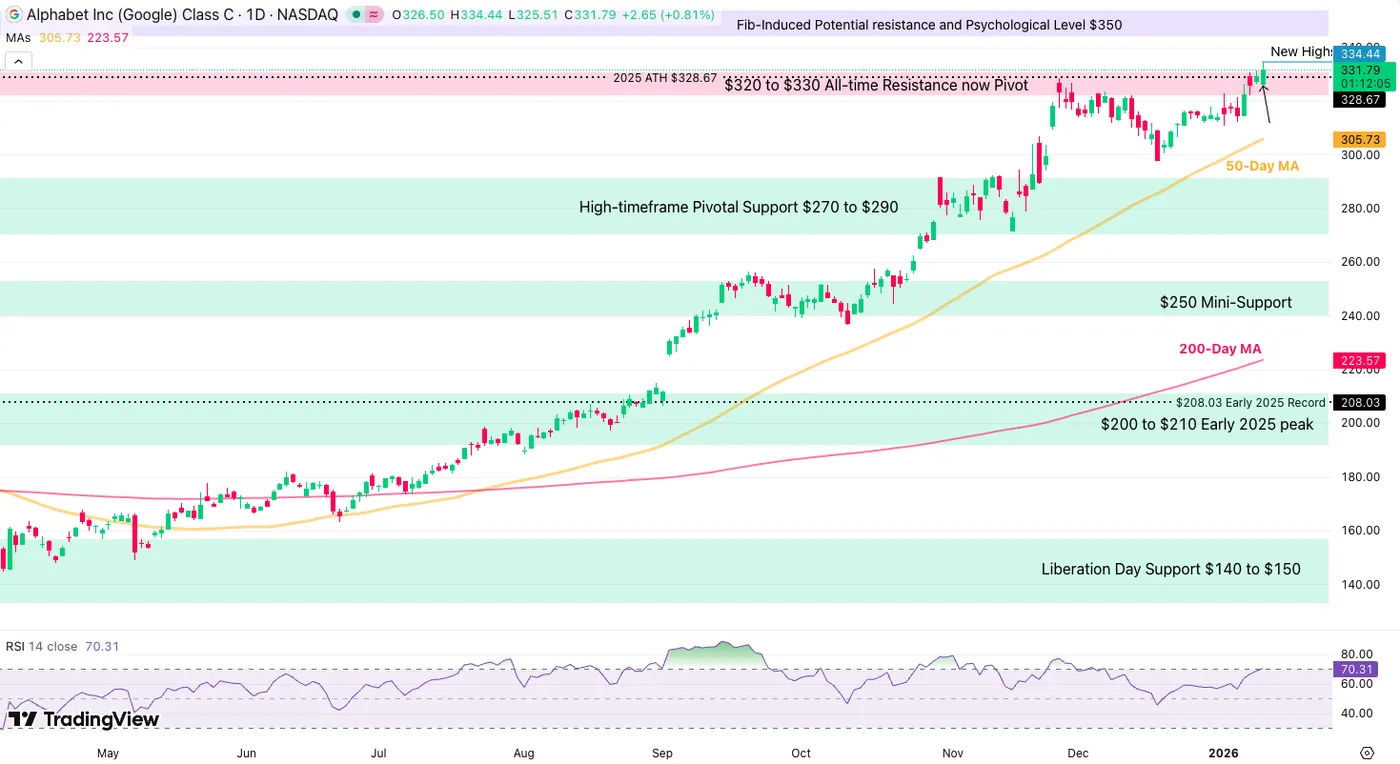
Google Daily Chart – Source: TradingView
It seems "bad news is good news" in this environment.
As long as the investigation remains a headline rather than an official indictment, investors remain resolutely bullish. Supplemented by heightened geopolitical pressures boosting defense and industrial sectors and driving metals to new highs, the trend remains intact.
However, expect momentum to potentially taper off as the day progresses; traders will likely begin squaring positions ahead of tomorrow's massive Inflation (CPI) release at 8:30 A.M (expected at +0.3% to 2.7% Y/Y)
Let's dive into our daily intra-session charts and NFP trading levels for the major US Indexes: Dow Jones, Nasdaq, and S&P 500.
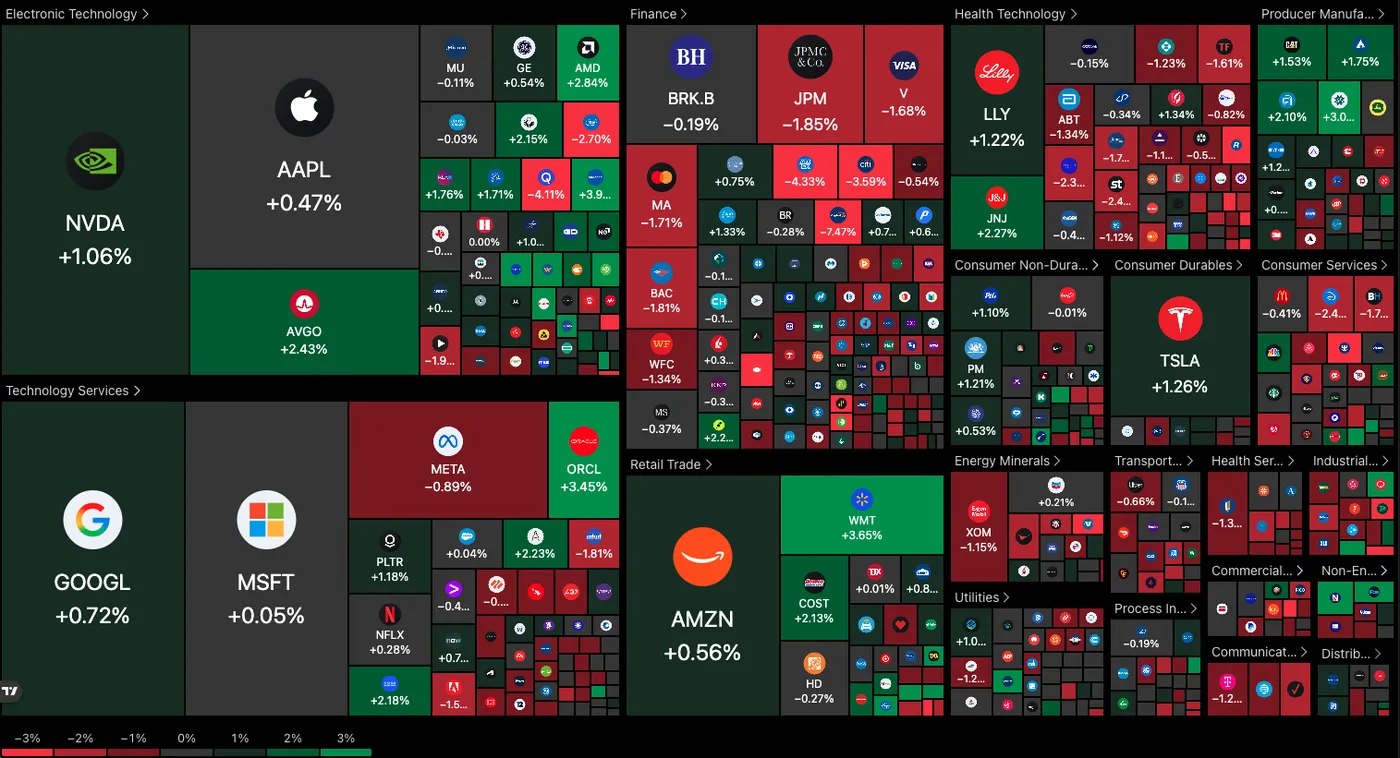
Current picture for the Stock Market (14:42 P.M. ET) – Source: TradingView – January 12, 2026
Healthcare is hurting once again, seeing quite some outflows in the beginning of this after a huge 2025 trading.
Financials are also struggling in the session as traders await key earnings for JP Morgan and Bank of New York Mellon tomorrow, while Energy drags from Exxon's CEO comments on "uninvestable" Venezuela projects.
The rest of the Market shows green.
Dow Jones 2H Chart
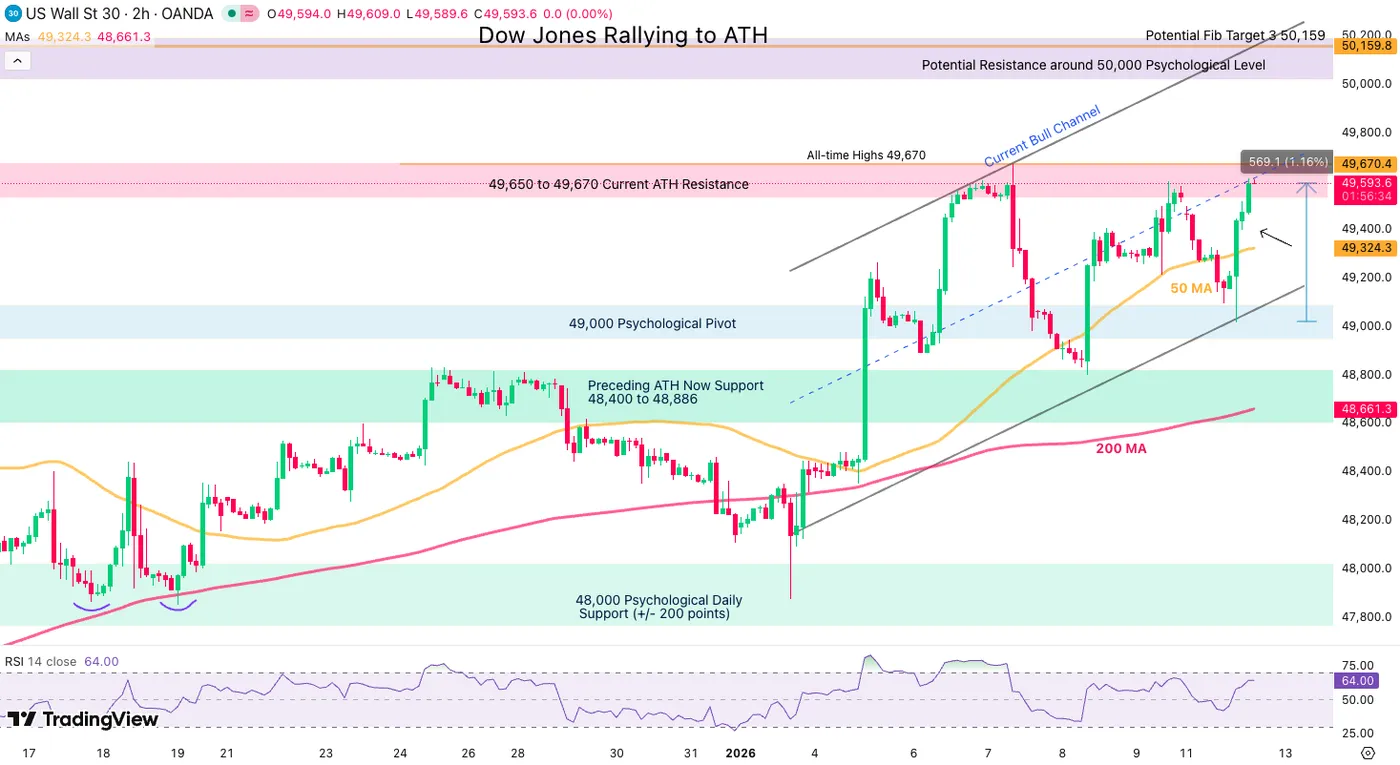
Dow Jones (CFD) 2H Chart – January 12, 2026 – Source: TradingView
Up a strong 1.16% since its open, the Dow is on pace to break new records again, now evolving within a strong intraday upward channel.
A huge bull candle with no wicks is showing bull domination ahead of CPI, powered by its Consumer Defensive and Machinery Sectors – Walmart is dominating the charts up 3.70%.
- A soft report tomorrow could easily send the Dow to 50,000.
- A strong report however would hurt rate cut prospects and could lead to a retest of Major support (Top candidate being 48,600 and 2H 200-MA).
Dow Jones technical levels for trading:
Resistance Levels
- 49,650 to 49,670 Current ATH Resistance
- 46,670 All-Time Highs
- 50,000 Potential Psychological Resistance
Support Levels
- 49,324 2H 50-Period MA
- 49,000 Psychological Pivot
- 48,400 to 48,800 Major Support (2H MA 200 at 48,670)
- Psychological Support at 48,000
- 45,000 psychological level (Main Support on higher timeframe)
Nasdaq 2H Chart
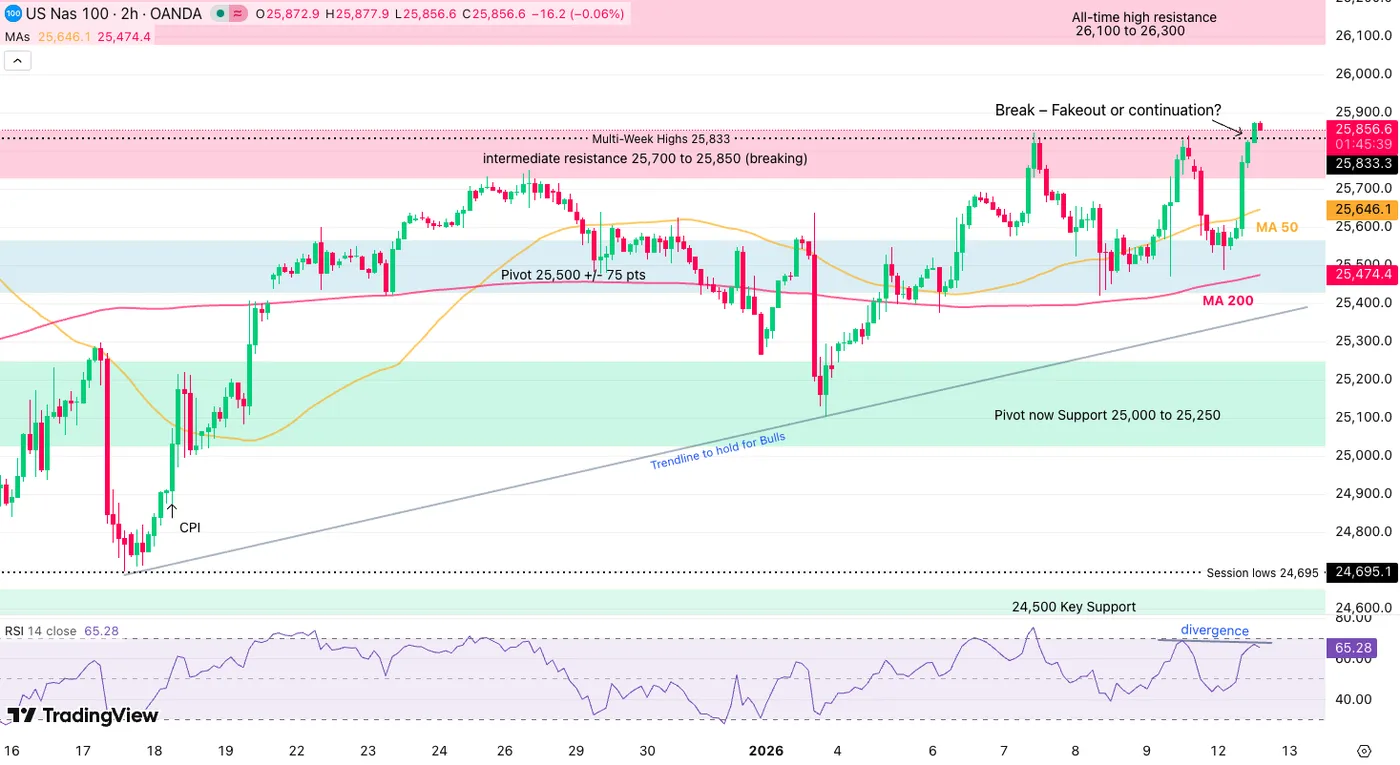
Nasdaq (CFD) 2H Chart – January 12, 2026 – Source: TradingView
After double top threats and a sluggish price action throughout the past months, the Nasdaq is taking the lead again, brought up by the strong AI stock performance today:
AVGO, Oracle, Google, a rebounding Nvidia and many others are pushing the Tech-Heavy index to new highs, also breaking the double-top formed in the past week.
Still, traders will need to be cautious regarding short-timeframe bearish divergences.
Tomorrow's NFP will be key to monitor whether today's move fakes out or materializes into a real break.
- Clearing the CPI, staying above 26,860 would point to a test of the October All-Time Highs.
- Failing to stay above current resistance could lead to a test of the 25,000 Level (25,100 is a key level to watch in this event, things would look bearish below).
Nasdaq technical levels of interest:
Resistance Levels
- intermediate resistance 25,700 to 25,850 (breaking?)
- Session highs 25,877
- All-time high resistance zone 26,100 to 26,300
- Current ATH 26,283 (CFD)
Support Levels
- 25,646 2H MA 50
- Pivot 25,500 +/- 75 pts
- Main Support 25,000 to 25,250
- 24,500 Main support
- Early 2025 ATH at 22,000 to 22,229 Support
S&P 500 2H Chart
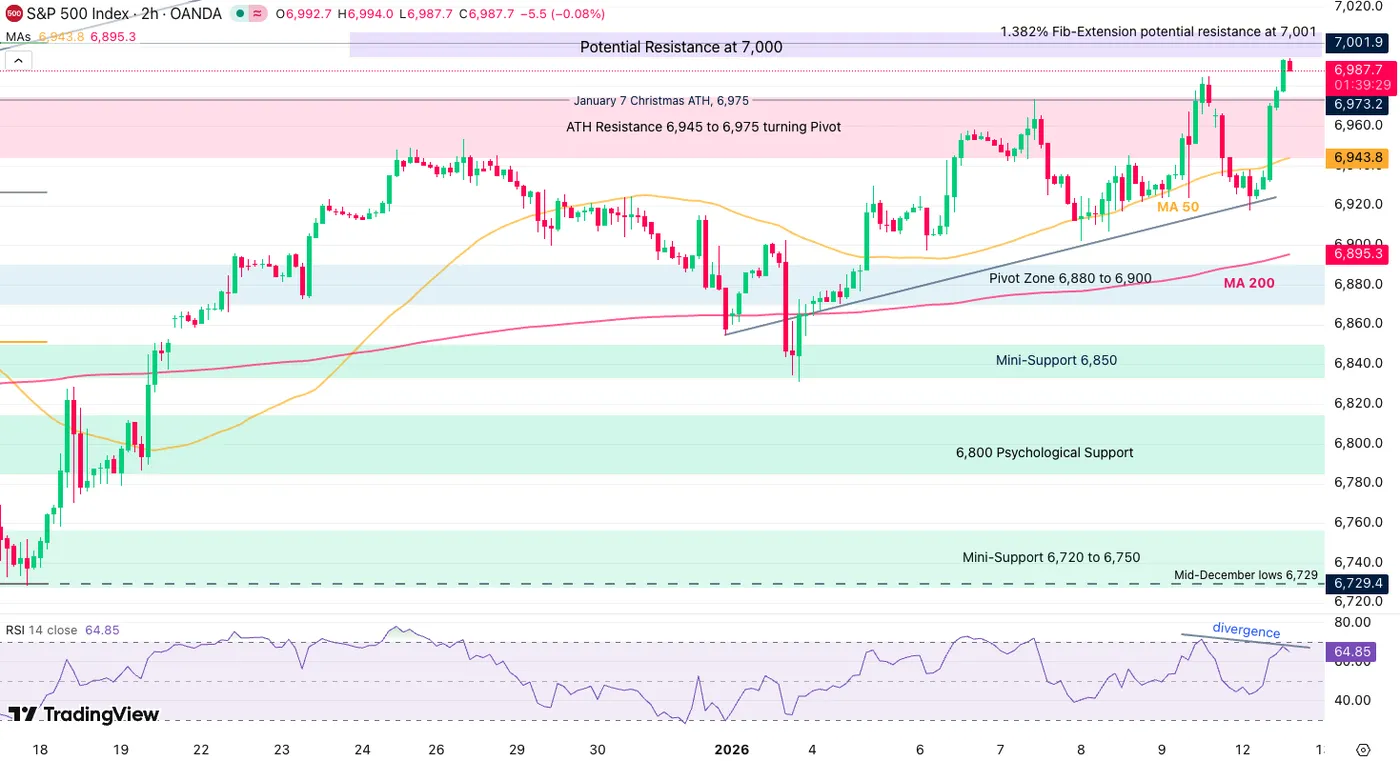
S&P 500 (CFD) 2H Chart – January 12, 2026 – Source: TradingView
The S&P 500 went to break its past day record highs yet again, with the new highs set at 6,986.
Similarly to the Nasdaq, traders will need to be cautious regarding a so so optimistic divergence forming as momentum slows during the ascent.
To mitigate the slow rise however, a consistent uptrend sustains overall resilience in the Market – The S&P could hold well a disappointing CPI tomorrow.
Of course, it will depend on how bad it is (if it is).
A bullish CPI could well launch the Spoose beyond 7,000: 7,040 and 7,080 are potential profit-taking levels for the Index.
S&P 500 technical levels of interest:
Resistance Levels
- ATH Resistance 6,945 to 6,975
- Current All-Time High 6,973
- 1.382% Fib-Extension potential resistance at 7,001
Support Levels
- 6,913 4H 50-MA Support
- 6,800 Psychological Pivot and Range lows
- Support 6,720 to 6,750 and 8H MA 50
- 6,400 Major psychological support
Safe Trades and Good Luck for tomorrow's NFP!
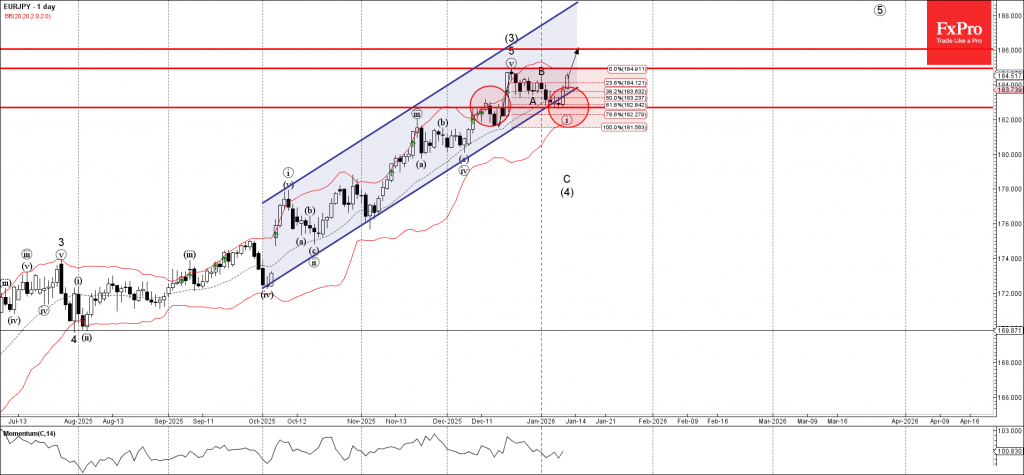
EURJPY Wave Analysis
EURJPY: ⬆️ Buy
- EURJPY reversed from support area
- Likely to rise to resistance level 184.90
EURJPY currency pair recently reversed from the support area between the key support level 182.70(former resistance from December) and the 61,8% Fibonacci correction of the upward impulse from December.
This support area was strengthened by the support trendline of the daily up channel from October.
Given the overriding daily uptrend, EURJPY currency pair can be expected to rise to the next resistance level 184.90 (the breakout of which can lead to further gains toward 186.00).
Eco Data 1/13/26
| GMT | Ccy | Events | Act | Cons | Prev | Rev |
|---|---|---|---|---|---|---|
| 21:00 | NZD | NZIER Business Confidence Q4 | 48 | 18 | ||
| 22:50 | AUD | Westpac Consumer Sentiment Jan | -1.70% | -9.00% | ||
| 23:50 | JPY | Bank Lending Y/Y Dec | 4.40% | 4.10% | 4.20% | 4.10% |
| 23:50 | JPY | Current Account (JPY) Nov | 3.14T | 3.04T | 2.48T | |
| 05:00 | JPY | Eco Watchers Survey: Current Dec | 48.6 | 48.8 | 48.7 | |
| 11:00 | USD | NFIB Business Optimism Index Dec | 99.5 | 99.5 | 99 | |
| 13:30 | CAD | Building Permits M/M Nov | -13.10% | -6.50% | 14.90% | 15.70% |
| 13:30 | USD | CPI M/M Dec | 0.30% | 0.30% | 0.30% | |
| 13:30 | USD | CPI Y/Y Dec | 2.70% | 2.70% | 2.70% | |
| 13:30 | USD | CPI Core M/M Dec | 0.20% | 0.30% | 0.20% | |
| 13:30 | USD | CPI Core Y/Y Dec | 2.60% | 2.70% | 2.60% |
| 21:00 | NZD |
| NZIER Business Confidence Q4 | |
| Actual | 48 |
| Consensus | |
| Previous | 18 |
| 22:50 | AUD |
| Westpac Consumer Sentiment Jan | |
| Actual | -1.70% |
| Consensus | |
| Previous | -9.00% |
| 23:50 | JPY |
| Bank Lending Y/Y Dec | |
| Actual | 4.40% |
| Consensus | 4.10% |
| Previous | 4.20% |
| Revised | 4.10% |
| 23:50 | JPY |
| Current Account (JPY) Nov | |
| Actual | 3.14T |
| Consensus | 3.04T |
| Previous | 2.48T |
| 05:00 | JPY |
| Eco Watchers Survey: Current Dec | |
| Actual | 48.6 |
| Consensus | 48.8 |
| Previous | 48.7 |
| 11:00 | USD |
| NFIB Business Optimism Index Dec | |
| Actual | 99.5 |
| Consensus | 99.5 |
| Previous | 99 |
| 13:30 | CAD |
| Building Permits M/M Nov | |
| Actual | -13.10% |
| Consensus | -6.50% |
| Previous | 14.90% |
| Revised | 15.70% |
| 13:30 | USD |
| CPI M/M Dec | |
| Actual | 0.30% |
| Consensus | 0.30% |
| Previous | 0.30% |
| 13:30 | USD |
| CPI Y/Y Dec | |
| Actual | 2.70% |
| Consensus | 2.70% |
| Previous | 2.70% |
| 13:30 | USD |
| CPI Core M/M Dec | |
| Actual | 0.20% |
| Consensus | 0.30% |
| Previous | 0.20% |
| 13:30 | USD |
| CPI Core Y/Y Dec | |
| Actual | 2.60% |
| Consensus | 2.70% |
| Previous | 2.60% |
Fed Chair Powell is Under Attack – Silver (XAG/USD) and Gold (XAU/USD) Fresh All-Time Highs
Donald Trump is a stubborn President, to say the least. Just when markets were enjoying a few relaxing months of silence regarding Fed independence, the Administration has struck again.
Over the weekend, the Department of Justice opened a formal investigation into Federal Reserve Chair Jerome Powell, regarding statements made during his recent Senate Testimony.
It is painfully easy to read between the lines here. This appears to be a political masquerade—a manufactured pretext to fire Powell before his term officially concludes.
The impatience seems unjustified, given that his tenure ends in May 2026 and markets are already expecting an announcement on his successor by the end of this month.
In a special address delivered yesterday evening, Chair Powell fired back, significantly upping his tone regarding the Federal Reserve's stance against politicized interference.
The Verdict: Market Chaos.
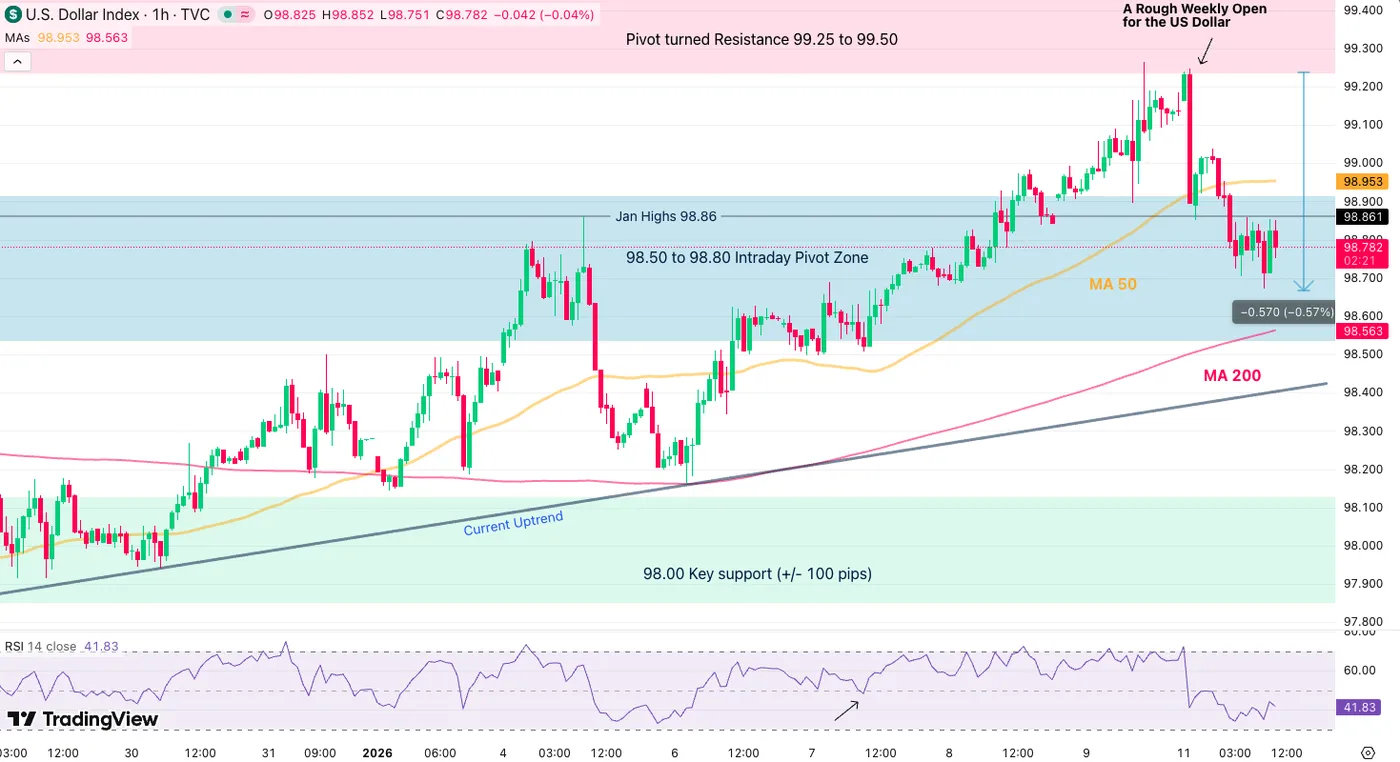
Dollar Index 1H Chart. January 12, 2026 – Source: TradingView
The US Dollar is plummeting to start the week and stocks are in the red. On the other hand, keeping with the dominant trend of the past year, Metals are shining bright.
Acting as the preferred safe haven—displacing even the Yen and the now-compromised US Treasuries—precious metals have shot through the roof in early trading.
This political theater highlights a structural shift: Central Banks and investors are aggressively diversifying away from an overdependence on US assets as their traditionally stable reputation erodes.
Gold has now solidified its place as the largest reserve asset for central banks, with China leading a global diversification charge.
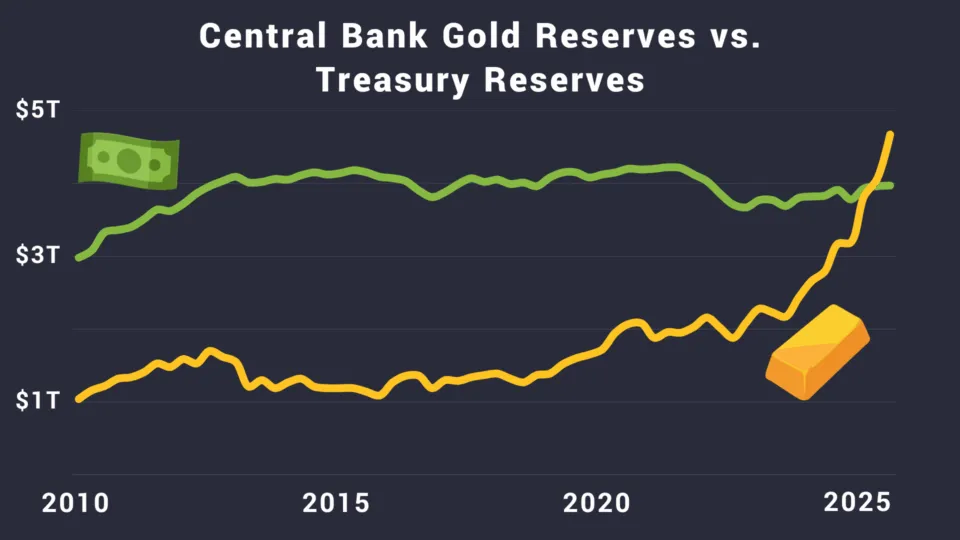
Gold and US Dollar as Central Bank Reserves – Courtesy of Vaulted.com
With Silver breaking $85 and Gold comfortably trading above its previous peak ($4,600+), the message is clear: Metals are not looking to ease their rally anytime soon.
The buying frenzy is broad-based, with Platinum, Palladium, Copper, and Aluminum all chasing new monthly or yearly highs as we speak.
Let's dive right into a two-timeframe intraday analysis for Gold (XAU/USD) and Silver (XAG/USD) to see where these flows could be heading.
Gold (XAU/USD) Daily and 2H Charts
Daily Chart
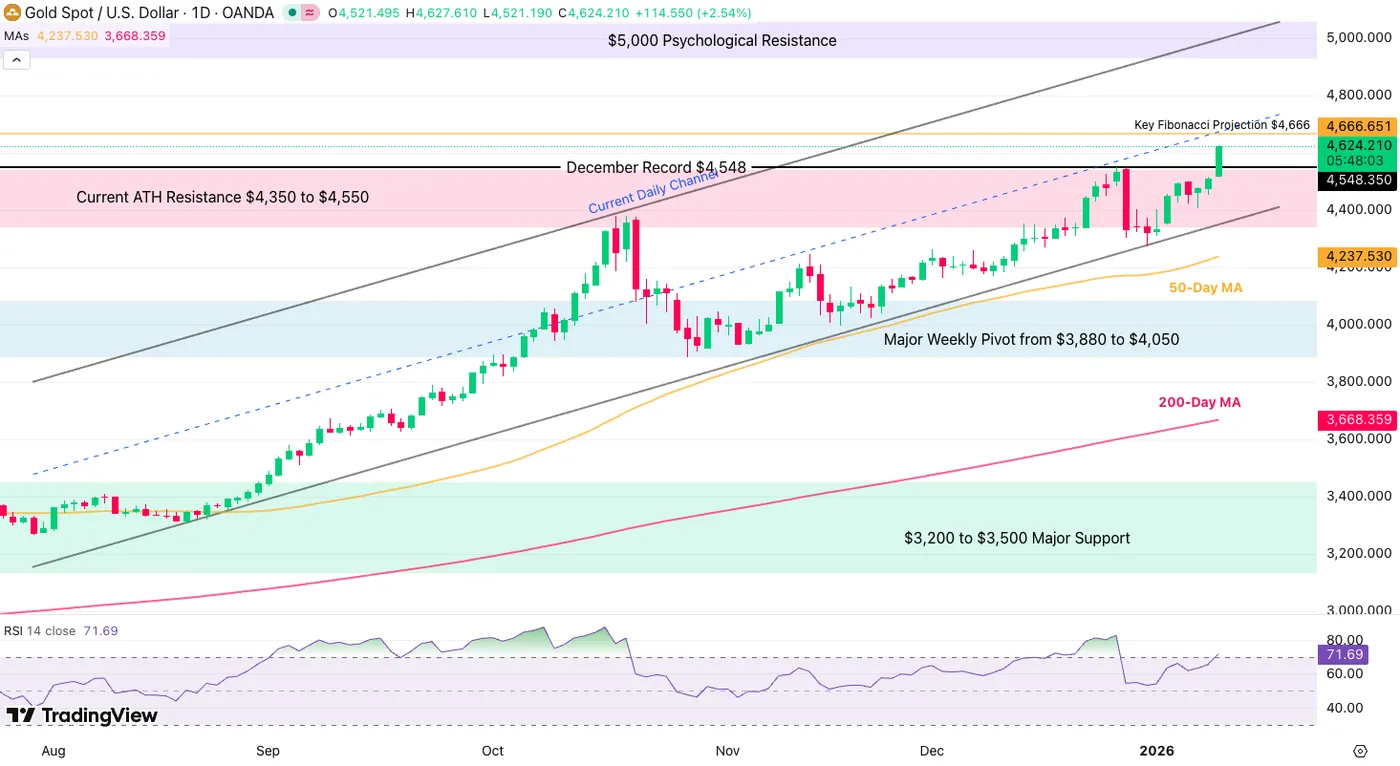
Gold (XAU/USD) Daily Chart, January 12, 2026 – Source: TradingView
After the past week close above $4,500, technicals went right ahead to magnify the return of even-more bullish fundamentals for the yellow metal.
Since August, the rally hadn't seen many retracements, but after the late-December correction, a strong upward Channel is forming, with the latest bounce being used by bulls to reach the current all-time highs.
Easily blasing beyond the Weekly divergence noted last week.
Currently at $4,630 and running, Gold will face a small technical resistance at $4,666, from a key Fibonacci projection (1.618 from 2023 Lows to mid-2025 levels).
If bulls breach the level, there won't be much until $5,000 which coincides with the top of the Channel.
Let's take a closer look.
2H Chart and Technical Levels
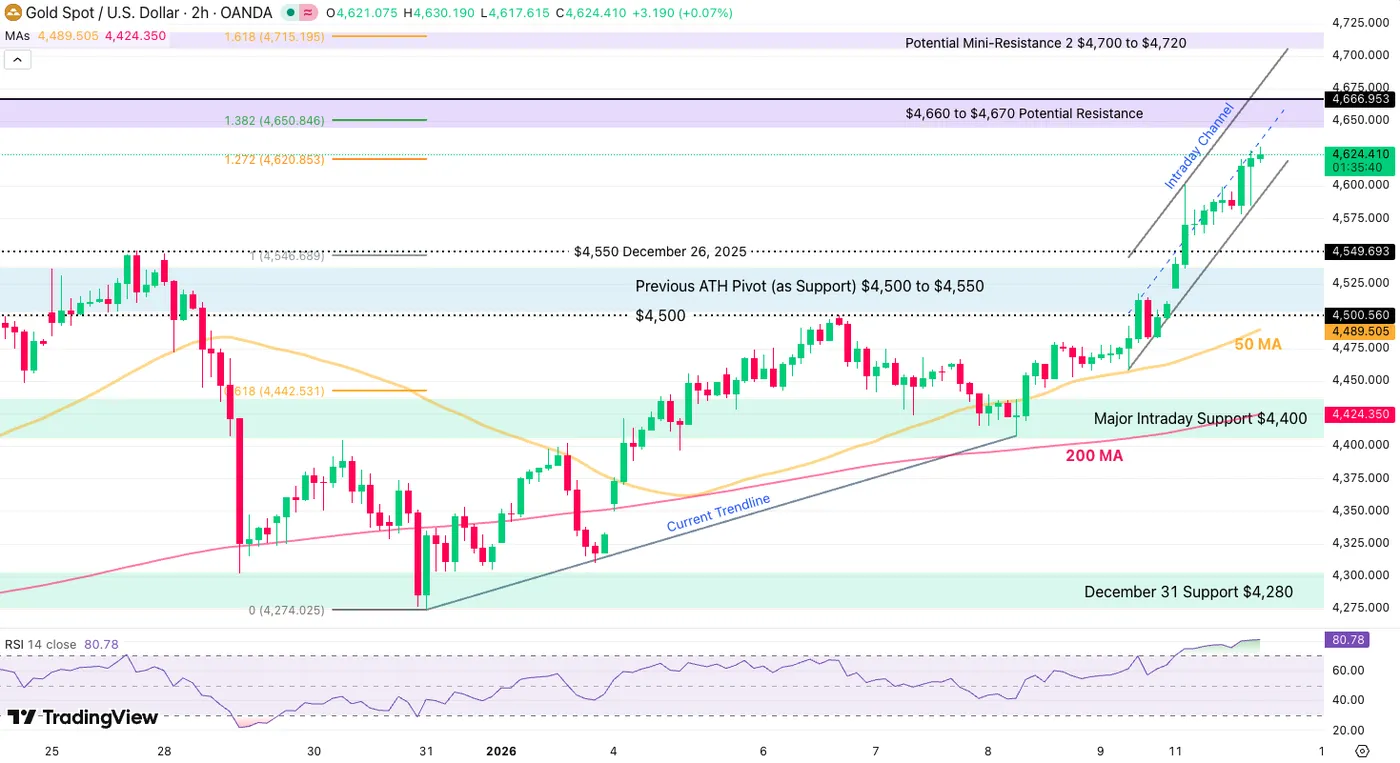
Gold (XAU/USD) 2H Chart, January 12, 2026 – Source: TradingView
Forming a tight bull channel on the intraday timeframe, nothing but some overbought conditions seem to be stopping the rally in Gold.
Reaching session highs at $4,630, the frantic buying is stalling a bit.
For pullbacks, aggressive pullback buying could take place at $4,590 (intraday channel lows).
Breaking the steep session channel would point to a retest of the previous All-Time highs around $4,550.
Levels to watch for Gold (XAU/USD) trading:
Resistance Levels
- $4,630 Current session and all-time High
- $4,660 to $4,670 Potential Resistance
- Potential Mini-Resistance 2 $4,700 to $4,720
- Top of Daily Channel and Psychological Level $5,000
Support Levels
- Intraday Channel lows $4,590
- Previous ATH Pivot (as Support) $4,500 to $4,550
- Session Lows Previous ATH Pivot (as Support) $4,500 to $4,550
- Major Intraday Support $4,400 and 4H 50-MA
- December 31 Mini-Support Support $4,280
- Weekly Major Pivot $3,950 to $4,000
Silver (XAG/USD) Daily and 2H Charts
Daily Chart
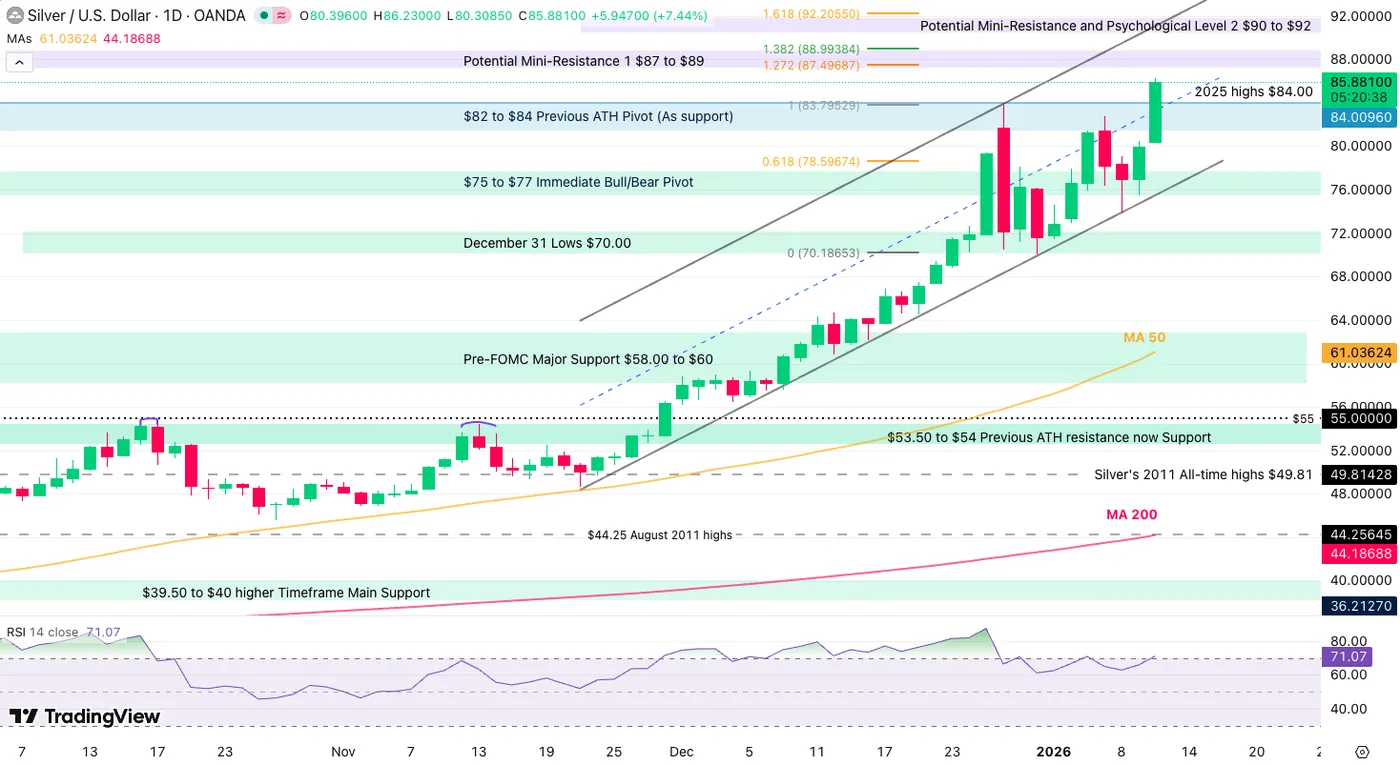
Silver (XAG/USD) Weekly Chart, January 12, 2026 – Source: TradingView
The action in XAG/USD is starting now looking insane.
Silver is leading its peers yet again in today's action, up around 8% in a huge bullish candle in today's action, easily breaching beyond the $85 psychological level, leaving more technical upside to the rally.
Also forming a Daily Channel, no resistance is emerging before the $88 to $89 Fibonacci Area.
Except for any major fundamental change (like world peace or a return of Fed Hikes), nothing is looking to stop the run.
Let's see what intraday charts are telling us.
2H Chart and Technical Levels
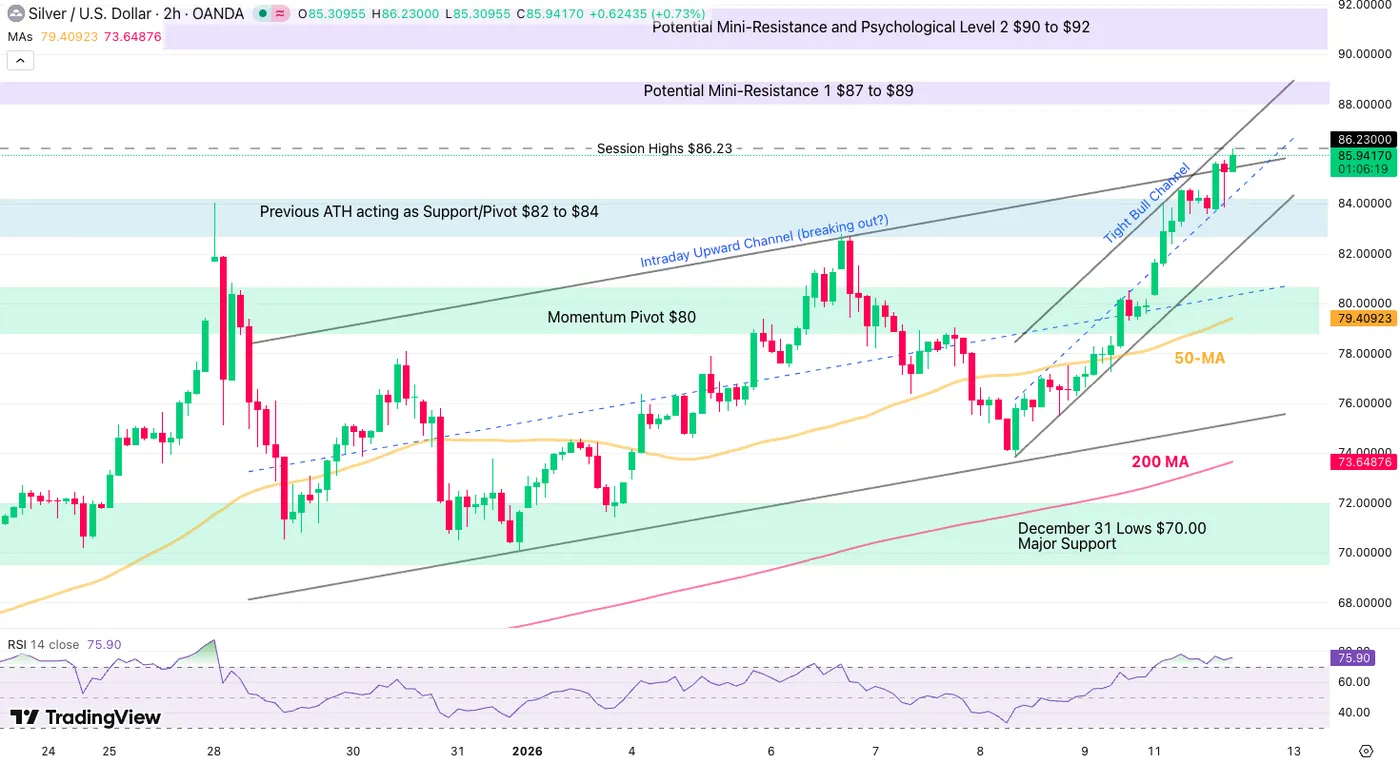
Silver (XAG/USD) 2H Chart, January 12, 2026 – Source: TradingView
With the action now stalling a bit after the tumultuous overnight/morning action, Silver traders will be looking at two technical elements:
- Whether bulls manage to fully break above the Sideways Channel (testing a breakout)
Or follow the steep Tight Bull Channel from the current session, pointing to even more aggressive action.- Breaking below this one hints at a retest of the $80.00 Momentum Pivot.
- Maintaining the momentum would easily guide the action to $88 and potentially more.
To put things into perspective, SIlver is up 77% since Williams comments hinted at a December Fed Cut!
Levels to watch for Silver (XAG/USD) trading:
Resistance Levels:
- $86.23 Session and All-Time Highs
- Potential Mini-Resistance 1 $87 to $89
- Potential Mini-Resistance and Psychological Level 2 $90 to $92
Support Levels:
- $82 to $84 Previous ATH Pivot (As support)
- $80.00 Momentum Pivot
- $75 to $77 Minor Support and Channel lows
- December 31 Lows $70.00
- Pre-FOMC Major Support $58.00 to $60 and 50-Day MA
Safe Trades and a Successful Week!
More Pressure on the Federal Reserve Emerges
Summary
News broke on Sunday night that the Federal Reserve received grand jury subpoenas from the Department of Justice on Friday, escalating the Trump administration's pressure on the nation's central bank. While we do not believe this will alter the near-term course of monetary policy, it will make the next Fed Chair's job that much harder to build a consensus among the 19 members of the Federal Open Market Committee.
- The latest in a string of efforts to pressure the Fed: We believe it is worth highlighting that President Trump's initial reaction was to claim he was unaware of the DOJ's action. That said, the DOJ's investigation follows a year in which the president has made it clear he is unhappy with the Federal Reserve's monetary policy stance, which could have spurred administration officials to open up the investigation without an explicit green-light from President Trump.
- The timing strikes us as odd: Jerome Powell's term as Fed Chair expires in May, leaving only three more FOMC meetings for him to preside over. However, Powell’s term as governor runs until January 2028, and there has been speculation about him staying on as a governor until then to help maintain Fed independence. We suspect the investigation may be an effort by the administration to put pressure on Powell to leave the Board of Governors entirely by May. An open investigation may increase the prospect of him staying to add his weight to preserving central bank independence, but we still see it as more likely than not that he departs after his 14 years of service.
- No influence over the near-term outlook for Fed policy: We do not believe this materially changes the outlook for monetary policy in the short-term. Chair Powell has shown time and again that he believes the best antidote to political pressures on the Fed is to follow the data and set policy based on the Committee’s assessment of the economic outlook, and we expect him to maintain that position. It is also important to remember that setting the federal funds rate is a Committee decision, with 11 other FOMC voters and 18 other FOMC participants involved in the process. Their own hawkish/dovish convictions will continue to be the primary determinant of monetary policy, in our view.
- The investigation could delay the confirmation of the next Fed Chair: Senator Thom Tillis (R-NC) stated last night that he would not support any nominee for Fed Chair until this legal issue is resolved. Given that he serves on the key Senate Banking Committee and has already announced plans to retire at the end of this year, this gives Tillis considerable leverage over the situation.
- More uncertainty for medium-term policy: The DOJ investigation reinforces the narrative that Trump will wield more influence over the next Fed Chair. This is likely to put the next Fed Chair in an even more difficult position of winning over an already divided Committee when it comes to the medium-term monetary policy outlook.
- Political pressure on the Fed, real or imagined, is not costless: Markets mostly took the news in stride, but the modest financial market moves thus far have been consistent with what we would expect to see when worries flare up about Fed independence: higher Treasury yields, a steeper yield curve, a weaker dollar and a rally in gold prices. We expect the FOMC will continue to make policy decisions on the basis of the economic environment—not the political environment—as was clearly laid out by Powell in a video statement yesterday. Nevertheless, this latest episode risks damaging the credibility of Fed independence and U.S. good governance practices.