
Sample Category Title
Sunset Market Commentary
Markets
It’s been a while since we’ve seen financial media using “Sell America”. The term was coined in the aftermath of president Trump’s tariff announcement on April 2 to describe surging risk premia rolling over all US assets, from stocks over the currency to government bonds. Trump’s aggressive trade policy came after a series of other - let’s call them unconventional - policy decisions and tested holders’ of US assets nerves. Moves today are of a totally different magnitude but nevertheless equally broad. They originated from what is seen as a renewed attack by the Trump administration on Fed independence. The DoJ served the Fed and its chair with subpoenas related to above-budget Fed HQ renovations. According to the chair himself, though, it’s nothing but a pretext used by the US administration to arm wrestle the Fed into lower (short-term) policy rates. US Treasuries underperform Bunds, with downward pressure strongest at the long end of the curve. Net daily changes vary between +0.2 (2-yr) and +3 bps (30-yr). Bringing Fed independence back on investors’ radar today is a bit unfortunate with a combined $58 3-yr and $39 bn 10-yr auction scheduled for today. Luckily for Treasury, however, market appetite is usually the strongest at the start of the year. The German curve bull flattens by -1 bps (2-yr) to -2.3 bps (30-yr). Intra EMU-spreads are broadly stable, including in France, where two no-confidence votes were filed by the far-left and right over the country’s failure to block the Mercosur trade deal. The Socialists have already signaled they won’t support any of them, meaning the motions are dead on arrival. US stocks open with losses of up to 0.7% but were off the intraday lows (in the futures market). The US dollar lags major peers in the FX market. DXY retraced part of last week’s gains by dropping back below 99. EUR/USD snaps a losing streak by rebounding back towards but remaining below 1.17. You won’t be surprised to read that from a technical point of view, literally nothing changed. The Japanese yen is the only currency worse off than the USD in the G10 environment. Rumours of snap elections, to be announced as soon as Jan 30, are weighing on the currency through rising fiscal risk premia in a not unlikely scenario where PM Takaichi’s ruling LDP regains its majority in the powerful lower house. The impact on JGB’s is yet to be seen since Japanese markets were closed today. Oil prices rose in early morning deals on geopolitical concerns related to protests in Iran and potential US involvement that could upend Iranian oil supply. Brent’s move didn’t go any further than $64 though before hitting a speed bump.
News & Views
The KPMG and REC UK report on jobs as compiled by S&P global, indicates that uncertainty around the economic outlook and rising costs still weighed on recruitment activity at the end of 2025. Permanent staff appointments fall at the quickest pace in four months and with the downturn already in place for 39 months. Temporary billings also decline at a faster pace. Vacancy data signaled another marked reduction in demand for workers at the end of the fourth quarter, with the rate of decline quickening slightly from November. Fewer job opportunities and widespread reports of redundancies drove a further substantial rise in candidate availability. The report at the same time showed a tentative improvement in pay trends. After a multi-year low in September, starting salary touched a seven-month high, but stays below the long term trend. Temporary wages rose but also remain well below the historical average.
Industrial production in Hungary disappointed in November. After two months of positive growth, production declined 2% M/M pushing the level of output 5.4% lower Y/Y. Cumulative production over the first 11 months of 2025 was 5.3% lower compared to 2024. Hungary’s statistical office indicated that ‘production volume decreased in the great majority of the manufacturing subsections’ compared to the same month of the previous year’. Growth in computer, electronic and optical products, as well as the manufacture of food products, beverages and tobacco products was positive, but a decline occurred in the manufacture of transport equipment, as well as in the manufacture of electrical equipment. Last Friday’s November retail sales (2.5% Y/Y) also were unconvincing. These sub-par data come as the MNB last month mitigated its assessment that policy should remain restrictive as it will reassess its policy on a meeting-by-meeting basis. The Hungarian 2-y yield declines another 3 bps today to 5.86%.This compares to levels near 6.30% just one month ago. The forint weakens further to EUR/HUF 386.8.
USD/CHF Mid-Day Outlook
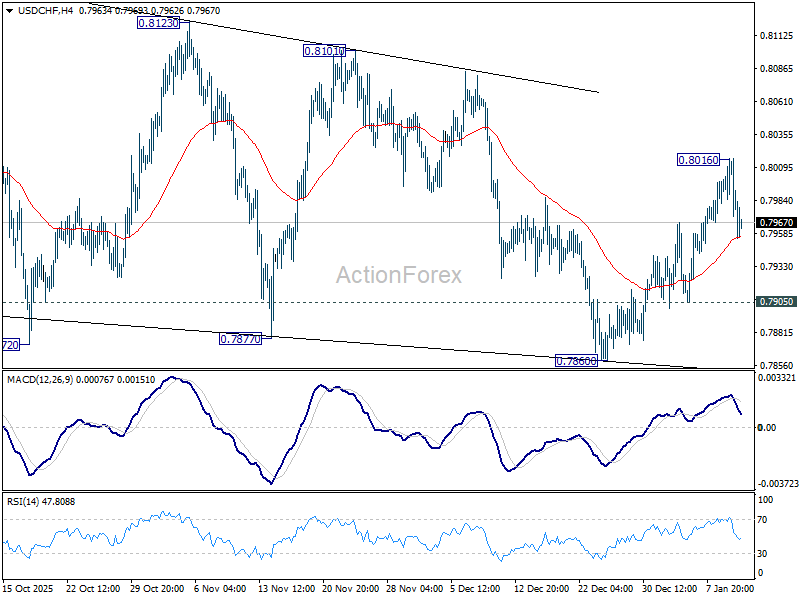
Daily Pivots: (S1) 0.7990; (P) 0.8004; (R1) 0.8026; More….
Intraday bias in USD/CHF stays neutral for the moment. Overall outlook is unchanged that corrective pattern from 0.7828 low is extending. On the upside, above 0.8016 will target 0.8123 resistance next. Nevertheless, break of 0.7905 support will resume the fall from 0.8123 to retest 0.7828 low. Firm break there will resume larger down trend.
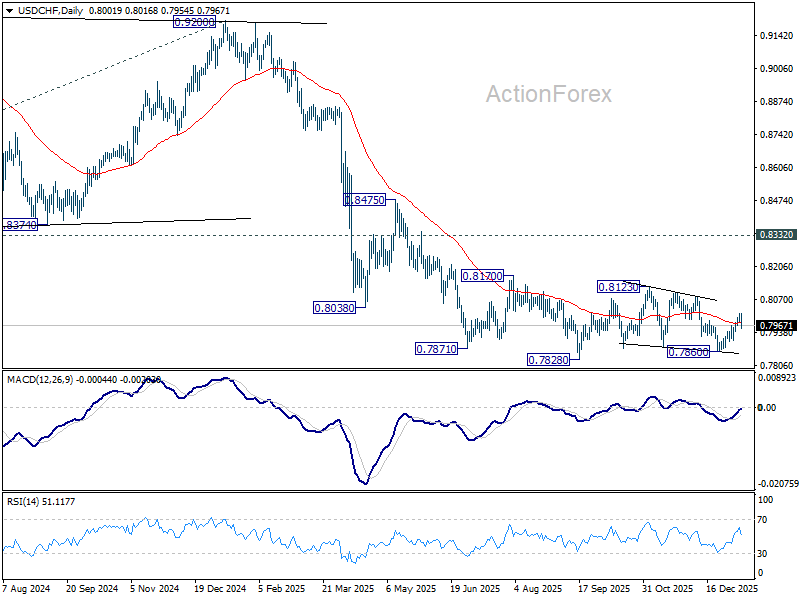
In the bigger picture, price actions from 0.7828 are seen as a correction. Larger down trend from 1.0342 (2017 high) is in still in progress. Break of 0.7828 will target 100% projection of 1.0146 (2022 high) to 0.8332 from 0.9200 at 0.7382. In any case, outlook will stay bearish as long as 0.8332 support turned resistance holds (2023 low).
USD/JPY Mid-Day Outlook
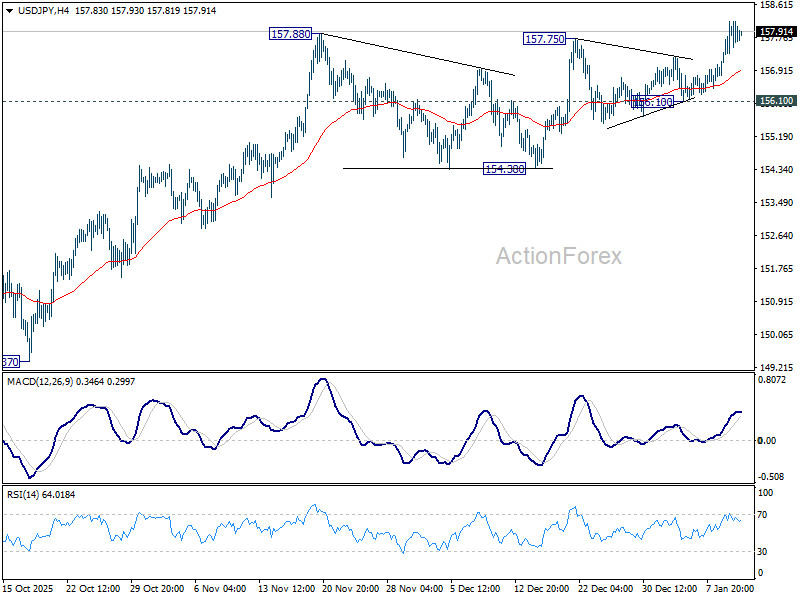
Daily Pivots: (S1) 156.54; (P) 156.80; (R1) 157.15; More...
Outlook in USD/JPY is unchanged and intraday bias stays on the upside. Current rise from 139.87 should target 161.8% projection of 142.66 to 150.90 from 145.47 at 158.80. Firm break there will pave the way to 200% projection at 161.95, which is close to 161.94 high. For now, outlook will stay bullish as long as 156.10 support holds, in case of retreat.
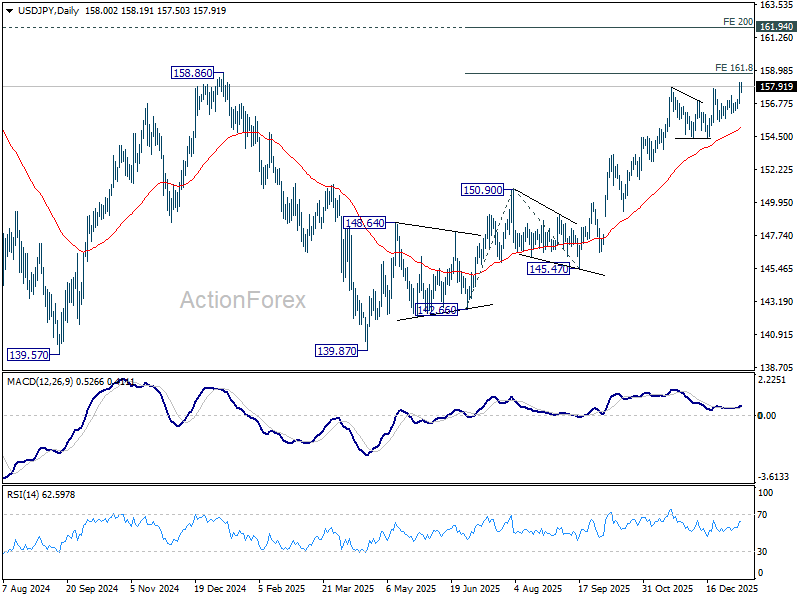
In the bigger picture, corrective pattern from 161.94 (2024 high) could have completed with three waves at 139.87. Larger up trend from 102.58 (2021 low) could be ready to resume through 161.94. Decisive break of 158.85 structural resistance will solidify this bullish case and target 161.94 for confirmation. On the downside, break of 154.38 support will dampen this bullish view and extend the corrective range pattern with another falling leg.
EUR/USD Mid-Day Outlook
Daily Pivots: (S1) 1.1615; (P) 1.1639; (R1) 1.1661; More….
Intraday bias in EUR/USD stays neutral at this point. On the upside break of 1.1742 resistance will argue that pullback from 1.1807 has completed. Rise from 1.1467 should then be ready to resume. Further break of 1.1807 will pave the way to retest 1.1817 high. Nevertheless, on the downside, below 1.1617 will target 1.1467 support. Overall, price actions from 1.1917 are seen as a corrective pattern that might extend further.
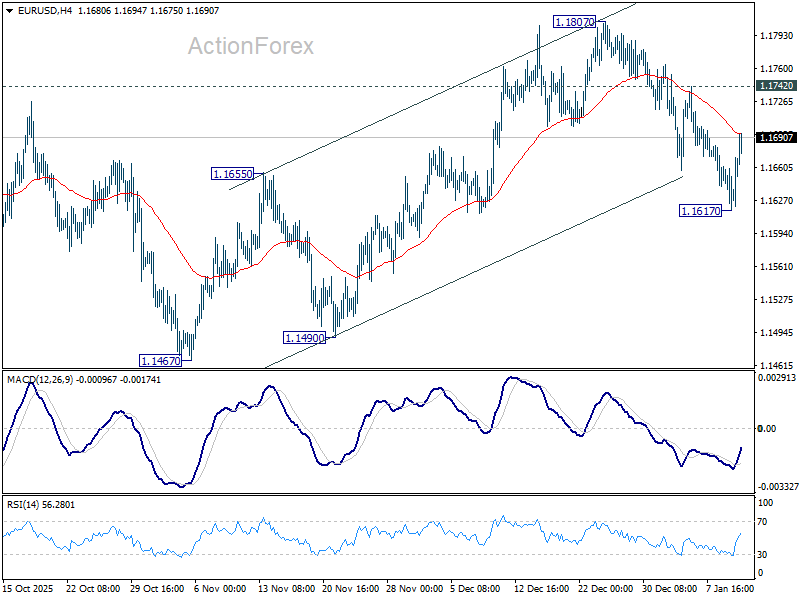
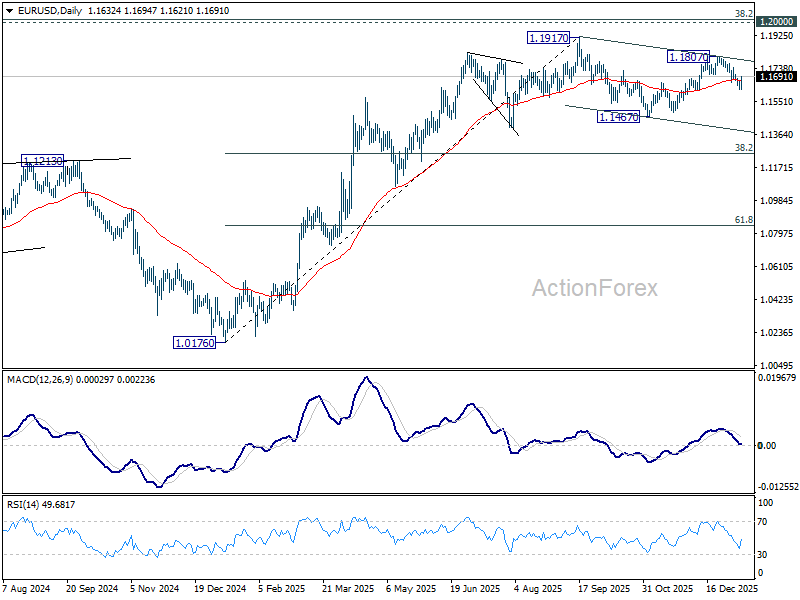
In the bigger picture, as long as 55 W EMA (now at 1.1416) holds, up trend from 0.9534 (2022 low) is still in favor to continue. Decisive break of 1.2 key psychological level will carry larger bullish implication. However, sustained trading below 55 W EMA will argue that rise from 0.9534 has completed as a three wave corrective bounce, and keep long term outlook bearish.
Fed Credibility Risk Sends 10-Yr Yield Above 4.2, Euro to Benefit as Dollar Alternative?
With the economic calendar nearly empty, markets are fixated on the escalating political risk surrounding Fed Chair Jerome Powell, who is now under federal criminal investigation linked to the renovation of the Fed’s headquarters and his congressional testimony on the matter. The move has taken markets by surprise, particularly given that Powell’s term as Fed Chair is due to conclude in May. A new chair is expected to be appointed soon, with President Donald Trump widely anticipated to announce his pick later this month.
One theory in markets is that the investigation is tied to the broader political calendar, with US midterm elections in November. The administration is seen as keen to push interest rates lower as quickly as possible, and pressure on the Fed has intensified as policymakers resist aggressive easing.
Powell’s response has been unusually direct. In a blunt statement, he warned that “the threat of criminal charges is a consequence of the Federal Reserve setting interest rates based on our best assessment of what will serve the public, rather than following the preferences" of the President.
A key question now is whether this episode prompts investors to diversify away from US assets, particularly at the long end of the Treasury curve. While reactions have so far been measured, the potential for a deeper reassessment of US institutional credibility is resurfacing. That risk is starting to show in rates markets. US 10-year Treasury yields have breached the important 4.20% technical resistance zone. A sustained move above that level could open the door to a more meaningful selloff in Treasuries, especially if confidence erosion accelerates.
Under normal circumstances, rising long-end yields would be supportive for Dollar. This time, however, the currency has failed to benefit, as concerns around policy credibility and institutional independence offset the usual rate-supportive dynamics.
Gold has been the clear beneficiary of this environment, surging to fresh record highs as investors seek insulation from political and institutional uncertainty. Attention is also turning to whether Euro could attract renewed inflows as the only viable liquid alternative to Dollar should confidence in US assets deteriorate further.
In FX markets so far, Dollar sits at the bottom of the performance table, followed by Yen and Loonie. Yen remains pressured as markets bet Japan could call a snap election to capitalize on Prime Minister Sanae Takaichi’s strong popularity and pursue fiscal expansion, and thus lifts domestic risk appetite. Kiwi leads gains, followed by Swiss Franc and Sterling, with Euro and Aussie trading in the middle of the pack.
In Europe, at the time of writing, FTSE is up 0.16%. DAX is up 0.50%. CAC is up 0.02%. UK 10-year yield is up 0.02 at 4.398. Germany 10-year yield is down -0.017 at 2.851. Earlier in Asia, Japan was on holiday. Hong Kong HSI rose 1.44%. China Shanghai SSE rose 1.09%. Singapore Strait Times rose 0.47%.
Eurozone Sentix jumps to six-month high, recovery optimism builds
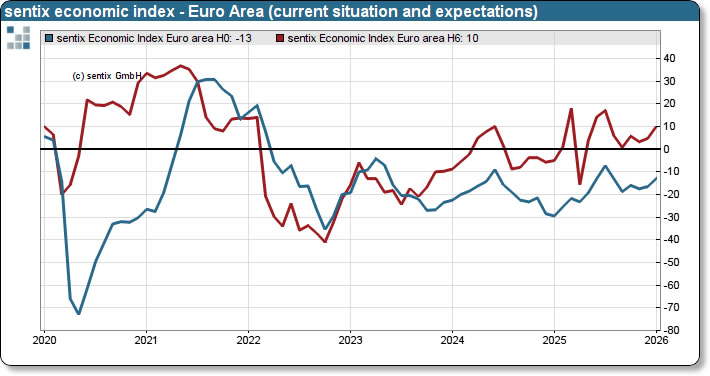
Eurozone investor confidence improved at the start of the year, with Sentix Investor Confidence Index rising from -6.2 to -1.8 in January, well above expectations of -5.1 and the strongest reading since July. The rebound was broad-based, with the Current Situation Index climbing from -16.5 to -13.0 and the Expectations Index jumping from 4.8 to 10.0, both also six-month highs.
Sentix noted that the improvement reflects a narrowing gap between professional and private investors. While institutional investors had already turned more optimistic in recent months, private investors had remained sceptical. That dynamic is now shifting, with private investors beginning to join the recovery narrative, even though differences in outlook between the two groups remain historically large.
Inflation concerns are also easing at the margin. Sentix’s Inflation Barometer shows expectations for slightly softer price pressures, helping to reduce stress on bond markets. However, Sentix cautioned against assuming renewed central bank support, warning that as the recovery takes hold, ECB policymakers are "unlikely to feel much incentive to act".
EUR/USD Mid-Day Outlook
Daily Pivots: (S1) 1.1615; (P) 1.1639; (R1) 1.1661; More….
Intraday bias in EUR/USD stays neutral at this point. On the upside break of 1.1742 resistance will argue that pullback from 1.1807 has completed. Rise from 1.1467 should then be ready to resume. Further break of 1.1807 will pave the way to retest 1.1817 high. Nevertheless, on the downside, below 1.1617 will target 1.1467 support. Overall, price actions from 1.1917 are seen as a corrective pattern that might extend further.
In the bigger picture, as long as 55 W EMA (now at 1.1416) holds, up trend from 0.9534 (2022 low) is still in favor to continue. Decisive break of 1.2 key psychological level will carry larger bullish implication. However, sustained trading below 55 W EMA will argue that rise from 0.9534 has completed as a three wave corrective bounce, and keep long term outlook bearish.
Gold Shines on Anti-Fiat Thesis
- The dollar suffered due to threats to the Fed’s independence.
- Gold managed to renew its record highs.
While labour market statistics strengthened the US dollar, the Justice Department’s lawsuit against Jerome Powell seriously weakened it. The USD index recorded its worst fall in three weeks due to fears that the White House could undermine the Fed’s independence, filling the FOMC with very dovish members. This risk stands in striking contrast with the current expectations of just two cuts by the end of 2026.
The US administration’s lawsuit against Lisa Cook is not without logic. She will remain a member of the FOMC for a long time to come. By comparison, the developments involving the Fed Chair appear considerably more perplexing. Jerome Powell is due to leave his post in May. Moreover, thanks to him, the Committee has been leaning towards lowering rates at recent meetings. The case concerning the renovation of the Federal Reserve building may set a precedent for investigating the circumstances surrounding the recent demolition of the East Wing of the White House.
Markets perceive the resumption of pressure on the Fed as a reason to close short positions on EURUSD. December employment growth in line with forecasts and a drop in unemployment to 4.4% gave derivatives reason to reduce the chances of easing in March to 29% and in April to 42%, with a full cut not priced in until June. The five-month pause, coupled with wide spreads on US and other bonds, had created a solid foundation for the US dollar to strengthen over the previous two weeks.
The Supreme Court is ready to come to the greenback’s aid. It has stated that it will rule on the legality of the White House tariffs on 14 January. The US economy could receive additional stimulus in the form of a return to tariffs. Its acceleration could force the Fed to keep rates high for a long time. This will support the bears on EURUSD.
However, the risks of tariffs being declared illegal do not scare the White House. According to Kevin Hassett, the US will be able to quickly bring its tariff policy back to its previous format. Washington has a plan B that is just as effective as plan A.
The revival of the topic of the Fed’s loss of independence allowed Gold to update its record high. For the first time in history, the precious metal exceeded $4,600 per ounce. According to JP Morgan, gold is an anti-fiat currency. The growth of public debt and attacks on central banks are increasing interest in debasement trading. The company is ready to hold up to 20% of its portfolio assets in precious metals and similar assets, changing the classic 60/40 model.
XAU/USD: Gold Hits New Record High at $4,600
Gold price surged to new record high at $4600 in early trading on Monday, as the latest clash between President Trump’s administration and Fed Chair Powell, on a criminal probe to Fed chief, which raises big question mark above the independence of the US central bank, further fueled uncertainty, as political crisis in the US deepens.
Situation in Iran remains very fragile and marks another key driver of the latest strong rise of demand for safe haven assets with US threats to attack the country and Iran expressing readiness for strong response, boosted migration into safety.
Gold opened with slight gap higher on Monday and easily broke through previous all-time peak, to crack psychological $4600 barrier.
Fresh rally rose again above the upper boundary line of the bull-channel (from late October correction low) that generated fresh bullish signal, as the price made another record fast move from one to another round-figure levels.
However, $4600 resistance is likely to cause headwinds as daily studies are overbought, but limited consolidation with shallow dips to provide fresh levels to re-enter bullish market.
Former top and bull-channel trendline offer initial but solid support at $4550, with extended dips to find firm ground at $4500 zone and keep bulls intact.
Sustained break of $4600 to expose projected targets at $4630; $4687 and $4700 initially, though stronger acceleration cannot be ruled out as all fundamental factors remain very favorable, with focus on highly sensitive geopolitical situation.
In such environment, the yellow metal is likely to extend steep rally which commenced in August, after three month consolidation (May/June/July) which was expressed by three tight monthly Doji candles.
Res: 4630; 4687; 4700; 4750.
Sup: 4550; 4500; 4452; 4429.

Eurozone Sentix jumps to six-month high, recovery optimism builds
Eurozone investor confidence improved at the start of the year, with Sentix Investor Confidence Index rising from -6.2 to -1.8 in January, well above expectations of -5.1 and the strongest reading since July. The rebound was broad-based, with the Current Situation Index climbing from -16.5 to -13.0 and the Expectations Index jumping from 4.8 to 10.0, both also six-month highs.
Sentix noted that the improvement reflects a narrowing gap between professional and private investors. While institutional investors had already turned more optimistic in recent months, private investors had remained sceptical. That dynamic is now shifting, with private investors beginning to join the recovery narrative, even though differences in outlook between the two groups remain historically large.
Inflation concerns are also easing at the margin. Sentix’s Inflation Barometer shows expectations for slightly softer price pressures, helping to reduce stress on bond markets. However, Sentix cautioned against assuming renewed central bank support, warning that as the recovery takes hold, ECB policymakers are "unlikely to feel much incentive to act".
USD/JPY Stalls Near One-Year High
The USD/JPY pair paused on Monday after a sharp rally to around 157.95, with the yen holding near its lowest levels of the year. Trading activity was subdued as Japanese markets were closed for a public holiday.
Political uncertainty increased after Prime Minister Sanae Takaichi, a key coalition partner, raised the possibility of early elections on 8 or 15 February, adding another layer of caution to the market.
The yen also faced pressure from recent mixed macroeconomic data, which have clouded the outlook for the Bank of Japan’s future rate-hike trajectory.
Last week, BoJ Governor Kazuo Ueda reiterated that the central bank would continue to raise interest rates if economic momentum and inflation align with forecasts, while also emphasising a flexible approach to policy adjustments.
Over the coming week, traders will focus on a series of key Japanese economic indicators, including current account figures, machine tool orders, manufacturing PMI, and business sentiment data. Any surprises could prompt a shift in the yen’s direction.
Technical Analysis: USD/JPY
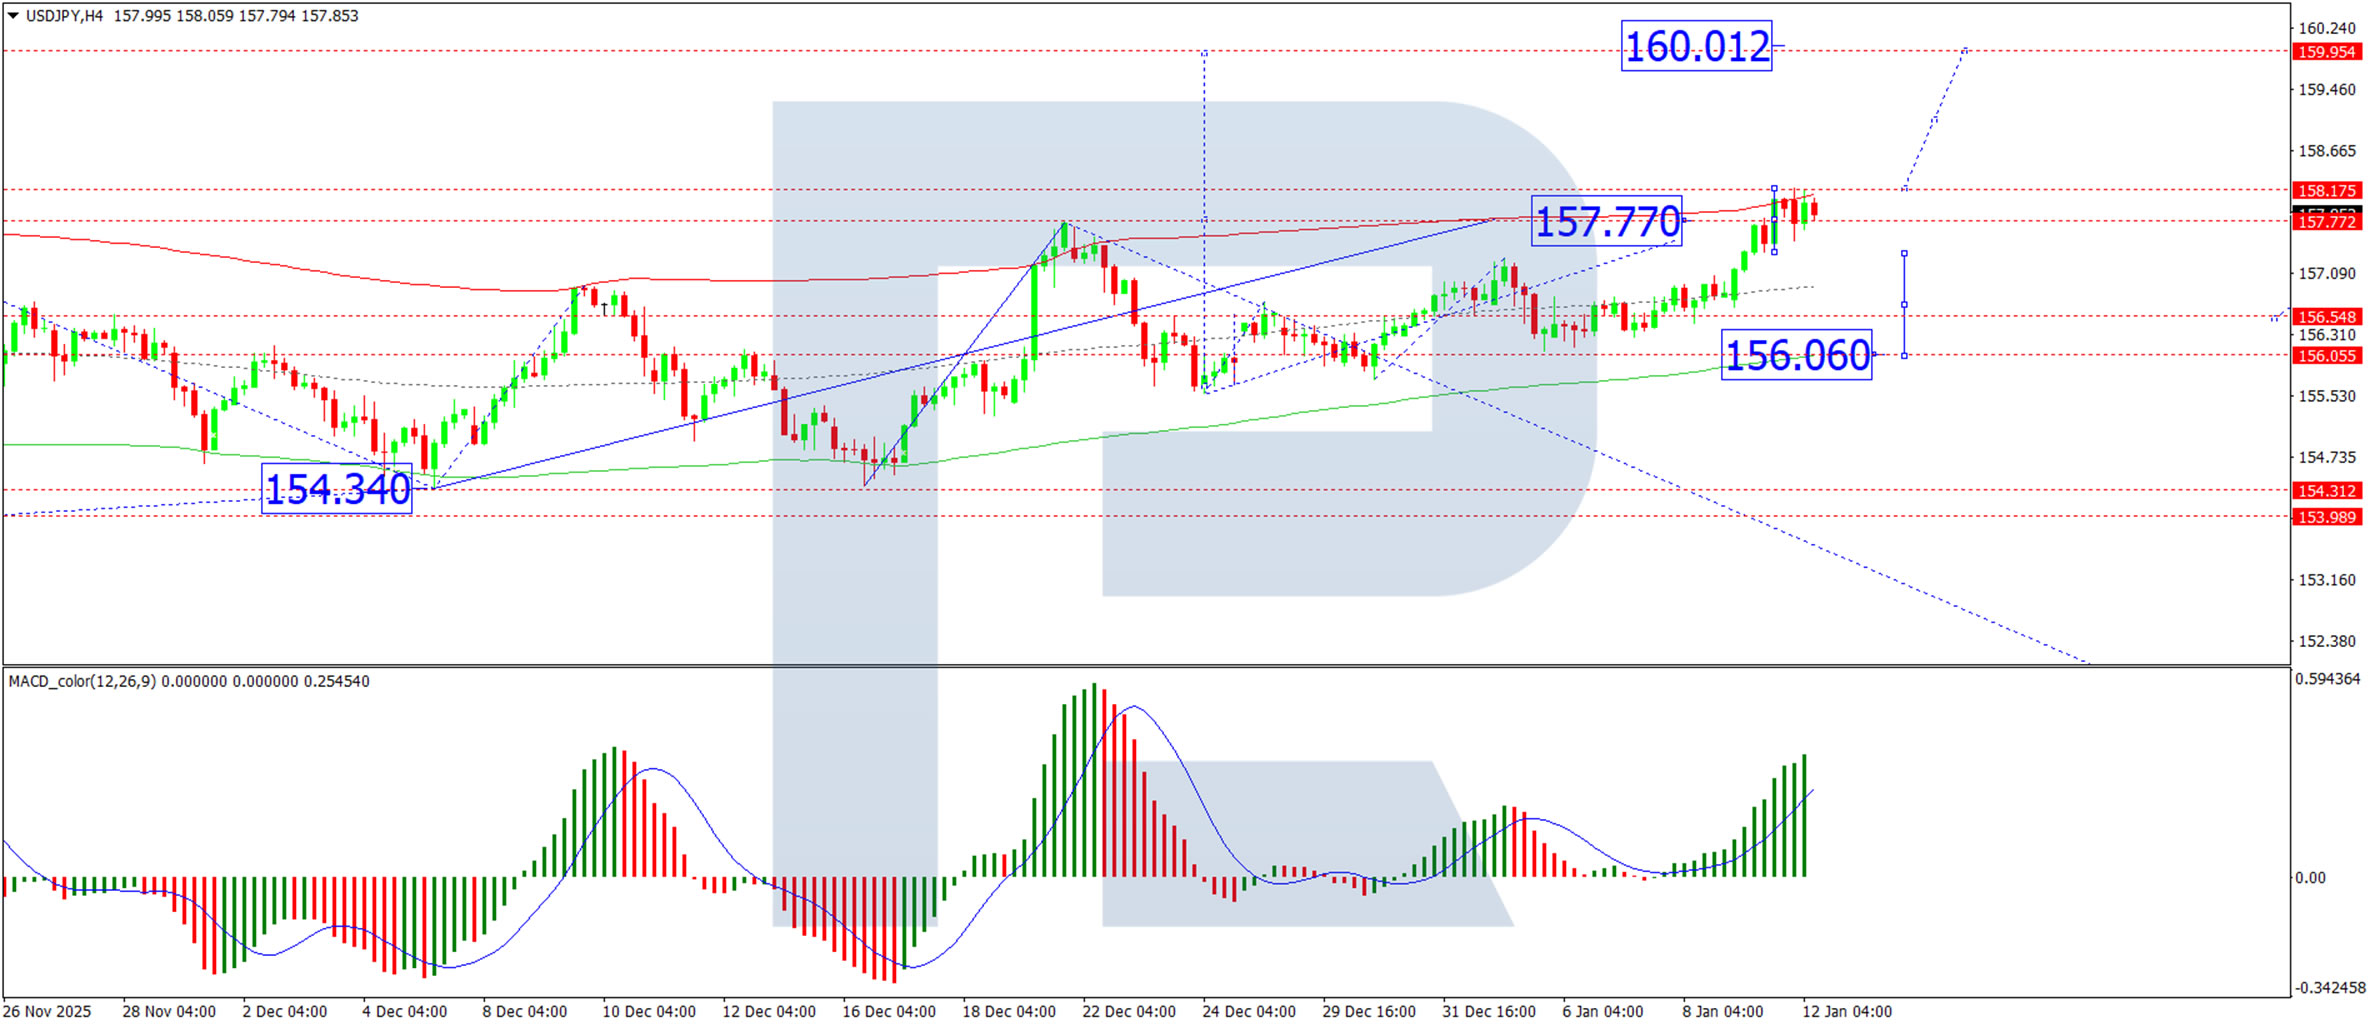
H4 Chart:
On the H4 chart, the pair has completed a local advance to 157.77 and is likely to enter a period of consolidation around this level. A break below this range could trigger a corrective move towards 156.60. Conversely, an upward break would open the potential for the rally to extend towards 159.33. This outlook is supported by the MACD indicator, with its signal line positioned above zero and pointing firmly upward, indicating ongoing bullish momentum.
H1 Chart:
On the H1 chart, the market is forming a consolidation range centred around 157.77, with interim boundaries at 158.18 to the upside and 157.50 to the downside. A downward exit from this range could see a decline towards 156.60, while an upward resolution would signal potential for a further move towards 159.33. The Stochastic oscillator aligns with this view, as its signal line is above 50 and rising towards 80, suggesting continued near-term upward momentum.
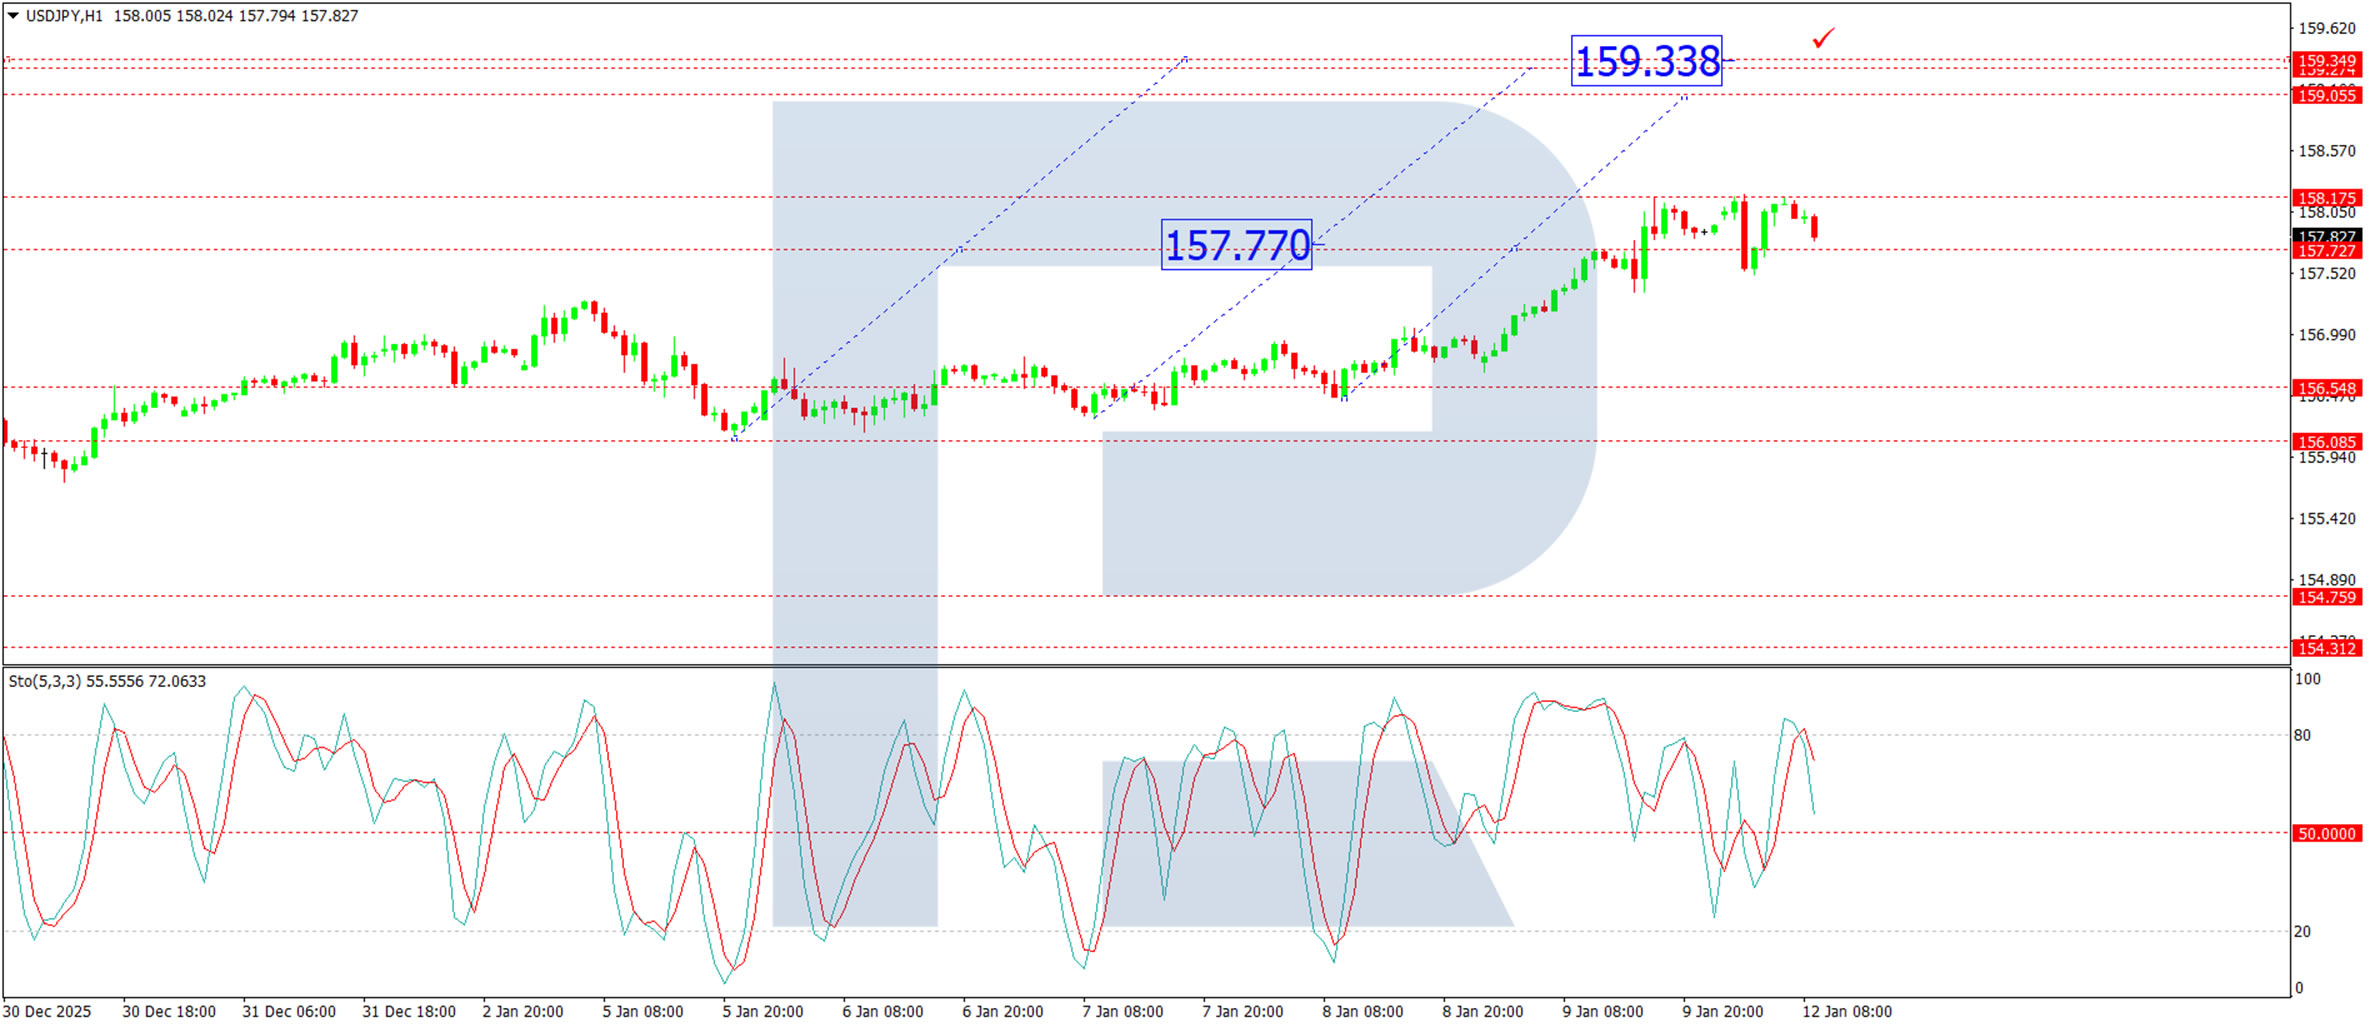
Conclusion
USD/JPY has entered a period of consolidation near annual highs, with direction likely to be determined by upcoming Japanese data and political developments. While the broader technical bias remains bullish, a break below 157.50 could signal the start of a short-term correction.
Safe Havens Benefit on Trump-Fed Feud, Silver Gains 5% as Gold Breaches $4600/oz. What Comes Next?
Asia Market Wrap - Japanese Markets Closed
US stock futures dipped on Monday after Federal Reserve Chair Jerome Powell announced that the Trump administration is threatening him with a criminal investigation, sparking fears about the central bank's independence.
S&P 500 futures dropped 0.6% after Powell disclosed that the Justice Department is demanding records regarding renovations to the Fed’s offices. This legal pressure marks a serious escalation in President Trump's ongoing dispute with Powell over interest rates, as the President pushes for deeper cuts and has even discussed firing the Fed Chair.
Conversely, Asian stock markets rose, driven by tech stocks, as investors were reassured by data showing the US labor market is slowing down but not falling apart. Please note that Japanese markets were closed for a holiday.
European Session - European Shares Slip
European shares dropped on Monday as political clashes in the US made market participants nervous.
The STOXX 600 index fell 0.2%, largely because bank stocks tumbled 1.1%. This decline was driven by President Trump's recent proposal to cap credit card interest rates at 10% for one year, which caused shares of Barclays to fall 4.5% and HSBC to dip 1%.
Market anxiety also rose after the Trump administration threatened to indict Federal Reserve Chair Jerome Powell..
In other news, AstraZeneca shares fell slightly after the company was removed from the Nasdaq-100 index, while the French biotech firm Abivax surged nearly 23% after its CEO spoke optimistically about the potential of their new experimental drug.
On the FX front, the US dollar dropped sharply on Monday, ending a five-day winning streak as political turmoil in the US prompted investors to sell American assets.
The currency fell nearly 0.4% against a basket of major rivals.
The Swiss franc was the strongest performer, rising more than 0.5% against the dollar, while the Euro climbed 0.44% to mark its best day in a month.
The dollar also weakened slightly against the Japanese Yen and the Chinese Yuan, with the exchange rate for the Yuan dropping to its lowest level in a week.
Currency Power Balance
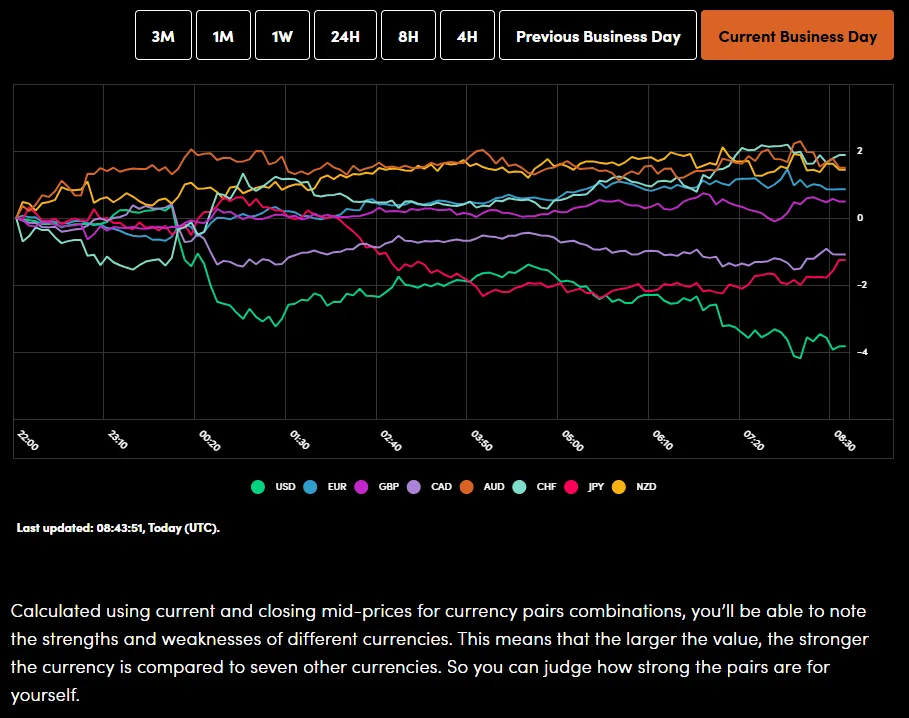
Source: OANDA Labs
Gold prices broke through the $4,600 barrier for the first time on Monday, setting a new record alongside silver as investors rushed to buy safe assets.
This surge is largely driven by the escalating conflict between President Trump and the Federal Reserve, which has made traders nervous about financial stability.
Gold jumped 1.7% to trade around $4,585, after briefly peaking at $4,600.33 earlier in the day.
Silver performed even better, climbing over 5% to roughly $84 per ounce, following its own all-time high of $84.60.
Economic Calendar and Final Thoughts
Data is largely thin today with markets likely to focus on developments in the renewed Trump-Fed spat which could dominate and drive market sentiment in the early part of the week.
The risk of the dollar dropping significantly is high if there are more signs that the government is trying to control the Federal Reserve. To understand where things are heading, market participants should watch the bond market closely. If bond traders start betting on more interest rate cuts (short-term) or start worrying about the Fed's independence (long-term), the dollar could fall.
Specifically, if the difference between short-term and long-term bond yields grows sharply (a "steepening curve"), it would likely signal a drop in the dollar's value.
Another event that was expected to help the dollar this week is the Supreme Court's ruling on President Trump's tariffs, which could happen between Tuesday and Thursday. Market participants generally expect the court to rule against the tariffs.
However, right now, the market is too nervous about the fight between the White House and the Fed to buy dollars comfortably. Before market participants feel safe buying again, they need clarity on this political conflict.
If we end up with a mix of high inflation and a politically weakened Fed, it could cause serious concerns about the economy and lead to a major crash in the dollar's value as the week progresses.
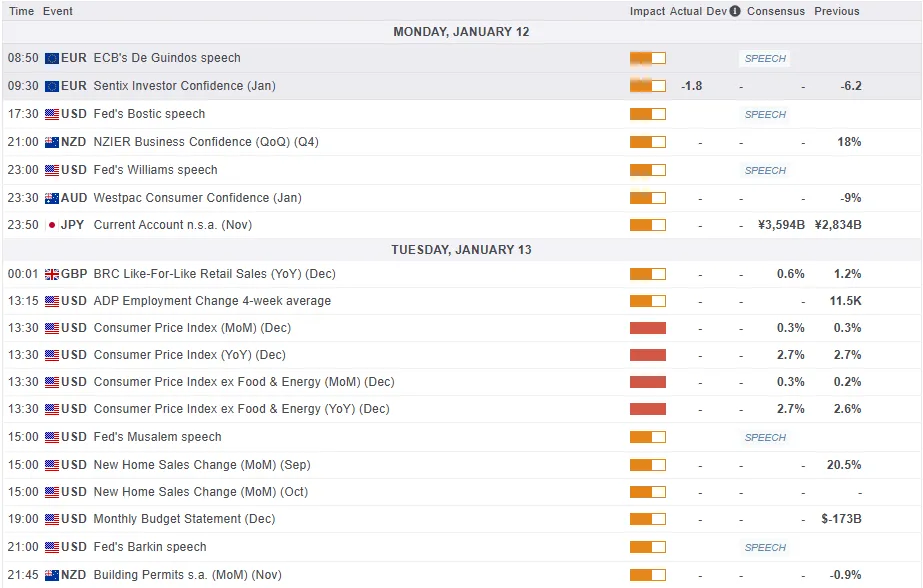
For all market-moving economic releases and events, see the MarketPulse Economic Calendar. (click to enlarge)
Chart of the Day - FTSE 100
From a technical perspective, the FTSE 100 index has finally breached the psychological 10000 mark.
Price has pulled back since with bouts of volatility and that shouldn't be a surprise. When price breaches such psychological levels we do tend to see some volatile price swings.
The main concerns for bulls at the moment is that the index appears as though we have printed a double-top pattern on the four-hour timeframe as well, a sign that a potential pullback could materialize.
Immediate support which may be tested in the near-term include the 9973 and 9943 handles respectively.
However, a key level on the four-hour chart for bullish continuation will be the psychological 10000 mark. A break of this level could bring a deeper correction into play.
FTSE 100 Index Four-Hour Chart, January 12, 2026
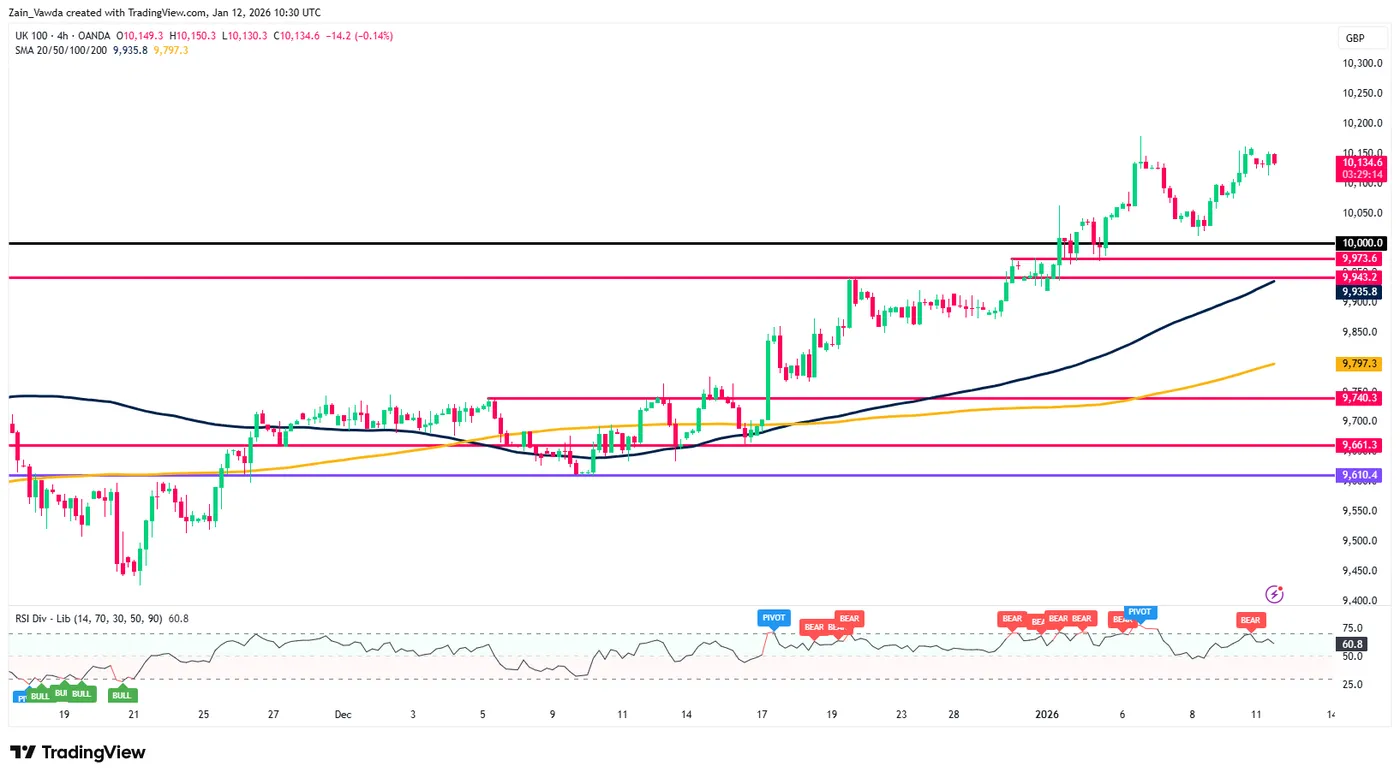
Source: TradingView.com (click to enlarge)