Sample Category Title
Dollar Index (DXY) Turns Lower
Capital flows into gold amid rising geopolitical and broader market risks, together with Jerome Powell’s remarks about potential criminal prosecution, have not only driven XAU/USD to record highs (as discussed earlier today) but have also put pressure on the US Dollar Index (DXY).
Markets are also digesting the latest Non-Farm Payrolls data released on Friday. The figures pointed to a slowdown in the US economy, with actual job growth at 50K versus expectations of 66K. This reinforces the case for interest-rate cuts and acts as a bearish factor for the US dollar.
As a result, the dollar index is moving lower today.
Technical Analysis of DXY
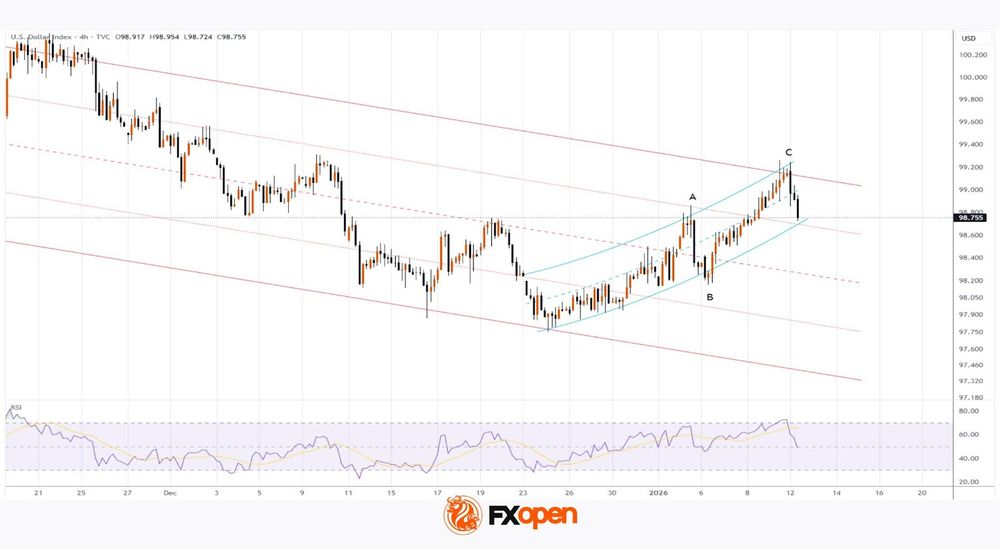
In the final days of 2025, when reviewing the DXY chart, we:
→ reaffirmed the descending channel (highlighted in red);
→ suggested that it would remain a key technical guide into early 2026.
This view has been confirmed, as the upper boundary of the channel is acting as strong resistance. Today’s decline appears to be a reversal from this level. In this context, it is reasonable to assume that:
→ the recent move represents an intermediate A–B–C corrective rise within a broader downtrend, with point C coinciding with RSI overbought conditions;
→ the short-term upward trajectory (marked by blue lines) may soon be broken by sellers. If the broader downtrend resumes, DXY could slide towards the median of the descending channel.
Trade global index CFDs with zero commission and tight spreads (additional fees may apply). Open your FXOpen account now or learn more about trading index CFDs with FXOpen.
This article represents the opinion of the Companies operating under the FXOpen brand only. It is not to be construed as an offer, solicitation, or recommendation with respect to products and services provided by the Companies operating under the FXOpen brand, nor is it to be considered financial advice.
Crypto: Sell-the-Growth Continues
Market Overview
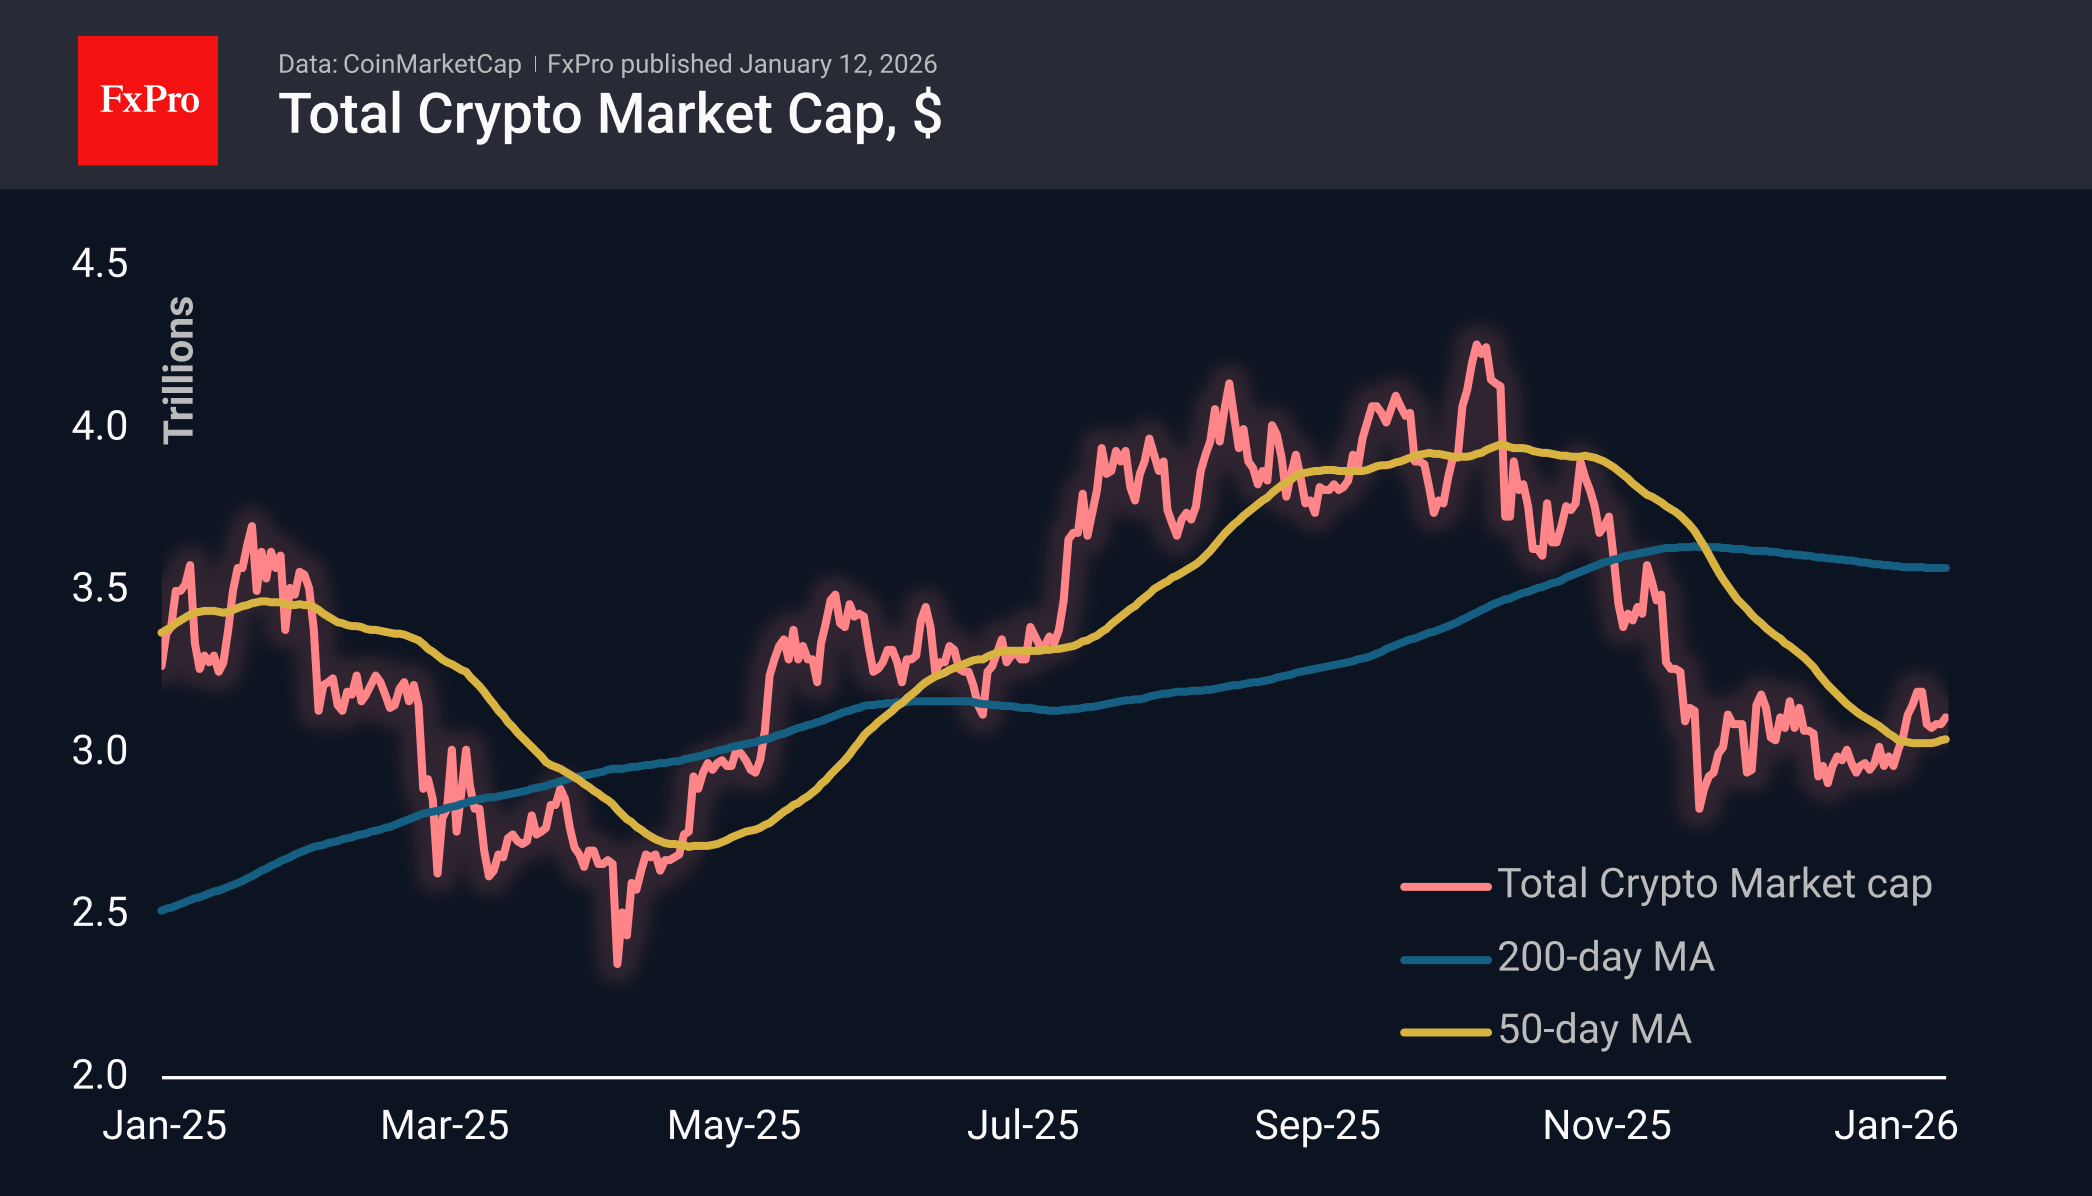
The crypto market capitalisation grew by 1% over the past day and is down 1% from a week ago. Bitcoin received a boost from reports of a criminal investigation against the head of the Federal Reserve, which created momentum for a flight from US assets. In our view, this precedent is negative for risk appetite.
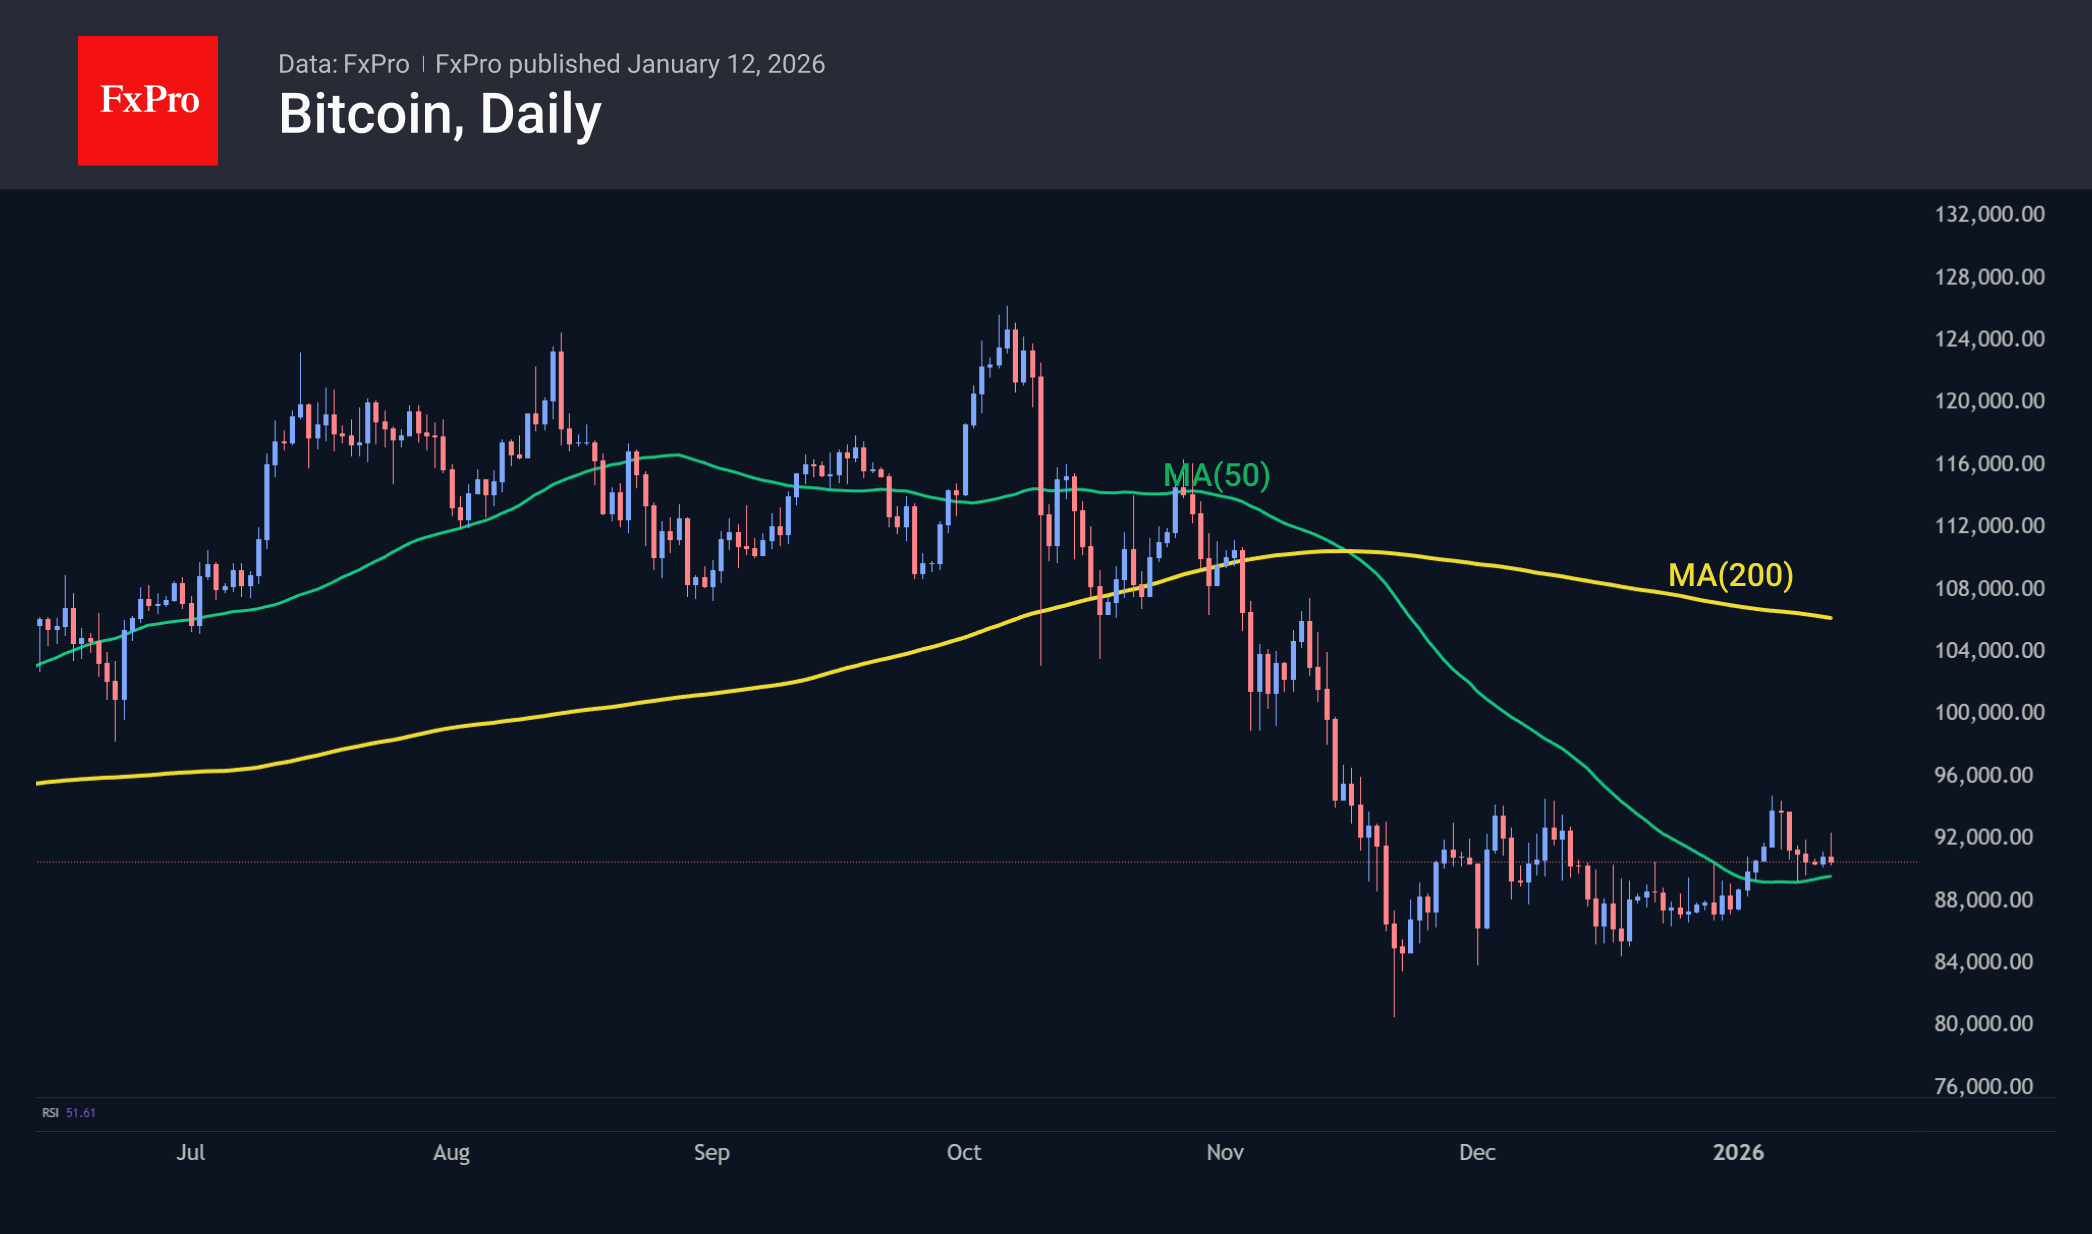
Bitcoin jumped to $92,500 but saw a significant influx of sellers, returning to $90,300 at the time of writing. Testing of the 50-day moving average as support continues. A slip below $90K could have a strong psychological effect, quickly taking the price to $87K and then sending it lower below $80K.
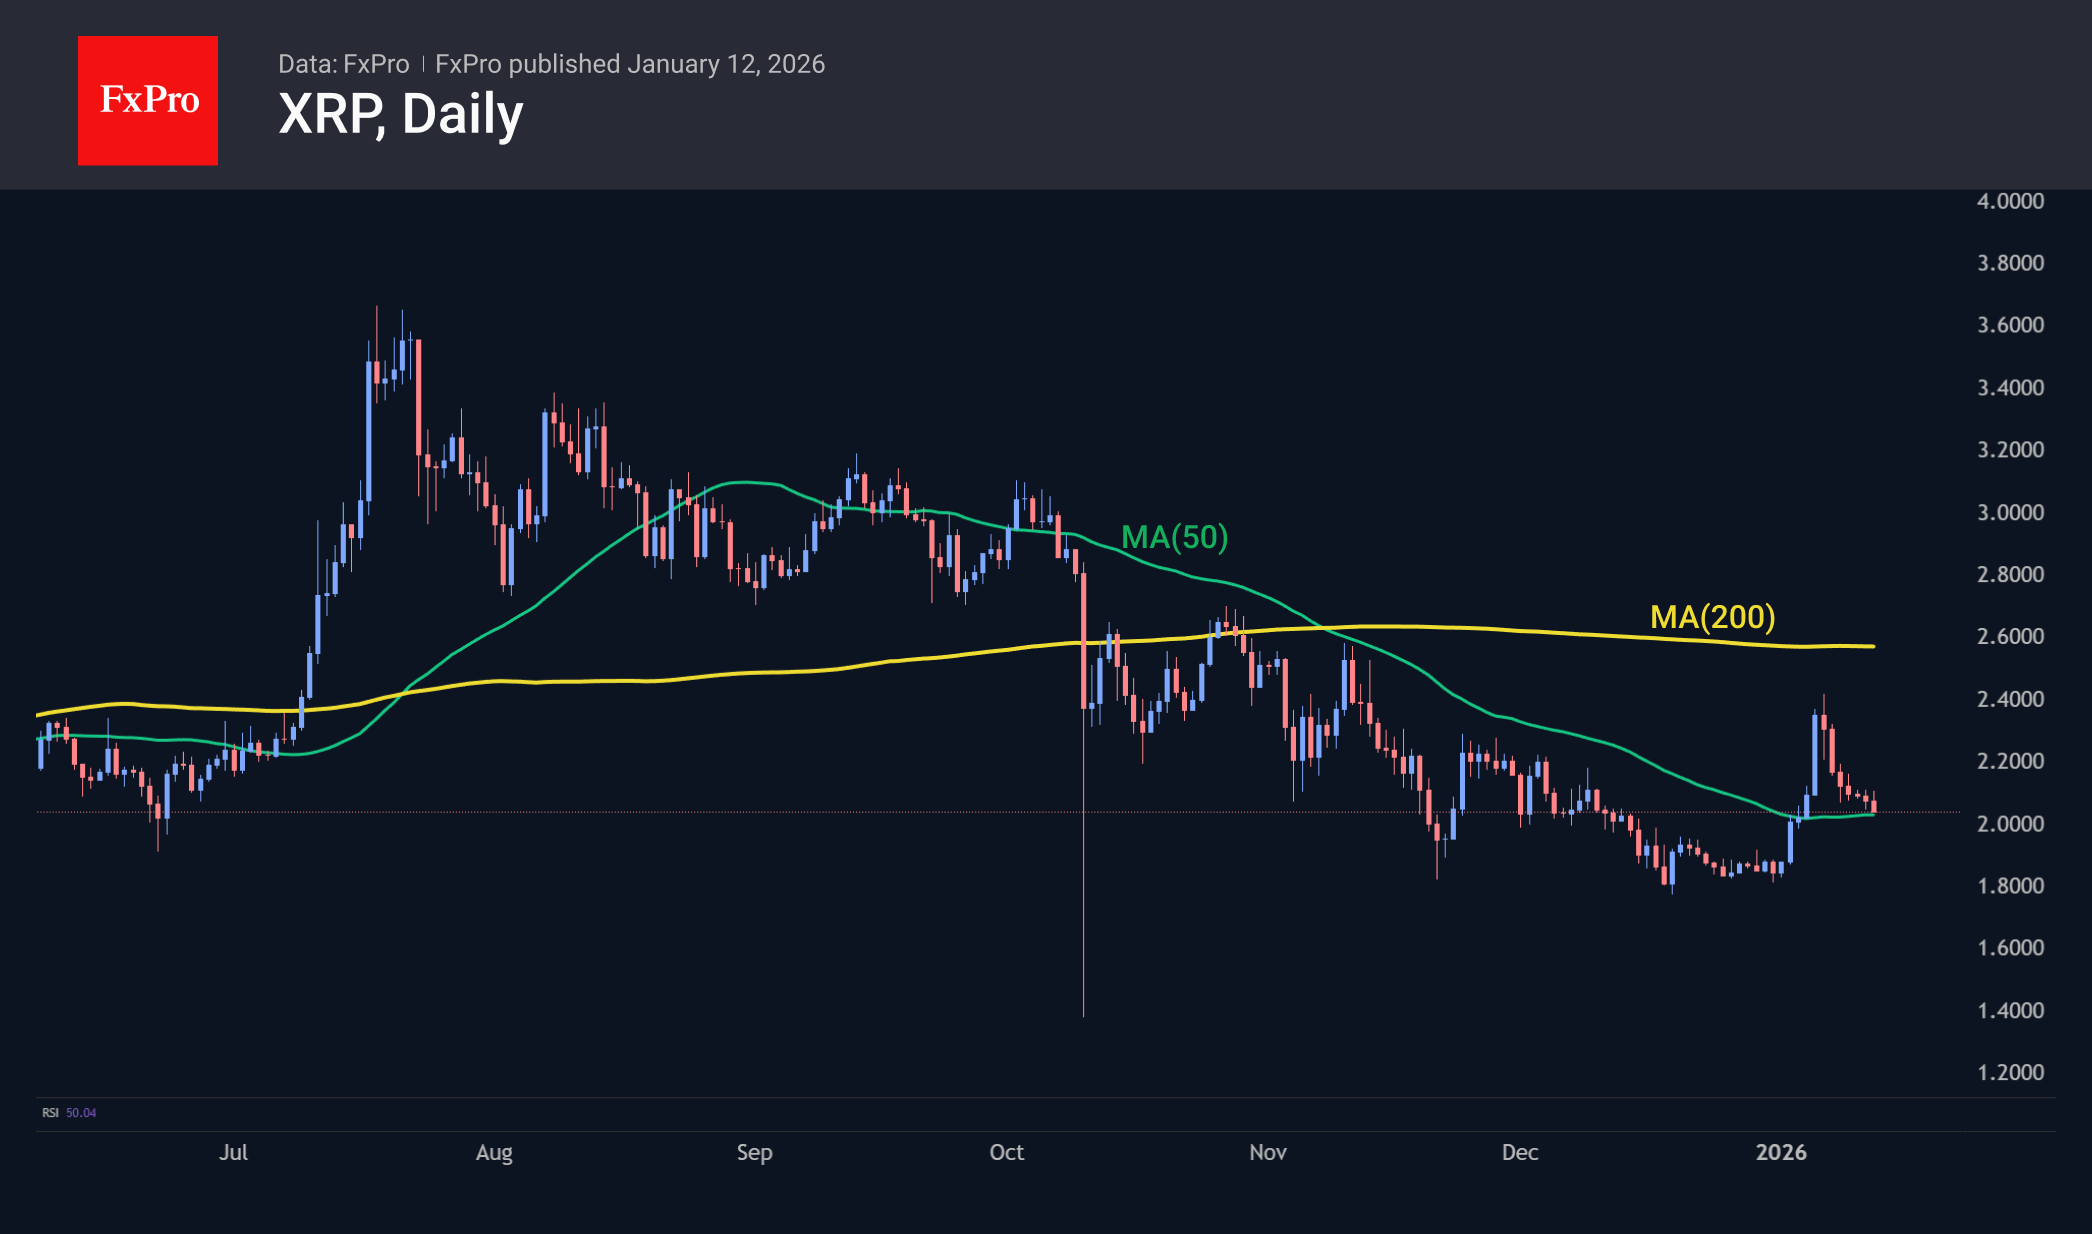
XRP is losing for the seventh day in a row, like Bitcoin, rolling back to the 50-day MA and close to the round level of $2.0. The coin is still up 10% since the beginning of the year, but the initial momentum has clearly lost steam, as there are too many people in the markets willing to sell on the rise. Most likely, this change in strategy for all
XRP has fallen for the seventh day in a row, once again finding itself on the verge of $2.0.
News Background
The total open interest in Bitcoin derivatives has fallen to its lowest level since the end of 2022, according to CryptoQuant. Historically, reaching such levels has preceded periods of consolidation or even bullish reversals.
Bitcoin could reach $2.9 million by 2050 in a base case scenario, according to VanEck’s forecast. This will happen if the first cryptocurrency becomes a currency for international settlements and enters the reserves of central banks. The main obstacle to mass adoption remains the scalability of the network. VanEck emphasised the importance of developing second-level solutions that will speed up transactions and reduce commissions.
Monero (XMR) is regaining its status as the leading anonymous coin amid the crisis in the Zcash ecosystem following the departure of its development team. The asset has been growing steadily for several weeks, outperforming most of its competitors in the sector.
There are more and more signs in the crypto market pointing to the end of the sell-off. Among them are the stabilisation of outflows from ETFs, the situation with perpetual futures and positions on the CME, according to JPMorgan.
MSCI’s decision on 6 January regarding companies accumulating cryptocurrencies is also favourable for cryptocurrencies. The global provider of stock indices has decided not to exclude them from its indices during the review in February 2026.
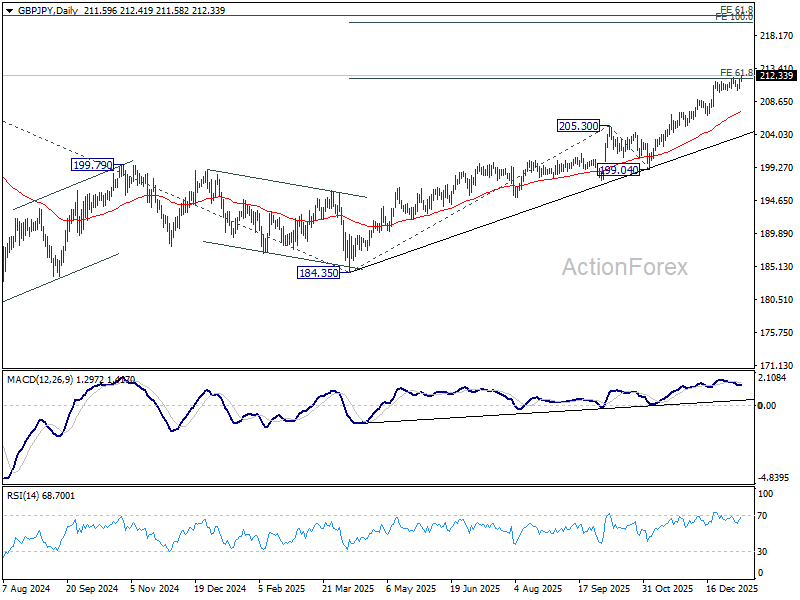
GBP/JPY Daily Outlook
Daily Pivots: (S1) 210.72; (P) 211.39; (R1) 212.36; More...
GBP/JPY's rally resumed by breaking 212.13 temporary top and intraday bias is back on the upside. Sustained trading above 61.8% projection of 184.35 to 205.30 from 199.04 at 211.98 will extend current up trend to 100% projection at 219.99 next. For now, outlook will stay bullish as long as 210.28 support holds, in case of retreat.
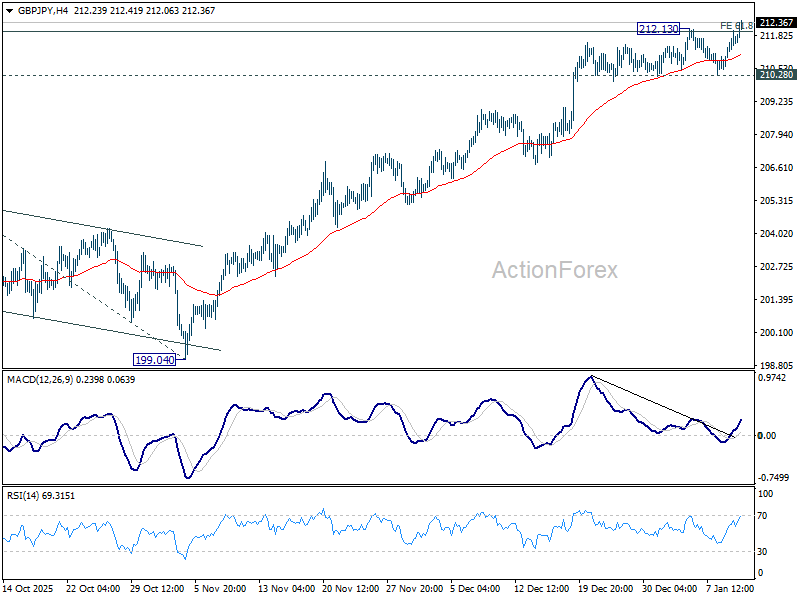
In the bigger picture, up trend from 123.94 (2020 low) is in progress. Next target is 61.8% projection of 148.93 (2022 low) to 208.09 (2024 high) from 184.35 at 220.90. On the downside, break of 205.30 resistance turned support is needed to indicate medium term topping. Otherwise, outlook will stay bullish even in case of deep pullback.
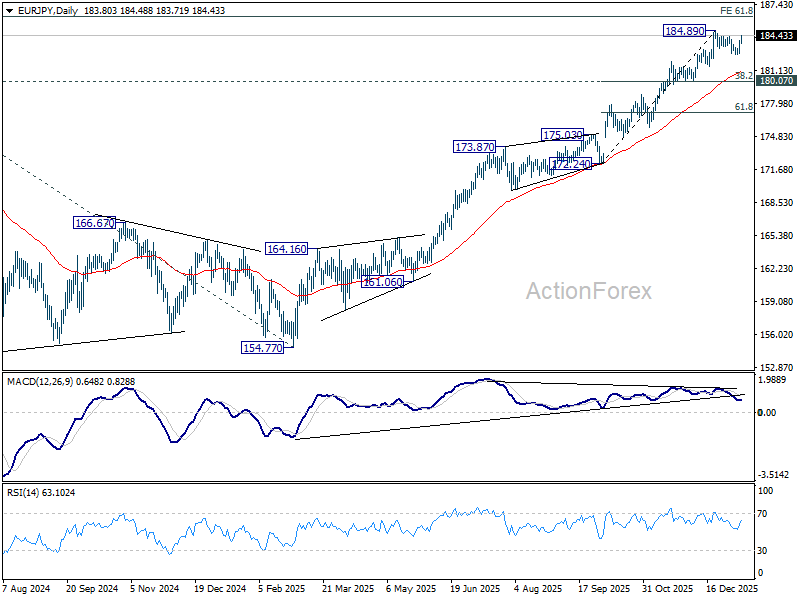
EUR/JPY Daily Outlook
Daily Pivots: (S1) 182.87; (P) 183.42; (R1) 184.29; More...
EUR/JPY is still bounded in range below 184.89 despite extended recovery. Intraday bias stays neutral for the moment. On the downside, below 182.60 will extend the correction from 184.89 to 55 D EMA (now at 180.92) and below . But strong support should emerge from 180.07 cluster (38.2% retracement of 172.24 to 184.89 at 180.05) to bring rebound. On the upside, firm break of 184.89 will resume larger up trend to 186.31 fibonacci level.

In the bigger picture, up trend from 114.42 (2020 low) is in progress and should target 61.8% projection of 124.37 to 175.41 from 154.77 at 186.31. Considering bearish divergence condition in D MACD, upside could be capped by 186.31 on first attempt. Still, outlook will stay bullish as long as 55 W EMA (now at 172.18) holds, even in case of deep pullback. Sustained break of 186.31 will pave the way to 100% projection at 205.81 next.
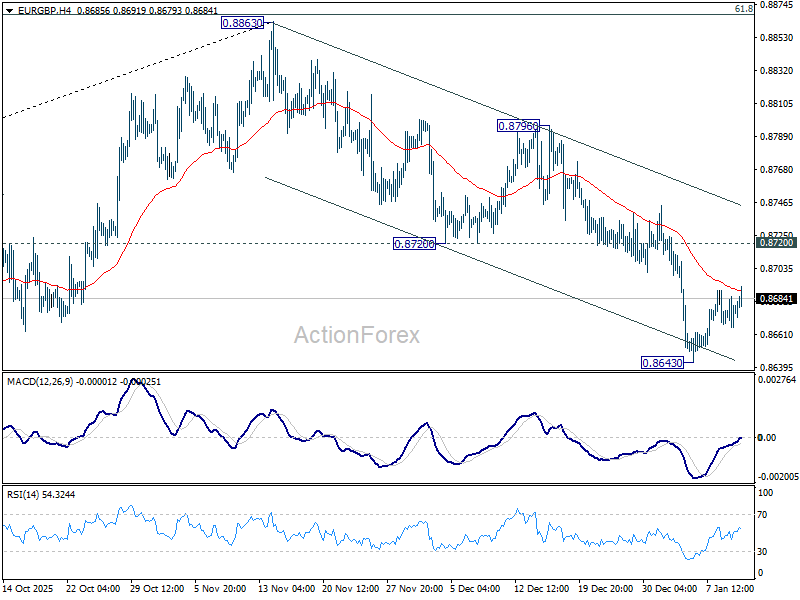
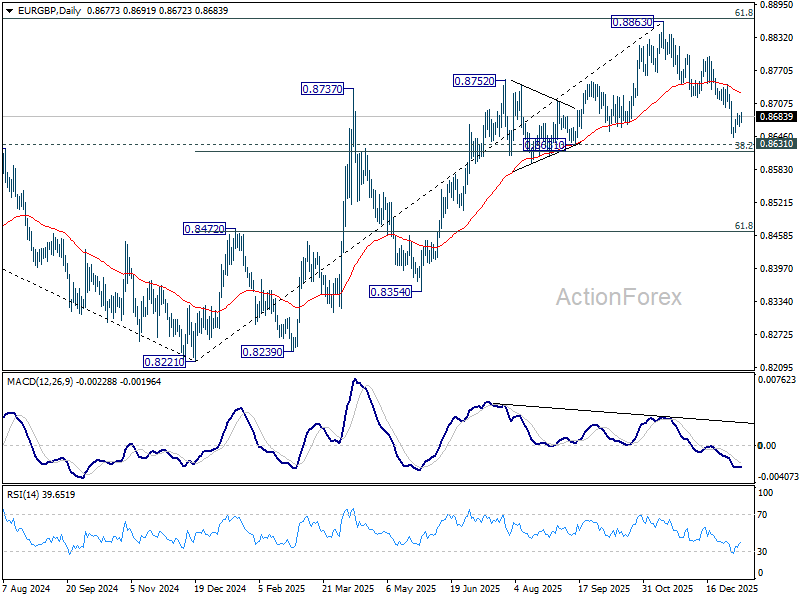
EUR/GBP Daily Outlook
Daily Pivots: (S1) 0.8670; (P) 0.8678; (R1) 0.8690; More…
Intraday bias in EUR/GBP stays neutral for the moment, and risk stays on the downside as long as 0.8720 support turned resistance holds. On the downside, decisive break of 0.8631 cluster support (38.2% retracement of 0.8221 to 0.8663 at 0.8618) will pave the way to 61.8% retracement at 0.8466. Nevertheless, sustained break of 0.8720 will bring stronger rally back to 0.8796 resistance instead.
In the bigger picture, rise from 0.8221 medium term bottom (2024 low) is seen as a corrective move. Upside should be limited by 61.8% retracement of 0.9267 to 0.8221 at 0.8867. Sustained trading below 55 W EMA (now at 0.8622) should confirm that this corrective bounce has completed. In this case, deeper fall would be seen back to 0.8201/21 key support zone. However, decisive break of 0.8867 will suggest that EUR/GBP is already reversing whole decline from 0.9267 (2022 high). That should pave the way back to 0.9267.
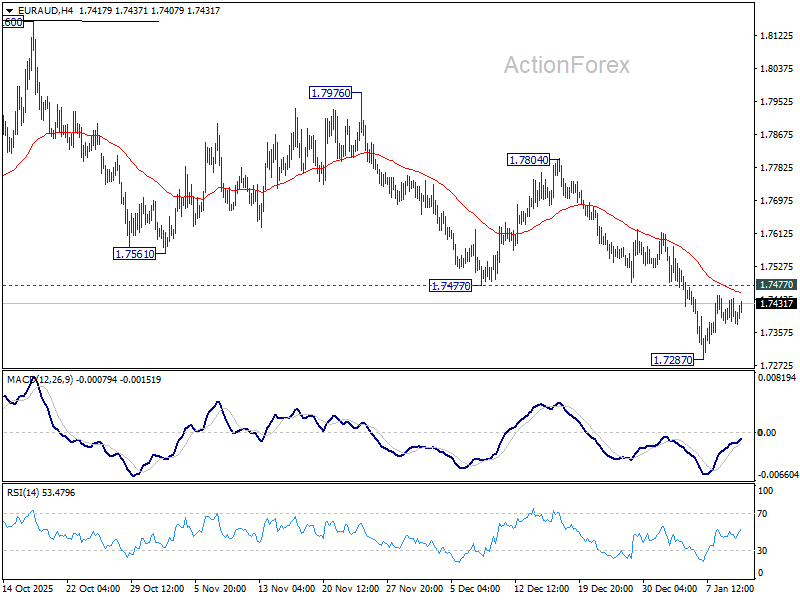
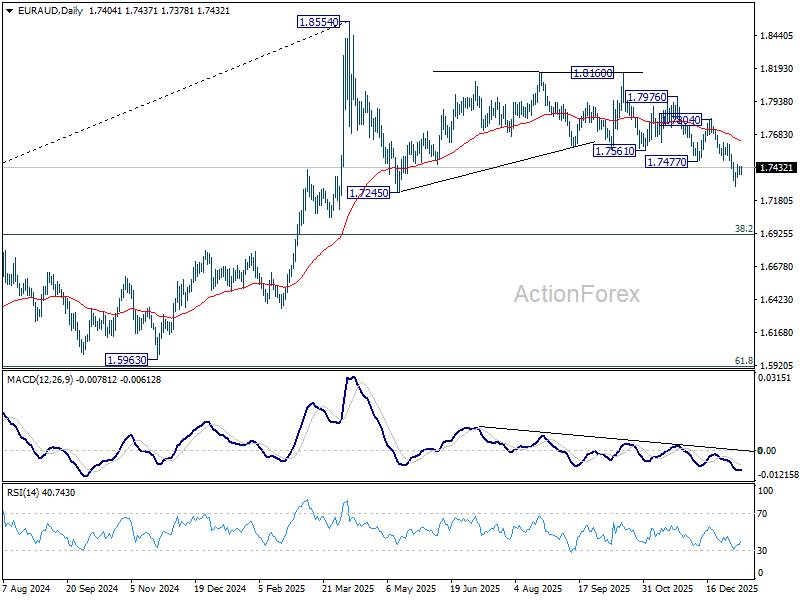
EUR/AUD Daily Outlook
Daily Pivots: (S1) 1.7374; (P) 1.7410; (R1) 1.7430; More...
Intraday bias in EUR/AUD remains neutral for the moment. Risk will stay on the downside as long as 1.7477 support turned resistance holds. Current decline is seen as the third leg of the corrective pattern from 1.8554. Below 1.7287 will target 1.7245 support, and then 1.6922 fibonacci level. Nevertheless, firm break of 1.7477 will indicate short term bottoming, and bring stronger rebound back to 55 D EMA (now at 1.7636).
In the bigger picture, the break of 55 W EMA (now at 1.7468) argues that fall from 1.8554 medium term top is already correcting whole up trend from 1.4281 (2022 low). Deeper decline is in favor to 38.2% retracement of 1.4281 to 1.8554 at 1.6922, and possibly below. Risk will stay on the downside as long as 1.8160 resistance holds, in case of strong rebound.
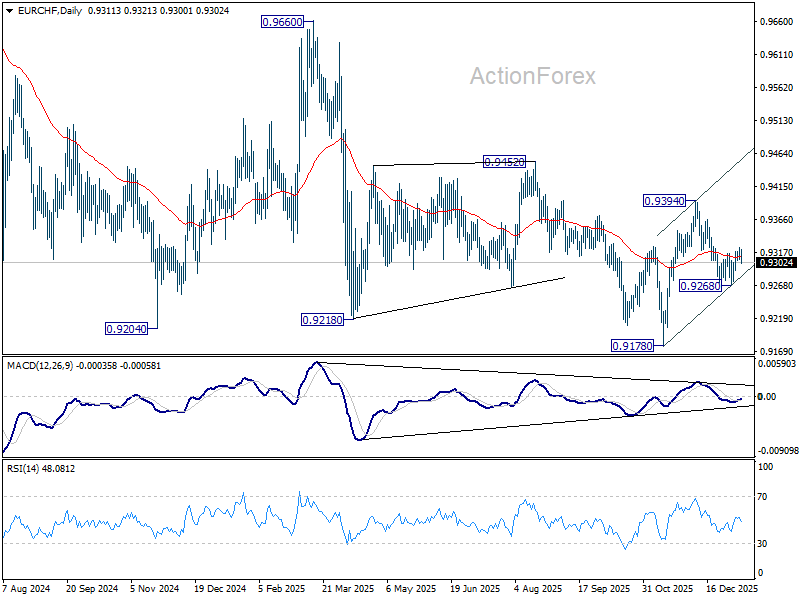
EUR/CHF Daily Outlook
Daily Pivots: (S1) 0.9311; (P) 0.9319; (R1) 0.9329; More....
Intraday bias in EUR/CHF is turned neutral again with current retreat. On the downside, break of 0.9268 support will revive near term bearishness. Fall from 0.9394 should resume to retest 0.9178 low. Nevertheless, break of 0.9324 will extend the rebound form 0.9268 to 0.9394 resistance instead.
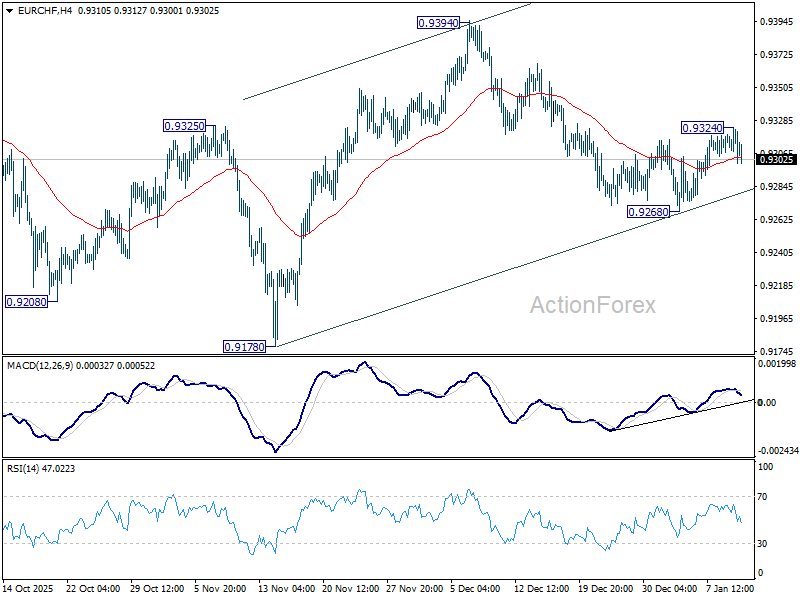
In the bigger picture, persistent bullish convergence condition in W MACD is a medium term bullish sign. Firm break of 0.9394 resistance should bring sustained trading above 55 W EMA (now at 0.9362). That should indicate medium term bottoming at 0.9178. Further break of 0.9452 resistance will bring stronger medium term rally towards 0.9928 resistance next, even still as a corrective bounce. Nevertheless, rejection by 55 W EMA will retain bearishness for another fall through 0.9178 at a later stage.
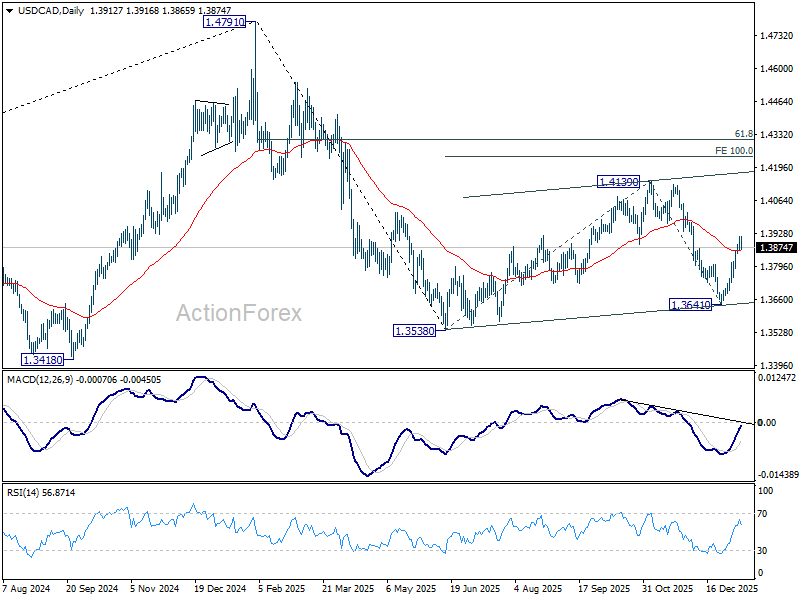
USD/CAD Daily Outlook
Daily Pivots: (S1) 1.3879; (P) 1.3899; (R1) 1.3937; More...
A temporary top is formed at 1.3917 with current retreat, and intraday bias is turned neutral in USD/CAD. Further rise is expected as long as 1.3789 minor support holds. Rise from 1.3641 is seen as the third leg of the corrective pattern from 1.3538. Above 1.3917 will target 1.4139 first. Break there will target 100% projection of 1.3538 to 1.4139 from 1.3641 at 1.4242.
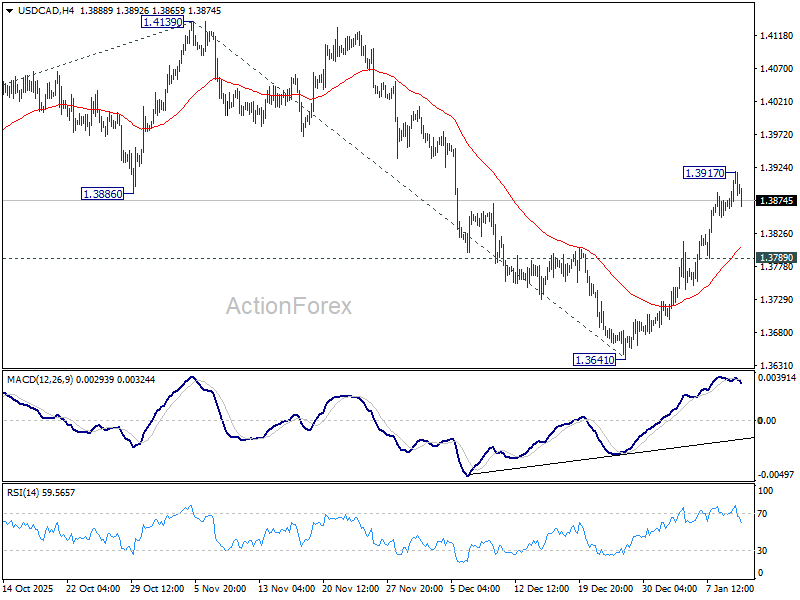
In the bigger picture, price actions from 1.4791 are seen as a corrective pattern to the whole up trend from 1.2005 (2021 low). Deeper fall could be seen as the pattern extends, and break of 1.3538 will target 61.8% retracement of 1.2005 to 1.4791 at 1.3069. For now, medium term outlook will be neutral until there are signs that the correction has completed.
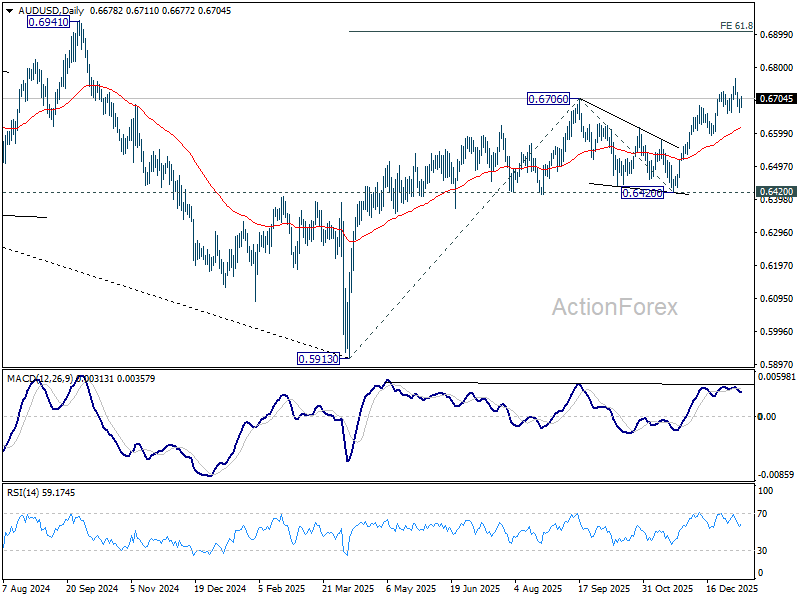
AUD/USD Daily Report
Daily Pivots: (S1) 0.6666; (P) 0.6685; (R1) 0.6706; More...
Intraday bias in AUD/USD remains neutral as consolidations continues below 0.6765. Further rally is in favor with 0.6659 support intact. On the upside, break of 0.6765 will resume the whole rise from 0.5913 and target 61.8% projection of 0.5913 to 0.6706 from 0.6420 at 0.6910. However, considering bearish divergence condition in 4H MACD, firm break of 0.6659 will confirm short term topping, and bring deeper correction back towards 0.6592 support.
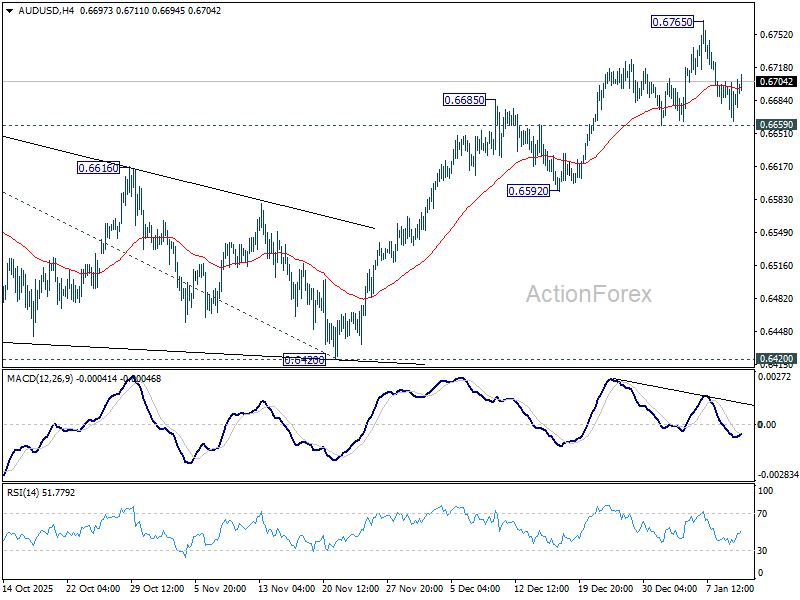
In the bigger picture, current development argues that rise form 0.5913 (2024 low) is reversing whole down trend from 0.8006 (2021 high). Further rally should be seen to 61.8% retracement of 0.8006 to 0.5913 at 0.7206. This will remain the favored case as long as 0.6420 support holds.
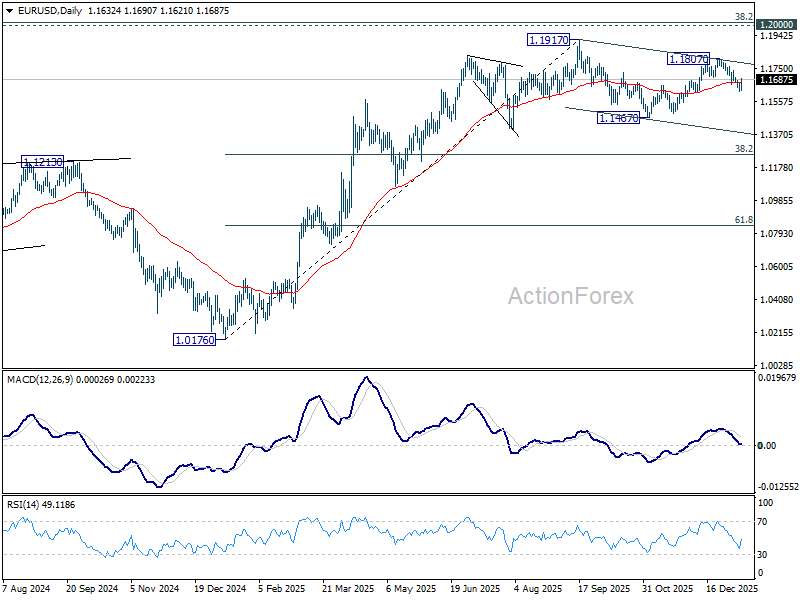
EUR/USD Daily Outlook
Daily Pivots: (S1) 1.1615; (P) 1.1639; (R1) 1.1661; More….
Intraday bias in EUR/USD is turned neutral with current recovery. On the upside, break of 1.1807 will resume the rally from 1.1467 to retest 1.1917 high. On the downside, below 1.1617 will target 1.1467 support. Overall, price actions from 1.1917 are seen as a corrective pattern that might extend further.
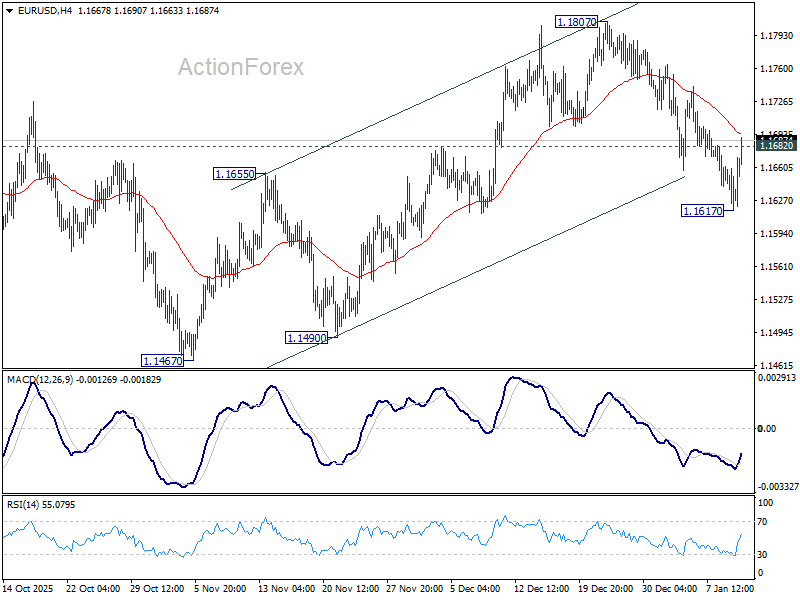
In the bigger picture, as long as 55 W EMA (now at 1.1416) holds, up trend from 0.9534 (2022 low) is still in favor to continue. Decisive break of 1.2 key psychological level will carry larger bullish implication. However, sustained trading below 55 W EMA will argue that rise from 0.9534 has completed as a three wave corrective bounce, and keep long term outlook bearish.