Sample Category Title
AUD/USD Under Bearish Pressure
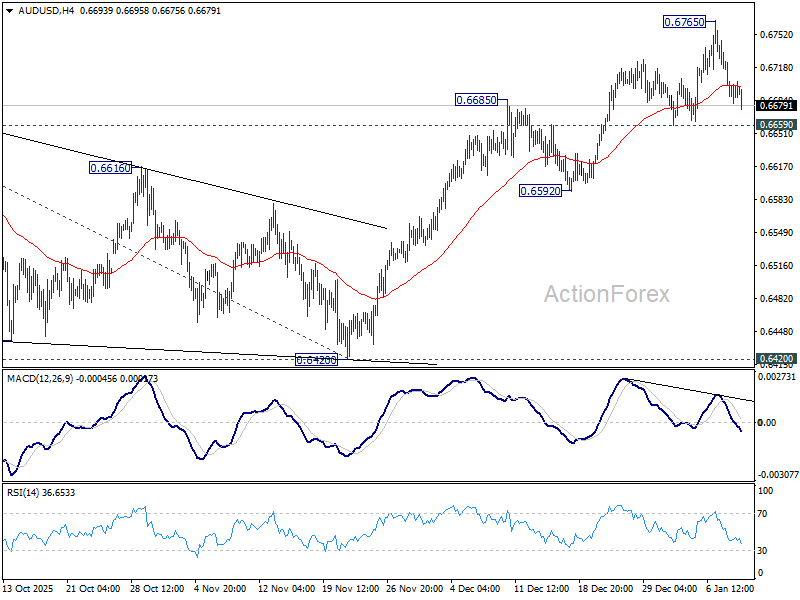
As indicated by the AUD/USD chart, the Australian dollar has fallen below the 0.6680 level today, with the decline from Wednesday’s high (A) exceeding 1.1%.
Key bearish drivers include:
→ Declining inflation expectations. Data released on Wednesday showed a sharp slowdown in Australian inflation to 3.4%. This has removed the likelihood of a February rate hike by the Reserve Bank of Australia, which had previously maintained a hawkish stance.
→ Uncertainty surrounding China. The economy of Australia’s main trading partner is failing to deliver the expected strong growth, with today’s PMI data coming in mixed. This raises doubts about Chinese demand for Australian commodities and weighs on the AUD, which is often viewed as a proxy for the Chinese economy.
→ NFP-related risk aversion. Ahead of today’s US labour market report, investors are shifting into risk-reduction mode and increasing demand for so-called safe-haven US dollars amid concerns over potential negative surprises.
Technical Analysis of AUD/USD
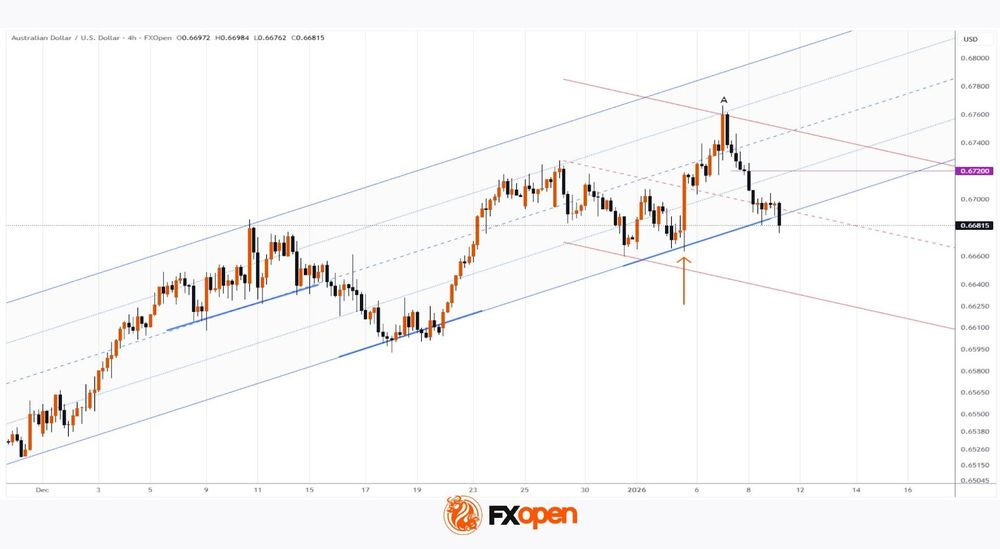
On 26 December, we drew an ascending channel, which remained in place at the start of 2026. However, the following developments should be noted:
→ the current downward move represents a bearish breakout below the lower boundary of the channel;
→ the bullish impulse that began on 5 January (marked by the arrow) has been fully neutralised.
These signals point to a meaningful shift in market sentiment, clearly reflected in price action. Should bulls attempt to bring AUD/USD back within the ascending channel, resistance might emerge near 0.6720, where the sharp sell-off began on 8 January, highlighting the dominance of sellers.
The release of high-impact news could fuel further downside momentum, opening the way for the continuation of the descending trajectory (highlighted in red).
Trade over 50 forex markets 24 hours a day with FXOpen. Take advantage of low commissions, deep liquidity, and spreads from 0.0 pips (additional fees may apply). Open your FXOpen account now or learn more about trading forex with FXOpen.
This article represents the opinion of the Companies operating under the FXOpen brand only. It is not to be construed as an offer, solicitation, or recommendation with respect to products and services provided by the Companies operating under the FXOpen brand, nor is it to be considered financial advice.
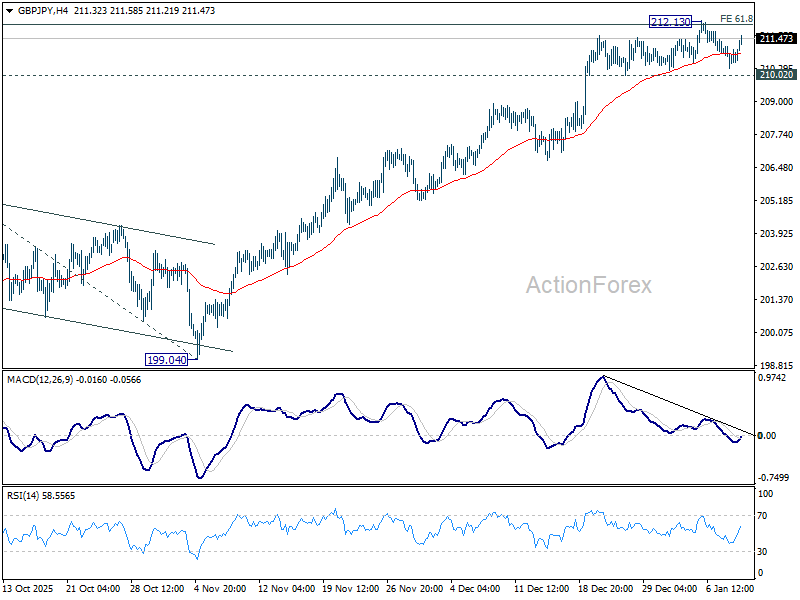
GBP/JPY Daily Outlook
Daily Pivots: (S1) 210.39; (P) 210.77; (R1) 211.24; More...
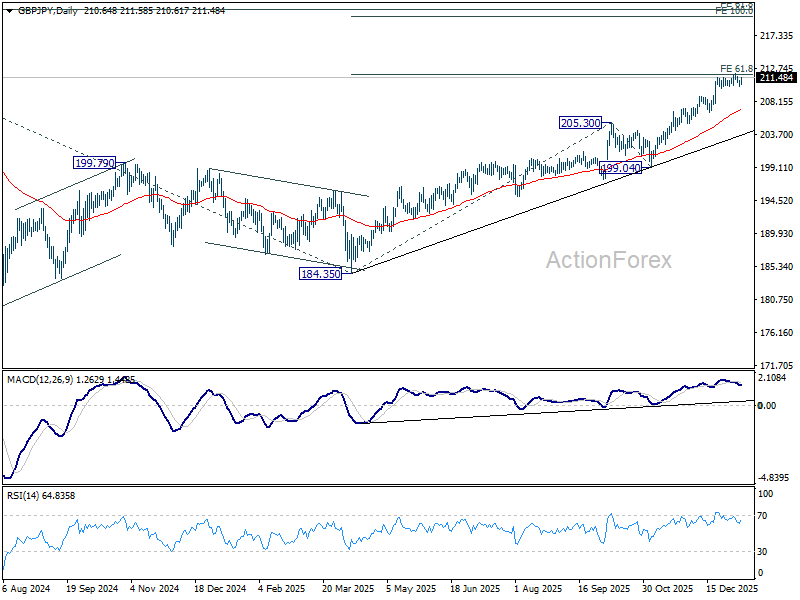
Intraday bias in GBP/JPY stays neutral at this point. Considering bearish divergence condition in 4H MACD, firm break of 210.02 support should confirm short term topping. Deeper decline would be seen to 55 D EMA (now at 207.19) as a correction. Nevertheless, sustained break of 61.8% projection of 184.35 to 205.30 from 199.04 at 211.98 will extend current up trend to 100% projection at 219.99 next.
In the bigger picture, up trend from 123.94 (2020 low) is in progress. Next target is 61.8% projection of 148.93 to 208.09 from 184.35 at 220.90. On the downside, break of 205.30 resistance turned support is needed to indicate medium term topping. Otherwise, outlook will stay bullish even in case of deep pullback.
EUR/JPY Daily Outlook
Daily Pivots: (S1) 182.61; (P) 182.93; (R1) 183.23; More...
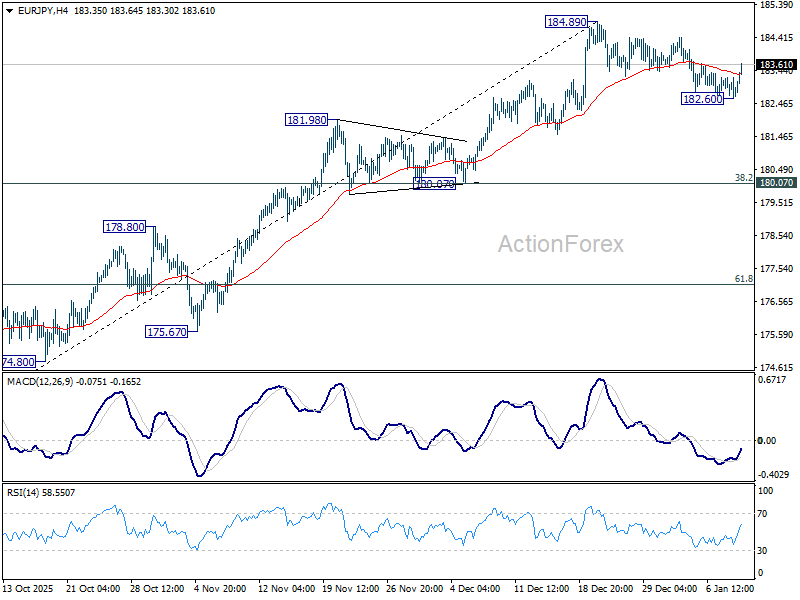
Intraday bias in EUR/JPY is turned neutral with current recovery. Price action from 184.89 is seen as a corrective pattern. Below 182.60 will target 55 D EMA (now at 180.82) and below . But strong support should emerge from 180.07 cluster (38.2% retracement of 172.24 to 184.89 at 180.05) to bring rebound. On the upside, firm break of 184.89 will resume larger up trend to 186.31 fibonacci level.
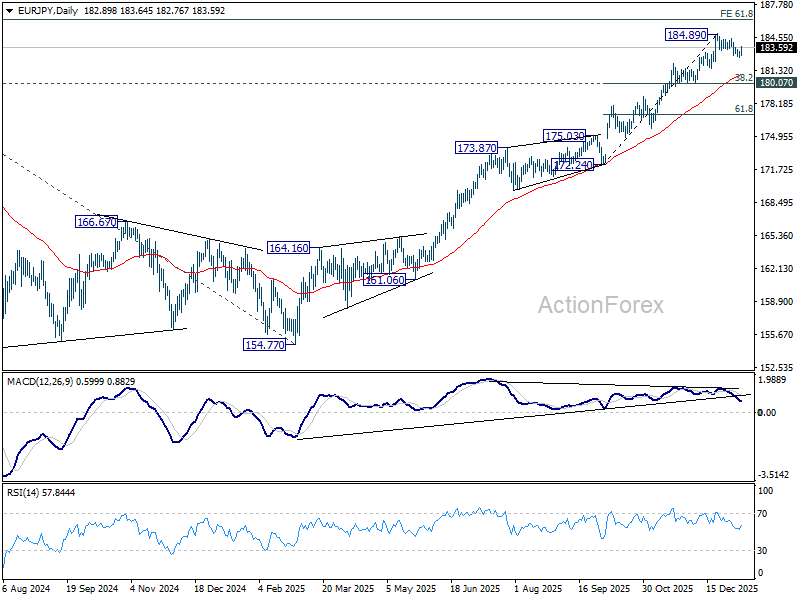
In the bigger picture, up trend from 114.42 (2020 low) is in progress and should target 61.8% projection of 124.37 to 175.41 from 154.77 at 186.31. Considering bearish divergence condition in D MACD, upside could be capped by 186.31 on first attempt. Still, outlook will stay bullish as long as 55 W EMA (now at 172.16) holds, even in case of deep pullback. Sustained break of 186.31 will pave the way to 100% projection at 205.81 next.
EUR/GBP Daily Outlook
Daily Pivots: (S1) 0.8666; (P) 0.8678; (R1) 0.8687; More…
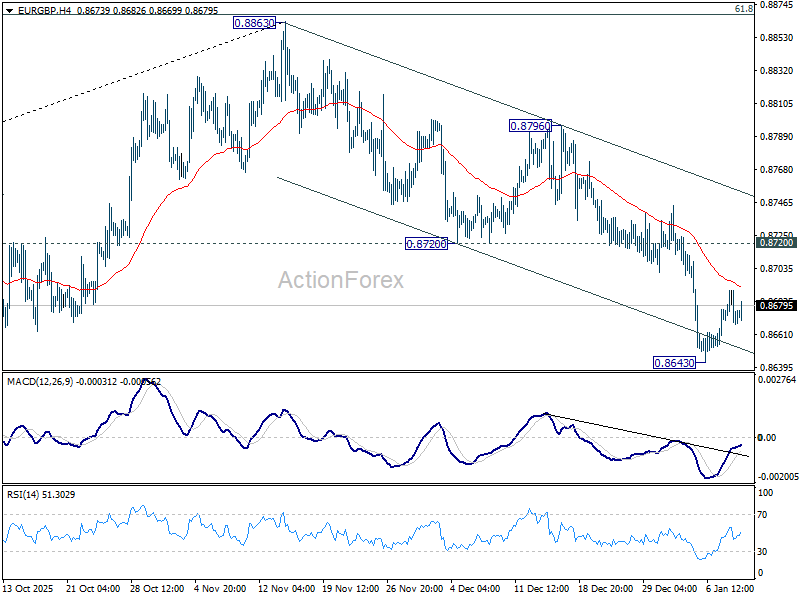
Intraday bias in EUR/GBP remains neutral for consolidations above 0.8643 temporary low. But further decline is expected as long as 0.8720 support turned resistance holds. On the downside, decisive break of 0.8631 cluster support (38.2% retracement of 0.8221 to 0.8663 at 0.8618) will carry larger bearish implications. Nevertheless, sustained break of 0.8720 will bring stronger rally back to 0.8796 resistance instead.
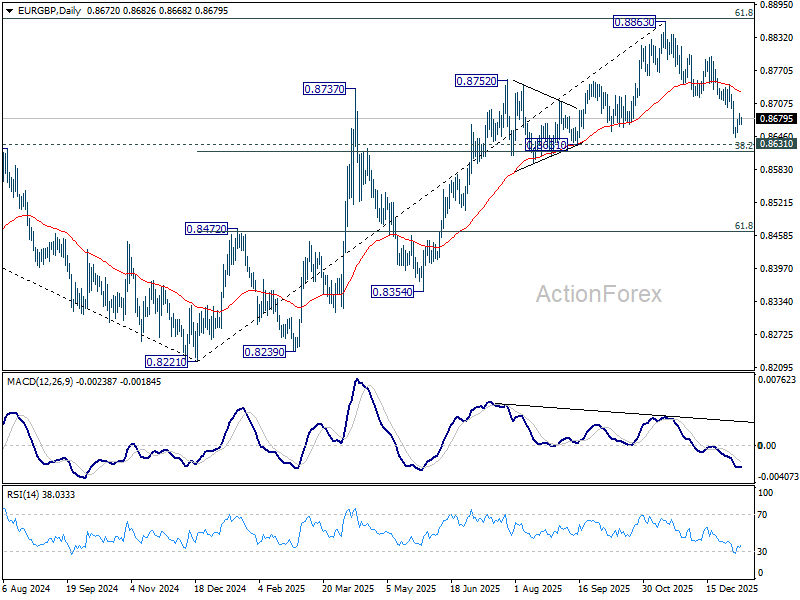
In the bigger picture, rise from 0.8221 medium term bottom is still seen as a corrective move. Upside should be limited by 61.8% retracement of 0.9267 to 0.8221 at 0.8867. Sustained trading below 55 W EMA (now at 0.8617) should confirm that this corrective bounce has completed. However, decisive break of 0.8867 will suggest that EUR/GBP is already reversing whole decline from 0.9267 (2022 high). That should pave the way back to 0.9267.
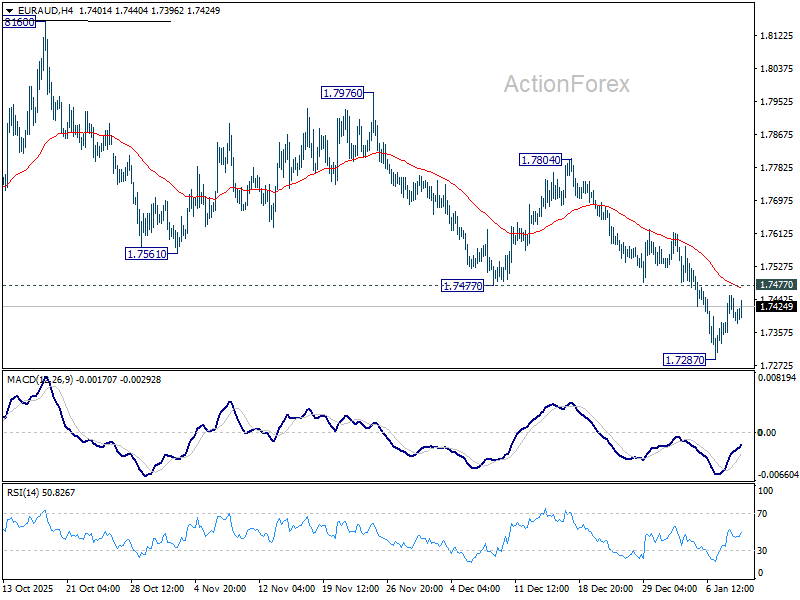
EUR/AUD Daily Outlook
Daily Pivots: (S1) 1.7356; (P) 1.7406; (R1) 1.7451; More...
Intraday bias in EUR/AUD remains neutral and more consolidations could be seen above 1.7287 temporary low. Further decline is expected as long as 1.7477 support turned resistance holds. Fall from 1.8160 is seen as the third leg of the pattern from 1.8554. Break of 1.7245 support will target 1.6922 fibonacci level. However, firm break of 1.7477 will turn bias back to the upside for stronger rebound.
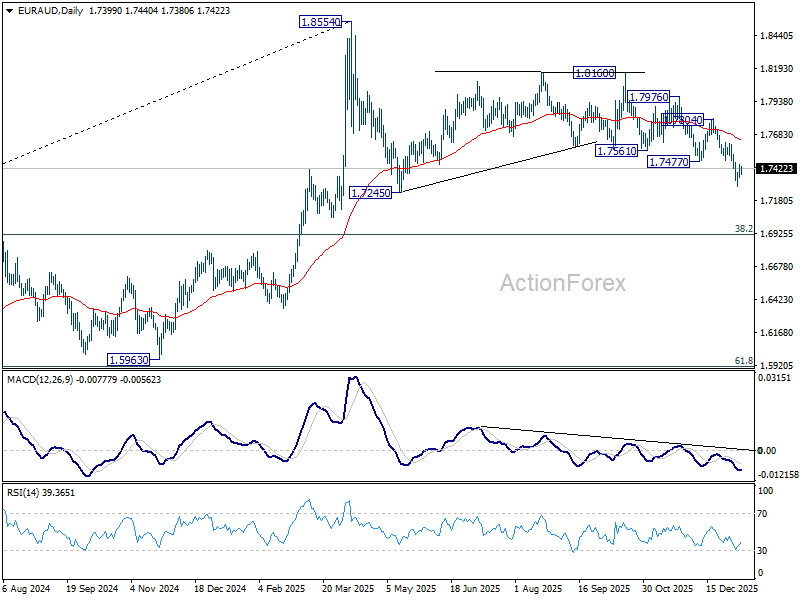
In the bigger picture, as long as 55 W EMA (now at 1.7472) holds, price actions from 1.8554 could still be a correction to rise from 1.5963 only. However, sustained break of the EMA will argue that it's already correcting the whole up trend from 1.4281 (2022 low). In this case, deeper decline would be seen to 38.2% retracement of 1.4281 to 1.8554 at 1.6922.
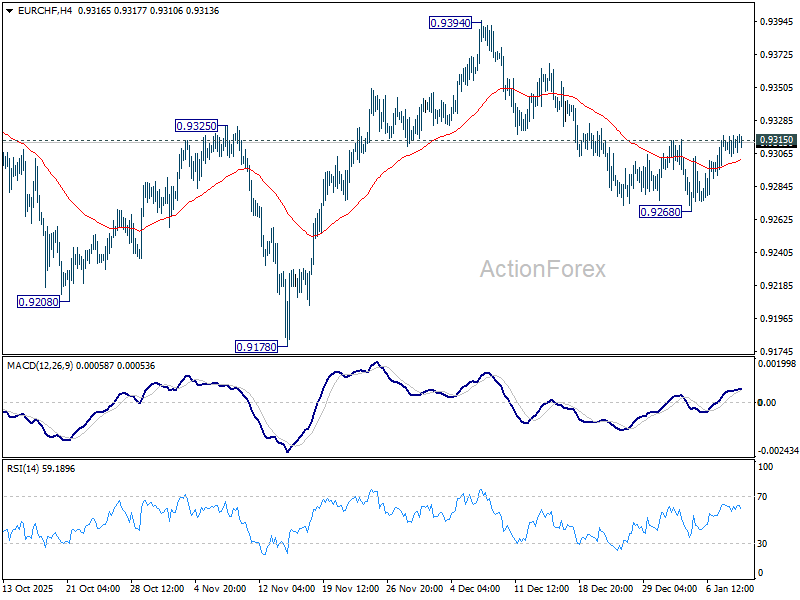
EUR/CHF Daily Outlook
Daily Pivots: (S1) 0.9307; (P) 0.9313; (R1) 0.9320; More....
Intraday bias in EUR/CHF stays neutral at this point, and immediate focus remains on 0.9315 resistance. Firm break there will argue that pullback from 0.9394 has completed at 0.9268 already. Intraday bias will then be back on the upside for retesting 0.9394. Nevertheless, rejection by 0.9315 will keep near term risk on the downside. Break of 0.9268 will resume the fall from 0.9394 to retest 0.9178 low.
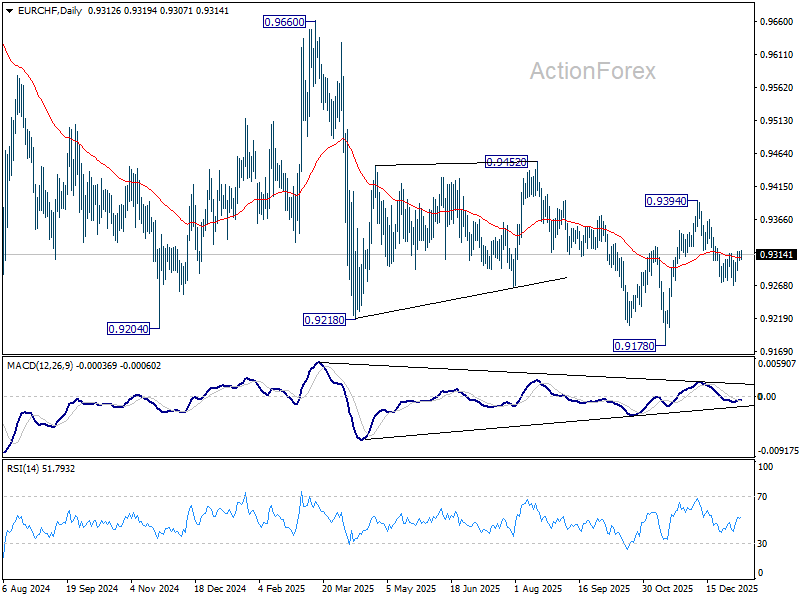
In the bigger picture, EUR/CHF has breached long term falling channel resistance as the rebound from 0.9278 extends. Considering bullish convergence condition in W MACD, sustained trading above 55 W EMA (now at 0.9366) will indicate medium term bottoming at 0.9178, and suggests that it's already in larger scale rebound. Further break of 0.9452 resistance will bring stronger medium term rally towards 0.9928 resistance next. Nevertheless, rejection by 55 W EMA will retain bearishness for another fall through 0.9178 at a later stage.
AUD/USD Daily Report
Daily Pivots: (S1) 0.6679; (P) 0.6702; (R1) 0.6723; More...
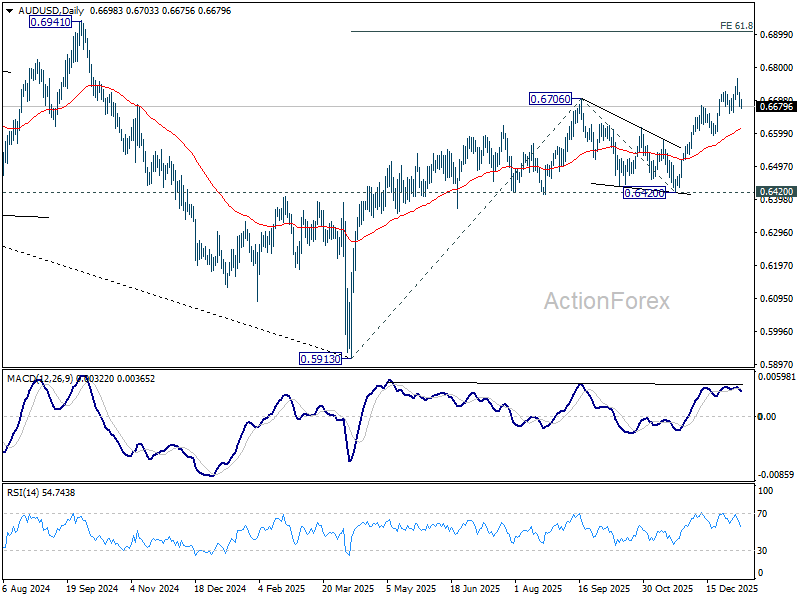
AUD/USD is holding above 0.6659 support despite current retreat. Intraday bias remains neutral and further rise is still in favor. Above 0.6765 will resume the whole rise from 0.5913 and target 61.8% projection of 0.5913 to 0.6706 from 0.6420 at 0.6910. However, considering bearish divergence condition in 4H MACD, firm break of 0.6659 will confirm short term topping, and bring deeper correction back towards 0.6592 support.
In the bigger picture, current development argues that rise form 0.5913 (2024 low) is reversing whole down trend from 0.8006 (2021 high). Further rally should be seen to 61.8% retracement of 0.8006 to 0.5913 at 0.7206. This will remain the favored case as long as 0.6420 support holds.
USD/CAD Daily Outlook
Daily Pivots: (S1) 1.3848; (P) 1.3869; (R1) 1.3886; More...
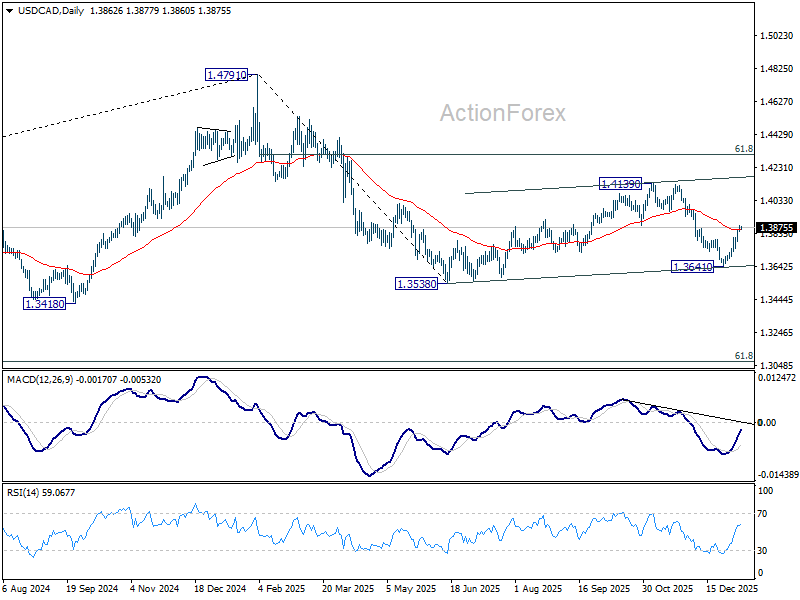
Intraday bias in USD/CAD remains on the upside as rise from 1.3641 is in progress. Corrective pattern from 1.3538 is extending, in its third leg. Sustained trading above 55 D EMA (now at 1.3859) will pave the way to 1.4139 resistance next. On the downside, below 1.3789 minor support will turn intraday bias neutral first.
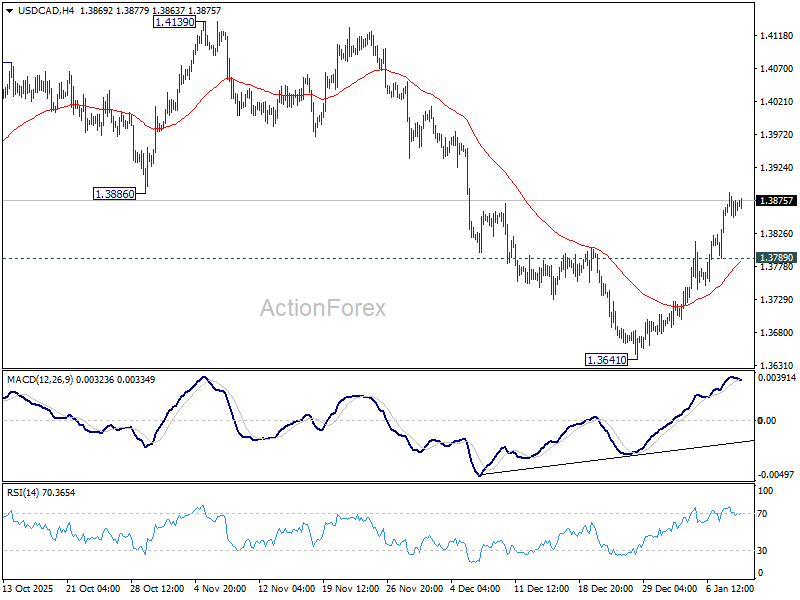
In the bigger picture, 1.4791 is likely developing into a deeper, larger scale correction. In the less bearish case, it's just correcting the rise from 1.2005 (2021 low). But even so, break of 1.3538 will pave the way to 61.8% retracement of 1.2005 to 1.4791 at 1.3069. This will remain the favored case as long as 1.4139 resistance holds, in case of rebound.
EUR/USD Daily Outlook
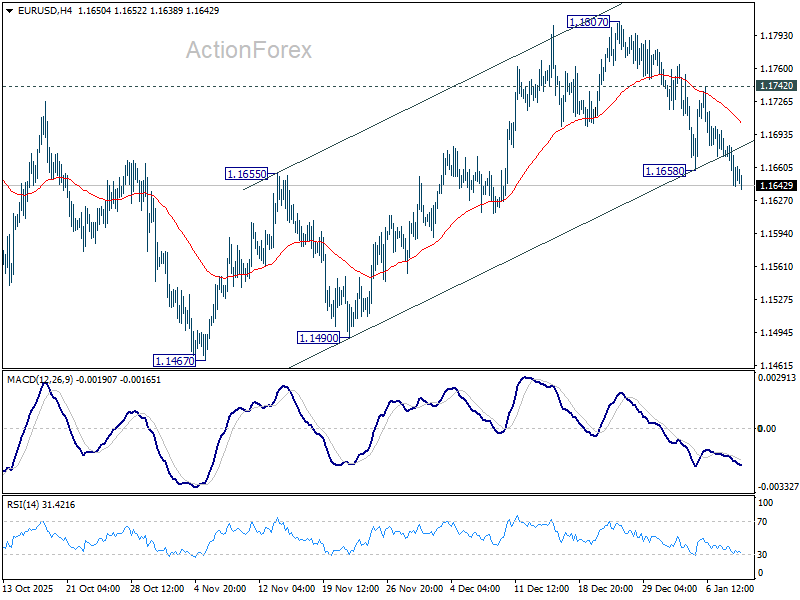
Daily Pivots: (S1) 1.1642; (P) 1.1663; (R1) 1.1682; More….
EUR/USD's decline from 1.1807 resumed by breaking through 1.1658 temporary low. The break of 55 D EMA (now at 1.1671) suggests that rebound from 1.1467 has already completed. Overall development indicates that corrective pattern from 1.1917 is already in the third leg. Intraday bias is back on the downside for 1.1467 support, and below. On the upside, though, break of 1.1742 will turn bias back to the upside for 1.1807 resistance instead.
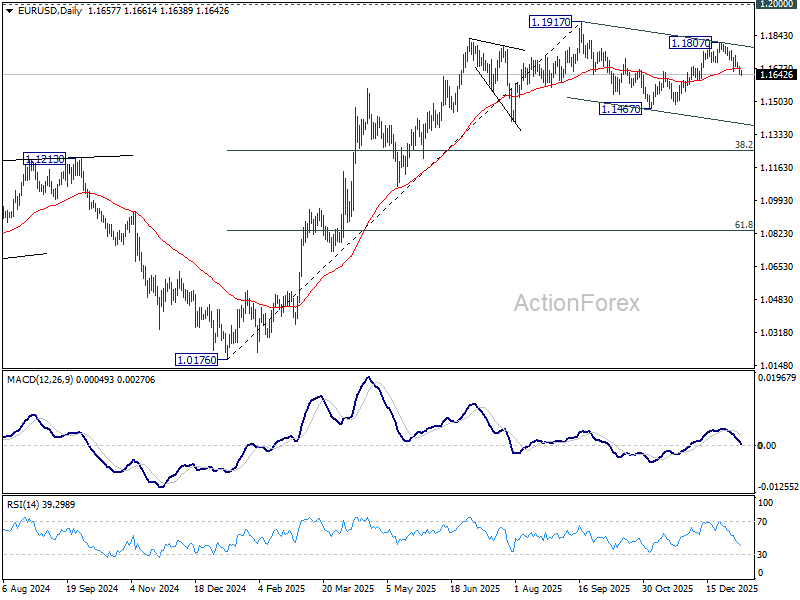
In the bigger picture, as long as 55 W EMA (now at 1.1408) holds, up trend from 0.9534 (2022 low) is still in favor to continue. Decisive break of 1.2 key psychological level will carry larger bullish implication. However, sustained trading below 55 W EMA will argue that rise from 0.9534 has completed as a three wave corrective bounce, and keep long term outlook bearish.
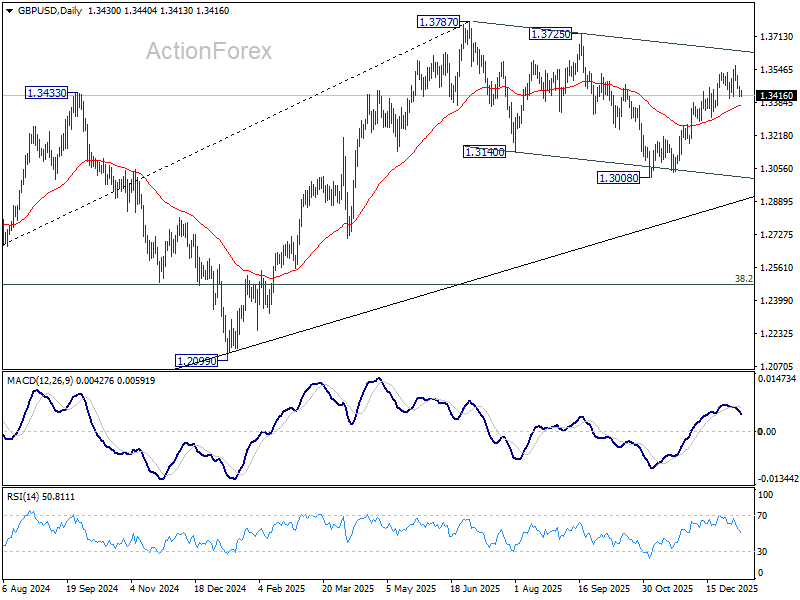
GBP/USD Daily Outlook
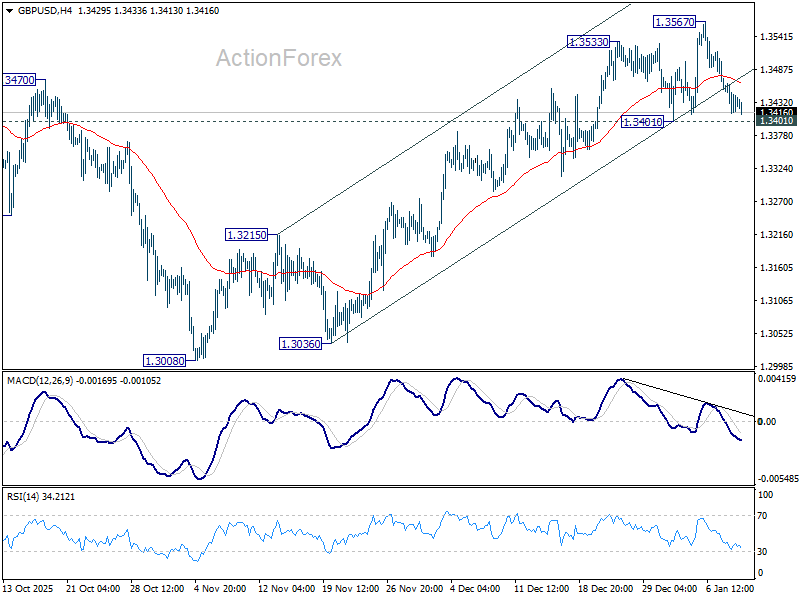
Daily Pivots: (S1) 1.3416; (P) 1.3440; (R1) 1.3465; More...
GBP/USD is still holding above 1.3401 support despite current retreat. Intraday bias stays neutral and further rise is in favor. On the upside, break of 1.3567 will resume the rise from 1.3008 to retest 1.3787 high. However, firm break of 1.3401 will confirm short term topping, and bring deeper fall back to 55 D EMA (now at 1.3367). Sustained break of 55 D EMA will argue that corrective pattern from 1.3787 is already extending with another falling leg, and target 1.3008.
In the bigger picture, current development suggests that fall from 1.3787 is merely a corrective move, and larger rise from 1.0351 (2022 low) is still in progress. Firm break of 1.3787 will target 1.4248 (2021 high) key structural resistance. This will remain the favored case as long as target 38.2% retracement of 1.0351 to 1.3787 at 1.2474 holds, in case of another fall.