Sample Category Title
Monetary Policy Divergence: Australia & Eurozone CPI and EUR/AUD Tumble
- RBA's hawkish stance (potential 25bps hike due to sticky core inflation) diverges from ECB's "steady hand" approach (2.0% headline target met).
- Australian core inflation (3.2%) remains stubbornly above the RBA's target, increasing the probability of a "preventative" rate hike despite a moderation in the headline CPI (3.4%).
- Monetary policy divergence drove the EUR/AUD cross to a 15-month low (1.7300) as markets price in a potential RBA hike and price out further ECB tightening.
Australia CPI moderates, Core inflation keeps RBA on hawkish stance
Australia’s latest Consumer Price Index (CPI) data, released this week on January 7, 2026, presents a complex puzzle for the Reserve Bank of Australia (RBA) as it prepares for its February board meeting. Headline inflation moderated to 3.4% in the year to November, down from 3.8% in October and notably below the market consensus of 3.6%. While the "undershoot" initially eased immediate fears of a February hike, a closer look at the underlying metrics suggests the RBA remains in a difficult position. The Trimmed Mean, the central bank’s preferred measure of core inflation, only ticked down slightly to 3.2%, remaining stubbornly above the RBA’s 2%-3% target band. Furthermore, stickier components like housing costs (up 5.2%) and a surge in electricity prices (up 19.7% following the rollback of state rebates) indicate that domestic price pressures are far from extinguished.
From a policy perspective, this "disinflationary breath" provides the RBA with some optionality, but it likely won't be enough to shift its hawkish stance. While headline figures are moving in the right direction, the persistence of services inflation and a tight labor market mean the risk of a "wait-and-see" approach turning into a policy error remains high. Major lenders like CBA and NAB continue to forecast a 25-basis-point hike to 3.85% in February, arguing that the RBA must act to prevent inflationary expectations from becoming entrenched. According to Bloomberg, the futures market positioning reflects that 22.3% of participants anticipate a 25 bps interest rate hike for the February 3rd 2026 meeting, a drop from 36.0% ahead of yesterday’s CPI release.
Consequently, the upcoming December quarter CPI print (due late January) will be the final arbiter; unless it shows a more aggressive softening in core services, the RBA may still opt for a "preventative" hike to ensure inflation returns to the midpoint of its target by 2027.
Eurozone CPI hits target, core inflation dictates ECB's 'Steady Hand'
The Eurozone’s preliminary CPI data, released on January 7, 2026, marks a significant milestone as headline inflation finally hit the European Central Bank’s (ECB) 2.0% target, falling from 2.1% in November. This "bullseye" reading suggests that the aggressive tightening cycle of previous years has successfully anchored price stability. The cooling was largely driven by a sharp contraction in energy prices (down 1.9% year-on-year), which acted as a powerful tailwind. However, the ECB’s "mission accomplished" moment is tempered by core inflation, which remains more resilient at 2.3%. While this is an improvement from the 2.4% seen in late 2025, the persistence of services inflation at 3.4% remains the primary source of anxiety for Frankfurt, reflecting a labor market that is cooling but not yet loose.
For the ECB’s Governing Council, this data reinforces a "steady hand" approach for the upcoming February meeting. With headline inflation at target and growth projected to be a modest 1.2% for 2026, there is little immediate pressure to hike further, yet the stubbornness of service costs makes aggressive rate cuts equally unlikely. Markets are currently pricing in a period of prolonged stability, with the deposit rate expected to hold at 2.00% throughout much of the year.
Unlike the RBA, which faces a potential hike, the ECB is in a "luxury position" where it can afford to wait and see if the current restrictive stance causes inflation to dip slightly below target before considering any further easing to support the Eurozone’s fragile recovery.
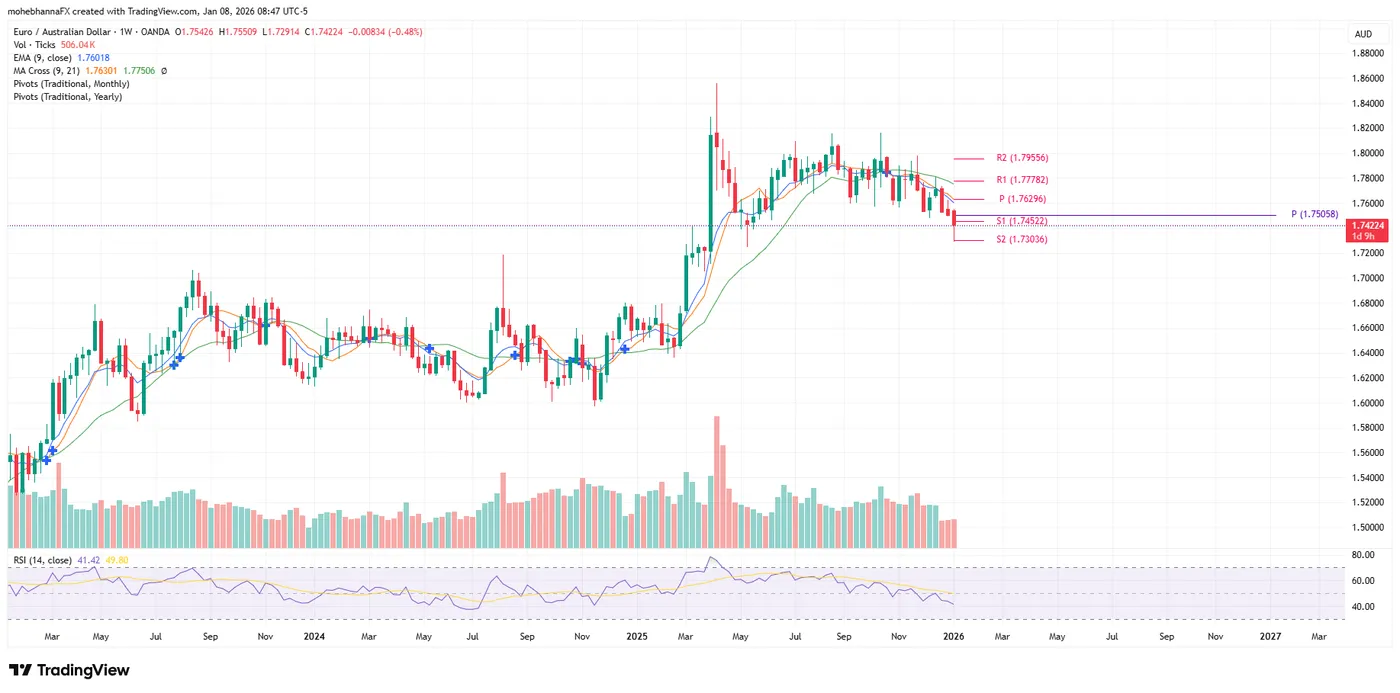
EUR/AUD Weekly chart 2023 - 2026 Source: Tradingview.com Past performance is not indicative of future results
Monetary policy divergence drives EUR/AUD to 15-month low
The movement in the EUR/AUD cross over the past few weeks has been a textbook example of monetary policy divergence playing out in real-time. Since mid-December, the pair has faced significant downward pressure, sliding from levels near 1.7600 to a 15-month low around 1.7300 as of early January 2026. This trend is driven by two opposing narratives: an ECB that has reached its "inflation bullseye" and an RBA that is still fighting a re-emergence of domestic price pressures. With Eurozone headline inflation hitting the 2.0% target, the market has effectively priced out any further tightening from Frankfurt, leading to a "sell the fact" reaction on the Euro. Conversely, the Australian Dollar has found "extra fuel" from sticky underlying inflation; even though Australia's headline CPI dipped, the persistence of core measures above 3% has shifted market bets toward a potential 25-basis-point hike in February.
This widening yield differential is further compounded by a broader shift in global risk appetite. While the Euro has been weighed down by geopolitical jitters—ranging from regional budget dysfunctions to external tensions—the Aussie has benefited from a resilient labor market and improving macro sentiment regarding its major trading partners. Technically, the break below the 1.7400 handle suggests that the path of least resistance for EUR/AUD remains to the downside. Traders are increasingly treating the Aussie as a high-yield play relative to the Euro, creating a "carry-trade" incentive that could see the pair test the 1.70 psychological support level if the RBA follows through with a hawkish shift at its next meeting.
Don't miss a beat on the global markets! Register for our weekly news trading webinars where we break down critical inflation data, central bank decisions—like the RBA's potential hike and the ECB's 'steady hand'—and what it all means for major currency pairs.
Monthly resistance levels
- R2 (Resistance 2): 1.79556 – Represents the major high-water mark and secondary resistance for the current period.
- R1 (Resistance 1): 1.77782 – The immediate barrier to the upside, roughly coinciding with the previous consolidation zone.
- P (Pivot Point): 1.76296 – The central "neutral" zone; price is currently trading well below this, signaling a bearish bias.
Monthly support levels
- S1 (Support 1): 1.74522 – The price has recently breached this level to the downside, turning it from former support into potential "new" resistance.
- S2 (Support 2): 1.73036 – This is the critical target for the current move. As shown on the chart, the price (1.73846) is currently gravitating toward this floor.
NFP Preview: DOW 50k and yield 4.2% decide Dollar path
Dollar has taken the driving seat in FX markets this week, supported by firmer US data and a modest repricing of Fed expectations. Bets on a March rate cut have dipped to around 41%, following the upside surprise in ISM Services earlier in the week, which reinforced the view that US economic momentum remains intact. Nevertheless, hat strength now faces a critical test from Friday’s December non-farm payrolls report. How markets respond across equities, Treasuries and rate pricing will be key in determining whether the Dollar can extend its gains.
Consensus expectations point to a 66k increase in payrolls, broadly in line with November’s 64k gain. Earnings are seen rising 0.3% mom, while the unemployment rate is expected to edge lower to 4.5%. Such an outcome would reinforce the prevailing “low hiring, low firing” narrative.
However, several leading indicators suggest upside risk to the headline payroll number. The ISM Services employment index jumped back from 48.9 into expansion at 52.0, while the Manufacturing employment sub-index also improved from 44.9 to 44.0. The ADP report showed a rebound to 41k jobs from November’s negative print. Four-week moving average of initial jobless claims fell to 212k, its lowest level in months. Together, the data point to resilience rather than deterioration.
Market reaction, however, is unlikely to be straightforward. Strong payrolls could be interpreted positively, reinforcing confidence in a soft-landing scenario. Equally, they could be seen as reducing the scope for aggressive easing, triggering a risk-off response that ultimately supports Dollar. The most bullish outcome for the greenback, ideally, would involve equity markets rolling over alongside a sustained rise in Treasury yields.
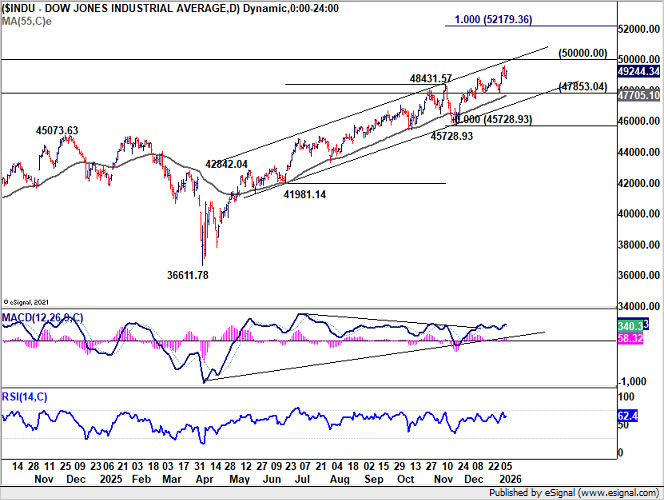
Technically, DOW is facing a key inflection zone, with 50,000 marking both a psychological level and the upper boundary of a medium-term channel. A break below 47,853 support would suggest a correction is already underway, opening the door to a deeper pullback toward 45,728. Conversely, decisive push above 50,000 could accelerate gains toward 52,179, potentially within January. That, if realized, would be bearish for the greenback.
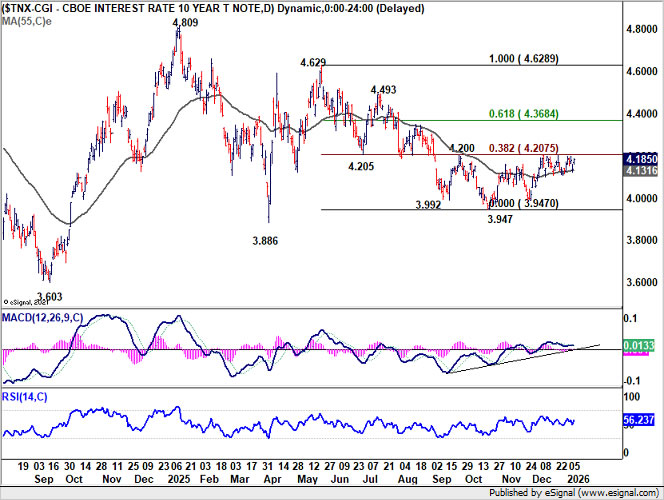
Meanwhile, 10-year yield continues to find support at its 55 D EMA (now at 4.131). Yet, upside is capped by 4.200 cluster resistance (38.2% retracement of 4.629 to 3.9047 at 4.207). On the upside, clean break above the 4.200 key level resistance cluster would argue that whole fall from 4.629 has already completed 3.947. That would set up stronger rise to 61.8% retracement at 4.368, and take Dollar higher.
Platinum Wave Analysis
Platinum: ⬇️ Sell
- Platinum reversed from pivotal resistance level 150.00
- Likely to fall to support level 135.00
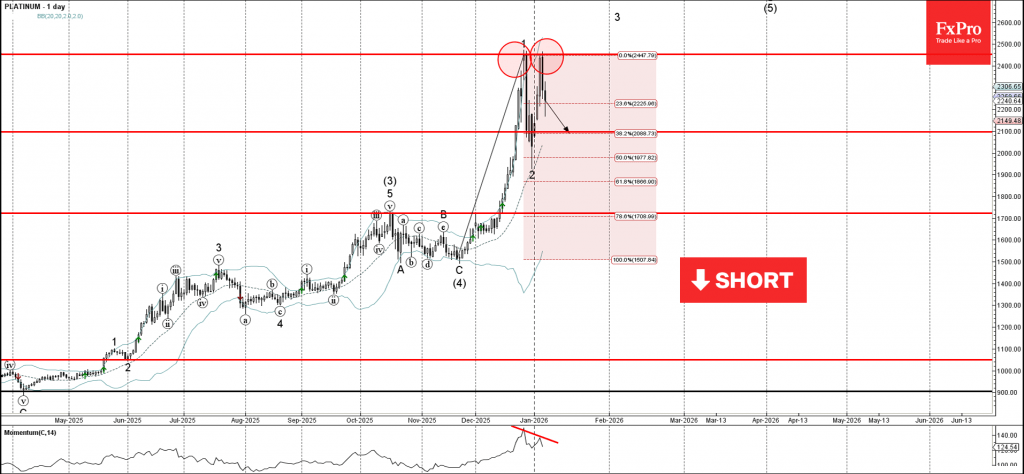
Platinum recently reversed down from the resistance area between the key resistance level 2450.00 (which stopped earlier impulse wave 1) and the upper daily Bollinger Band.
The downward reversal from the resistance level 2450.00 created the daily Japanese candlesticks reversal pattern Bearish Engulfing – which stopped the previous impulse wave 3 from December.
Given the strength of the resistance level 2450.00 and the bearish divergence on the daily Momentum indicator, Platinum can be expected to fall to the next support level 2100.00.
NFP Preview: Federal Reserve’s Pivot at a Crossroads, Implications for US Dollar & Nasdaq 100
The first major economic release of 2026 arrives this Friday, January 9, at 8:30 AM ET. Following a year of significant volatility marked by a federal government shutdown and a series of interest rate cuts, this Non-Farm Payrolls (NFP) report will be the definitive barometer for whether the Federal Reserve’s recent easing cycle was a masterstroke or a premature reaction to a cooling labor market.
Risks Heading into the Release
The primary risk remains data noise. Residual effects from the late-2025 government shutdown continue to cloud the "true" hiring trend. Additionally, significant downward revisions to October and November figures could overshadow a decent December headline, painting a bleaker picture of the quarter's momentum.
Market participants are also wary of a potential "January Effect," where rebalancing and new-year optimism collide with high-stakes data.
Lastly there is the growing pressure on Jerome Powell in what will be one of his last meetings as Fed Chair. Comments from Stephen Miran on Thursday may be a sign of what Powell's successor would bring as they would be appointees of the current administration.
Miran said he is looking at 150 bps of rate cuts through 2026, to boost the labor market. That is quite a stark contrast to what the Fed is currently pricing.
The Consensus: A Moderate Recovery
Economists are forecasting a modest rebound in hiring after months of data distortions. The consensus for December’s NFP sits at approximately 60,000 to 70,000 new jobs. This follows a November print of 64,000 and a catastrophic, shutdown-skewed October that saw over 100,000 jobs temporarily erased.
While the headline hiring remains below historical norms of 100k+, the unemployment rate is expected to edge down to 4.5% (from 4.6%).
This slight drop is largely attributed to furloughed federal workers returning to payrolls and a low rounding threshold in the household survey.
Meanwhile, Average Hourly Earnings (AHE) are forecast to rise 0.3% MoM (3.6% YoY), a level the Fed considers consistent with its long-term inflation goals.
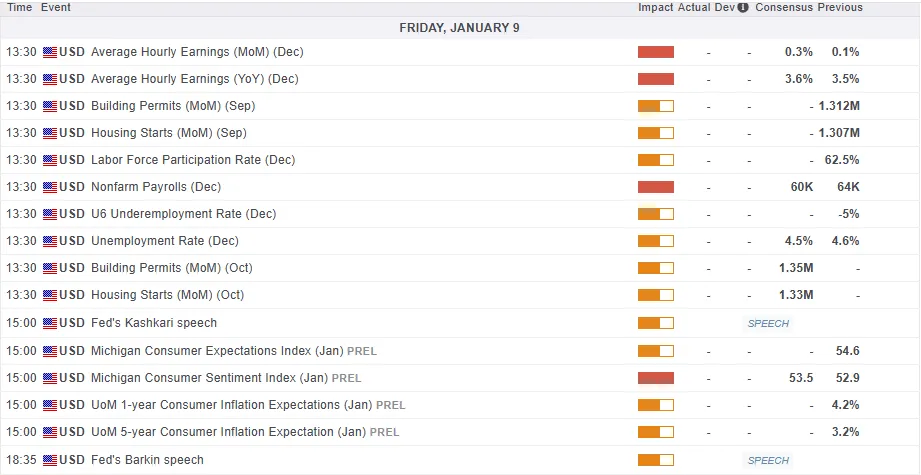
For all market-moving economic releases and events, see the MarketPulse Economic Calendar. (click to enlarge)
Deviation from the Consensus: What It Means
The Hawkish Beat (85k+): A surprise to the upside would suggest the labor market is far more resilient than the Fed’s recent 75bps of cuts implied. This would likely ignite a "good news is bad news" reaction, as traders would be forced to price out a March rate cut, fearing the Fed may have to pause or even reverse course to combat "sticky" inflation.
The Dovish Miss (<50k): A sub-50k print would confirm fears of a "material" weakening in labor demand. This would validate the market's current pricing for at least two more cuts in 2026, reinforcing the narrative that the US is in a late-cycle expansion vulnerable to recession.
Potential implications for the US Dollar Index (DXY) & Nasdaq 100
The market's reaction to the NFP report will not be uniform, but rather dependent on the deviation from consensus forecasts. These are the potential reactions we could see depending on how the data comes out and is received.
The DXY is currently technically oversold and trades near key support levels. This creates an asymmetric upside risk. Because the market is already heavily positioned for a dovish Fed, a stronger-than-expected report (above 75k) could trigger a violent short-covering rally, driving the DXY back toward the 100 level. Only a significantly weak report would have the power to push the dollar toward fresh multi-year lows.
US Dollar Index (DXY) Daily Chart, January 9, 2026
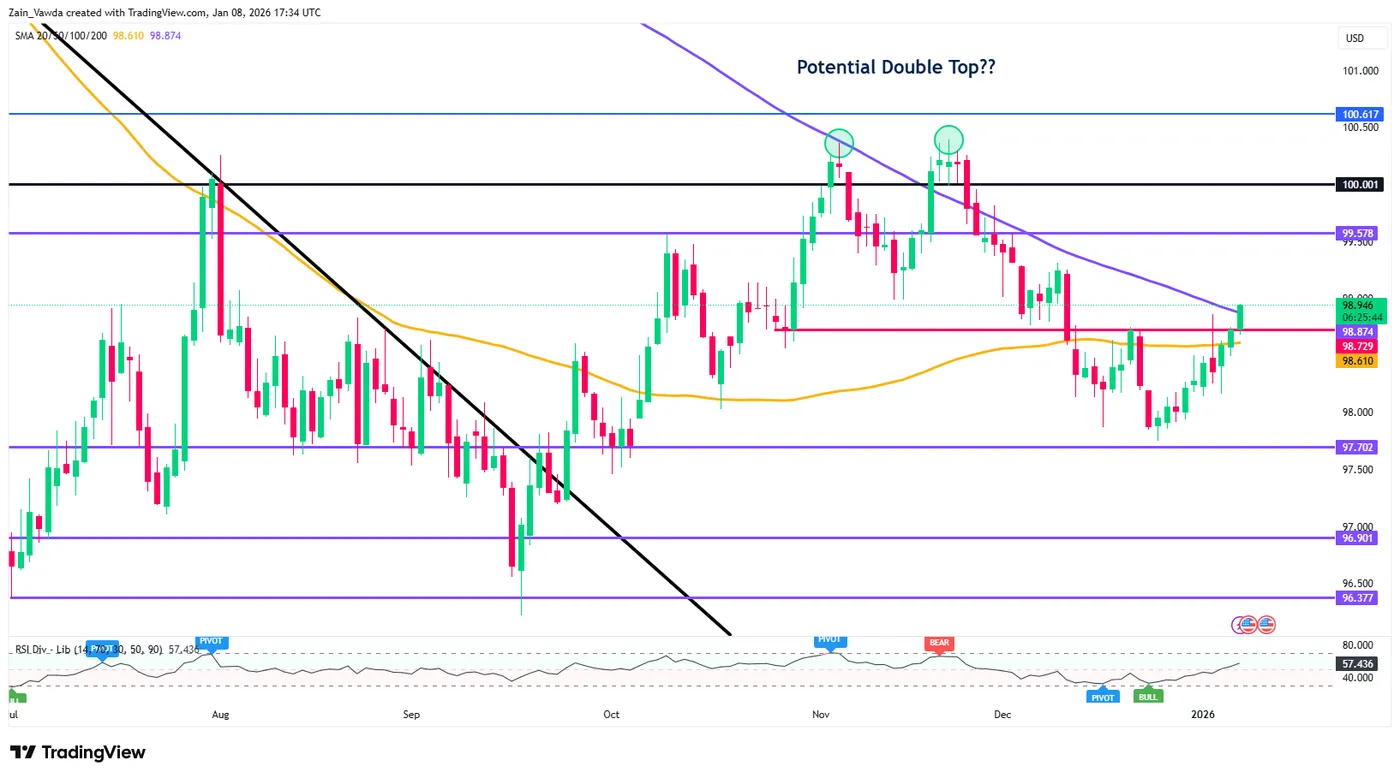
Source: TradingView (click to enlarge)
The tech-heavy Nasdaq 100 index enters this release on a knife’s edge. If the report hits the "Goldilocks" zone (moderate hiring with cooling wages), the Nasdaq could rally on the promise of continued Fed support. However, a strong NFP would likely spike yields, putting immediate pressure on high-valuation growth stocks. Conversely, a deep miss might initially support stocks via lower yields, but could quickly sour into a "growth scare" sell-off.
Nasdaq 100 Four-Chart, January 9, 2025
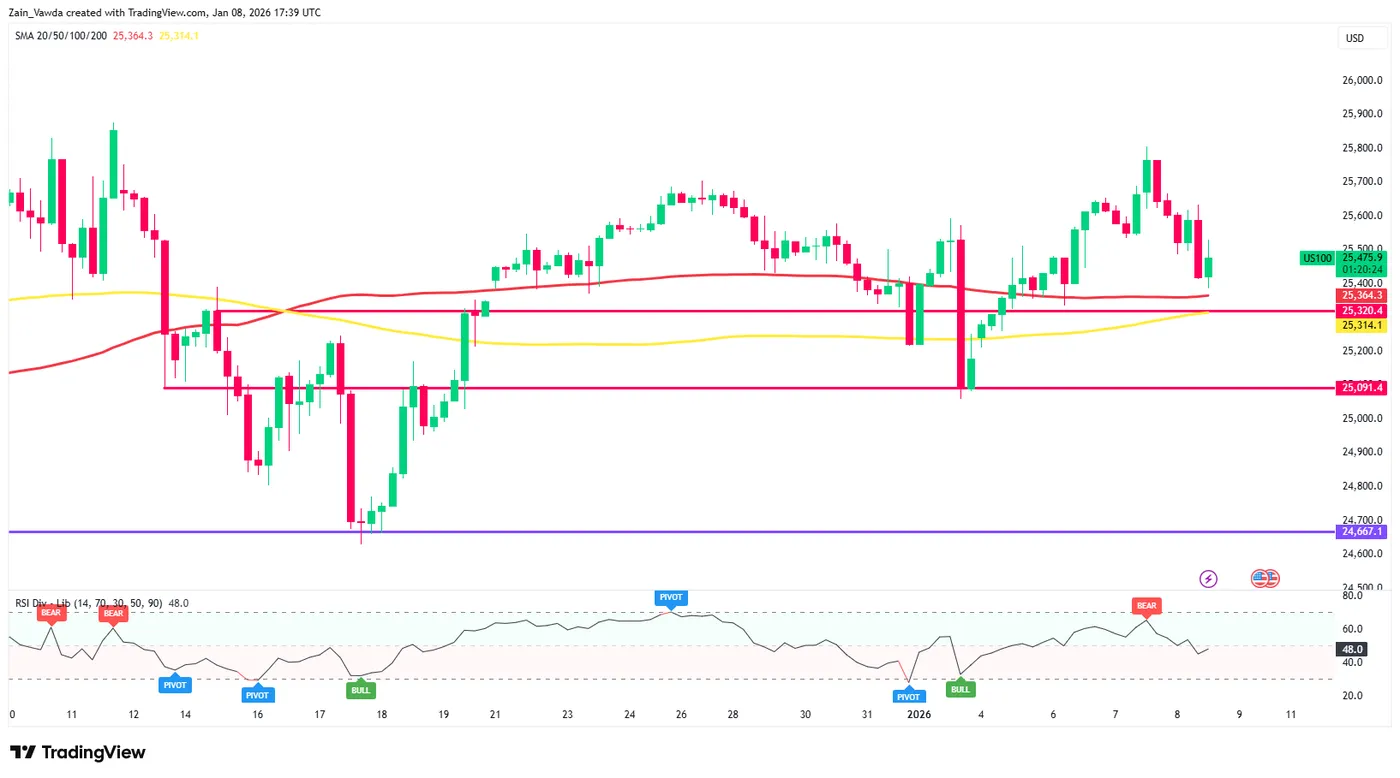
Source: TradingView (click to enlarge)
Outlook Moving Forward
If Friday’s data confirms that hiring has bottomed out, the Fed may find its "soft landing." However, if the 3-month average continues to slide, the pressure on Jerome Powell and his potential successor to provide more aggressive liquidity will become the dominant market theme for the remainder of the quarter.
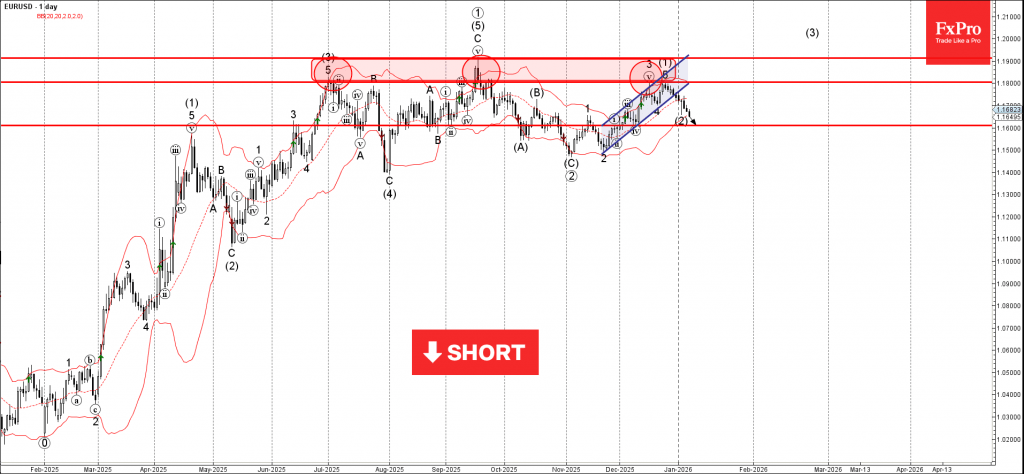
EURUSD Wave Analysis
EURUSD: ⬇️ Sell
- EURUSD broke daily up channel
- Likely to fall to support level 1.1600
EURUSD currency pair has been falling in the last few trading sessions inside the medium-term correction (2) – which started earlier from the resistance zone between the resistance level 1.1800.
The price earlier broke the support trendline of the daily up channel from November – which accelerated the active wave (2).
Given the bullish US dollar sentiment seen today, EURUSD currency pair can be expected to fall to the next support level 1.1600.
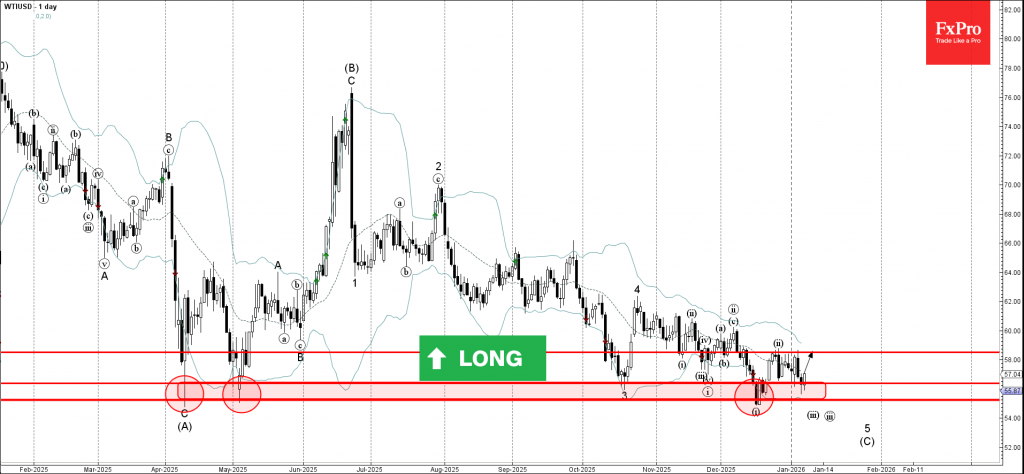
WTI Crude Oil Wave Analysis
WTI crude oil: ⬆️ Buy
- WTI crude oil reversed from support zone
- Likely to rise to resistance level 58.50
WTI crude oil recently reversed from the support zone between the long-term support level 55,2 (which has been reversing the price from April), support level 56.35 and the lower daily Bollinger Band.
The upward reversal from this support zone formed the daily Japanese candlesticks reversal pattern Hammer – which stopped the earlier impulse waves iii and 5.
Given the strength of the nearby support zone, WTI crude oil can be expected to rise to the next resistance level 58.50 (top of the previous correction ii).
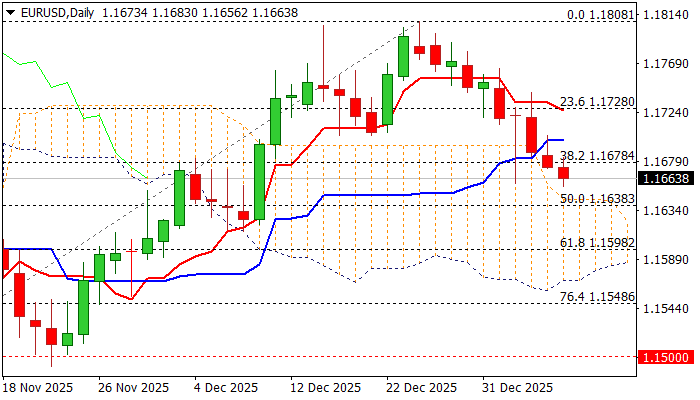
EURUSD: Next Week’s Daily Cloud Twist to Attract for Further Weakness
The Euro extends bear-leg from 1.1808 (dec 24 peak, where larger rally was capped by Fibo 76.4% of 1.1918/1.1468) and attempts to establish below important Fibo level at 1.1678 (38.2% of 1.1468/1.1808 rally).
The pair is on track for the second consecutive daily close below this level that would verify fresh bearish signal.
The price continues to trend lower along with the top of thinning daily cloud which will twist late next week and remain magnetic.
Bears eye targets at 1.1638 (Fibo 50% / 55DMA) and 1.1623/15 (cloud twist / daily higher base of Dec 8/9), though face increased headwinds at 100DMA support (1.1663), where Monday’s attack was strongly rejected.
Oversold stochastic contributes to scenario of consolidation preceding fresh weakness, as daily studies are bearishly aligned (double-top / negative momentum / 10/20; 5/10; 5/20 and 5/30DMA bear-cross).
Potential upticks should be ideally capped under 1.1700 (former higher base) while sustained break above 1.1730 zone (broken Fibo 23.6% / 20/10DMA’s) would sideline bears.
Res: 1.1683; 1.1800; 1.1730; 1.1765
Sup: 1.1638; 1.1615; 1.1598; 1.1562
Sunset Market Commentary
Markets
The minor return action lower in core bond yields over the past couple of days turned to a halt today. The long end of the curve underperformed, both in Europe, where yields rise up to 3 bps, and the US (2.2-3.4 bps). We haven’t seen a particular trigger but do note the enormous supply this week so far, resulting in the busiest-ever start to the year. Italy and Portugal are adding to the flush with a dual (7-yr and 20-yr) offering of €20bn and a 10-yr €4bn sale respectively today. Such heavy and frontloaded issuance suggests governments and corporates are keen to lock in funding before something (geopolitics, upcoming earnings season …) breaks the current benign market conditions. Market’s healthy risk appetite is perhaps most visible in stock markets. The EuroStoxx50 and US indices, despite edging marginally lower today, are all hovering near record highs. At the same time, though, large-scale bond issue volumes won’t be one-offs in times of semi-permanent huge fiscal deficits. Gilts again outperform Bunds and Treasuries. Long-term yields barely recover from yesterday’s 7 bps hit. Currency markets barely make a dent in the intraday charts. EUR/USD trades an extremely tight sideways pattern between 1.167 and 1.168. DXY holds steady around 98.75. EUR/GBP posts gains for a third day straight with the pair moving back towards the 0.87 barrier (and re-entering the downward sloping trading short-term trading range).
Today’s economic calendar was second-tier, in particular ahead of tomorrow’s December payrolls, but nevertheless had a few prints in store. US jobless claims for example rose from 200k to 208k but remain low from a historical point of view. An unexpected drop in the October trade deficit, the smallest since 2009, triggered some buzz. The numbers, delayed by the government shutdown, showed imports dropping 3.2% (nonmonetary gold, medication reversing an earlier surge amid tariff uncertainty) and exports rising 2.6%. The EC’s economic confidence indicator in Europe came in to the weak side of expectations (96.7 from 97.1), owing to an unexpected drop registered in the services sector (5.6 from 5.8) and lower (final) consumer confidence, but remained among the highest levels of the last two years. The ECB’s consumer inflation expectations survey showed those for the 1-yr, 3-yr and 5-yr staying unchanged at 2.8%, 2.5% and 2.2%. One data point that perhaps deserved more attention than it got were German factory orders surging a consensus-crushing 5.6% m/m (10.5% y/y, fastest since 2011 excluding Covid). It’s the defense buildup (metal products, transport equipment) at play, but even excluding for these large-scale orders, they were still up by 0.7% m/m, the statistics agency reported.
News & Views
Overall Swiss prices were unchanged in December, to be 0.1% higher Y/Y (from 0% Y/Y in November). Average annual Swiss inflation reached 0.2% in 2025. On a monthly basis, lower prices for international package holidays, medicines and several types of vegetables balanced out higher prices for hotels and supplementary accommodation and the hire of private means of transport. Core inflation, excluding fresh and seasonal products, energy and fuel, came in at 0% M/M and 0.5% Y/Y. Both measures remain within the Swiss National Bank’s 0%-2% inflation target band. Goods price deflation (-0.6% M/M & -1.7% Y/Y) contrasted with higher services prices (+0.4% M/M & +1.2% Y/Y). Apart from inflation date, the SNB today released Minutes of the December policy meeting. The governing board found that there was currently no need for monetary policy action. “Neither a tightening nor a further easing would be appropriate at this juncture”. This duality marks a shift from September when the SNB opted not to ease further. EUR/CHF sits comfortably near the middle of the 0.92-0.9450 trading range in place since mid-April.
The Bank of England’s monthly Decision Maker Panel survey showed price and wage growth expectations slightly easing in December while employment remains negative but less severe than before. CFO’s from surveyed firms see year-ahead 1- and 3-yr expected CPI inflation stable at respectively 3.4% and 2.9%. Realized annual own-price growth and year-ahead expected own-price inflation both notched 0.1 ppt lower to 3.7% (in the three months to December) and 3.6%. Realized annual wage growth and expected year-ahead wage growth both declined by the same margin to 4.4% and 3.7%. Firms reported that realized annual employment growth was -0.4% in the three months to December, up from -0.7%. Expectations for employment growth over the next year weakened slightly, falling by 0.2 ppt to -0.4% in the three months to December.
EUR/USD Mid-Day Outlook
Daily Pivots: (S1) 1.1666; (P) 1.1684; (R1) 1.1696; More….
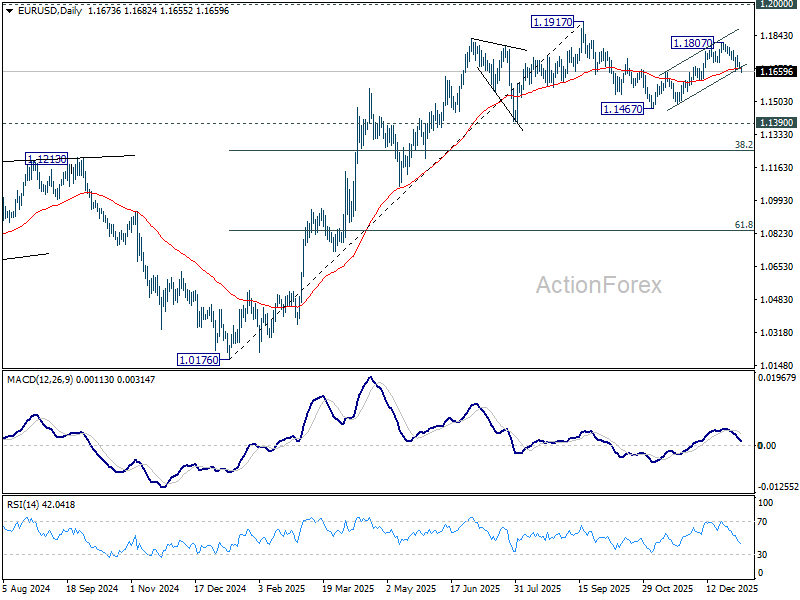
Immediate focus is now on 1.1658 temporary low in EUR/USD. Firm break there will resume the decline from 1.1807. More important, that would indicate that corrective pattern from 1.1917 is already in the third leg. Deeper fall should then be seen to 1.1467 support. On the upside, however, break of 1.1807 will resume the rise from 1.1467 to retest 1.1917 high instead.
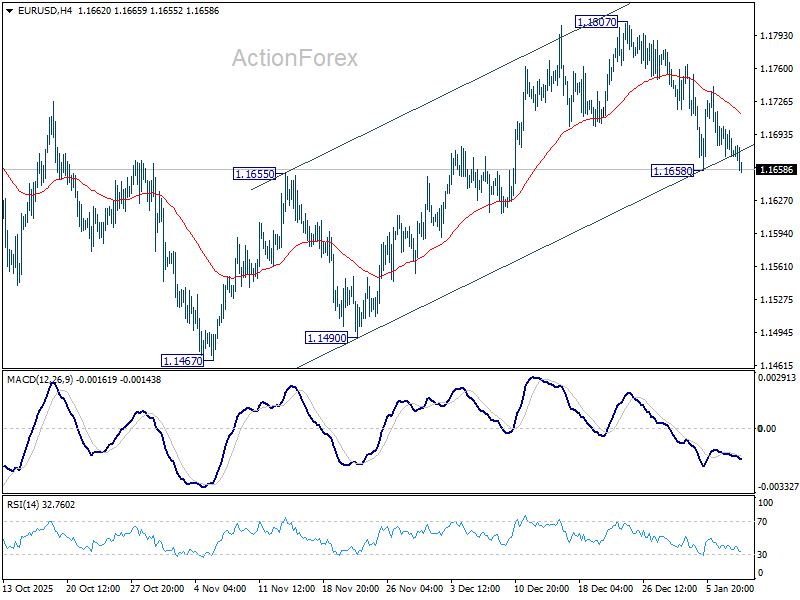
In the bigger picture, as long as 55 W EMA (now at 1.1408) holds, up trend from 0.9534 (2022 low) is still in favor to continue. Decisive break of 1.2 key psychological level will carry larger bullish implication. However, sustained trading below 55 W EMA will argue that rise from 0.9534 has completed as a three wave corrective bounce, and keep long term outlook bearish.