
Sample Category Title
USD/CHF Daily Outlook
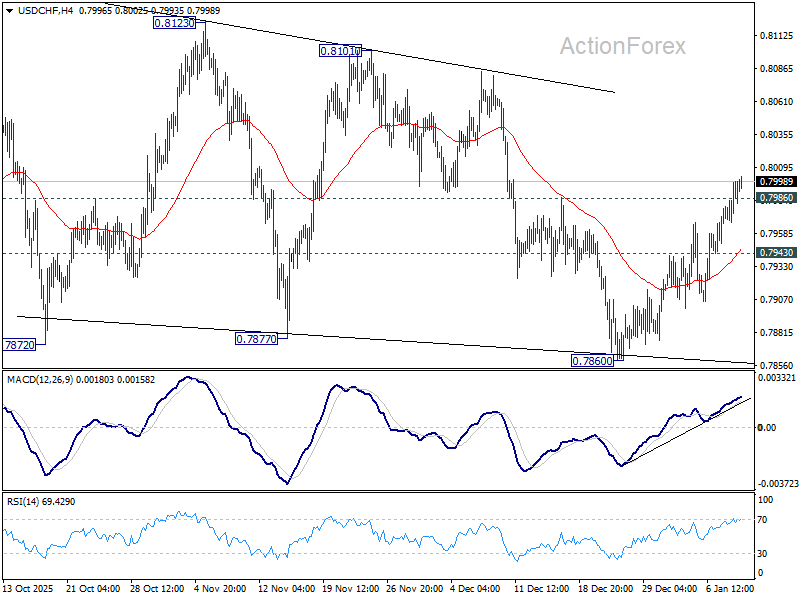
Daily Pivots: (S1) 0.7966; (P) 0.7983; (R1) 0.8005; More….
USD/CHF's break of 0.7986 resistance suggests that fall from 0.8123 has completed at 0.7860. The corrective pattern from 0.7828 is probably in another rising leg. Intraday bias is back on the upside for 0.8123 resistance. On the downside, below 0.7943 minor support will flip bias back to the downside for 0.7860 instead.
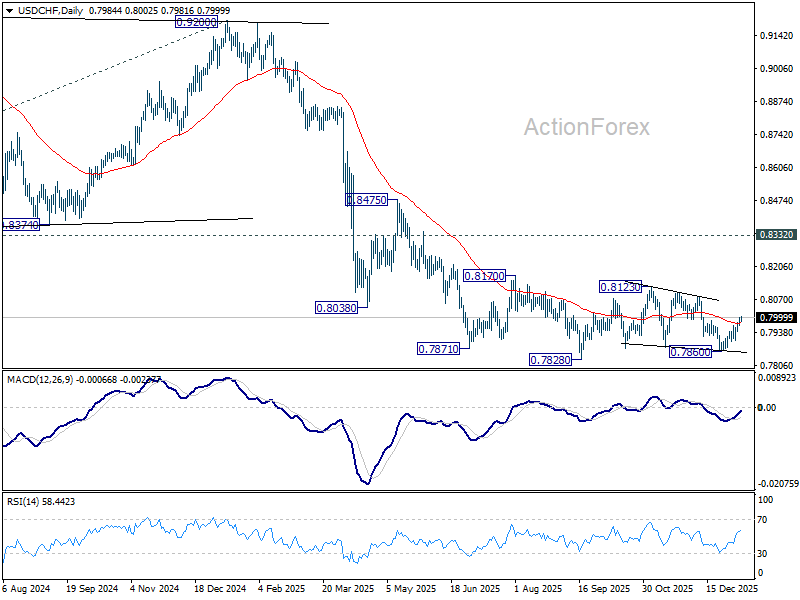
In the bigger picture, outlook will stay bearish as long as 0.8332 support turned resistance holds (2023 low). Long term down trend from 1.0342 (2017 high) is still in progress. Next target is 100% projection of 1.0146 (2022 high) to 0.8332 from 0.9200 at 0.7382.
Geopolitics Will Destroy Euro
- EURUSD falls due to geopolitics and expectations of tariff removal
- Gold returns to debasement trading.
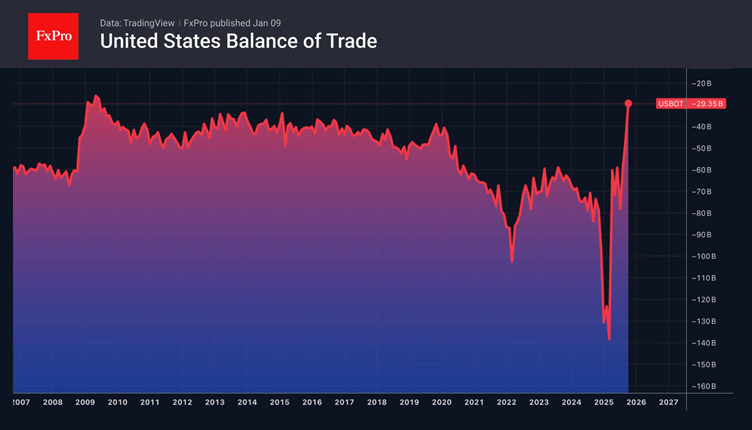
The US dollar continued its advance on Forex thanks to a new batch of strong macro statistics. Jobless claims rose less than expected. Productivity rose to a two-year high, and the US trade deficit unexpectedly narrowed to its lowest level since 2009. Donald Trump’s plan to balance foreign trade with import tariffs is working. However, the Supreme Court may rule the tariffs illegal by the end of the week on 9 January.
The cancellation of import duties would return funds to American companies and households, which have largely absorbed the cost of tariffs that previously weighed on economic growth. The US economy has continued to expand, supported by investment in artificial intelligence, rising productivity, and the wealth effect created by record equity markets that have boosted household prosperity. The return of tariff revenues would effectively act as a fiscal stimulus, increasing disposable income and corporate cash flow. As a result, GDP growth and inflationary pressures are likely to accelerate.
This combination will create another barrier to lowering the federal funds rate. Stephen Miron’s calls to cut it by 150 basis points in 2026 seem like a voice crying in the wilderness. Most FOMC members understand perfectly well what the return of money from tariffs could lead to. The hawks will gain a strong trump card, the pause in the monetary expansion cycle will be prolonged, and the US dollar will benefit from this.
Rumours of additional sanctions against Russia are putting pressure on the EURUSD. Diplomatic efforts to bring peace to Ukraine are not yielding results, and the continuation of the armed conflict will continue to hold back the eurozone economy. Events in Venezuela and talk of Greenland joining the US are increasing geopolitical tensions. According to ECB Vice-President Luis Guindos, this could hurt business, and increased household savings will slow GDP growth.
Despite the strengthening of the US dollar, gold has managed to counterattack. The precious metal is able to benefit from the Supreme Court’s repeal of tariffs. The return of money will lead to an increase in the US budget deficit and public debt. These processes underlie debasement trading. In 2025, it became one of the key drivers of the 65% rally in XAUUSD.
USD/JPY Daily Outlook
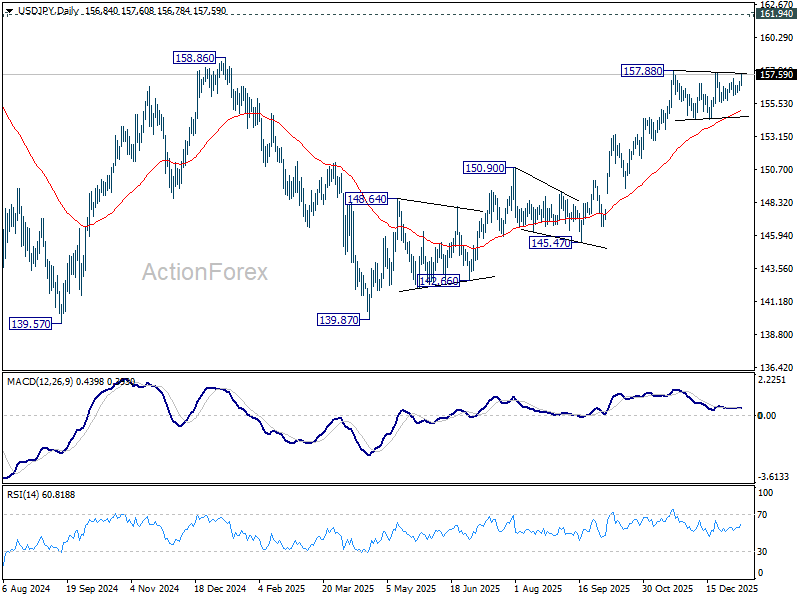
Daily Pivots: (S1) 156.54; (P) 156.80; (R1) 157.15; More...
Intraday bias in USD/JPY stays neutral, but immediate focus is now on 157.88 resistance with today's rally. Decisive break there will extend the up trend from 138.98. Further break of 158.85 key structural resistance will be an important medium term bullish sign. Next target will be 161.94 high. In any case, outlook will continue to stay bullish as long as 154.33 support holds.
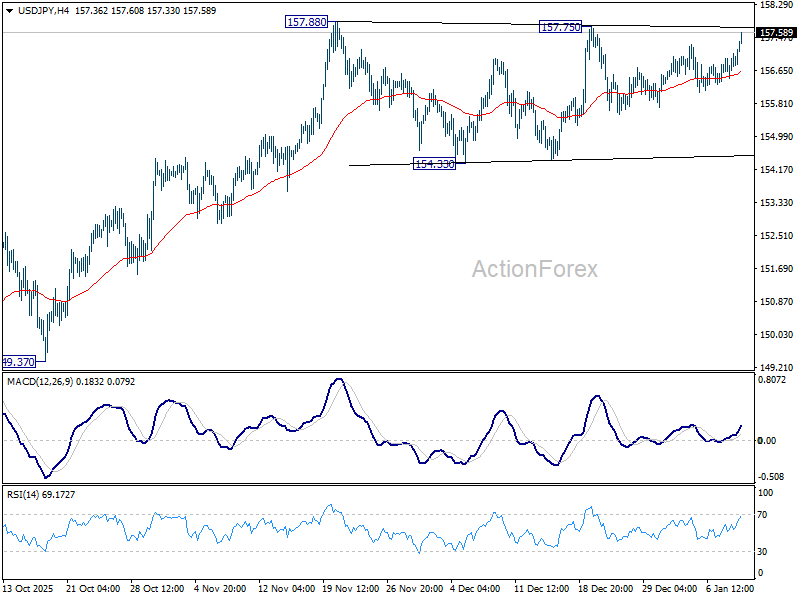
In the bigger picture, corrective pattern from 161.94 (2024 high) could have completed with three waves at 139.87. Larger up trend from 102.58 (2021 low) could be ready to resume through 161.94 high. Decisive break of 158.85 structural resistance will solidify this bullish case and target 161.94 for confirmation. On the downside, break of 154.33 support will dampen this bullish view and extend the corrective range pattern with another falling leg.
Dollar Leads into NFP as USD/JPY Nears Breakout
Dollar is trading broadly higher in Asian session today, and remains the strongest performer of the week, as markets head into the December US non-farm payrolls report. Within FX, USD/JPY stands out as a pair to watch, with the pair edging closer to levels that would confirm an upside break.
This week's price action suggests markets may be positioning for upside risk in the jobs data, rather than bracing for disappointment. That bias is understandable. That narrative is supported by this week’s indicators, which collectively point to a jobs market that remains resilient. Hiring may be subdued, but layoffs remain contained, reinforcing the view that the US economy is slowing only gradually.
The backdrop points to resilience rather than fragility, setting the stage for a payrolls print that could surprise modestly to the upside. Such an outcome would reinforce a wait-and-see stance at the Fed. Markets may continue to debate the timing of the next rate cut, but a decisive shift toward March easing would look premature.
Still, the sustainability of Dollar’s rally hinges on more than the headline payrolls number. Market reactions across equities and Treasury yields will be critical in determining whether USD gains can extend or begin to fade after the event.
Beyond data, legal risk is also on the radar. Markets are bracing for a ruling from the US Supreme Court on the legality of President Donald Trump’s global tariffs imposed under the International Emergency Economic Powers Act. A decision could arrive as early as today. Expectations that the court may strike down the tariffs have grown since November arguments, when justices across the ideological spectrum questioned whether the law grants such sweeping authority. A ruling against the administration could trigger refund claims estimated at up to US 150B, with implications for Treasury issuance and market volatility.
Trade tensions are also resurfacing elsewhere. US–India negotiations are stalled after talks collapsed last year, prompting Trump to double tariffs on Indian goods to 50% in August. US officials have since suggested the breakdown stemmed from a lack of direct engagement from Indian leadership. According to Commerce Secretary Howard Lutnick, the deal was effectively ready but required a direct call from Prime Minister Narendra Modi to close it — a step that never materialized.
On weekly FX performance, Dollar leads, followed by Aussie and Sterling. Loonie lags, ahead of Swiss Franc and Euro. Yen and Kiwi trade in the middle.
NFP Preview: DOW 50k and yield 4.2% decide Dollar path
Dollar has taken the driving seat in FX markets this week, supported by firmer US data and a modest repricing of Fed expectations. Bets on a March rate cut have dipped to around 41%, following the upside surprise in ISM Services earlier in the week, which reinforced the view that US economic momentum remains intact. Nevertheless, hat strength now faces a critical test from Friday’s December non-farm payrolls report. How markets respond across equities, Treasuries and rate pricing will be key in determining whether the Dollar can extend its gains.
Consensus expectations point to a 66k increase in payrolls, broadly in line with November’s 64k gain. Earnings are seen rising 0.3% mom, while the unemployment rate is expected to edge lower to 4.5%. Such an outcome would reinforce the prevailing “low hiring, low firing” narrative.
However, several leading indicators suggest upside risk to the headline payroll number. The ISM Services employment index jumped back from 48.9 into expansion at 52.0, while the Manufacturing employment sub-index also improved from 44.9 to 44.0. The ADP report showed a rebound to 41k jobs from November’s negative print. Four-week moving average of initial jobless claims fell to 212k, its lowest level in months. Together, the data point to resilience rather than deterioration.
Market reaction, however, is unlikely to be straightforward. Strong payrolls could be interpreted positively, reinforcing confidence in a soft-landing scenario. Equally, they could be seen as reducing the scope for aggressive easing, triggering a risk-off response that ultimately supports Dollar. The most bullish outcome for the greenback, ideally, would involve equity markets rolling over alongside a sustained rise in Treasury yields.
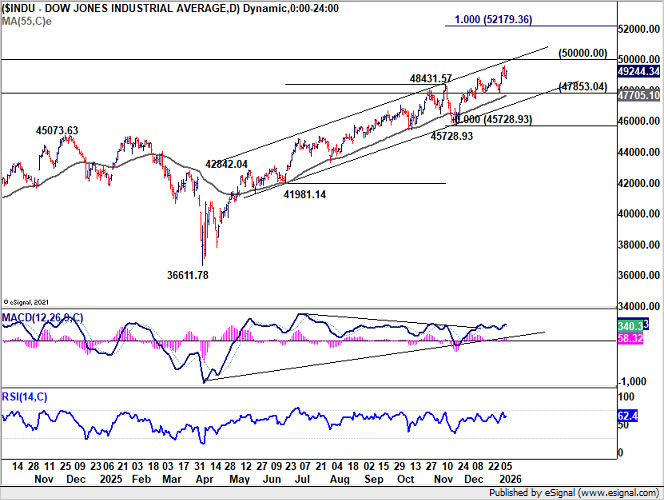
Technically, DOW is facing a key inflection zone, with 50,000 marking both a psychological level and the upper boundary of a medium-term channel. A break below 47,853 support would suggest a correction is already underway, opening the door to a deeper pullback toward 45,728. Conversely, decisive push above 50,000 could accelerate gains toward 52,179, potentially within January. That, if realized, would be bearish for the greenback.
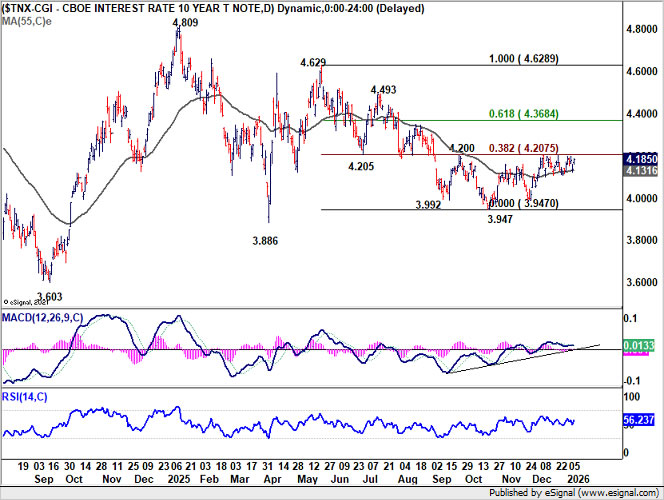
Meanwhile, 10-year yield continues to find support at its 55 D EMA (now at 4.131). Yet, upside is capped by 4.200 cluster resistance (38.2% retracement of 4.629 to 3.9047 at 4.207). On the upside, clean break above the 4.200 key level resistance cluster would argue that whole fall from 4.629 has already completed 3.947. That would set up stronger rise to 61.8% retracement at 4.368, and take Dollar higher.
China CPI surprises to upside at 0.8%, but full-year picture weak
China’s consumer inflation accelerated in December, with CPI rising from 0.7% to 0.8% yoy, above expectations of 0.6% and marking a 34-month high. The increase was driven mainly by food prices, as fresh vegetables surged 18.2% and beef prices rose 6.9%, supported by pre-New Year holiday demand.
However, price pressures remained uneven. Pork prices continued to fall sharply, down -14.6% yoy, while prices of gold jewelry jumped 68.5%, reflecting strong investment and gifting demand rather than broad-based consumption. According to National Bureau of Statistics, holiday shopping and supportive policies helped lift prices, but the improvement remains selective.
Looking beyond December, the broader deflationary challenge persists. Full-year CPI growth in 2025 was flat, the weakest in 16 years and well below policymakers’ “around 2%” target.
At the producer level, deflation moderated only slightly. PPI improved to -1.9% yoy in December from -2.2%, aided by rising non-ferrous metal prices and capacity discipline in key industries. Still, PPI fell 2.6% for the full year.
USD/JPY Daily Outlook
Daily Pivots: (S1) 156.54; (P) 156.80; (R1) 157.15; More...
Intraday bias in USD/JPY stays neutral, but immediate focus is now on 157.88 resistance with today's rally. Decisive break there will extend the up trend from 138.98. Further break of 158.85 key structural resistance will be an important medium term bullish sign. Next target will be 161.94 high. In any case, outlook will continue to stay bullish as long as 154.33 support holds.
In the bigger picture, corrective pattern from 161.94 (2024 high) could have completed with three waves at 139.87. Larger up trend from 102.58 (2021 low) could be ready to resume through 161.94 high. Decisive break of 158.85 structural resistance will solidify this bullish case and target 161.94 for confirmation. On the downside, break of 154.33 support will dampen this bullish view and extend the corrective range pattern with another falling leg.
China CPI surprises to upside at 0.8%, but full-year picture weak
China’s consumer inflation accelerated in December, with CPI rising from 0.7% to 0.8% yoy, above expectations of 0.6% and marking a 34-month high. The increase was driven mainly by food prices, as fresh vegetables surged 18.2% and beef prices rose 6.9%, supported by pre-New Year holiday demand.
However, price pressures remained uneven. Pork prices continued to fall sharply, down -14.6% yoy, while prices of gold jewelry jumped 68.5%, reflecting strong investment and gifting demand rather than broad-based consumption. According to National Bureau of Statistics, holiday shopping and supportive policies helped lift prices, but the improvement remains selective.
Looking beyond December, the broader deflationary challenge persists. Full-year CPI growth in 2025 was flat, the weakest in 16 years and well below policymakers’ “around 2%” target.
At the producer level, deflation moderated only slightly. PPI improved to -1.9% yoy in December from -2.2%, aided by rising non-ferrous metal prices and capacity discipline in key industries. Still, PPI fell 2.6% for the full year.
Paralysis Struck Equity, FI and FX Markets
Markets
Paralysis struck equity, FI and FX markets yesterday. Stocks hovered near their record highs, posting small losses in Europe and printing mixed in the US (tech slightly down, industrials up). Core bond yields’ recent corrective move lower grinded to a halt by recouping a technically insignificant 0.5-2 bps both in the US and Europe. The limited data available, if anything, supported this modest recovery. Aside from higher but still-low US weekly jobless claims, a surge in German factory orders is worth the mention. That was driven by large-scale (government) orders in the defense-related pockets (finally one may say) but even when excluding those, the German statistics agency noted an improvement. Actual production for November published this morning also surprised to the upside with an unexpected 0.8% m/m increase. Gilts outperformed with front end yields still easing some 2 bps. The US dollar held the advantage against most of its advanced counterparts. The greenback simply extended a mid-December upleg rather than actually responding to news. EUR/USD slid to 1.166 with the slide continuing this morning to 1.165, the lowest in a month but still some distance away from first meaningful support at 1.1392. DXY is currently testing the 99 big figure while USD/JPY after a calm day yesterday takes a leap today. Currently trading at 157.4 the Nov-Dec highs just shy of 158 are closing in fast.
We’ll get more fireworks today, hopefully. Some housing data, the University of Michigan consumer confidence indicator and most importantly, US December payrolls are scheduled for release. Consensus expects job growth to come in at 70k, picking up slightly from November’s 64k. The unemployment rate would ease to 4.5% from the four year high of 4.6%. We think it’ll take a major downside surprise – which is not our base scenario - for markets to meaningfully change their status quo expectations for the January Fed policy meeting, especially because earlier data this week wasn’t that bad at all (eg. services ISM). Numbers in line or perhaps a bit stronger (employment component in services ISM) would extend the dollar’s current momentum and lift (short-term) US yields further away from their recent lows/support zones but unlikely have technical implications. Another potentially big event risk is concentrated at the Supreme Court today. It’ll issue an opinion on Trump’s reciprocal tariffs that may or may not result in actual rulings to either keep them in place or strike them down. The latter would undoubtedly introduce new uncertainty: What will happen to the current trade deals? What other tariff routes are there for the US government? How quickly can these get implemented and how different are the tariff rates going to be? Rising risk premia would probably lift long-term US bond rates but the jury remains out whether and how it’ll affect other US asset classes (equities, the dollar) as well.
News & Views
The NY Fed’s December survey of consumer expectations showed labor market expectations worsening. The mean perceived probability of finding a job if one’s current job were lost fell by 4.2 ppts to 43.1%, reaching a new series low. The mean perceived probability of losing one’s job in the next twelve months increased by 1.4 ppts to 15.2%. The reading is above the series’ 12-month trailing average of 14.3%. Median inflation expectations increased from 3.2% to 3.42% at the 1-year horizon, the highest level since April of last year. They were unchanged at the 3-yr and 5-yr horizons, both at 3%. Households’ perceptions about their current financial situation compared to a year ago and year-ahead expectations both improved.
In an effort to restoring US housing affordability, US president Trump wants government-sponsored enterprises (GSE) Fannie Mae (Federal National Mortgage Association) and Freddie Mac (Federal Home Loan Mortgage Corporation) to step up purchases of mortgages from lenders by the tune of $200bn. The GSE’s convert them into MBS. The bond buying programme should help squeeze credit risk premia, that way driving mortgages rates and monthly payments down. The average rate on a 30-yr mortgage in the US is currently 6.16%. Trump’s latest initiative follows a ban earlier this week for institutional investors to buy single-family homes.
Tech, Tariffs and US Jobs Data
Sentiment across global equity markets is softening as we approach the end of the first full trading week of the year. US tech stocks were hit yesterday, with Nvidia dipping 2% below its 50-DMA, while the Mag 7 hesitated around their own 50-DMA marks.
US defence stocks rebounded on Trump’s call to increase military spending by $500bn to $1.5trn, while energy stocks jumped, with Exxon shrugging off earlier warnings that Q4 results would be significantly hit by lower oil prices.
In Europe, the FTSE 100 tested but closed the session above the 10,000p level. In Asia, tech stocks are bid this morning. This week, Samsung announced that its profits tripled, thanks to higher memory chip prices driven by soaring AI demand. Meanwhile, a Chinese AI company Minimax gained more than 70% on its first day of trading in Shanghai.
Supportive news and strong risk appetite continue to channel capital into the tech space, but investors are increasingly looking at fresh names as the highly valued, buzzy stocks of the past three years are seeing appetite fade. Nvidia investors, for instance, didn’t flinch after Jensen Huang showcased at the CES conference a new self-driving platform and said Rubin chips are nearing shipment and are faster and more energy-efficient than Blackwell.
As such, investors appear to need a fresh energy boost — something cheerier than the Venezuela headlines, which remain clouded by political and geopolitical uncertainty.
Perhaps today’s jobs data could do the trick. Later today, the US will release the official December employment report. The economy is expected to have added around 66k nonfarm jobs, average earnings may have slightly accelerated, and the unemployment rate is seen easing from 4.6% to 4.5%.
The thinking goes as follows: a softer-than-expected print could revive Fed cut expectations, pull yields lower and support risk assets — with smaller and more cyclical parts of the market benefiting more than big, tech-heavy names. A stronger-than-expected report could push yields higher and weigh on equity valuations, in which case cash-rich tech companies may outperform. That said, a too-soft report could also be negative for sentiment.
Heading into the year’s first NFP release, the probability of a March rate cut sits around 40%, down from closer to 50% earlier in the week. The US 2-year yield — which best captures Fed rate expectations — hovers near 3.50%, while the 10-year yield continues to push higher as investors also assess Trump’s renewed military ambitions and their budgetary implications.
Speaking of the budget, all eyes are on the US Supreme Court today, which is expected to deliver its view on Donald Trump’s tariffs. More than 1,000 companies, including Costco and Goodyear, have filed legal challenges seeking potential refunds should the Court rule the tariffs unlawful. Significant sums are at stake. The Trump administration has reportedly collected $133bn in duties under emergency authority as of December 14. If deemed illegal, those funds would need to be returned — a scenario Trump has described as a “national security catastrophe.”
For markets, it would be a budget catastrophe. Tariff revenues have helped partially offset Trump’s “Big and Beautiful” spending ambitions, contributing to keeping long-term rates in check — alongside the Treasury’s shift toward issuing shorter-dated debt to limit upward pressure on longer-term yields that feed through to mortgages and the broader economy.
Returning those funds would weigh heavily on investor sentiment and could reignite a US bond selloff. Higher yields would likely dampen risk appetite and could trigger a broader global selloff.
That said, US budget concerns have a long track record of being forgotten quickly. With or without tariffs, US debt continues to balloon, now standing above $38.5trn and rising steadily. Only genuine fiscal discipline could reverse this trend – if anyone cares.
Budget discipline, however, appears unlikely under Trump. His latest call for a $500bn increase in annual defence spending could, he argues, be financed through tariff revenue. But the non-partisan Committee for a Responsible Federal Budget has questioned the maths, noting that the proposed military spending would be roughly twice the tariff revenue generated over the next decade. And that’s before considering the risk of tariff revenues disappearing altogether — a scenario that would put renewed upward pressure on long-dated US yields. Oh well..
Broadly, there is little doubt that the debasement trade remains alive in this environment, continuing to favour hard assets — particularly precious and industrial metals.
US December Jobs Report in Focus
In focus today
In the US, the December Jobs Report is released. We expect recovering jobs growth at +80k, and unemployment rate at 4.5%. High-frequency indicators have pointed towards recovering labour demand towards the end of the year, and late seasonal hiring could still provide a lift for the December figures. In addition, University of Michigan's first consumer sentiment survey of the year will be released in the late afternoon.
The US Supreme Court could rule on President Trump's use of emergency tariff powers under the International Emergency Economic Powers Act (IEEPA) this afternoon. If the court rules against Trump, we expect the administration to quickly rebuild the tariff wall under alternative authorities. Markets will also follow if the court orders the administration to refund the tariff payments that firms have already made. Betting markets currently estimate a 30% chance of the court upholding the tariffs.
In the euro area, we receive the November retail sales data. Retail sales have been significantly higher in 2025 compared to previous years following a rise in the first part of the year. However, in the past five months growth has ended so it will be interesting to see if consumers start to spend more again amid improving household finances.
In Sweden, the GDP indicator and production figures for November will be published. Overall, the macroeconomic outlook has continued to improve towards the end of 2025, according to indicators. Monthly GDP is notoriously volatile but is expected to show an increase today.
In Norway, the December inflation figures will be released. We believe that slowing cost growth, low global inflation and gradually lower rents will contribute to a decline in core inflation. We expect that core inflation in December was about normal, and with somewhat lower inflation than normal in December last year, we expect that core inflation rose to 3.1%. This would likely leave the outlook for monetary policy unchanged.
Economic and market news
What happened overnight
In China, December CPI rose to a 34-month high of 0.8% y/y, driven by higher food prices ahead of the New Year holiday, while full-year inflation sank to a 16-year low, reflecting subdued domestic demand. PPI deflation persisted at -1.9% y/y in December, suggesting ongoing overcapacity and price competition among producers.
What happened yesterday
In geopolitics, the US Senate voted 52-47 to advance a resolution limiting President Trump's ability to take further military action against Venezuela without congressional approval. The move follows the capture of Venezuelan President Nicolas Maduro, raising concerns over a prolonged campaign. The resolution faces steep hurdles, including passing the Republican-led House and overcoming an expected Trump veto. Meanwhile, Trump stated that US oversight of Venezuela, including control of its oil revenue, could last for years, describing plans to rebuild the nation "in a very profitable way."
US officials are reportedly discussing lump sum payments to Greenlanders to encourage them to secede from Denmark and potentially join the US, with figures ranging from USD 10,000 to USD 100,000 per person. Denmark and Greenland have rejected the idea, with the support of European leaders.
In the US, jobless claims landed close to expectations at 208k (SA), with non-seasonally adjusted claims reaching 300k due to typical year-end layoffs of holiday workers. December's announced layoffs dropped to 35.5k according to the Challenger Report, the lowest since July 2024, while hiring announcements remained subdued at 10.5k. Additionally, flash Q3 productivity data showed a sharp acceleration (+4.9% q/q AR), causing unit labour cost growth to slow significantly to -1.9% q/q AR or +1.2% y/y. With unit labour costs historically correlated to inflation, the productivity uptick could help ease price pressures moving forward.
Defence stocks rallied after President Trump proposed increasing the 2027 military budget to 1.5 trillion, significantly above the current budget authority of 925 billion. Northrop Grumman and Lockheed Martin rose 2.4% and 4.3% respectively, rebounding from Wednesday's declines following Trump's threats to block dividends and buybacks unless production accelerates. European defence stocks also gained but began losing momentum later in the session.
In the euro area, the unemployment rate declined to 6.3% in November after being steady at 6.4% in the previous six months. The number of unemployed persons fell by 74 thousand, driven by declines in both Spain, France and Italy while German unemployment was slightly higher. The labour market thus tightened towards the end of 2025 which is a key argument for the hawks in the ECB arguing for not lowering rates further, in combination with elevated wage growth.
In Sweden, December flash inflation surprised on the downside, with CPIF excl. energy at 2.3% y/y (cons: 2.6%). Core inflation remains above target but has now undershot expectations for two consecutive months. November's sharp decline of -0.6% m/m has not rebounded as anticipated, with December's monthly change at 0.3% m/m, within a normal range. Further details explaining the downside surprise will be released next week.
In Norway, manufacturing production increased by 2.4% m/m in November. However, the 3M/3M growth declined further from -0.5% to -0.9%, reflecting a continued downward trend in manufacturing activity, driven by weakness in non-oil-related industries.
Equities: Equities edged lower yesterday, but the more important signal remains the underlying rotation dynamics. Several cyclical indices ended the session in positive territory, including both the Dow and the S&P 500. Notably, the S&P 500 equal-weight outperformed the market cap weighted index by approximately 110bp. Add to this picture the Russell 2000 up by 1.1% yesterday, and looking globally, small caps outperformed large caps for the fifth consecutive session.
In other words, 2026 has started with a clear rotation and a broadening out of last year's equity rally, rather than a continuation of narrow leadership. In the US yesterday, Dow +0.5%, S&P 500 +0.01%, Nasdaq -0.4%, and Russell 2000 +1.1%. This morning, Asian equity markets are mixed. Futures point to a higher open in Europe, while US futures are modestly lower.
FI and FX: The USD again yesterday followed by the NOK that rebounded on a day of mixed risk sentiment and a rise in US yields and ahead of the release of the US jobs report today. The SEK for once, was one of the weakest performing currencies among the G10. EUR/USD traded around 1.16 with the 10Y US yield rising to 4.18 again. EUR/SEK rose back to around 10.75. EUR/DKK still traded at an elevated level, but the upwards pressure from earlier in the week did show signs of easing yesterday.
Dollar Index (DXY) Extends Corrective Upswing, Bearish Trend Intact
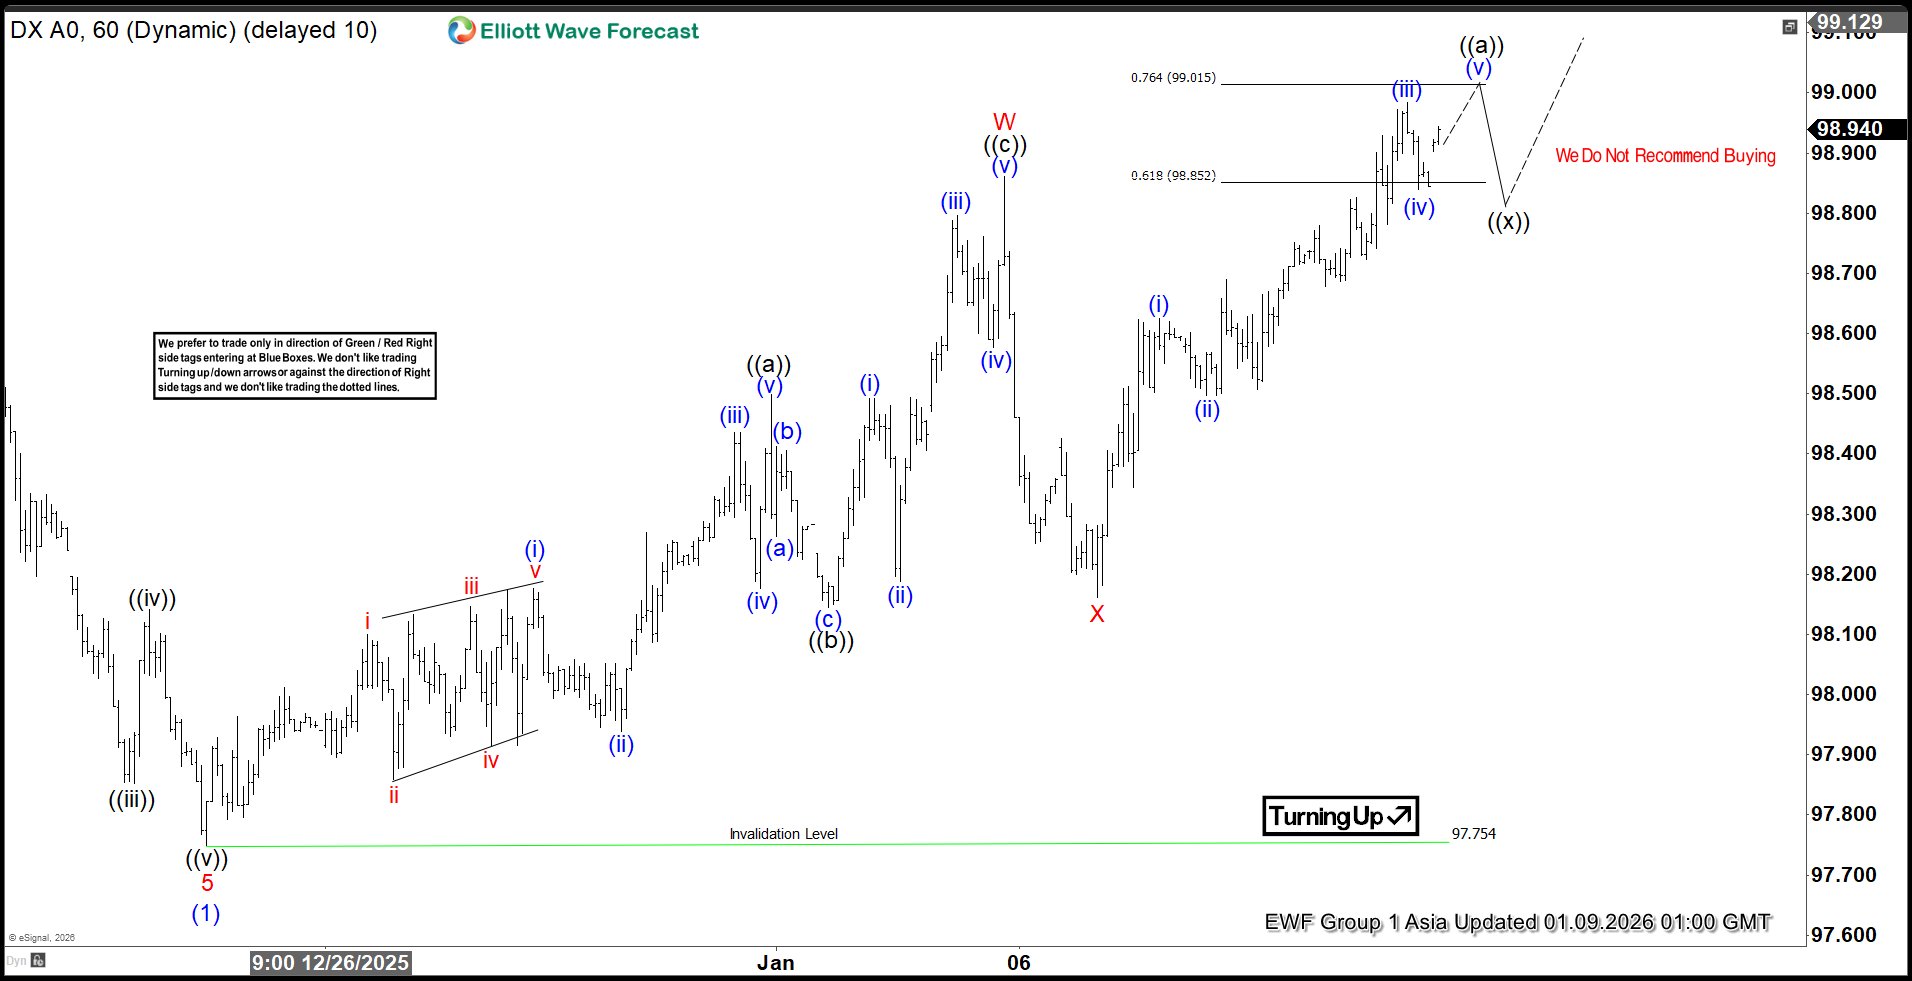
The short-term sequence from the December 24, 2025 low is unfolding as a double three Elliott Wave structure. From that low, wave ((a)) advanced to 98.5. A corrective pullback in wave ((b)) followed and ended at 98.14. Wave ((c)) then moved higher, reaching 98.86, which completed wave W at a higher degree. Afterward, wave X retraced and finished at 98.16.
From this point, the Index resumed its upward path in wave Y. This leg subdivides into another zigzag of lesser degree. Rising from wave X, the Index appears ready to extend one more push higher to complete wave ((a)). Once that advance is achieved, a corrective pullback in wave ((b)) should unfold. This correction will adjust the cycle that began from the January 6, 2025 low. Afterward, the sequence is expected to resume higher.
The potential target for the next advance is defined by the 100% to 161.8% Fibonacci extension of wave W. This zone lies between 99.2 and 100. Sellers are likely to emerge in this area, producing either renewed downside pressure or at minimum a three-wave corrective pullback.
In the near term, as long as the pivot at 97.75 remains intact, pullbacks should find support within the 3, 7, or 11 swing sequence. Traders should remain attentive to the 99.2–100 region. It represents a critical juncture for the next directional move and will likely determine whether the Index continues higher or pauses for a deeper correction.
Dollar Index (DXY) 60 minute chart from 01.09.2026 update
DXY Elliott Wave video:
https://www.youtube.com/watch?v=vO9uzgYc7zA
USD/JPY Flirts With Breakout Ahead of Crucial NFP Release
Key Highlights
- USD/JPY started a fresh increase above 156.00.
- A major contracting triangle is forming with support at 156.35 on the 4-hour chart.
- EUR/USD could extend losses if it breaks the 1.1650 support.
- The US nonfarm payrolls could change by 60K in December 2025.
USD/JPY Technical Analysis
The US Dollar stayed above 155.50 and started a fresh increase against the Japanese Yen. USD/JPY settled above 156.00 to avoid a downside break.
Looking at the 4-hour chart, the pair slowly moved higher above 156.50 and now faces many hurdles. Immediate resistance sits near 157.10. The first key hurdle is seen near 157.30. A close above 157.30 could open the doors for a move toward 157.75.
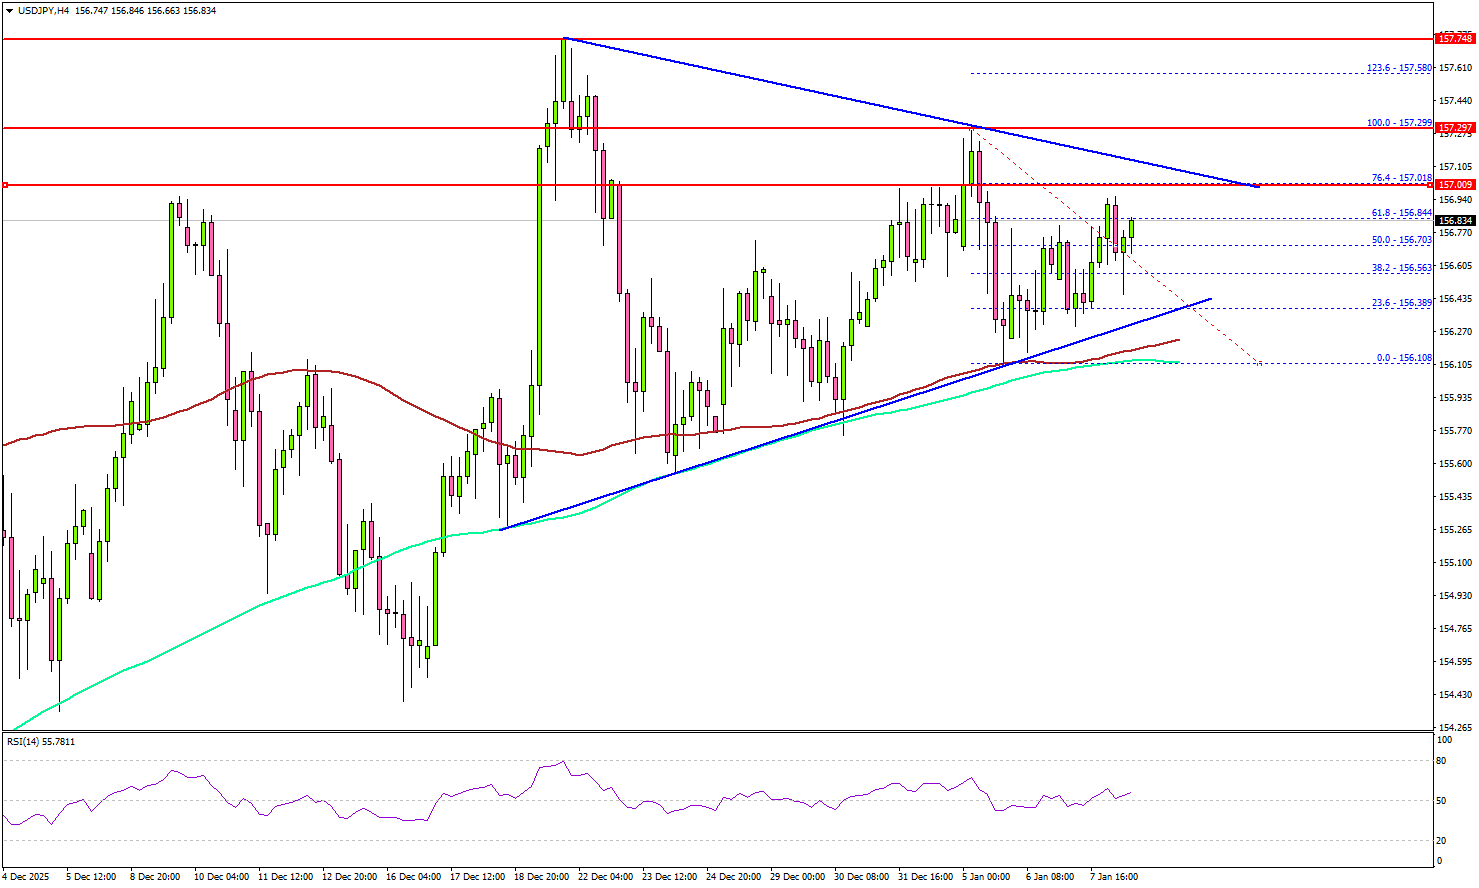
Any more gains could set the pace for a steady increase toward 158.00. If there is no break above 157.10, there could be a bearish reaction.
On the downside, immediate support is near the 156.40 level. There is also a major contracting triangle forming with support at 156.35. The first major area for the bulls might be near 156.10, the 100 simple moving average (red, 4-hour), and the 200 simple moving average (green, 4-hour).
A close below 156.10 might spark heavy bearish moves. The next support could be 155.50, below which the bears might aim for a move toward 155.00.
Looking at EUR/USD, the bears remain in action, and they could soon aim for a sustained move below 1.1650.
Upcoming Key Economic Events:
- US nonfarm payrolls for Dec 2025 – Forecast 60K, versus 64K previous.
- US Unemployment Rate for Dec 2025 - Forecast 4.5%, versus 4.6% previous.