Sample Category Title
Japan Signals Resolve at 160 Yen; Joint Intervention Talk and BoJ Speculations
Yen is once again attempting to recover from its recent sharp losses, with momentum this time supported by a more forceful policy backdrop. Japanese authorities have stepped up verbal intervention, and crucially, officials have gone beyond routine warnings and have explicitly flagged the possibility of joint action with the US. Additionally, combined with speculation of earlier BoJ rate-hike , this has strengthened the perception that Japan is increasingly determined to defend the 160 level against Dollar.
That shift matters for positioning. After weeks of one-way yen selling, this week’s developments argue that Tokyo is no longer comfortable letting depreciation run unchecked. With that resolve now more visible, speculators may be reluctant to test the authorities aggressively in the near term, opening scope for a more sustained rebound in USD/JPY.
Japanese Finance Minister Satsuki Katayama reinforced the message on Friday, saying the government is ready to take “decisive action” to stem Yen’s continued fall. “I have repeatedly said that we will take every possible measure,” she told reporters. Katayama pointed specifically to last September’s joint statement with the US, emphasizing that its language on intervention was deliberate. Importantly, she stressed that the statement does not specify whether intervention must be coordinated, adding that “no options are excluded.”
Monetary policy expectations are also in flux. According to a Reuters report, some BoJ policymakers see scope for raising rates earlier than markets expect, with April under discussion if Yen weakness amplifies inflationary pressures. That view contrasts with broader market consensus. Analysts polled by Reuters still expect the BoJ to wait until July before hiking again, with more than 75% forecasting rates to reach 1% or higher by September. Still, the gap between official thinking and market pricing is narrowing.
Sources suggest some policymakers are willing to move sooner if evidence builds that Japan can sustainably meet its 2% inflation goal. The BoJ is also expected to revise up its fiscal 2026 growth and inflation projections at next week’s meeting, adding to the sense of policy optionality. That said, there remains no consensus within the policy board. Governor Kazuo Ueda has consistently signaled caution, stressing the need to assess how previous rate hikes affect a still-fragile economy before committing to faster normalization.
In FX performance terms this week, Kiwi remains the strongest, lifted again by robust domestic manufacturing data released today. Aussie follows, supported by stable risk sentiment, with Loonie third as it digests recent losses. Euro is the weakest, followed by the Swiss franc and then Yen, which has stabilized but not yet decisively turned. Sterling and Dollar are trading in the middle of the pack.
ECB’s Lane: Remarkably stable baseline leaves no near-term rate debate
ECB Chief Economist Philip Lane said the Eurozone is now in a “remarkably stable situation,” arguing there is "no near term interest rate debate" under the central bank’s baseline scenario. Speaking in an interview with La Stampa, Lane said the current policy setting is consistent with inflation staying around target, growth close to potential, and low, declining unemployment.
Lane stressed that the current level of interest rates provides the baseline for “the next several years.” With the economy expected to grow in the neighborhood of its potential rate, he said it would take a significant acceleration in activity to push outcomes meaningfully above the baseline and trigger a policy response.
One alternative scenario he flagged was a major global disruption similar to 2021–2022, involving supply-chain bottlenecks. Lane described this as a “nightmarish” outcome, noting it would also carry recessionary forces rather than a clean inflationary impulse.
NZ BNZ PMI surges to 56.1, a four-year high
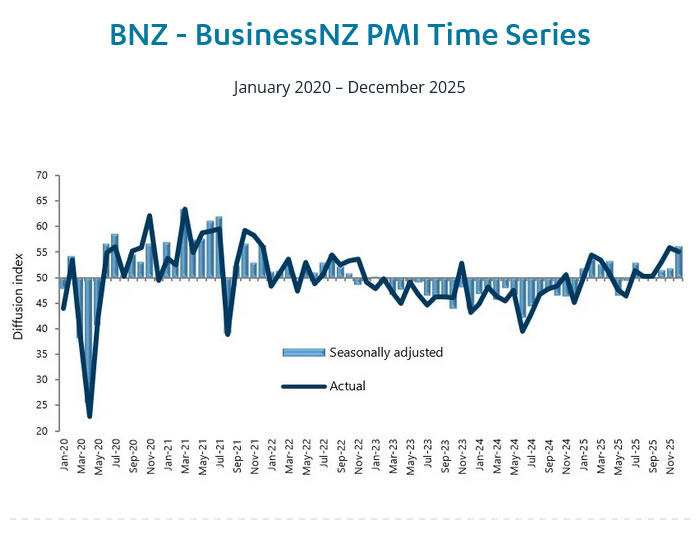
New Zealand’s manufacturing sector ended 2025 on a strong footing, with the BusinessNZ Performance of Manufacturing Index jumping sharply from 51.7 to 56.1 in December. The reading marked the highest level of activity since December 2021 and moved decisively above the long-run average of 52.5.
The rebound was broad-based. Production rose from 53.2 to 57.4, while new orders surged from 52.5 to 59.8, pointing to strong demand momentum. Employment also improved, climbing from 52.6 to 53.8, suggesting firms are beginning to respond to higher workloads. Positive commentary from respondents increased to 57.1%, up from 54.4% in November and just 45.9% in October.
BNZ Senior Economist Doug Steel said the PMI is positive for Q4 GDP calculations and points to good momentum heading into the new year, flagging "upside risks" to already constructive near-term growth forecasts.
USD/JPY Daily Outlook
Daily Pivots: (S1) 158.26; (P) 158.57; (R1) 158.94; More...
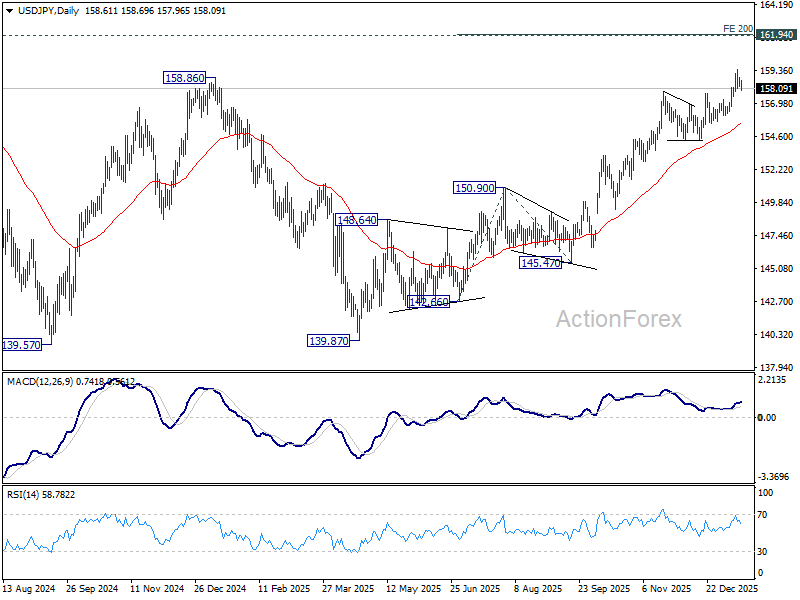
USD/JPY's retreat from 159.44 extends lower today. Intraday bias remains neutral for the moment, and deeper fall could be seen. But downside should be contained above 156.10 support to bring another rally. On the upside, above 159.44 will resume larger rise from 139.87. Next target is 200% projection of 142.66 to 150.90 from 145.47 at 161.95, which is close to 161.94 high.
In the bigger picture, corrective pattern from 161.94 (2024 high) could have completed with three waves at 139.87. Larger up trend from 102.58 (2021 low) could be ready to resume through 161.94. Decisive break of 158.85 structural resistance will solidify this bullish case and target 161.94 for confirmation. On the downside, break of 154.38 support will dampen this bullish view and extend the corrective range pattern with another falling leg.
ECB’s Lane: Remarkably stable baseline leaves no near-term rate debate
ECB Chief Economist Philip Lane said the Eurozone is now in a “remarkably stable situation,” arguing there is "no near term interest rate debate" under the central bank’s baseline scenario. Speaking in an interview with La Stampa, Lane said the current policy setting is consistent with inflation staying around target, growth close to potential, and low, declining unemployment.
Lane stressed that the current level of interest rates provides the baseline for “the next several years.” With the economy expected to grow in the neighborhood of its potential rate, he said it would take a significant acceleration in activity to push outcomes meaningfully above the baseline and trigger a policy response.
One alternative scenario he flagged was a major global disruption similar to 2021–2022, involving supply-chain bottlenecks. Lane described this as a “nightmarish” outcome, noting it would also carry recessionary forces rather than a clean inflationary impulse.
NZ BNZ PMI surges to 56.1, a four-year high
New Zealand’s manufacturing sector ended 2025 on a strong footing, with the BusinessNZ Performance of Manufacturing Index jumping sharply from 51.7 to 56.1 in December. The reading marked the highest level of activity since December 2021 and moved decisively above the long-run average of 52.5.
The rebound was broad-based. Production rose from 53.2 to 57.4, while new orders surged from 52.5 to 59.8, pointing to strong demand momentum. Employment also improved, climbing from 52.6 to 53.8, suggesting firms are beginning to respond to higher workloads. Positive commentary from respondents increased to 57.1%, up from 54.4% in November and just 45.9% in October.
BNZ Senior Economist Doug Steel said the PMI is positive for Q4 GDP calculations and points to good momentum heading into the new year, flagging "upside risks" to already constructive near-term growth forecasts.
Dollar Holding Recent Gains
Markets
Geopolitical tensions yesterday receded as a driver for global trading. President Trump taking a more guarded tone regarding direct action against Iran halted the recent upward squeeze in the oil price. Brent returned below $64/b. The ‘safe haven/scarcity‘ rally in gold and sliver that recently also spilled-over to other industrial metals (copper, thin,…) also fell prey to some profit taking. It has often been different of late, but in this (temporary?) more benign geopolitical context, US eco data even play a role in intraday price action. US weekly jobless claims (198k) eased back to sub 200k levels. The New York Fed Empire manufacturing survey (7.7 from -3.7, with strong orders and shipments) and the Philly Fed business outlook (12.6 from -8.8 also with solid underlying details) printed strong. These series are no game-changers regarding the broader eco picture and their message still can be contradicted by other more high profile releases. Still, they confirm the view that the Fed is right in its assessment that the US economy is holding up rather well and that no immediate stimulus is needed, especially not as inflation is holding above target. After a risk-off driven bull flattening on Wednesday, the US yield curve yesterday bear flattened with yields rising between 5.5 bps (2 & 5 y) and 1.2 bps (30-y). Moves in Europe stayed more benign with the German 2-y yield adding 2.6 bps. The 30-y still eased 1.8 bps. Decent data and some easing in geopolitical tensions was enough to inspire a bid on global equity markets (Dow & Eurostoxx +0.6%). Still the dollar outperformed (DXY close 99.3) EUR/USD is struggling not to fall below the 1.16 barrier. The yen-decline took a breather after the announcement of new elections (USD/JPY 158.6), but the (yen)-picture remains fragile. UK yields rebounded 3.5-5.5 bps across the curve on better UK monthly GDP/production data, but it didn’t help further sterling gains. EUR/GBP even rebounded from the 0.8650/55 support area to close at 0.8675.
Asian equities show a mixed picture today, with Japan and China suffering modest losses. US futures are gaining slightly (S&P +0.3%). The dollar is holding its recent gains (DXY 99.35, EUR/USD 1.1605). The eco calendar again only contains second tier eco data (NY Fed services activity, US production data, NAHB housing index). US markets are also preparing for a long weekend (Martin Luther King Day on Monday). A long weekend in the current uncertain (geopolitical) context might cause some cautious positioning. The technical picture in the likes of DYX and EUR/USD (break above 99.25 and below 1.161) at least suggests an ongoing constructive USD-momentum for now.
News & Views
The European Commission in reviewing the EU accession rules is considering to replace the current system with a two-tier model, the Financial Times reported. Under the current 30-yr old system, an EU member state candidate can only enter when it ticks all the boxes, including adopting huge amounts of EU regulation. The new model under discussion would allow for fast-tracking a candidate’s entry. After joining, the country would hold far less decision-making power, stripped from voting rights at leaders’ summits for example, and gain incremental access to parts of the bloc’s single market as well as funding and subsidies, after meeting post-membership milestones. The proposal is specifically being considered for Ukraine. As part of the US-led peace plan, the country is allowed to join the EU. But officials note it could take a decade of reform for Ukraine to meet the current EU accession rules and understand that president Zelenskyy can probably only accept other parts of the peace deal (including territorial concessions) if he has short-term EU membership to showcase in return. The EC’s proposal is highly contentious with some fearing it waters down the value of membership and may undermine stability in the bloc.
The US and Taiwan signed a trade agreement yesterday that slashes the current 20% tariff rate on Taiwanese imports to 15%. That’s in line with regional peers including Japan and South Korea. The deal also waives tariffs on generic drugs, aerospace parts and natural resources that are unavailable in the US and offers Taiwan a most-favoured nation treatment. In return, Taiwan pledges a $250bn investment in the chip industry in the US and tariff-free imports of chips to the US are subject to a quotum. President Trump has previously threatened to impose a 100% levy on semiconductors, which would significantly weigh on Tawain as being the world’s most important producer. Some in Taiwan, however, criticize the agreement as moving the chip industry out of the country and thereby disincentivizing Washington to protect Tapei against a possible Chinese attack.
Revisiting the AI trade
Yesterday was refreshing in the sense that we briefly went back to the optimistic, euphoric mood of the past three years, with AI dominating headlines for the right reasons — strong numbers from TSMC and a very strong market reaction.
TSMC was relatively timid during the Asian session, likely reflecting uncertainty around reports that Nvidia could face tariffs of up to 25% on H200 chip exports to China. There were also lingering concerns over US-Taiwan trade negotiations, with Washington pushing TSMC to invest more heavily in US-based chip manufacturing. That demand is not only costly upfront — the company is committing around $165bn to build six fabs — but would also raise operating costs by an estimated 30–50% compared with production in Taiwan.
Those worries largely evaporated once Western markets stepped in. AI-related stocks ended the day firmly higher: TSMC rose more than 4% in New York, ASML jumped 6% to a fresh record in Amsterdam, and VanEck’s Semiconductor ETF gained around 2%.
Optimism was further boosted by news of a trade agreement between the US and Taiwan, reportedly bringing the tariff rate to 15%. The S&P 500 closed near record levels.
That said, it’s worth noting that most candlesticks on my daily charts were red, suggesting the session was not outright positive. Early strength faded into the close as investors spent much of the day trimming gains and reassessing the news flow. Is the news really that good?
As we dive into the heart of earnings season in the coming weeks, tech results will be scrutinised in far greater detail. Recall that last earnings season delivered blowout headline numbers from Big Tech, but in some cases those figures were wearing a bit of make-up. Think Meta offloading the bulk of its AI data-centre financing to private credit players such as Blue Owl and Pimco — and Nvidia booking revenues that have not yet turned into cash.
Concerns around circular AI deals, leverage and delayed returns on investment remain front of mind for investors. These are compounded by rising electricity and metals costs, higher memory-chip prices, and the risk of supply disruptions — including China’s threats to restrict rare-earth exports amid geopolitical tensions involving Iran and Venezuela, where China has historically sourced oil.
All of this suggests that this earnings season may not be a walk in the park. These “details” — or elephants in the room — will matter just as much as the shiny headline figures. AI stocks are valued to perfection and leave no room for error. As we head into earnings, it increasingly feels as though Big Tech’s ability to impress is diminishing, a risk that matters given its outsized weight in equity indices. Recently, the S&P 500 fell despite around 300 stocks closing higher — it was tech that dragged the index down.
If that dynamic persists, and tech earnings fail to reignite investor enthusiasm, the rotation trade is likely to continue. The equal-weighted S&P 500 has been playing catch-up with the market-cap-weighted, tech-heavy version, while US small caps have outperformed the S&P 500 for a tenth consecutive session — something we haven’t seen in a long time. That trend should continue as long as risk appetite remains intact.
For now, risk appetite is being supported by renewed Federal Reserve (Fed) liquidity. A small but notable uptick in the Fed’s balance sheet suggests the central bank is back in the market — not buying the same assets as before, but adding liquidity nonetheless. And liquidity always has to find a home.
Banks kicked off earnings season this week with broadly positive results. While price action earlier in the week failed to reflect those results — with markets focused on the White House’s proposed 10% cap on credit-card interest rates — Goldman Sachs and Morgan Stanley reversed selling pressure yesterday with blockbuster numbers. Both posted record revenues, and both stocks hit all-time highs. Their long-term charts now make the 2008 drawdown look almost insignificant.
One of the biggest energy boosts for banks right now is AI — and we’ve been saying it all along: AI is not just a tech story. Goldman’s CEO pointed to the “tremendous public and private capital” flowing into AI (surprised?), while Morgan Stanley’s CFO noted that “the need for capital-markets and structuring expertise across the AI ecosystem is clearly there.” Hell yeah —look at Meta, structuring debt in a way that makes its balance sheet look like a fresh sheet of paper.
The risk, however, is that investors now want returns — and they want them before AI infrastructure risks becoming outdated.
Zooming out briefly to macro data: the Philly Fed and Empire Manufacturing indices surprised to the upside yesterday, while US initial jobless claims fell last week. That combination suggests the Fed may be in no rush to cut rates further. The US 2-year yield, which captures rate expectations, climbed to a five-week high, pushing the dollar index toward the 100 mark. Crude oil fell sharply — around 4% — on signs of de-escalating tensions around Iran, while precious metals retreated. That said, the hammer formation in silver suggests dip-buyers remain active, and I still expect a move toward $100 per ounce before a more meaningful pullback.
There is little doubt that a 10–20% correction will hit at some point — the question is when. Over the medium term, the debasement trade should continue to weigh on the dollar and support metals prices.
Finally, for investors concerned about a commodity-led inflationary cycle, building exposure to commodities remains one of the most effective hedges.
US December Industrial Production Data Wraps Up the Week
In focus today
- In the US, December industrial production data is due for release. Leading manufacturing indicators pointed towards muted activity growth towards the end of the year.
- In Sweden focus shifts to a speech by Erik Thedéen on the topic "Why has consumption been weak?". This has obviously been the case over the past couple of years, but in recent figures we can now see that household consumption is indeed picking up. The outlook for household consumption in 2026 is bright, supported by tax cuts, the Riksbank's interest rate cuts during 2025 and the recovering labour market. Thedéen's speech will be published on the Riksbank homepage at 8.30 CET.
Economic and market news
What happened overnight
US-Taiwan trade deal puts Asian chip stocks in focus. The US and Taiwan have signed a semiconductor-focused trade agreement, lowering reciprocal US tariffs on Taiwanese goods to 15% and securing over USD 250bn in Taiwanese investment in US chip production, led by companies like TSMC. The deal aligns with Washington's strategy to reshore supply chains and bolsters domestic manufacturing. It follows the recent US decision to impose a 25% tariff on specific AI chips to further incentivise local production. While economically significant, the agreement is likely to heighten geopolitical tensions, with China expected to resist deeper economic ties between the US and Taiwan.
What happened yesterday
In the US, both the Philly and NY Empire manufacturing indices exceeded expectations in January. While these indices are highly volatile month-to-month, making single prints less significant, new orders and CAPEX plans appear to be improving. Weekly jobless claims also surprised positively, with only 198k claims against the expected 215k. However, releases near year-end are heavily influenced by seasonal adjustments.
In Sweden, the final December inflation figures confirmed the flash estimate, showing CPIF excluding energy at 2.3%, CPIF at 2.1%, and CPI at 0.3% y/y. Core inflation (CPIF) significantly undershot expectations of 2.6%, mainly due to lower-than-expected prices for furniture and household goods. This decline in goods inflation may partly reflect Sweden's stronger currency.
In Norway, the SSB industrial confidence indicator showed improvement, with Q1 expectations rebounding after a weak Q4 2025. Production and new orders increased across all sub-sectors, alongside a slight rise in employment. While capacity utilization stabilized, it remains far below historical average. Overall, the report was slightly more optimistic but is unlikely impact markets.
In Germany, the economy grew 0.2% y/y in 2025, as expected, following a 0.5% y/y contraction in 2024. This marks the first year of growth since 2022, driven by both private and government consumption while exports and investments continued to decline. Early estimate for Q4 2025 indicates 0.2% q/q SA growth. Although modest, it is encouraging that that the German economy ended the year with growth.
In the UK, November GDP growth reached 0.3% m/m (cons: 0.1% m/m), supported by solid performance in the service sector. This improvement follows a weak second half of 2025 and reduces the urgency for further BoE rate cuts. Currently the March meeting is priced just below 50-50 for a cut.
Equities: Equities rose yesterday supported by strong earnings reports and solid macro data. Global equities rose 0.2% with S&P500 rising +0.3%, Nasdaq +0.2% and Russell2000 +0.9%, cementing the changed equity narrative with small caps outperforming here at the start of 2026. In fact, it was the 10th consecutive day of small caps beating the S&P500, which has not happened since 2008. With the positive economic data releases, strong earnings, higher equities and the higher yields, the market reaction can best be described as risk-on. And this, also when looking at the sector performance of the equity market (only comms were down). Overnight, futures are in green by about 0.3%.
FI and FX: European FX generally had a poor session yesterday with the Scandies and the CEEs leading losses. EUR/USD traded down towards the 1.16-level yesterday due to an underperformance in US yields driven by stronger US data. The dollar has weakened slightly overnight, with the USD/EUR trading around 1.1610 and USD/JPY moving lower overnight as the Japanese finance minister Katayama voiced concerns over recent weakness, suggesting an intervention could be considered.
Yesterday, we published our first edition of Reading the Markets Nordics this year in which we present our 12 fixed income and foreign exchange top trade ideas across our Nordic markets for 2026.
Cliff Notes: Uncertainty on Many Fronts
Key insights from the week that was.
In Australia, this week’s dataflow kicked off with a strong reading from the household spending indicator, lifting 1.0% (6.3%yr) in November. Gains were broad-based across goods and services, up 0.9% and 1.2% in the month respectively, driven by a combination of concerts, sporting events and Black Friday sales. Our timelier measure of card activity is consistent with this and suggests official measures of nominal spending could print close to 2% in Q4. However, it does appear that momentum faded in last couple weeks of 2025 and the start of 2026, although given shifting seasonal patterns, it is difficult to make a full assessment of the underlying pulse.
Still, the re-emergence of outright pessimism in the January Westpac-MI Consumer Sentiment survey provided another reason to be wary of the underlying strength of consumer spending. The headline index slipped 1.7% to 92.9 in January, marking the weakest reading in three months. Consumers have swiftly recalibrated their interest rate expectations in response to higher inflation and more hawkish rhetoric from the RBA – nearly two thirds of consumers anticipate higher mortgage rates over the coming year. This is predominately weighing on households’ expectations, especially for family finances and economic conditions for the year ahead, with both sub-indexes falling below January 2025 levels.
That said, assessments of the current situation remain intact, namely the ‘family finances vs a year ago’ and ‘time to buy a major household item’ sub-indexes, which are 6.5% and 9.1% higher than January 2025 levels respectively. The labour market has played a key supporting role, although it showed some signs of gradual softening over the second half of last year. This week, it was revealed that the total stock of job vacancies edged slightly lower into year-end (–0.2%) and the vacancy-to-unemployment ratio (a broad measure of ‘slack’) continues to move toward more normal levels from an elevated starting point.
Ultimately, prospects for the consumer this year remain uncertain, stemming from various possibilities when it comes to the path for inflation, interest rates and the labour market. In particular, households are clearly concerned about the possibility of rate rises, which if borne out, could hamper the consumer recovery further. Westpac believes that the RBA does not need to tighten policy this year, given relatively more benign inflation pressures across market goods and services ahead and a gradually softening labour market.
Offshore, news was centred around the US.
Markets were squarely focussed on the US Department of Justice's probe into FOMC Chair Powell and the Federal Reserve, allegedly at US President Trump’s urging. The probe follows Chair Powell's comments in the June Congressional hearing alongside the out-of-budget renovations of the Federal Reserve Building. This is being interpreted as an attack on central bank independence and yet another attempt by the US administration to influence monetary policy. Chair Powell made a statement to reaffirm his commitment to remaining apolitical in policymaking, while other central bank heads, including RBA Governor Michele Bullock, co-signed a letter in support of Chair Powell. As Chief Economist Luci Ellis elaborates, this public support reflects the shared values of these policymakers and the role of institutions like the BIS to build solidarity.
On data, the December CPI surprised to the downside rising 0.3% in the month and 2.7% over 2025. Core goods were flat in the month while food (+3.1%) and core services (3.0%) accounted for most of the increase. Shelter remains the most prominent driver of services inflation, though this should ease over the year given early measures of rent inflation are starting to subside. Still, capacity constraints due to the impact of immigration policy and lacklustre non-AI capital investment adds upside risks to inflation.
Non-farm payrolls for December rose by 50k, lower than November's 56k. The unemployment rate fell to 4.4% though much of this was a result of people leaving the labour market -- the participation rate fell slightly to 62.4%. Overall, the data suggests that the labour market is beginning to soften from a broadly balanced starting point.
The January Beige Book was broadly consistent with the latest data. On the labour market, respondents noted there was "an increase in the usage of temporary workers" and that "When firms were hiring, it was mostly to backfill vacancies rather than create new positions". On prices, tariffs were feeding into cost pressures across all districts but contacts in more consumer-focused industries were "reluctant to pass costs along to price-sensitive customers". With inventories of cheaper, pre-tariff inputs being depleted, many firms will be forced to pass on costs gradually through the course of this year.
We anticipate inflation is likely to remain above target through 2026 while risks to the labour market remain. This should see the FOMC deliver one more cut in March to counterbalance risks to the labour market followed by an extended hawkish pause.
USD/JPY Cool-Off Looks Tactical, Not Trend-Breaking
Key Highlights
- USD/JPY started a downside correction from the 159.45 zone.
- A major bullish trend line is forming with support at 157.40 on the 4-hour chart.
- EUR/USD extended losses and traded below 1.1640.
- Gold started a consolidation phase below $4,650.
USD/JPY Technical Analysis
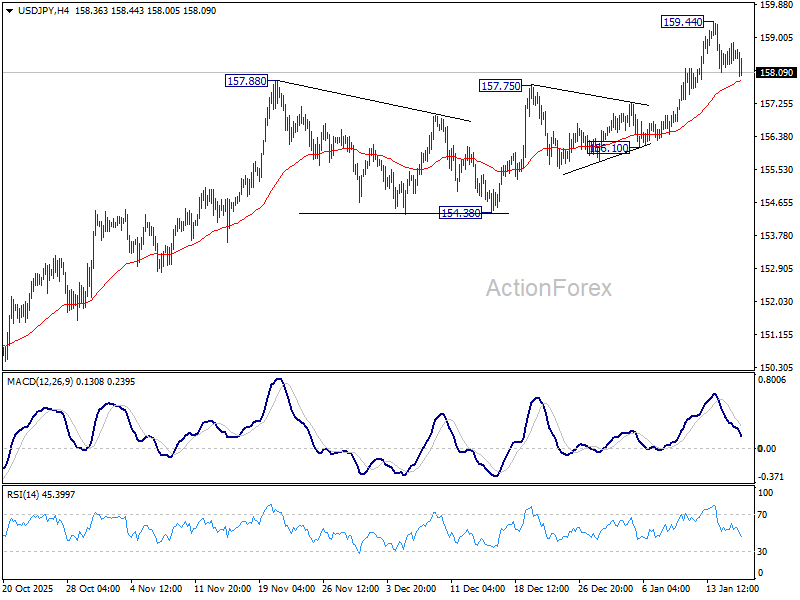
The US Dollar rallied above 158.00 and 159.00 against the Japanese Yen. USD/JPY traded as high as 159.45 and started a downside correction.
Looking at the 4-hour chart, the pair declined below 159.00 and 158.80. There was a move below the 23.6% Fib retracement level of the upward move from the 156.11 swing low to the 159.45 high. It even tested 158.20.
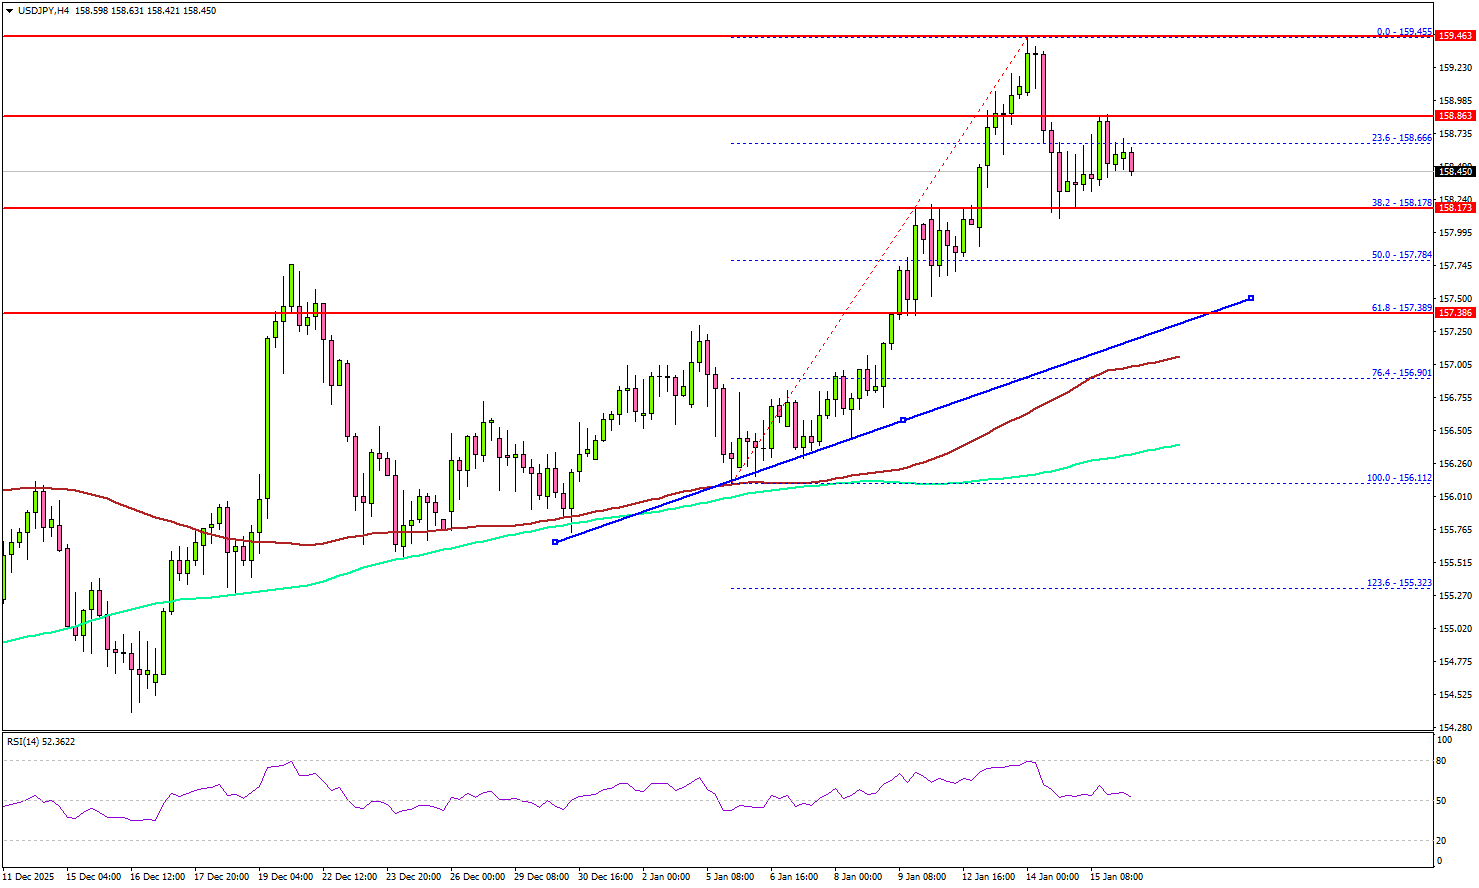
The pair is still well above the 200 simple moving average (green, 4-hour) and the 100 simple moving average (red, 4-hour). There is also a major bullish trend line forming with support at 157.40.
Immediate resistance sits near 158.85. The first key hurdle is seen near 159.00. A close above 159.00 could open the doors for a move toward 159.50. Any more gains could set the pace for a steady increase toward 160.00.
If there is no move above 158.85, there could be a bearish reaction. On the downside, immediate support is near the 158.20 level. The first major area for the bulls might be near 157.40, the trend line, and the 61.8% Fib retracement level of the upward move from the 156.11 swing low to the 159.45 high.
A close below 157.40 might spark heavy bearish moves. The next support could be 156.50, below which the bears might aim for a move toward 155.00.
Looking at Gold, the price started to trade in a range below $4,650 and might correct some gains in the near term.
Upcoming Key Economic Events:
- Fed's Bowman speech.
- US Industrial Production for Dec 2025 (MoM) – Forecast 0.1%, versus 0.2% previous.
WTI Crude Oil: Short-Term Bearish Outlook vs. Long-Term Bullish Reversal Potential
WTI Crude Oil, currently trading near $59.15 as of January 15, 2026, is under pressure following a sharp reversal and failure to hold the $61.00 level, driven by geopolitical volatility and the evaporation of a risk premium. This technical analysis explores the immediate neutral-to-bearish short-term outlook, while noting significant long-term indicators, such as the oversold monthly Stochastic and a 15-year short extreme in the COT report, which suggest the potential for a substantial bullish trend reversal.
Crude oil - Daily chart
Source: Tradingview.com Crude oil daily chart - Past performance is not indicative of future results
- Market Context & Price Action: WTI Crude oil is currently trading around $59.15, having recently undergone a sharp reversal after failing to sustain a breakout above the $61.00 level. The chart reflects a period of heightened volatility triggered by geopolitical developments (specifically regarding US-Iran tensions) that saw a rapid "risk premium" evaporation.
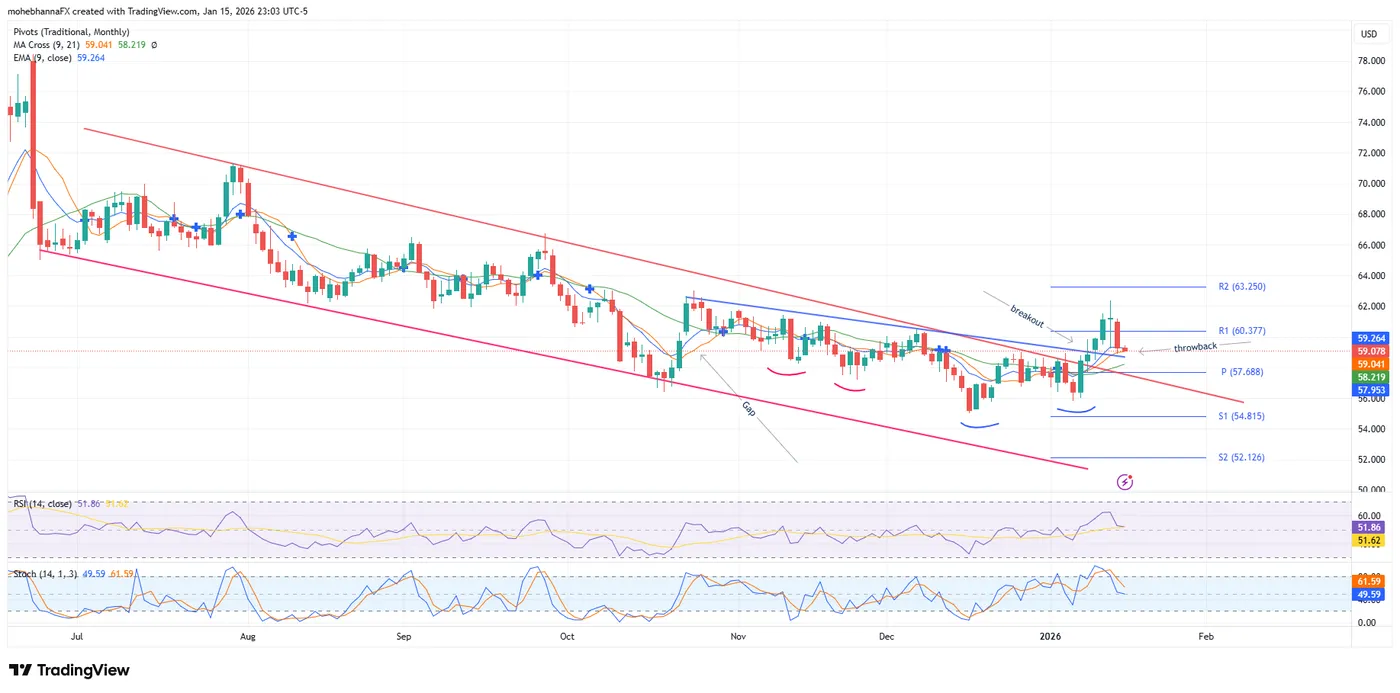
- As of June 2025, crude oil has been trading within a descending Channel, as marked by the red lines on the above chart. On Friday, January 9th, 2026, price action broke above the descending channel's upper boundary and has remained above it since. The break took the price above a confluence of resistance, the intersection of the SMA21, the upper channel boundary, and the monthly PP at 57.68. The broken level has now turned into support.
- Candlestick Analysis: The most recent daily candle is a large red "marubozu-style" or bearish engulfing candle, indicating intense selling pressure and a rejection of the recent multi-day rally.
- Monthly Support/Resistance levels: Pivot Point (P) at $57.68. Above that, resistance is firm at $60.37 (R1) and $63.25 (R2). Immediate support lies at $54.81 (S1).
- Price action broke above a secondary, steeper descending line (blue) and completed a throwback, finding support above the broken level. The fast EMA9 and SMA9 intersect with the blue line, forming an intermediate confluence of support.
- Gap Analysis: A significant price gap from early November (marked on the chart). Gaps often act as "magnets" for price action, even after they have been filled.
- Momentum oscillators: RSI (14): Currently at 52.21. This is a neutral reading, showing that the recent overbought conditions have been reset. However, the sharp downward slope of the RSI line indicates potential decelerating momentum.
- Stochastic (14, 1, 3): The Stochastic Oscillator is at 50.67 and falling. It has fallen below its signal line from a high, confirming short-term weakness.
Crude oil - Monthly chart
Source: Tradingview.com Crude oil monthly chart - Past performance is not indicative of future results
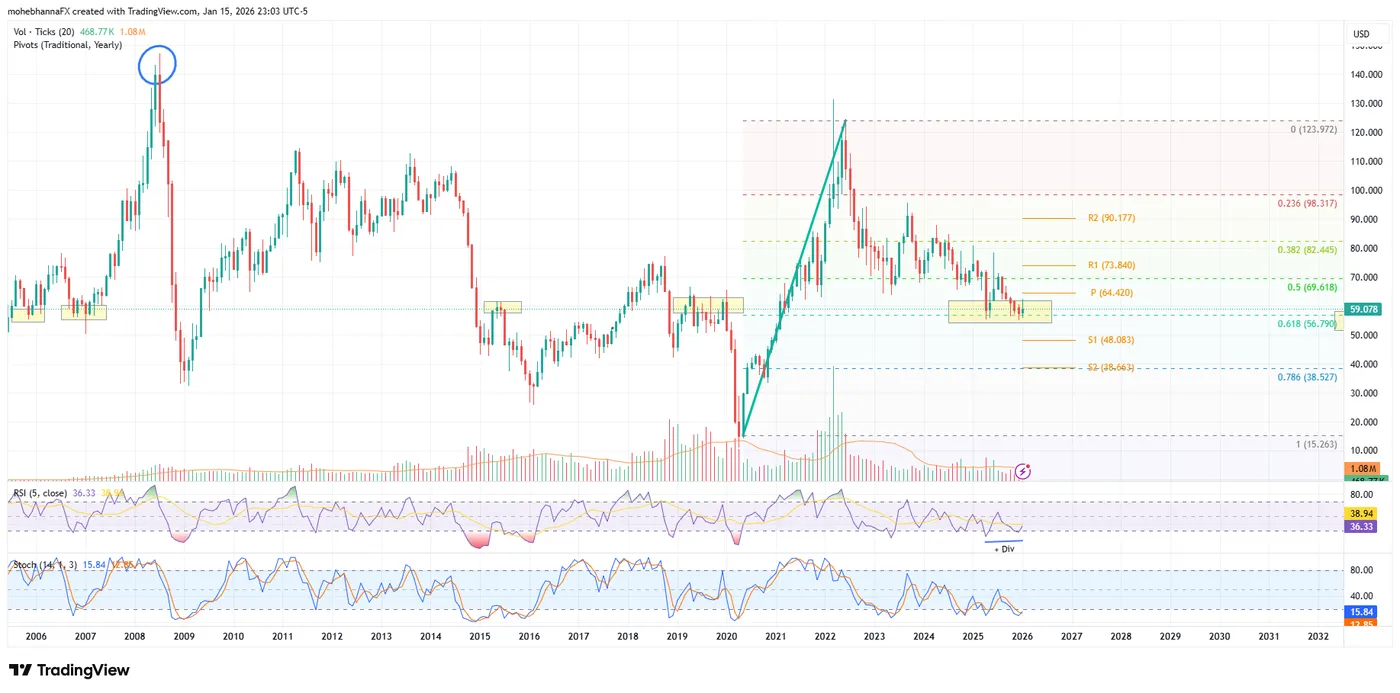
- Applying the Fibonacci retracement (FIB) level to the "V-shaped" recovery from the 2020 lows (green diagonal line), which peaked in 2022 near $123.00, reflects that the current price of $59.22 is situated within a critical technical "battleground" defined by yearly levels.
- This area (highlighted in the yellow box) is a primary long-term support zone where the price has historically encountered support/resistance. The current price action on the monthly chart suggests a potential double bottom is forming.
- Momentum Oscillators: A potential positive divergence may be in play, as RSI is making higher lows while price action is making equal lows. (The potential double bottom)
Stochastic (14, 1, 3): Sitting at 16.40, the Stochastic is in the oversold territory. Historically, readings this low have often preceded a short-term relief rally or a period of stabilization.
Commitment of traders report (COT)
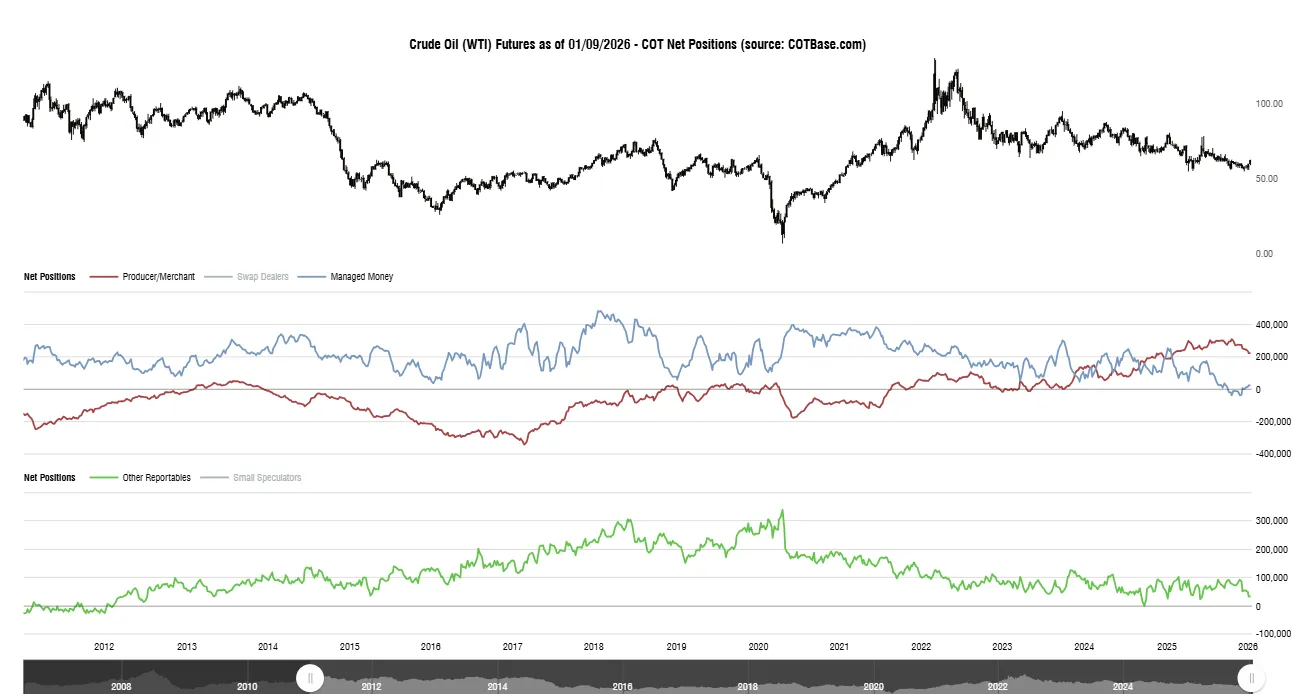
Source: Cotbase.com Commitment of traders - Crude oil COT report
The most recent COT report, released on January 9th, 2026, including data up to January 6th, 2026, reflected that the “Managed money” category has reached a 15-year net short position level extreme, and is currently moving towards net long territory, suggesting that a change in sentiment and a reversal may be in play. Producers/Merchants' positioning is also moving towards short after reaching an all-time high, an extreme long position level.
Conclusion
The technical verdict for WTI Crude Oil is immediately neutral-to-bearish, with the failure to hold above $60.00 and the break below moving averages suggesting the path of least resistance is toward the S1 support level ($54.81). Bulls must secure a daily close back above the Pivot ($57.69) to regain control. This short-term caution, however, is offset by significant long-term indicators: the price is in a critical monthly Fibonacci support zone, the Stochastic oscillator is oversold, and the recent COT report shows a 15-year Managed Money short extreme. Ultimately, while traders should respect the short-term downside risk, the underlying sentiment and monthly chart structure suggest that the current price action may be forming the foundation for a more substantial, long-term bullish trend reversal.
CHFJPY Wave Analysis
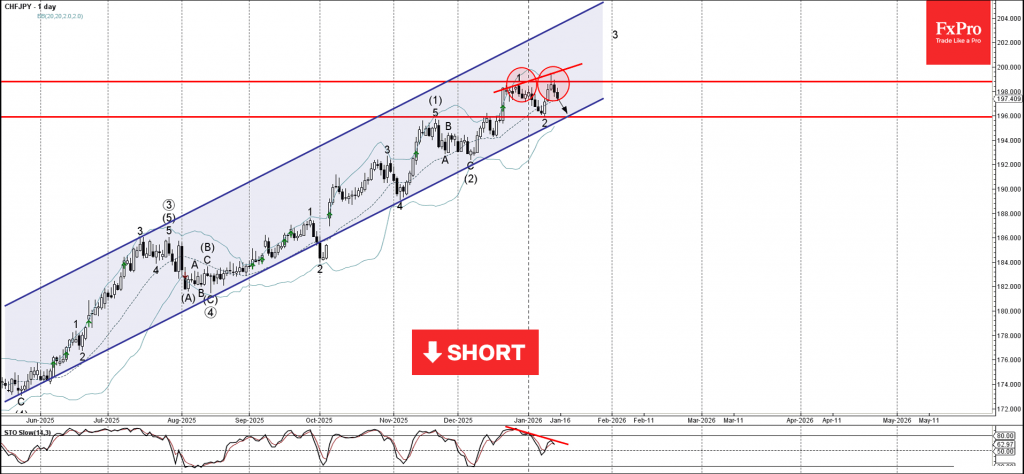
CHFJPY: ⬇️ Sell
- CHFJPY reversed from resistance zone
- Likely to fall to support level 196.00
CHFJPY currency pair recently reversed down from the resistance zone between the resistance level 198.806 (which stopped impulse wave 1 in December) and the upper daily Bollinger Band.
The downward reversal from the resistance zone created the daily Japanese candlesticks reversal pattern Shooting Star.
Given the bearish divergence on the daily Stochastic, CHFJPY currency pair can be expected to fall to the next support level 196.00 (low of the previous correction 2).