Sample Category Title
Week Ahead – US PCE and Davos in Focus for Dollar Traders – BoJ Meets
- US PCE, PMIs and remarks from Davos could impact Fed cut bets.
- BoJ to stand pat; focus to fall on guidance after election reports.
- UK CPI and retail sales data may confirm bets of more BoE cuts.
- Eurozone PMIs and Australian jobs data also on the agenda.
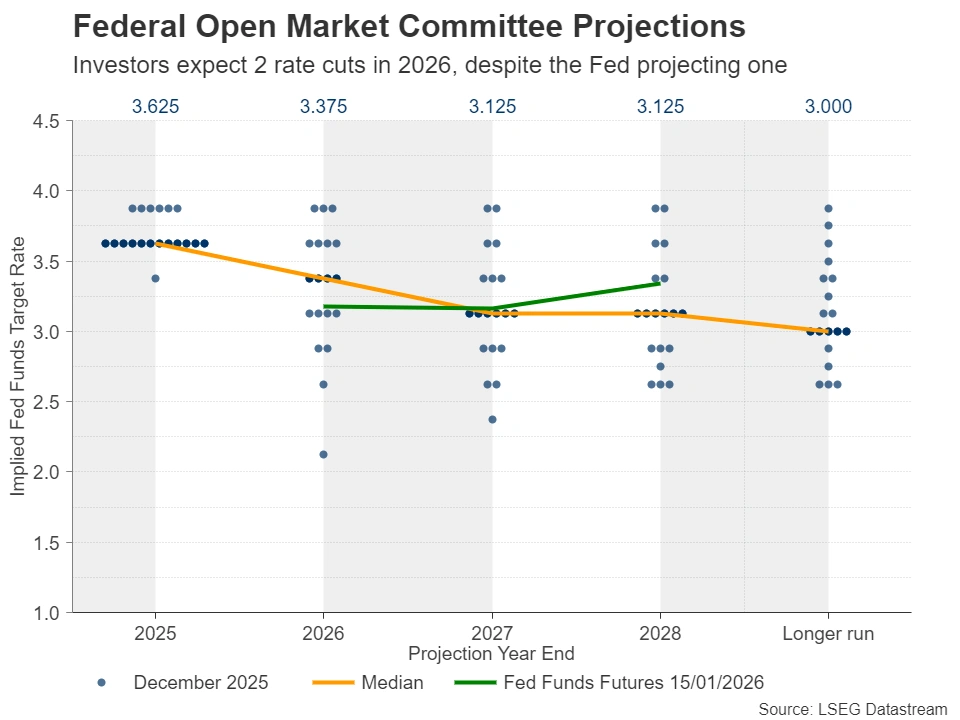
Investors continue to price in two Fed rate cuts in 2026
The US dollar outperformed all its major peers for another week, even after the US Department of Justice opened a criminal investigation into Fed Chair Jerome Powell, with the Fed Chief saying that the threats are a “pretext”, aimed at putting extra pressure on the Fed to lower interest rates more aggressively.
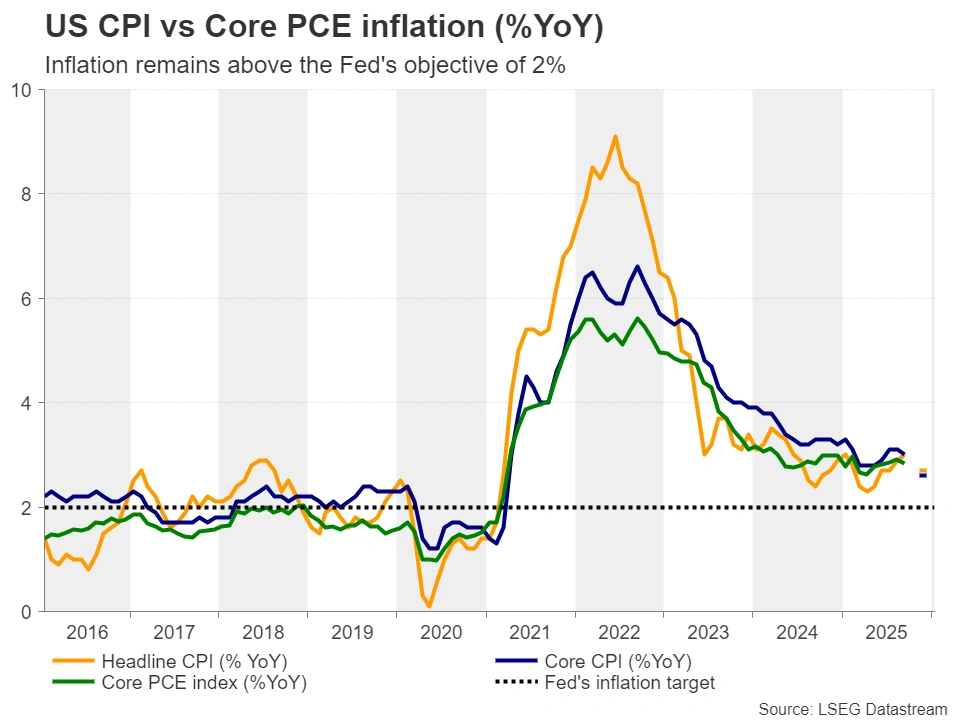
Expectations about how the Fed may proceed with interest rates this year have not changed much as Powell’s response to the accusations showed little signs of relenting, and perhaps as the CPI and PPI data for December showed no signs of easing in inflation. Both the headline and core CPI rates remained unchanged at 2.7% y/y and 2.6% respectively, while the PPIs revealed some acceleration.
According to Fed funds futures, investors are penciling in 54bps worth of rate cuts by the end of the year, which means that two quarter-point reductions are fully priced in, despite the Fed’s latest dot plot pointing to only a single one.
Will more signs of sticky inflation weigh on Fed bets?
With all that in mind, dollar traders next week are likely to turn their focus to the PCE inflation data for November, due out on Wednesday, as well as the preliminary S&P Global PMIs for January, scheduled for Friday.
The PCE figures are the Fed’s favorite inflation metric, and thus, should they confirm the stickiness in consumer prices, investors may take some basis points worth of rate cuts off the table, especially should the PMIs reveal that the US economy entered the new year on a solid footing.
With the latest NFP report suggesting that the labor market is not suffering as previously thought, and with the Atlanta FedGDPNow model pointing to a robust 5.3% q/q growth rate for the last quarter of 2025, two rate cuts may be too many for the Fed.
However, market participants may be taking into account the likelihood of the Fed leaning somewhat more dovish under its new leadership. According to news media, US President Trump is expected to announce his pick for Powell’s successor by the end of this month.
World leaders gather in Davos
The World Economic Forum in Davos, Switzerland, could also attract special interest as its core fundamental value of coordinated global economic order is being tested. US President Trump is expected to appear, and it will be interesting to see whether his tariff-policies, the military intervention in Venezuela and his threat of taking over Greenland will be matters of discussion. On top of that, any remarks regarding his feud with Fed Chair Jerome Powell could also captivate market attention.
BoJ decides on policy amid snap election reports
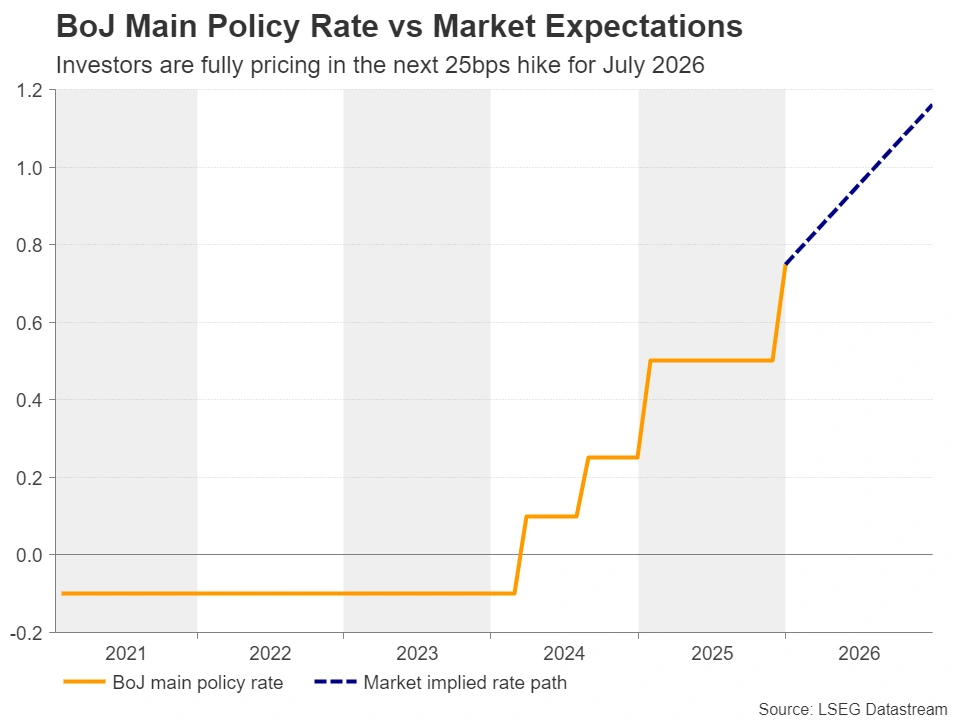
During the Asian session Friday, the Bank of Japan will announce its first monetary policy decision for 2026. In December, the Bank raised interest rates by 25bps to levels last seen 30 years ago and signaled its readiness to continue raising rates.
However, this week, news hit the wires that Prime Minister Takaichi is planning to call a snap election in February. With her approval rating at around 70%, she may be confident that her ruling Liberal Democratic Party (LDP) will widen its majority in the lower house of Parliament, which will allow her to proceed with her spending plans more easily.
After failing to capitalize on the hawkish BoJ decision, the Japanese yen came under strong selling interest following the election news, not only due to speculation that the nation’s debt will increase, but also due to bets that the BoJ’s hands may be tied ahead of the election. Indeed, Japan’s Overnight Index Swaps (OIS) market is indicating that the next rate hike may happen in July.
The slide in the yen has revived concerns about a potential intervention by Japanese authorities, with Finance Minister Katayama resuming such warnings. However, history has shown that intervention on its own could only have a brief effect. For a long-lasting recovery in the yen, the BoJ may need to raise interest rates as well.
Thus, although the Bank is largely anticipated to refrain from acting next week, traders may be eager to find out whether officials are indeed planning to wait until summer before they raise interest rates again, or whether they are planning to act sooner to make sure that further weakness in the yen will not fuel inflation through higher import costs.
Will UK inflation hit BoE’s target sooner than previously estimated?
In the UK, the employment report for November will be released on Tuesday, the CPI and PPI inflation data for November on Wednesday, while the retail sales for December and the flash PMIs for January will come out on Friday.
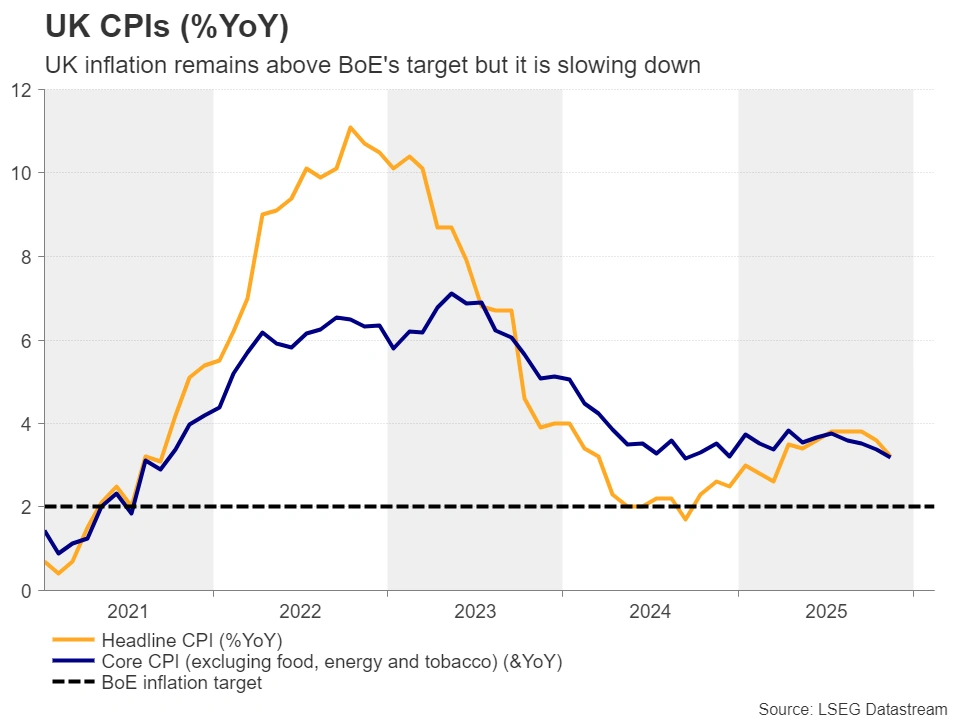
At its last gathering for 2025, the Bank of England cut interest rates by 25bps to 3.75%, the lowest in nearly three years, but the decision was a close call, taken by a 5-4 vote, with 4 members preferring to stand pat. In the statement accompanying the decision, the Bank noted that the “easy part” of its easing cycle was over, suggesting that the bar for future reductions in borrowing costs will be higher this year.
According to the UK Overnight Index Swaps (OIS) market, similarly to the Fed, investors are expecting nearly two quarter-point reductions by the end of the year. BoE’s policymaker Alan Taylor said on Wednesday that inflation could hit their target sooner than previously estimated given cooling wage growth and thus, monetary policy could normalize at neutral sooner rather than later. Governor Andrew Bailey shared a similar view, noting that inflation could fall to target in April or May.
Bearing all that in mind, data pointing to both a slowdown in wages and further cooling of inflation may corroborate the aforementioned view and thereby encourage investors to increase their BoE rate cut bets. This could prove negative for the British pound, especially against the euro. The ECB has confidently taken the sidelines in recent meetings, noting that they are in a “good place”, with traders expecting it to remain on hold throughout the whole year.
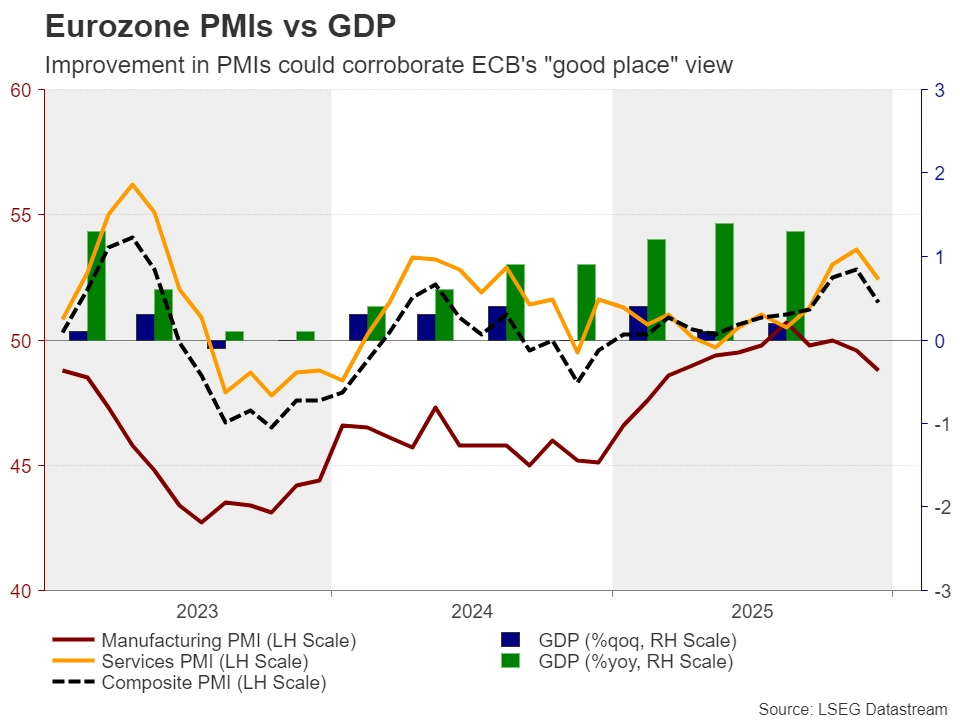
Eurozone flash PMIs and Australia’s employment report on tap
Speaking about the Eurozone and the ECB, the minutes of its latest monetary policy meeting will be released on Wednesday. At that meeting, the ECB decided to hold interest rates unchanged, reiterating its “good place” mantra and revising upward its growth and inflation projections. With the market not expecting any move this year, it will be interesting to see whether there were any members discussing the likelihood of rate hikes at some point in the not-too-distant future.
The Eurozone’s flash S&P Global PMIs for January will be released on Friday, and traders may be eager to find out whether the ECB was correct to revise its GDP projections higher.
Apart from the BoJ, which is the sole major central bank in a hiking cycle, the RBA is the only other major central bank which discussed the likelihood of starting its own rate-hike path. According to Australia’s Overnight Index Swaps (OIS) market, there is a noticeable 25% chance of a 25bps rate increase at the RBA’s upcoming gathering on February 3, with such an action fully priced in by August.
The divergence in monetary policy expectations between the RBA and the Fed has kept the aussie/dollar pair in an uptrend mode since November 21 and a solid employment report from Australia on Thursday could push it higher as traders become more convinced that the RBA will have to press the hike button in one of its upcoming meetings.
Ahead of Australia’s jobs report, China will release its GDP for Q4, alongside the industrial production, retail sales and fixed asset investment data for December. Upbeat numbers could help the currencies of Australia and New Zealand, given that both nations are main trading partners with the world’s second-largest economy.
As for the earnings season, Netflix will announce its quarterly results on Tuesday after the closing bell.
Weekly Focus – Walking on Thin Ice
Favourable macro environment continues to support broader risk appetite despite the fragile geopolitical outlook. Both realized and implied volatility across equities, FX and commodities remain modest in historical context. In Europe, main equity indices have continued their steady increases while cyclical currencies like SEK and NOK have strengthened vis-à-vis EUR. Notably, the broad USD has also had a strong start to the year, though we do not expect this to last.
Donald Trump reportedly backtracked his plans for striking Iran this week, citing declining risks of large-scale killing following several weeks of protests. Limited news sources (see Reuters) have indicated that the protests could be abating, though the full picture of the current situation remains opaque after broad internet blackouts.
The meeting between officials from Denmark, Greenland and the US ended without drama, but also without resolutions. Danish PM Mette Frederiksen said that a 'fundamental disagreement' remains over the future of Greenland. NATO allies from Germany, France, Sweden and Norway have committed to sending military staff for drills in Greenland later in the year.
Incoming macro data has remained generally positive. From the US, first regional January manufacturing indices from NY and Philadelphia surprised to the topside, and weekly jobless claims declined. December CPI landed close to expectations in headline terms (+0.3% m/m SA & 2.7% y/y) but slightly below consensus in core terms (+0.2% m/m SA & 2.6% y/y). The downside miss was largely driven by flat core goods prices, while services and food prices rose from prior month. That said, the Fed remains aware that shutdown-driven delays to previous data collection might have distorted the inflation picture, see more from Global Inflation Watch, 13 January.
Government bond yields have remained relatively steady on both sides of the Atlantic. We expect US yield curve to steepen this year, as rising term premium lifts the long end, even if the Fed continues cutting policy rates. In the euro area, macro momentum remains positive, but markets inflation expectations have declined below 2% for the next few years. We forecast no changes to the ECB's policy rate in 2026 or 2027 and expect also the long-end rates to remain close to current levels. Note that we continue to expect no independent policy rate changes from the Danmarks Nationalbank, see Yield Outlook, 15 January.
Next week will be relatively light in terms of macro data. January flash PMIs are due for release for both euro area, the UK and the US on Friday. We think modest growth momentum has continued at the beginning of the year and expect the indices to land close to December levels. We forecast Chinese Q4 GDP at 4.5% y/y on Monday, which would bring the annual 2025 growth close to the 5% target. UK December Jobs and CPI data will be released on Tuesday and Wednesday, respectively.
We do not expect the Bank of Japan to make policy rate changes early Friday morning after the December hike. Markets do not price in any possibility for a policy rate move. Japanese PM Sanae Takaichi could formally announce a snap election next week, with tentative election date set for 8 February.
Sunset market commentary
Markets
We’ve turned every stone in search of market-relevant news today, but it was nowhere to be found. European stock markets trade 0.5% lower with US indices probably also prone to some possible correction going into the long US weekend. Markets are closed across the Atlantic on Monday in observance of Martin Luther King Day. US President Trump’s bravado in mind favours erring on the side of caution. We’ve only had two weekends so far in 2026, but with the Maduro kidnapping and the Powell subpoena, Trump made sure both of them counted. The dollar holds near recent best levels with EUR/USD currently changing hands at 1.1615, holding just above technical support coming from the 200d moving average at 1.1589. The trade-weighted dollar (DXY) at 99.25 already broke this gauge earlier this month. Core bond yield curves show a very modest bear steepening with yield changes varying between +1 bp at the front end and +2.5 bps at the very long end in both Germany and the US. Consensus-beating December US industrial production data add to a growing list of positive eco surprises lately but had no immediate impact on trading. Production rose by 0.4% M/M (vs +0.1% consensus) with the November figure also being upwardly revised from 0.2% to 0.4%. Capacity utilization rose to 76.3% (vs 76% consensus) from revised 76.1% in November
“A spirit of dialogue”. The slogan of the annual World Economic Forum in Davos is a wakeup call to restore trust and order in an ever more fragmented world. Next week’s keynote speeches and panel discussion center around five questions. How can we operate in a more contested world?, How can we unlock new sources of growth?, How can we better invest in people?, How can be deployed innovation at scale and responsibility? and How can be build prosperity withing planetary boundaries? AI governance, trade resilience and geopolitical dialogue resonate through all of these questions. The lengthy list of high-profile economic, political, business and civil society leaders features US President Trump. Bloomberg reports that he will address the WEF next Wednesday in a key plenary address. Flagship central bank panels are on the agenda on Thursday with ECB president Lagarde already confirmed. Other market highlights next week include Chinese Q4 GDP data on Monday, outdated US PCE deflators (Thursday), the first batch of important UK eco data of this year (labour market report, inflation numbers and retail sales), January PMI surveys (Friday) and central bank meetings in Norway (Thursday) and Japan (Friday).
News & Views
The French government suspended parliamentary talks on the 2026 budget bill since they were headed for failure anyway. Budget minister Amelie de Montchalin put the blame with the far-left and -right parties for sabotaging efforts to reach a compromise over the last three months. Attention now shifts to tonight, when Lecornu plans to put a new fiscal plan on the table and which de Montchalin said will be passed without a vote in parliament. Using Article 49.3 has been tried before, however, and resulted with the help of the Socialists in the downfall of Barnier. Lecornu had previously vowed not to do that. Instead he could invoke Article 47 and push through the budget by executive order. But it has never been tested, has some legal issues that need clarifying and in any case already triggered the ire of the Socialist Party. They are pivotal in the survival of Lecornu’s minority government.
Bulgaria is headed for snap elections, the eighth in just five years’ time. President Radev made the announcement after the third party he spoke to form a government had rejected the offer. The previous administration collapsed over anti-corruption protests. An interim cabinet will be appointed before the next ballot date will be made public. The Gerb party of the outgoing government continues to lead in the polls but there has been very little movement overall in voting behaviour over the last couple of years, dimming prospects of a stable governing alliance. This could change if president Radev would enter the race. He is Bulgaria’s most popular politician and had voiced strong support for the protesters. He recently hinted at establishing his own political party but has yet to do so.
Bailey: Multipolar shift raises risks for global growth
BoE Andrew Bailey warned today that the global economy is entering a more fragile phase, as the transition toward a multipolar world strains institutions built for a more stable and cooperative era. Drawing on economic history, Bailey said shifts in global power “invariably strain the operation of the system,” raising risks for growth and financial stability.
He pointed to a combination of structural headwinds weighing on the outlook, including a prolonged slowdown in productivity, ageing populations, rising defense spending, and climate-related economic shocks. Together, Bailey said, these forces form “a powerful force to complicate the operation of the international system,” making policy coordination and long-term growth harder to sustain.
Bailey argued that global tensions have increasingly shifted away from monetary relations toward trade, which he described as more vulnerable to domestic political pressures. Trade disputes, he said, are more easily blamed for changes in wages and living standards than exchange-rate movements. While warning against closing economies to trade, Bailey stressed that preserving financial stability will be essential as the global economy adjusts to changing power balances.
USD/JPY Slips as the Yen Reacts to a Wave of Market News
The USD/JPY pair fell to 158.16 on Friday as the Japanese yen continued its recovery from earlier this week. Market participants are increasingly focused on the upcoming Bank of Japan (BoJ) meeting, hoping for clearer signals regarding the future pace of interest rate hikes.
The regulator is widely expected to keep its policy parameters unchanged at the next meeting. However, investors are already pricing in the next rate hike as early as June. BoJ Governor Kazuo Ueda recently reiterated that the central bank remains ready to tighten policy if economic momentum and inflation dynamics continue to align with official forecasts.
Additional support for the yen came from renewed concerns over possible currency intervention as USD/JPY approached the psychologically important 160 level. Japanese authorities have repeatedly warned against sharp, unilateral exchange rate movements, increasing market sensitivity in this zone.
At the same time, political uncertainty continues to weigh on the yen. Markets are factoring in the possibility of early parliamentary elections. According to media reports, Prime Minister Sanae Takaichi may announce the dissolution of the lower house in an effort to push forward a more active fiscal policy. Further details are expected to be presented to representatives of the ruling coalition on 19 January.
Technical Analysis
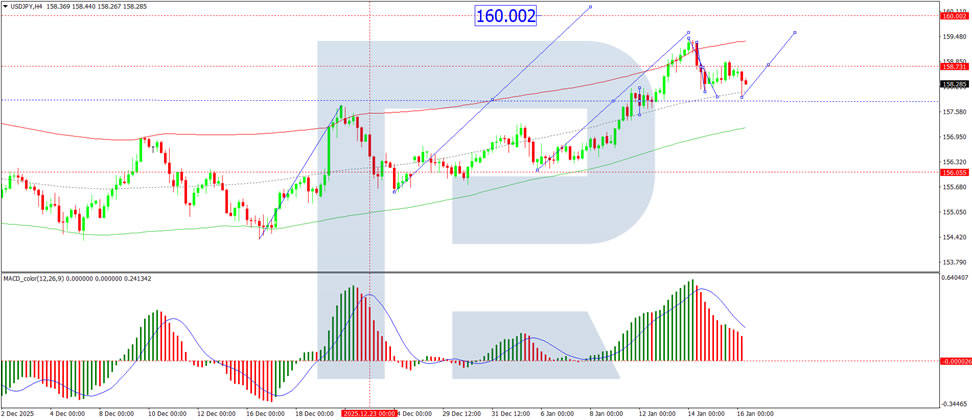
On the H4 chart, USD/JPY has corrected to the 157.90 area. For today, it is relevant to consider the potential formation of the initial phase of a renewed upward structure, targeting 159.59, with the prospect of a further move towards 160.00.
This scenario is technically supported by the MACD indicator, whose signal line remains above the zero level and is directed sharply upward, indicating that bullish momentum remains despite the recent correction.
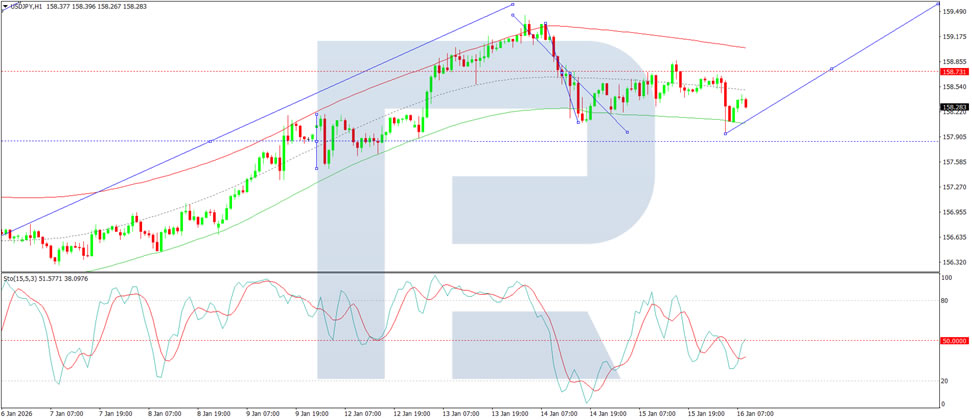
On the H1 chart, USD/JPY is forming a consolidation range around 158.77. The range has currently expanded downward to 157.97.
- A breakout below this level would likely trigger a decline towards 156.60
- A breakout to the upside would open the way for a bullish wave towards 159.59
This outlook is supported by the Stochastic Oscillator, whose signal line is positioned above the 50 level and is moving steadily upward towards 80, indicating growing bullish pressure.
Conclusion
USD/JPY remains at a critical juncture, balancing yen support from intervention risks and expectations of BoJ tightening against ongoing pressure from political uncertainty. In the short term, consolidation is likely to persist, but a breakout from the current range will define the next directional move. As long as the pair holds above key support levels, the broader bullish trend towards the 160 area remains technically valid, while a downside breakout would shift focus towards deeper corrective targets.
Disclaimer
Any forecasts contained herein are based on the author's particular opinion. This analysis may not be treated as trading advice. RoboForex bears no responsibility for trading results based on trading recommendations and reviews contained herein.
EUR/JPY Pulls Back From Record High
As the chart shows, the exchange rate rose above ¥185.00 per euro for the first time ever earlier this week. Today, however, a modest pullback is visible, with the Japanese yen strengthening against the euro.
Fundamentally, this move has been supported by a combination of factors, most notably news from Japan. According to media reports, Japan’s Finance Minister, Satsuki Katayama, said that Tokyo could carry out a joint currency market intervention with the United States to support the yen.
In addition, traders are positioning ahead of an important week, during which:
→ the Bank of Japan will announce its interest rate decision;
→ Japan’s parliament may be dissolved to pave the way for snap elections;
→ euro area PMI figures will be released.
Technical Analysis of the EUR/JPY Chart
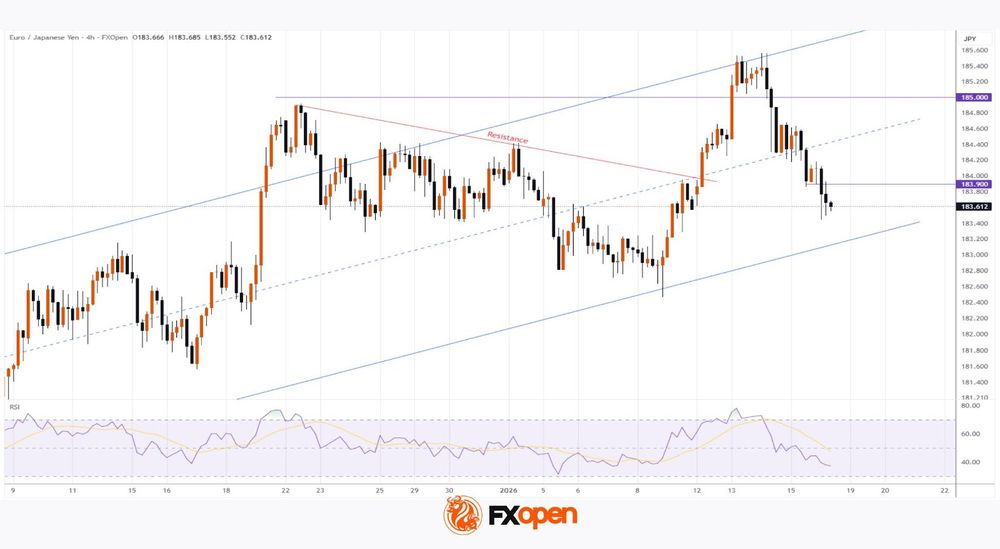
Price action continues to form an ascending channel (shown in blue). At the same time, signs of a shift in sentiment have emerged.
At the start of the week, sentiment was bullish:
→ the price broke through a local resistance line and consolidated in the upper half of the channel;
→ it surpassed the December high and moved above the psychological level of ¥185 per euro.
Subsequently, bears took control:
→ the pair failed to hold above the 185.00 level;
→ the price fell back to the channel’s median, which failed to provide meaningful support;
→ the decline continued, with the local 183.9 level switching from support to resistance.
It is reasonable to assume that the lower boundary of the channel could limit further downside in EUR/JPY. However, this support is unlikely to hold if the Bank of Japan, potentially backed by the US, actively steps in to strengthen the yen.
Trade over 50 forex markets 24 hours a day with FXOpen. Take advantage of low commissions, deep liquidity, and spreads from 0.0 pips (additional fees may apply). Open your FXOpen account now or learn more about trading forex with FXOpen.
This article represents the opinion of the Companies operating under the FXOpen brand only. It is not to be construed as an offer, solicitation, or recommendation with respect to products and services provided by the Companies operating under the FXOpen brand, nor is it to be considered financial advice.
Strong Macro Data and Rate Spreads USD’s Main Weapon
- The greenback’s primary weapon is the wide spread in interest rates.
- The yen is following the lead of the government and the Bank of Japan.
The US dollar continues its strong run in the forex market for almost a month. A combination of strong US macro statistics and hawkish Fed officials’ comments allows the greenback to dominate. In the week ending January 10th, Initial Unemployment Claims fell to 198K. In recent years, the figure has only occasionally fallen below 200K. Its 4-week average fell to the lowest in two years. This points to a stabilisation of the labour market and deprives the FOMC doves of their key trump card.
The EURUSD has been falling for 11 of the last 15 sessions and has reached its lowest since early December. According to Credit Agricole, the idea of divergence in the monetary policies of the Fed and the ECB will not be realised. The Fed will leave rates unchanged in 2026, and the wide spread with the deposit rate will become the primary weapon of the US dollar. Bank of America warns that the ECB’s dissatisfaction with inflation dynamics may force it to resume its cycle of monetary expansion. This will put pressure on the euro.
The large spread between the Fed's and ECB's key rates may remain in the markets for a long time
It seems the only hope for EURUSD bulls is Donald Trump, who dreams of lowering the federal funds rate to 1%. However, the US president has tied his own hands with a lawsuit against Jerome Powell. Now, candidates close to him for the position of Fed chairman may be rejected by the Senate due to concerns about the independence of the central bank.
The only currency performing better than the dollar recently is the yen. USDJPY gave way to fears of possible currency interventions, as hinted at by Japanese Finance Minister Satsuki Katayama. According to Bloomberg insiders, the BoJ is focusing its attention on the pro-inflationary impact of a weak yen. Although no rate hike is expected in January, further policy tightening may remain on the table. Experts do not expect an overnight rate hike before July.
Reduced geopolitical risk, supported by developments involving Venezuela and Iran, has put pressure on gold prices. The strong dollar and rising US Treasury yields are also weighing on gold. However, the precious metal’s reluctance to correct in difficult conditions speaks to its strength.
GBP/JPY Daily Outlook
Daily Pivots: (S1) 211.76; (P) 212.54; (R1) 213.07; More...
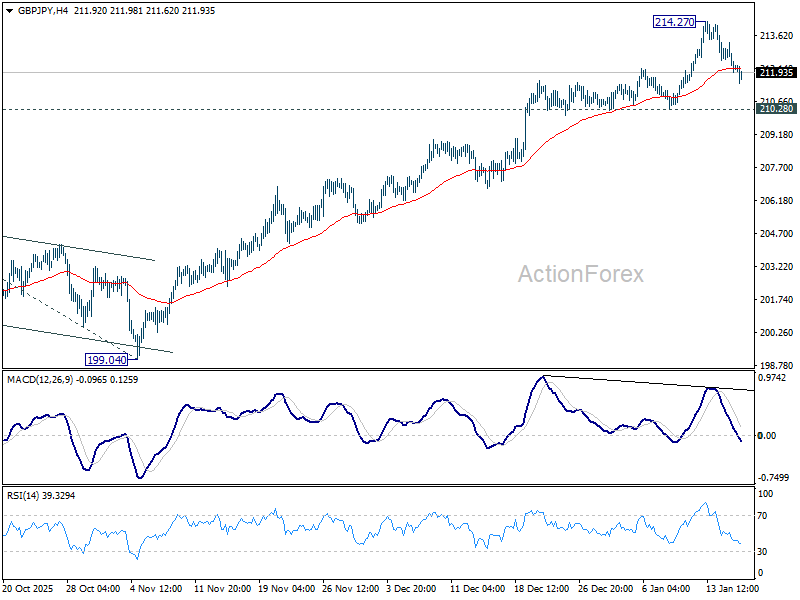
GBP/JPY is staying in consolidations below 214.27 and intraday bias remains neutral. Downside should be contained by 210.28 support to bring another rally. Break of 214.27 will resume larger up trend to 100% projection of 184.35 to 205.30 from 199.04 at 219.99 next. Nevertheless, considering bearish divergence condition in 4H MACD, firm break of 210.28 will confirm short term topping, and turn bias to the downside for deeper pullback.
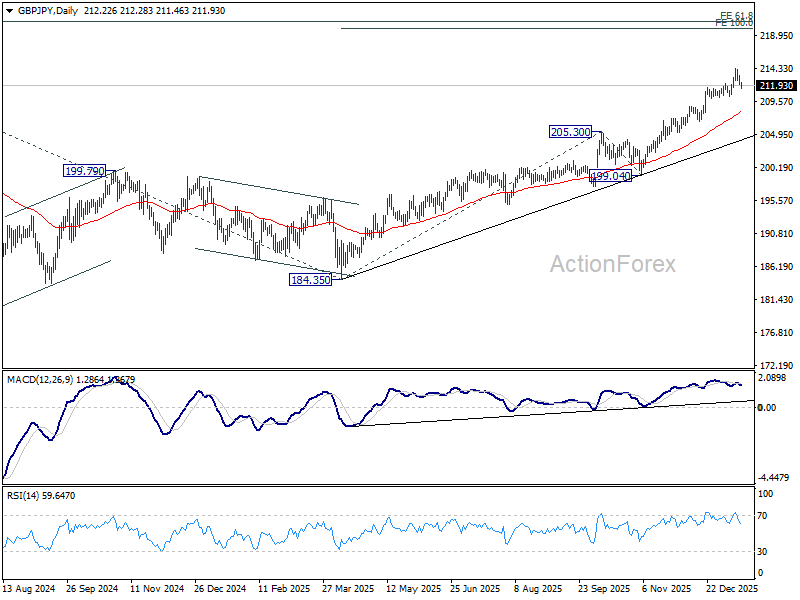
In the bigger picture, up trend from 123.94 (2020 low) is in progress. Next target is 61.8% projection of 148.93 (2022 low) to 208.09 (2024 high) from 184.35 at 220.90. On the downside, break of 205.30 resistance turned support is needed to indicate medium term topping. Otherwise, outlook will stay bullish even in case of deep pullback.
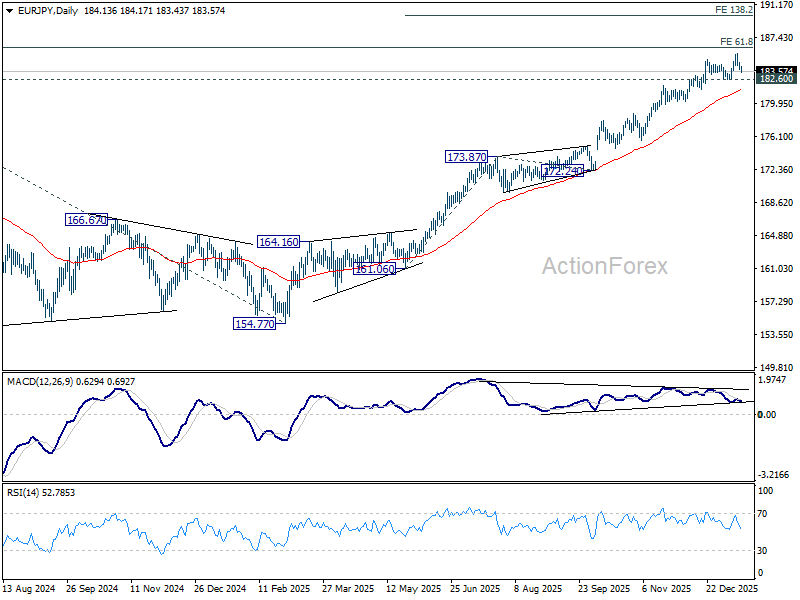
EUR/JPY Daily Outlook
Daily Pivots: (S1) 183.81; (P) 184.22; (R1) 184.58; More...
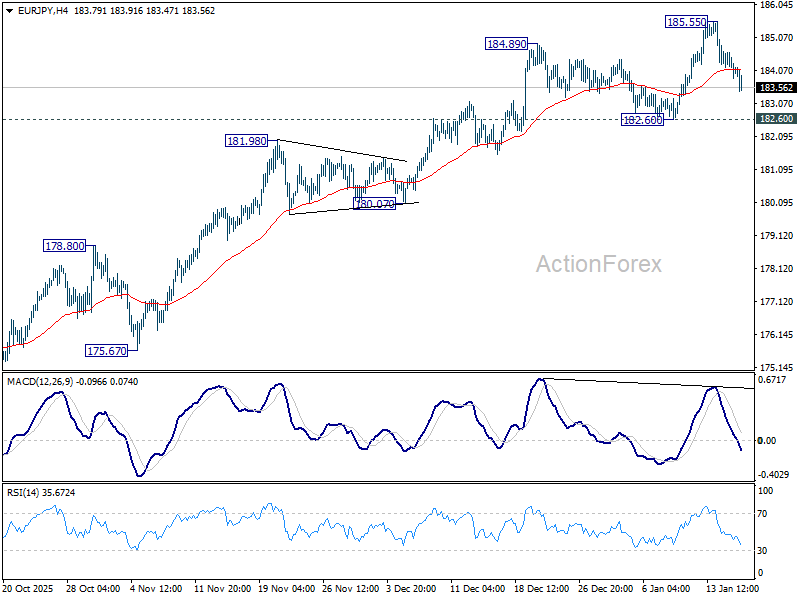
EUR/JPY is staying in consolidations below 185.55 and intraday bias remains neutral. Further rally is expected with 182.60 support intact. Above 185.55 will resume larger up trend to is 186.31 fibonacci level. Firm break there will pave the way to 138.2% projection of 151.06 to 173.87 from 172.24 at 189.94. However, considering bearish divergence condition in 4H MACD, firm break of 182.60 will confirm short term topping, and turn bias back to the downside for deeper pullback.
In the bigger picture, up trend from 114.42 (2020 low) is in progress and should target 61.8% projection of 124.37 (2021 low) to 175.41 (2024 high) from 154.77 (2025 low) at 186.31. Firm break there will target 78.6% projection at 194.88. Outlook will remain bullish as long as 175.41 resistance turned support holds, even in case of deep pullback.
EUR/GBP Daily Outlook
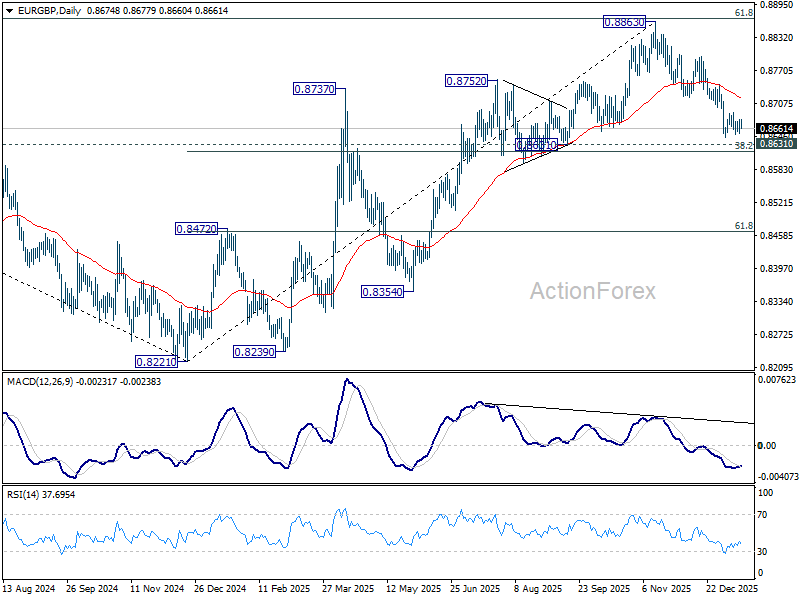
Daily Pivots: (S1) 0.8660; (P) 0.8669; (R1) 0.8686; More…
EUR/GBP is still bounded in range above 0.8643 and intraday bias remains neutral. Further decline is expected and decisive break of 0.8631 cluster support (38.2% retracement of 0.8221 to 0.8663 at 0.8618) will pave the way to 61.8% retracement at 0.8466. However, break of 0.8691 resistance will turn bias to the upside, for stronger rebound to 55 D EMA (now at 0.8719) first.
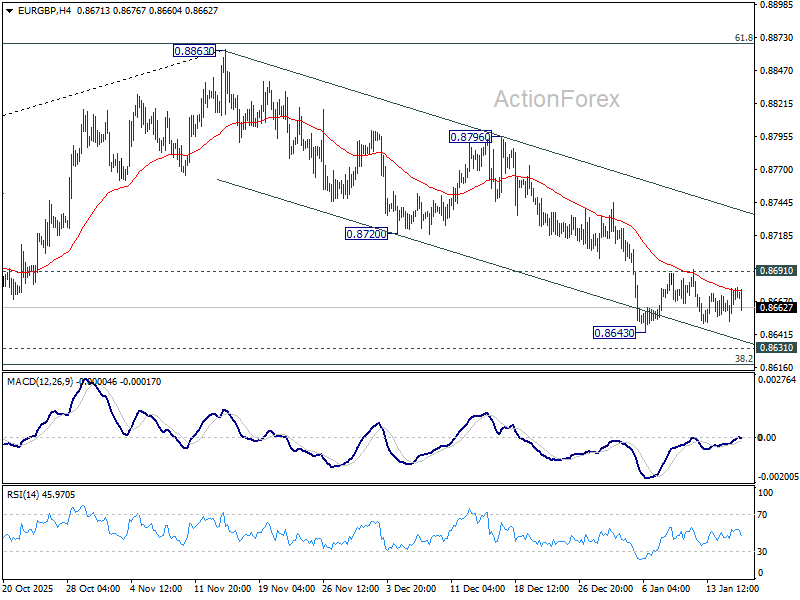
In the bigger picture, rise from 0.8221 medium term bottom (2024 low) is seen as a corrective move. Upside should be limited by 61.8% retracement of 0.9267 to 0.8221 at 0.8867. Sustained trading below 55 W EMA (now at 0.8622) should confirm that this corrective bounce has completed. In this case, deeper fall would be seen back to 0.8201/21 key support zone. However, decisive break of 0.8867 will suggest that EUR/GBP is already reversing whole decline from 0.9267 (2022 high). That should pave the way back to 0.9267.