
Sample Category Title
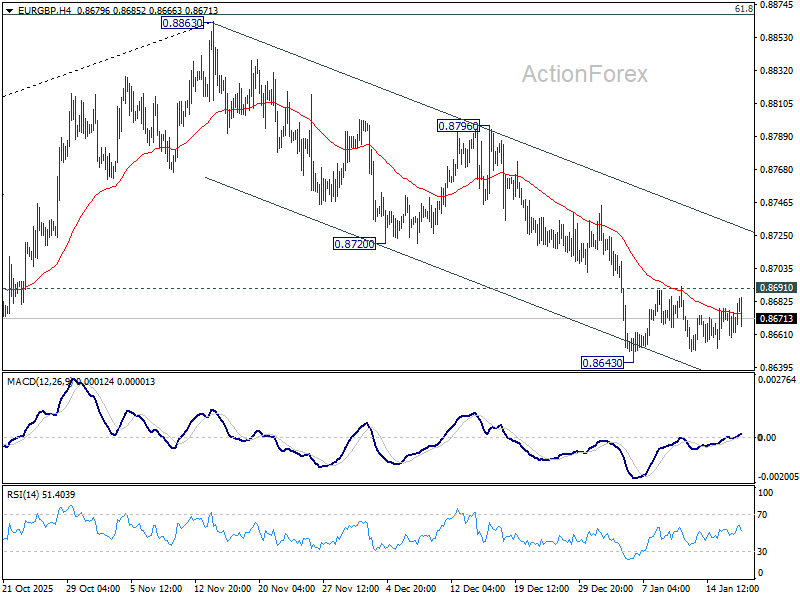
EUR/GBP Daily Outlook
Daily Pivots: (S1) 0.8658; (P) 0.8671; (R1) 0.8680; More…
Range trading continues in EUR/GBP and intraday bias stays neutral for the moment. With 0.8691 resistance intact, further decline is in favor. On the downside, decisive break of 0.8631 cluster support (38.2% retracement of 0.8221 to 0.8663 at 0.8618) will pave the way to 61.8% retracement at 0.8466. Nevertheless, break of 0.8691 resistance will turn bias to the upside, for stronger rebound to 55 D EMA (now at 0.8716) first.
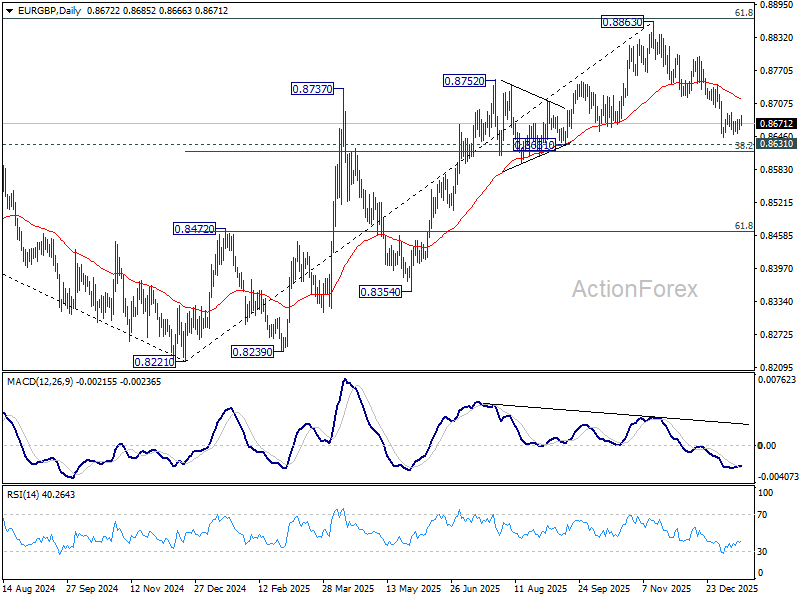
In the bigger picture, rise from 0.8221 medium term bottom (2024 low) is seen as a corrective move. Upside should be limited by 61.8% retracement of 0.9267 to 0.8221 at 0.8867. Sustained trading below 55 W EMA (now at 0.8623) should confirm that this corrective bounce has completed. In this case, deeper fall would be seen back to 0.8201/21 key support zone. However, decisive break of 0.8867 will suggest that EUR/GBP is already reversing whole decline from 0.9267 (2022 high). That should pave the way back to 0.9267.
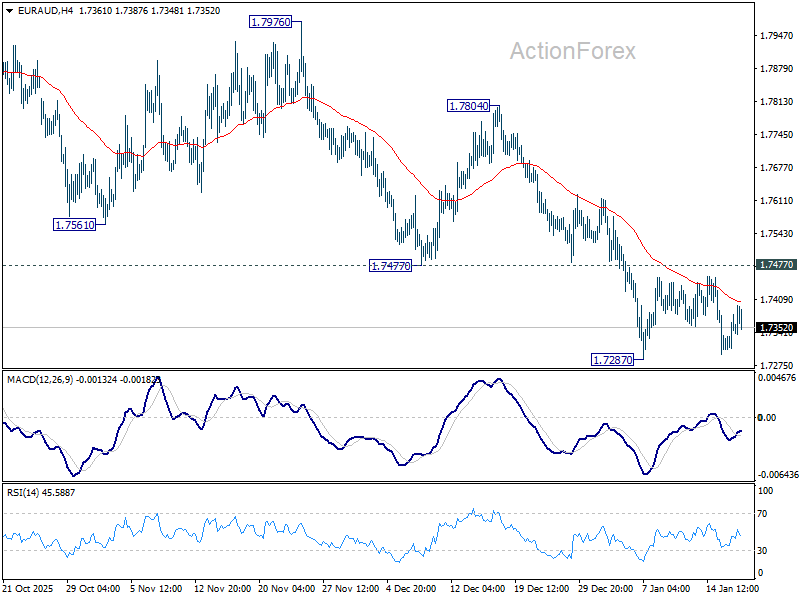
EUR/AUD Daily Outlook
Daily Pivots: (S1) 1.7318; (P) 1.7349; (R1) 1.7386; More...
Range trading continues in EUR/AUD and intraday bias stays neutral at this point. Further decline is in favor with 1.7477 support turned resistance intact. On the downside, break of 1.7287 will resume the fall from 1.8160. As this is seen as the third leg of the corrective pattern from 1.8554, deeper fall should be seen to 1.7245 support and below. Nevertheless, firm break of 1.7477 will indicate short term bottoming, and bring stronger rebound back to 55 D EMA (now at 1.7593).
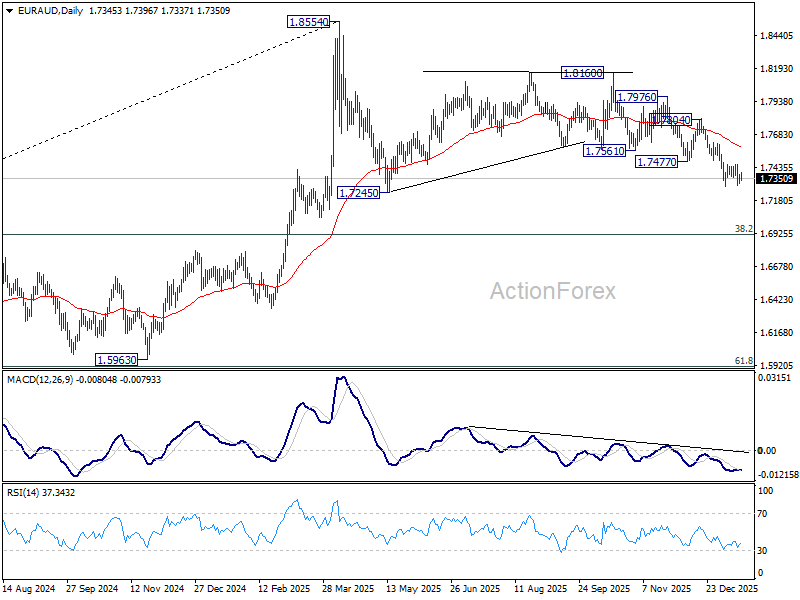
In the bigger picture, the break of 55 W EMA (now at 1.7464) argues that fall from 1.8554 medium term top is correcting whole up trend from 1.4281 (2022 low). Deeper decline is in favor to 38.2% retracement of 1.4281 to 1.8554 at 1.6922, and possibly below. Risk will stay on the downside as long as 1.8160 resistance holds, in case of strong rebound.
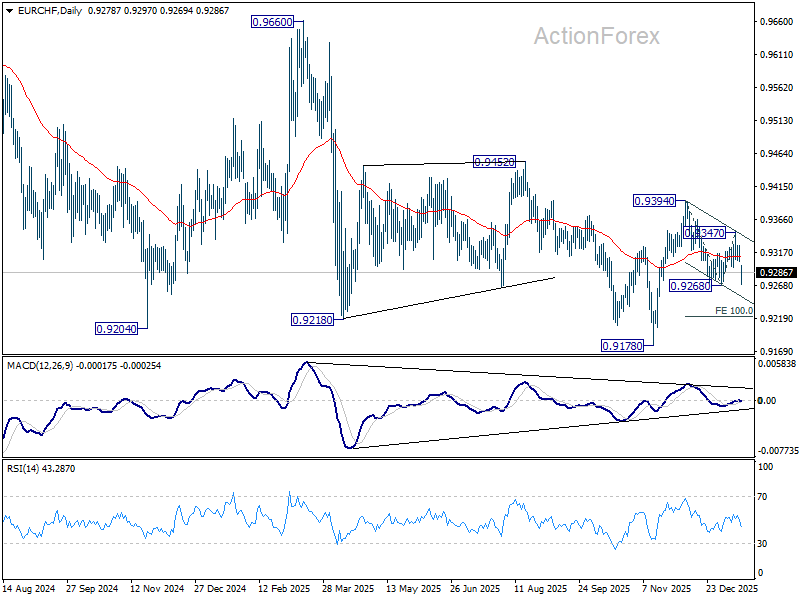
EUR/CHF Daily Outlook
Daily Pivots: (S1) 0.9301; (P) 0.9315; (R1) 0.9326; More....
EUR/CHF's steep dive today suggests that corrective recovery from 0.9268 has completed at 0.9347. Intraday bias is back on the downside. Firm break of 0.9268 will resume the fall from 0.9394, and target 100% projection of 0.9394 to 0.9268 from 0.9347 at 0.9221. Break will bring retest of 0.9178 low. For now, risk will stay on the downside as long as 0.9347 resistance holds, in case of recovery.
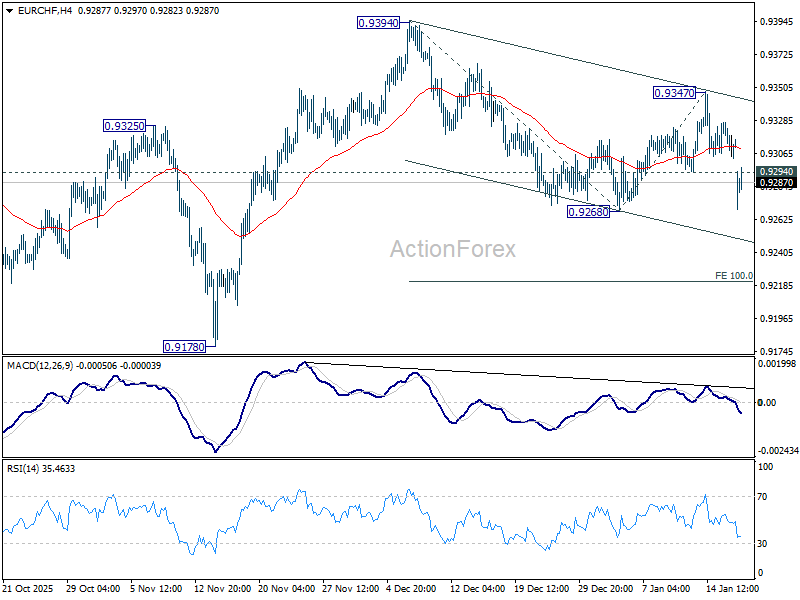
In the bigger picture, persistent bullish convergence condition in W MACD is a medium term bullish sign. Firm break of 0.9394 resistance should bring sustained trading above 55 W EMA (now at 0.9360). That should indicate medium term bottoming at 0.9178. Further break of 0.9452 resistance will bring stronger medium term rally towards 0.9928 resistance next, even still as a corrective bounce. Nevertheless, rejection by 55 W EMA will retain bearishness for another fall through 0.9178 at a later stage.
Swiss Franc Rallies as Greenland Escalations Push Gold to Record
Risk aversion dominated markets across Asia and spread into Europe today as an abrupt transatlantic diplomatic and trade shock rippled through asset prices. Investors fled to traditional safe havens, pushing Gold and Silver to fresh record highs, while equities came under heavy pressure.
At the core was the dramatic escalation in tensions over Greenland. Donald Trump threatened to impose 10% tariffs on several European allies from February 1, rising to 25% by June unless a deal is reached for the “complete and total purchase of Greenland.” The eight countries named include Denmark, Norway, Sweden, Finland, Germany, France, the Netherlands, and the United Kingdom.”
The risk-aversion impulse quickly lifted precious metals. With tensions unresolved and traders wary of further policy shocks, Gold risks extending toward the 5000 level, and Silver toward 100 if stress deepens further.
Equities, by contrast, bore the brunt of the selloff. European automotive names were particularly weak, with heavyweights such as Volkswagen, BMW, Mercedes‑Benz Group, as well as Milan-listed Ferrari and Stellantis sliding. The sector is seen as vulnerable given globalized supply chains and sensitivity to potential levies and trade barriers.
Despite sharp moves in metals and equities, currency markets have been relatively restrained. Swiss Franc has emerged as the strongest major currency on risk-off flows, followed by Kiwi and Euro. Yen is back at the bottom of the leaderboard, followed by Dollar and Sterling, with Loonie and Aussie positioned in the middle.
Attention now turns to the World Economic Forum in Davos for any diplomatic reprieve, but optimism remains low. The gathering comes amid extraordinary geopolitical tumult, with the Greenland crisis front and center as leaders convene. Compounding market nerves, ongoing conflicts such as the war in Ukraine and other flashpoints continue to test risk appetite.
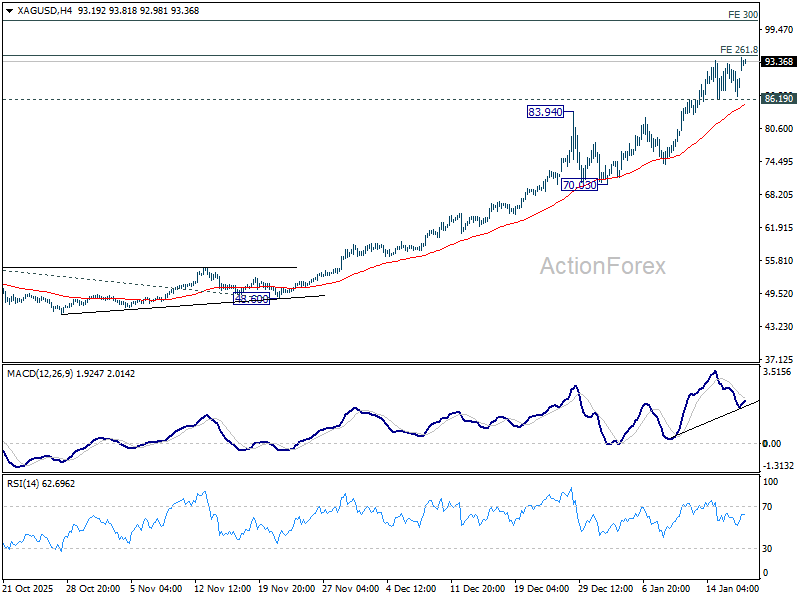
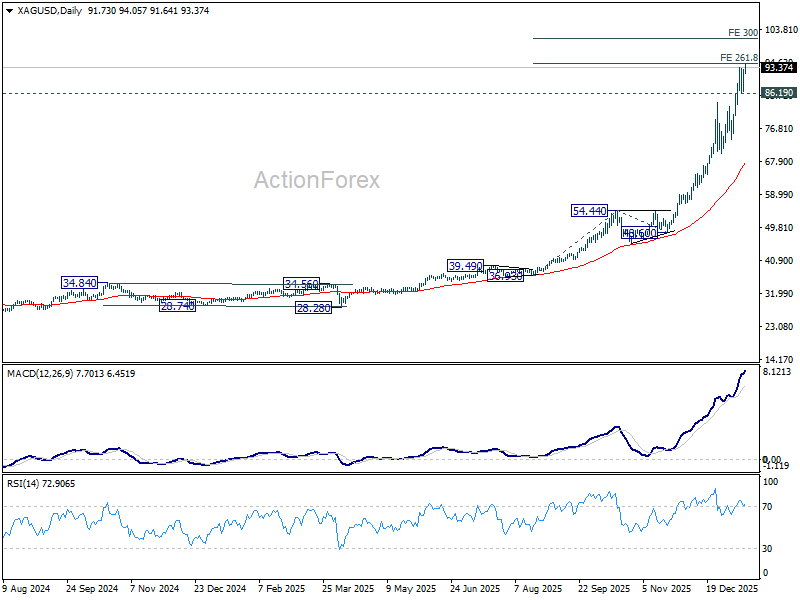
Greenland risk explodes, tilts Gold towards 5000, Silver towards 100
Risk aversion returned abruptly as the new week opened, propelling Gold and Silver to new all-time highs. With sentiment turning defensive, upside risks are building, raising the prospect of Gold extending toward 5,000 and Silver toward 100 should geopolitical tensions worsen.
At the center of the shock were escalating tensions over Greenland. Over the weekend, US President Donald Trump threatened to impose additional tariffs from February 1 on European countries linked to the dispute over control of the Arctic island. He further warned that duties would rise to 25% from June 1 until what he described as a “complete and total purchase” of Greenland is achieved.
The list of countries explicitly targeted was broad and politically sensitive, spanning Denmark, Norway, Sweden, Finland, Germany, France, the Netherlands, and the United Kingdom. By including both EU members and close U.S. allies, the threat immediately raised concerns about a wider transatlantic rupture rather than a contained bilateral dispute.
Trump's shift from rhetorical pressure to concrete economic measures marked a clear escalation and signaled that the administration is prepared to use trade policy again as direct geopolitical leverage. With tariffs now explicitly tied to territorial acquisition, the Greenland threat is real rather than symbolic. The episode has intensified fears of deeper political imbalance within Europe and raised uncomfortable questions about the long-term cohesion of NATO, already strained by diverging strategic priorities.
European leaders reacted quickly, condemning the move as unacceptable and signaling a unified response. After emergency talks on Sunday, EU officials began weighing counter-tariffs worth up to EUR 93 billion on U.S. imports.
Technically, Gold has already met target of 61.8% projection of 3,267.90 to 4,381.22 from 3,997.73 at 4,685.76. There is no sign of topping, and indeed from 4H MACD, Gold might even be trying to reaccelerate.
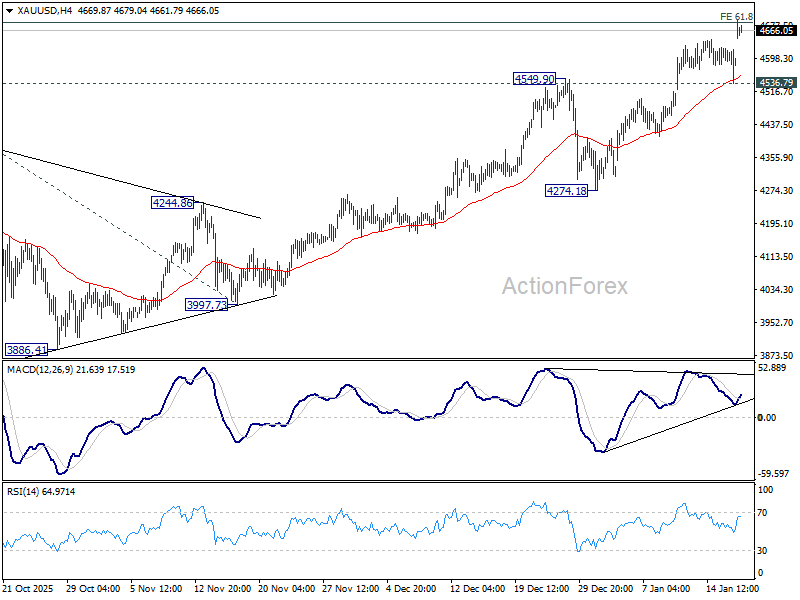
Sustained trading above 4,685.76 will pave the way to 5,000 psychological level or even 100% projection at 5,111.05. Nevertheless, break of 4536.79 support will indicate short term topping, and bring consolidations first.
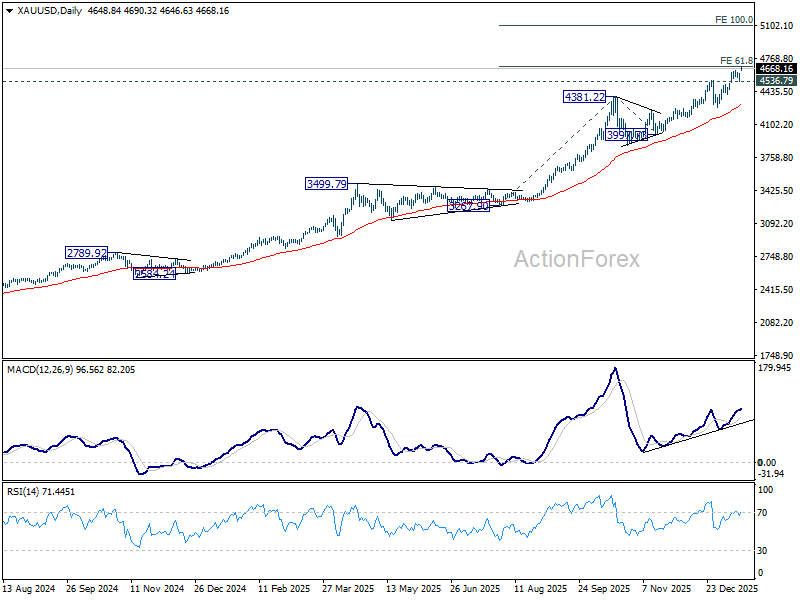
Silver is also just inch below 261.8% projection of 36.93 to 54.44 from 48.50 at 94.34 as the up trend resumes today. Near term outlook will remain bullish as long as 86.19 support holds. Firm break of 94.34 will pave the way to 300% projection at 101.13.
China GDP growth slows to 4.5% in Q4, pressure builds for fresh stimulus
China’s economy slowed at the end of 2025, reinforcing concerns that headline growth masks deepening domestic weakness. GDP expanded 4.5% yoy in Q4, down from 4.8% in Q3, in line with expectations. For the full year, growth reached 5.0%, matching the government’s target, but momentum clearly faded as the year closed.
Officials were quick to acknowledge the strain. Kang Yi, head of the National Bureau of Statistics, described 2025’s performance as “hard-won,” citing persistent challenges from strong supply and weak demand—a combination that continues to weigh on private confidence.
Full-year investment data underscored the depth of the slowdown. Fixed asset investment fell -3.8% ytd yoy, marking the first full-year contraction since the 1990s. The property sector remained the biggest drag, with property investment plunging -17.2% and new construction starts down -20.4%, extending a downturn now in its fourth year. Private investment dropped -6.4%, reflecting weak profit incentives amid overcapacity and cautious households.
December activity data showed mixed signals. Industrial production rose 5.2% yoy, improving from November and beating expectations of 5.0%. But retail sales slowed to 0.9% yoy, missing 1.2% forecasts and reinforcing the message that consumption remains the economy’s main weak spot.
The Q4 slowdown increases pressure on Beijing to step up stimulus in 2026 to meet a growth target of 4.5–5.0%. Without a more decisive pivot toward households and consumption, growth is likely to settle in the low- to mid-4% range, forcing policymakers to confront one of the most persistent domestic demand slumps in decades.
Snap election puts BoJ policy signals under the spotlight
The BoJ's rate decision is a central focus this week. Consensus remains that the BoJ will hold the policy rate at 0.75%, but confidence around the forward path has been shaken by last week’s sharp market reaction to domestic political developments.
According to a recent Reuters poll, 65 of 67 economists expect the BoJ to keep rates unchanged at both the January and March meetings. At the same time, conviction remains strong that normalization is not finished. Seventy-six percent of respondents see rates reaching at least 1.00% by end-September, with two analysts projecting a move as high as 1.25%.
When asked about timing, expectations are still clustered around mid-year. Among economists who specified a month, July emerged as the most popular choice at 43%, followed by June at 27%. Smaller minorities pointed to April, October, or even January 2027 or later.
However, that outlook shifted abruptly last week after Japanese equities surged and the Yen weakened on reports that Prime Minister Sanae Takaichi plans to dissolve parliament and call a snap election as early as February 8. The move sparked speculation that the BoJ could be forced to act sooner, potentially pulling forward the next rate hike to April.
Still, history cautions against assuming the BoJ will validate market pricing. The central bank has repeatedly shown a willingness to defy consensus expectations, often delivering policy surprises. While an immediate hike this week is not the base case, it cannot be fully ruled out, particularly as the BoJ will publish updated economic and inflation forecasts at this meeting.
More likely, any policy shift would come after the snap election, reducing the risk of political entanglement. Even so, the meeting could mark a turning point through subtle but meaningful changes in forward guidance, either in the statement or during the post-meeting press conference, laying groundwork for a hike that is increasingly viewed as inevitable.
Outside Japan, the UK is another major focus, with labor market data, CPI inflation, and retail sales all due. These releases arrive against a backdrop where the BoE is widely expected to continue easing policy through 2026, but with considerable uncertainty around pace and timing.
Markets currently price two additional 25bp cuts this year, taking Bank Rate from 3.75% to 3.25% by year-end. However, confidence in that path is limited. The Monetary Policy Committee remains deeply divided, with last year’s cuts passing by narrow 5–4 votes, leaving the door open for swift repricing should incoming data tip the balance.
This week’s data are likely to reinforce expectations for the BoE to hold in February, with March seen as the next realistic window for easing. June remains the base case for the final cut of the cycle, though that assumption will remain highly sensitive to inflation persistence and wage dynamics.
From the southern hemisphere, New Zealand’s Q4 CPI and Australia’s employment report take focus. Markets broadly assume both the RBNZ and RBA are done easing. The next phase of debate centers on when hikes start. Risks currently tilt toward Australia moving first, but confirmation will depend more heavily on Australia’s Q4 CPI next week.
Beyond these highlights, markets will also track US PCE inflation, German ZEW sentiment, Japan CPI, Canada’s CPI and retail sales, and PMIs from major global economies.
Here are some highlights for the week:
- Monday: China GDP, industrial production, retail sales, fixed asset investment; Eurozone CPI final; Canada CPI, BoC business outlook survey.
- Tuesday: New Zealand BNZ services; China rate decision; Germany PPI, ZEW; UK employment; Swiss PPI.
- Wednesday: UK CPI, PPI; Canada IPPI, RMPI.
- Thursday: Japan trade balance; Australia employment; US GDP final, personal income and spending; PCE inflation.
- Friday: New Zealand CPI; Australia PMIs; Japan BoJ rate decision, CPI, PMIs; UK retail sales, PMIs; Eurozone PMIs; Canada retail sales; US PMIs.
EUR/CHF Daily Outlook
Daily Pivots: (S1) 0.9301; (P) 0.9315; (R1) 0.9326; More....
EUR/CHF's steep dive today suggests that corrective recovery from 0.9268 has completed at 0.9347. Intraday bias is back on the downside. Firm break of 0.9268 will resume the fall from 0.9394, and target 100% projection of 0.9394 to 0.9268 from 0.9347 at 0.9221. Break will bring retest of 0.9178 low. For now, risk will stay on the downside as long as 0.9347 resistance holds, in case of recovery.
In the bigger picture, persistent bullish convergence condition in W MACD is a medium term bullish sign. Firm break of 0.9394 resistance should bring sustained trading above 55 W EMA (now at 0.9360). That should indicate medium term bottoming at 0.9178. Further break of 0.9452 resistance will bring stronger medium term rally towards 0.9928 resistance next, even still as a corrective bounce. Nevertheless, rejection by 55 W EMA will retain bearishness for another fall through 0.9178 at a later stage.
GBP/USD Correction Deepens While USD/CAD Refuses to Break
GBP/USD started a fresh decline below 1.3450. USD/CAD is consolidating gains and might aim for a fresh increase above 1.3900.
Important Takeaways for GBP/USD and USD/CAD Analysis Today
- The British Pound started another decline from 1.3500.
- There is a key bearish trend line forming with resistance at 1.3400 on the hourly chart of GBP/USD at FXOpen.
- USD/CAD is showing positive signs above the 1.3880 support zone.
- There is a key bullish trend line forming with support at 1.3890 on the hourly chart at FXOpen.
GBP/USD Technical Analysis
On the hourly chart of GBP/USD at FXOpen, the pair struggled to continue higher above 1.3500. The British Pound started a fresh decline and traded below 1.3450 against the US Dollar, as discussed in the previous analysis.
The pair even traded below 1.3400 and the 50-hour simple moving average. Finally, the bulls appeared near the 1.3340 level. The recent swing low was formed at 1.3339, and the pair is now consolidating losses.
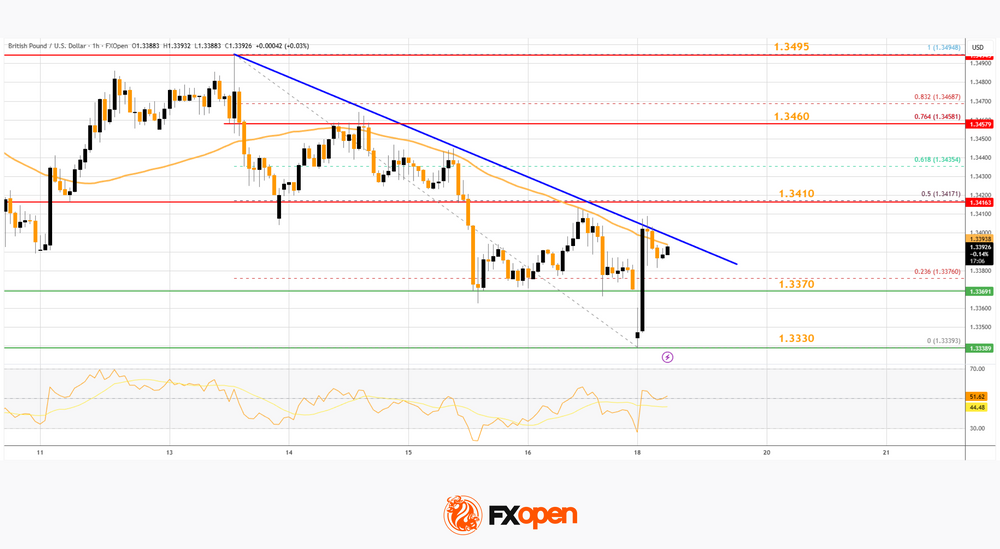
Recently, there was a recovery wave above 1.3370 and the 23.6% Fib retracement level of the downward move from the 1.3494 swing high to the 1.3339 low.
However, the bears were active near the 1.3400 zone. Besides, there is a key bearish trend line forming with resistance at 1.3400. If there is a fresh decline, initial support on the GBP/USD chart sits at 1.3370. The next major area of interest could be 1.3340, below which there is a risk of another sharp decline. In the stated case, the pair could drop toward 1.3280.
Immediate hurdle on the upside is near 1.3400. The first major resistance is 1.3410. The main sell zone sits at 1.3460 and the 76.4% Fib retracement.
A close above 1.3460 might spark a steady upward move. The next stop for the bulls might be near 1.3500. Any more gains could lead the pair toward 1.3550 in the near term.
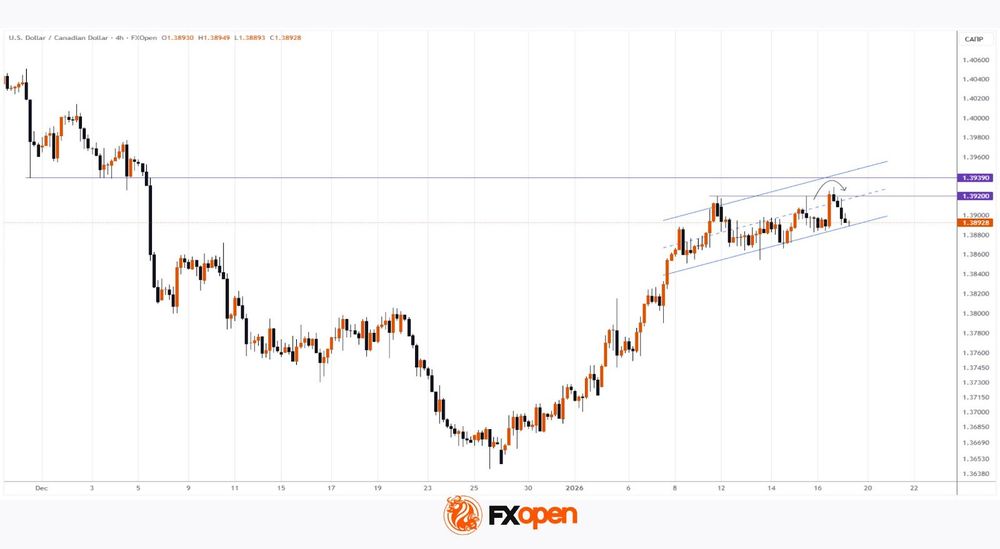
USD/CAD Technical Analysis
On the hourly chart of USD/CAD at FXOpen, the pair formed a strong base above 1.3850. The US Dollar started a fresh increase above 1.3880 and 1.3900 against the Canadian Dollar.
The bulls pushed the pair above the 1.3920 and 1.3925 levels. The pair cleared the 50-hour simple moving average and settled above 1.3880. A high was formed at 1.3928 and the pair is now consolidating gains.

There was a minor pullback below 1.3900, and the 23.6% Fib retracement level of the upward move from the 1.3854 swing low to the 1.3928 high.
Initial support is near a key bullish trend line at 1.3890 and the 50% Fib retracement. The next key breakdown zone could be 1.3880. The main hurdle for the bears might be 1.3870 on the same USD/CAD chart.
A downside break below the 1.3870 could push the pair further lower. The next key area of interest might be 1.3855, below which the pair might visit 1.3800.
If there is another increase, the pair might face hurdles near 1.3910. A clear upside break above 1.3910 could start another steady increase. In the stated case, the pair could test 1.3930. A close above 1.3930 might send the pair toward 1.3965. Any more gains could open the doors for a test of 1.4000.
Trade over 50 forex markets 24 hours a day with FXOpen. Take advantage of low commissions, deep liquidity, and spreads from 0.0 pips (additional fees may apply). Open your FXOpen account now or learn more about trading forex with FXOpen.
This article represents the opinion of the Companies operating under the FXOpen brand only. It is not to be construed as an offer, solicitation, or recommendation with respect to products and services provided by the Companies operating under the FXOpen brand, nor is it to be considered financial advice.
Greenland risk explodes, tilts Gold towards 5000, Silver towards 100
Risk aversion returned abruptly as the new week opened, propelling Gold and Silver to new all-time highs. With sentiment turning defensive, upside risks are building, raising the prospect of Gold extending toward 5,000 and Silver toward 100 should geopolitical tensions worsen.
At the center of the shock were escalating tensions over Greenland. Over the weekend, US President Donald Trump threatened to impose additional tariffs from February 1 on European countries linked to the dispute over control of the Arctic island. He further warned that duties would rise to 25% from June 1 until what he described as a “complete and total purchase” of Greenland is achieved.
The list of countries explicitly targeted was broad and politically sensitive, spanning Denmark, Norway, Sweden, Finland, Germany, France, the Netherlands, and the United Kingdom. By including both EU members and close U.S. allies, the threat immediately raised concerns about a wider transatlantic rupture rather than a contained bilateral dispute.
Trump's shift from rhetorical pressure to concrete economic measures marked a clear escalation and signaled that the administration is prepared to use trade policy again as direct geopolitical leverage. With tariffs now explicitly tied to territorial acquisition, the Greenland threat is real rather than symbolic. The episode has intensified fears of deeper political imbalance within Europe and raised uncomfortable questions about the long-term cohesion of NATO, already strained by diverging strategic priorities.
European leaders reacted quickly, condemning the move as unacceptable and signaling a unified response. After emergency talks on Sunday, EU officials began weighing counter-tariffs worth up to EUR 93 billion on U.S. imports.
Technically, Gold has already met target of 61.8% projection of 3,267.90 to 4,381.22 from 3,997.73 at 4,685.76. There is no sign of topping, and indeed from 4H MACD, Gold might even be trying to reaccelerate.
Sustained trading above 4,685.76 will pave the way to 5,000 psychological level or even 100% projection at 5,111.05. Nevertheless, break of 4536.79 support will indicate short term topping, and bring consolidations first.
Silver is also just inch below 261.8% projection of 36.93 to 54.44 from 48.50 at 94.34 as the up trend resumes today. Near term outlook will remain bullish as long as 86.19 support holds. Firm break of 94.34 will pave the way to 300% projection at 101.13.
China GDP growth slows to 4.5% in Q4, pressure builds for fresh stimulus
China’s economy slowed at the end of 2025, reinforcing concerns that headline growth masks deepening domestic weakness. GDP expanded 4.5% yoy in Q4, down from 4.8% in Q3, in line with expectations. For the full year, growth reached 5.0%, matching the government’s target, but momentum clearly faded as the year closed.
Officials were quick to acknowledge the strain. Kang Yi, head of the National Bureau of Statistics, described 2025’s performance as “hard-won,” citing persistent challenges from strong supply and weak demand—a combination that continues to weigh on private confidence.
Full-year investment data underscored the depth of the slowdown. Fixed asset investment fell -3.8% ytd yoy, marking the first full-year contraction since the 1990s. The property sector remained the biggest drag, with property investment plunging -17.2% and new construction starts down -20.4%, extending a downturn now in its fourth year. Private investment dropped -6.4%, reflecting weak profit incentives amid overcapacity and cautious households.
December activity data showed mixed signals. Industrial production rose 5.2% yoy, improving from November and beating expectations of 5.0%. But retail sales slowed to 0.9% yoy, missing 1.2% forecasts and reinforcing the message that consumption remains the economy’s main weak spot.
The Q4 slowdown increases pressure on Beijing to step up stimulus in 2026 to meet a growth target of 4.5–5.0%. Without a more decisive pivot toward households and consumption, growth is likely to settle in the low- to mid-4% range, forcing policymakers to confront one of the most persistent domestic demand slumps in decades.
Act Three: Greenland
Something quite unusual has been happening to me over the past few weeks: I am losing my words. I lose my words in the absurdity of the news flow. I simply don’t know what to say or how to express myself while staying polite. And every week, since the year began, has kicked off with abnormal news.
The first Monday, it was the US creeping into Venezuela, allegedly to take its president out of his bed and bring him to the US. Oil prices initially jumped, but the rest of the market barely flinched.
Last week, Jerome Powell took a hit, with an investigation into the Federal Reserve’s (Fed) HQ renovations — which he pushed back brilliantly, saying the investigation was not conducted against him, nor against the renovation itself, but was rather an expression of the White House’s frustration with the Fed’s cautious rate-cutting policy. That certainly tempered any market reaction, but it added to unease around the Fed’s independence — and its consequences. Gold and metal prices hit record after record.
This week starts with news that some European countries will be slapped with fresh US tariffs — 10% starting in February, and up to 25% from June onwards — until the US acquires Greenland. Needless to say, gold kicked off the week by refreshing records, hitting $4’690 per ounce in Asia. Silver also traded at a record high, just above $94 per ounce, and copper is also up.
The US Dollar is down on revived trade tensions, and European futures are unsurprisingly preparing for a bearish start to the week. In the US, it’s a bank holiday.
So my feeling, looking at the news flow, is that the foundations of a potentially significant market selloff are being laid — whether due to geopolitical frictions or renewed trade tensions.
This week, world leaders will meet in Davos — the timing is perfect. The potential implications of Greenland will be felt intensely. Europe could manage the tariff crisis with relative calm, but the security dimension may provoke a different reaction. First, only a handful of European countries are facing tariffs — not all of them. I am not a geopolitical expert, but a clear “divide and conquer” dynamic is at play, which could complicate intra-European relations, as the decisions will not have the same impact on every member, and could further weaken the continent. I hope Europeans will think twice before reacting.
The most realistic option would be for Europe to strike back using the so-called Anti-Coercion Instrument, a legal framework that allows the European Union to respond collectively when a third country uses economic pressure to influence EU or member-state policies. Concretely, this could result in retaliatory tariffs — against US Big Tech companies, for example — but also investment restrictions. That may explain why tech-heavy Nasdaq futures are under heavier downside pressure this morning than Dow Jones futures.
What’s clear is that European defence stocks may have plenty more to enjoy amid darkening global skies, and diversification will be key.
Speaking of which, Chinese stocks start the week feeling the pinch of mixed economic data: better-than-expected production and growth figures, but softer-than-expected sales data continue to scream that China needs external demand to keep going.
But, the winds could be turning for China. On Friday, Canada’s Mark Carney met Chinese President Xi Jinping to sign a trade agreement. The pictures were striking — Carney and Xi smiling and shaking hands as if they had been close for years. Yet it has been roughly eight years since the two countries last reached this level of engagement. My guess is that the chances of a similar U-turn in Europe’s stance toward China are increasing.
After all, the notion of shared values with the US is increasingly being questioned.
If you are looking for good news, you have to go all the way to Korea, where geopolitical headlines are no match for the appetite for buying tech. The Kospi index, seemingly careless, has pushed to a fresh record high.
Nearby, however, Japanese equities look less comfortable this morning. Global headlines and rising trade tensions between the US and Europe are not soothing, and the yen continues to struggle. Or rather, yen bulls are struggling to overpower the bears, even though the USDJPY at current levels is deeply frustrating Japanese politicians and keeping officials keen to intervene directly to relieve selling pressure and flush out overheated short positions — at least temporarily. But for now, the yen bears keep charging.
What’s next? The 160 level will likely be the line in the sand that could trigger FX intervention. On the other hand, the so-called Takaichi trade is also running hot — supporting equities while weakening JGBs and the yen. Selling pressure on the yen has intensified since Takaichi called a snap election earlier this month to consolidate power and squeeze further fiscal support. The Bank of Japan (BoJ), meanwhile, is willing to hike rates to tame inflation that has reached levels my generation of Japanese has not seen in adult life. Yet even that has failed to dislodge the yen bears.
Even a broadly weaker dollar this morning has not been enough to push the USDJPY meaningfully lower. The pair dipped to 157.50 before rebounding in Tokyo. What could reverse the yen selling?
Interestingly, there are rumours that Takaichi may not fare well in the upcoming elections. According to these reports, Japan’s largest opposition party and a former ruling coalition partner are forming a bloc — the Centrist Reform Alliance — to oust Takaichi, focusing on improving the lives of ordinary people by halting yen depreciation and fighting inflation. The latest reports suggest the snap election could be held on February 8. Before that, the BoJ is expected to meet this week, but is not expected to change its rate policy just yet. The next BoJ hike could arrive as soon as April if yen weakness persists and inflation remains elevated.
For traders, current levels look tempting for top-sellers — but that also means swimming against a powerful trend. So, don’t be too greedy if you are long the yen.
US Tariff Hike Escalates Transatlantic Greenland Tensions
In focus today
In the euro area, finance ministers are voting on a new ECB vice president, with Latvian central banker Kazāks and former Portuguese central bank governor and Eurogroup President Centeno as top candidates. Their recommendation will be followed by consultations with the European Parliament and ECB Governing Council before formal appointment by the European Council. The appointment will influence the composition of the six-member ECB executive board, with four positions, including the presidency, opening in the next two years. While the decision may temporarily tilt the ECB's balance, consensus to keep rates steady limits significant market impact.
In Sweden, Origo's 'small' inflation expectation survey among money market players is published at CET 08:00. Longer (2-5 years) expectations have been stable close to 2% while 1-year is lower, reflecting that the upcoming food VAT tax cut will be temporary drag on inflation. The report should be market neutral.
Key releases in the week ahead include UK December jobs data on Tuesday and CPI data on Wednesday. On Thursday, Norges Bank will hold its interim policy meeting. On Friday, January flash PMIs for the euro area, UK and US will be released, alongside Swedish unemployment figures. The Bank of Japan is expected to leave policy rates unchanged at its meeting early Friday. Finally, Japanese PM Takaichi may announce a snap election this week, with 8 February tentatively proposed.
Note that US markets are closed for trading today for Martin Luther King Jr. Day.
Economic and market news
What happened overnight
In China, Q4 GDP as well as the monthly batch of data were released. While GDP was in line with expectations at 4.5% y/y and hitting the 5% target for 2025, the monthly data shows China's economy is still struggling with weak domestic demand and continued housing crisis. Retail sales for December rose only 0.9% y/y (prior: 1.3%) while new home prices dropped by 0.37% m/m (prior: -0.39%). Home sales continue to grind lower from very low levels. Investment growth was weak at -3.8% year-to-date in December (prior: -2.6%). Industrial production rose from 4.8% to 5.2% y/y (cons: 5.0% y/y) reflecting strong Chinese exports. The data still point to a two-speed economy that is highly unbalanced and with continued deflationary pressures. The GDP deflator was negative in Q4 at -0.7% y/y after -0.9% y/y in Q3. We expect more of the same in 2026 as it will take time for China to move out of the housing crisis, which is currently weighing on consumers. More stimulus will be needed this year but we expect it again to be insufficient to end the housing crisis at this stage, which is needed to lift domestic demand.
What happened since Friday
In geopolitics, the Greenland debate escalated on Saturday as President Trump announced tariffs on goods from Denmark, Norway, Sweden, France, Germany, the Netherlands, Finland and Great Britain. The tariffs, set to begin at 10% on 1 February, are scheduled to increase to 25% by 1 June unless the US secures a deal to purchase Greenland. In a joint statement, the targeted countries condemned the move, expressing unwavering support for Denmark and Greenland, and warned of significant risks to transatlantic relations.
During an emergency meeting in Brussels on Sunday evening, EU member states agreed to prioritise dialogue and diplomacy with the US and decided to delay the implementation of retaliatory measures until 1 February, should the tariffs take effect then. Various options were discussed, including the use of the anti-coercion instrument (ACI), which restricts trade licenses and blocks access to the single market. The EU could also reactivate a EUR 93 billion retaliation package that was prepared last year in response to earlier trade disputes with the US. So far, the market reaction has been negative but modest, likely due to expectations that the tariffs may be ruled illegal by the Supreme Court within the coming weeks. Attention now turns to updates from the extraordinary summit of the European Council expected in the coming days, along with developments from the World Economic Forum, which is taking place throughout this week.
In the US, industrial production recovered in December, with output growing 0.4% m/m SA (cons: 0.1%) and capacity utilization rising to 76.3% (cons: 76.0%), though still historically low. Fiscal stimulus, tariffs and a weaker USD should lift competitiveness of domestic production, which is needed because goods imports are currently falling clearly behind final demand. At the same time, the US current account deficit narrowed to its lowest level since 2016, despite retail sales and PCE data showing no signs of cooling demand for goods.
In the race for the next Fed chair, President Trump praised economic adviser Kevin Hassett at a White House event on Friday, shaking up the closely contested race for Fed chair between Hassett and Kevin Warsh. Prediction markets now place Warsh as the clear frontrunner with over 50% probability. President Trump is expected to announce a replacement for current Fed Chair Powell in the coming weeks.
Equities: Equities advanced last week, extending what has been a strong start to the year. The most notable feature so far in 2026 has been the broadening of market leadership. This is not the same narrow set of stocks driving performance as last year. Only on Friday, more than two weeks into the year, did large caps marginally outperform small caps. That being said, the Russell 2000 outperformed the Dow Jones, Nasdaq and S&P 500 on Friday. Turning to Asia this morning, several equity markets are trading higher. This is notable given the significant geopolitical escalation over the weekend. In other words, the geopolitical situation so far has a very limited impact on Asian markets. From a relative trade perspective, one could also argue for a marginally positive substitution effect. European and US equity futures are modestly lower this morning. In isolation, this is not particularly remarkable given the situation. The decline is roughly around 1 percent, a move that could easily have occurred on many other days. This already serves as a first illustration of how markets are, at least for now, digesting the geopolitical backdrop.
FI and FX: All focus this morning is on the EU political response and the market reaction to Trump's threat over the weekend to impose tariffs on Denmark and economies opposing the idea of a US takeover of Greenland. So far, the market reaction has been negative but still relatively modest with both US and European equity futures down c. 1%. EUR/USD is trading roughly 30 pips higher from Friday's close, risk sensitive currencies have weakened marginally, and precious metal prices have continued to rise.
A potential reason for the limited responses could be the fact that any US tariffs would have to be implemented under the IEEPA authority which are likely to be ruled illegal by the SCOTUS within the coming weeks. At the time of writing, prediction markets put a roughly 70% likelihood on SCOTUS ruling against Trump's tariffs. If this happens it will be quite difficult for Trump to replace the Greenland-related tariffs. Also, a potential reason for the limited response is that markets still think the economic impact of the tariffs will prove negligible; we are somewhat more sceptical as to this more lenient take.
USD/CAD Climbs to a Six-Week High
On Friday, USD/CAD rose above the 1.3920 level, marking its highest reading since 5 December.
The Canadian dollar is under pressure due to a combination of factors, including:
→ Market assessment of a trade agreement with China. The deal предусматривает sharp cuts in tariffs on electric vehicles and rapeseed. Both countries have also pledged to remove trade barriers and establish new strategic ties. This agreement has prompted a negative reaction from the United States.
→ Weakness in Canada’s labour market. The latest unemployment data for Canada were very soft, showing a rise to 6.8% in December.
→ Upcoming key events. Later today (at 16:30), Canada’s CPI data will be released, followed next week by the Bank of Canada’s interest rate decision.
That said, after USD/CAD has gained around 1.27% since the start of the year, bullish momentum may be fading — and there are signs of this on the chart:
→ First, note the 1.3939 level: in December it acted as support, but was later broken in an aggressive manner. Its proximity may now be providing resistance for the current market.
→ Second, analysing Friday’s price action, we can see that the impulsive rally above local resistance at 1.3920 ended in a bull failure. As indicated by the arrow, the entire advance was subsequently erased.
These observations suggest that bears may be ready to seize the initiative and attempt a break below the local ascending channel (shown in blue). Whether USD/CAD follows this scenario will largely depend on today’s inflation data and on comments from officials.
Trade over 50 forex markets 24 hours a day with FXOpen. Take advantage of low commissions, deep liquidity, and spreads from 0.0 pips (additional fees may apply). Open your FXOpen account now or learn more about trading forex with FXOpen.
This article represents the opinion of the Companies operating under the FXOpen brand only. It is not to be construed as an offer, solicitation, or recommendation with respect to products and services provided by the Companies operating under the FXOpen brand, nor is it to be considered financial advice.