Sample Category Title
EUR/USD Slides Further, Recovery Hopes Start to Thin
Key Highlights
- EUR/USD started a fresh decline below 1.1700 and 1.1650.
- A major bearish trend line is forming with resistance at 1.1665 on the 4-hour chart.
- GBP/USD extended losses and traded below 1.3400.
- Gold started another increase and rallied above $4,650.
EUR/USD Technical Analysis
The Euro failed to clear 1.1800 and started a fresh decline against the US Dollar. EUR/USD traded below 1.1720 and 1.1700 to enter a bearish zone.
Looking at the 4-hour chart, the pair declined below 1.1650 and even spiked below 1.1660. A low was formed at 1.1577, and the pair is now trading well below the 200 simple moving average (green, 4-hour) and the 100 simple moving average (red, 4-hour).
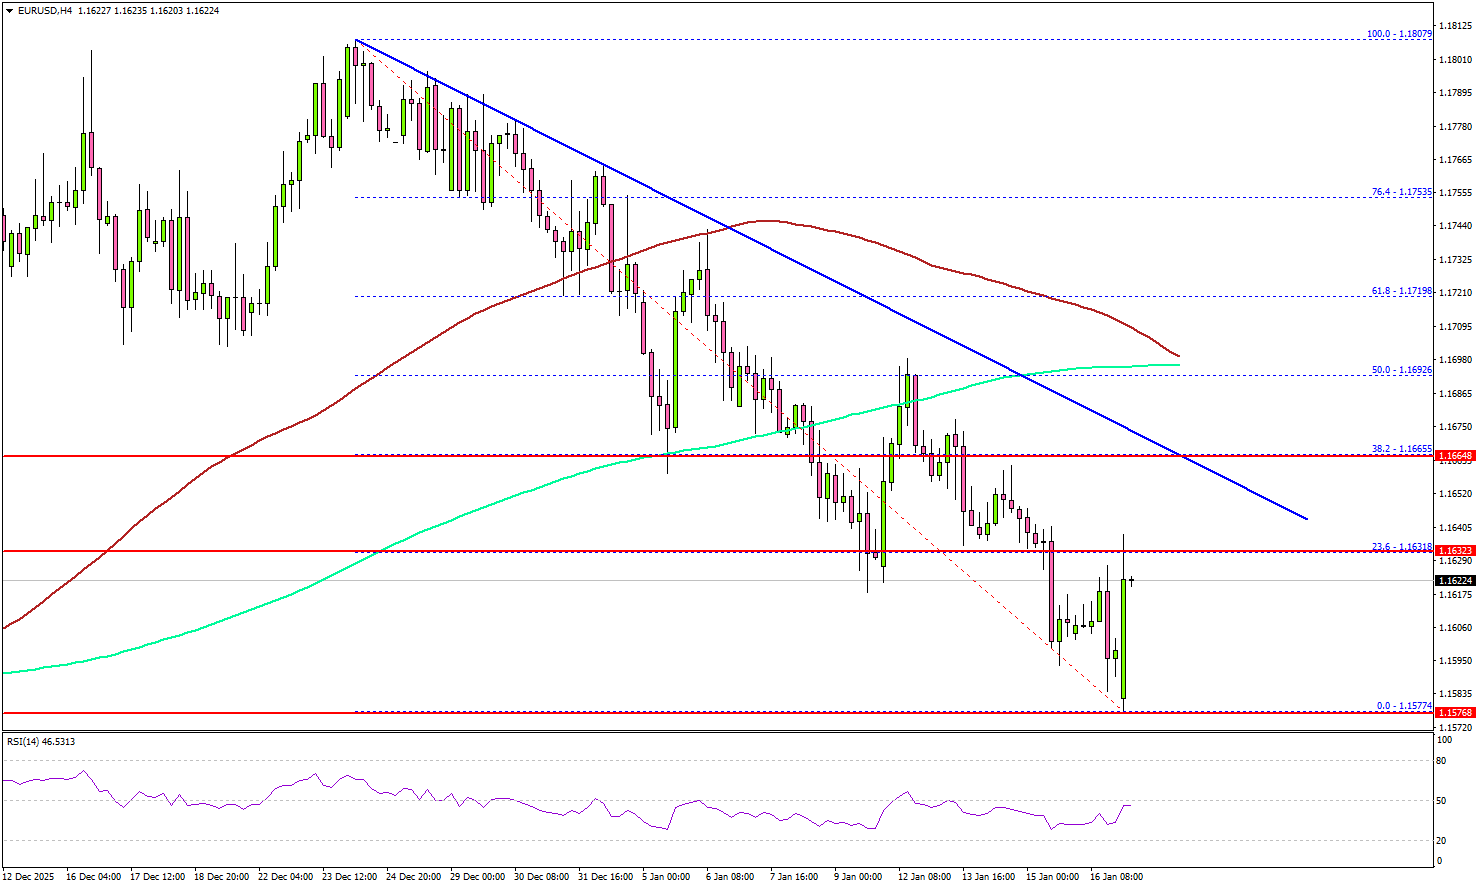
Immediate resistance sits near 1.1630. It is close to the 23.6% Fib retracement level of the downward move from the 1.1807 swing high to the 1.1577 low.
The first key hurdle is seen near 1.1665. There is also a major bearish trend line forming with resistance at 1.1665. A close above 1.1665 could open the doors for a move toward 1.1700. Any more gains could set the pace for a steady increase toward 1.1750.
If there is no move above 1.1665, there could be a bearish reaction. On the downside, immediate support is near the 1.1600 level. The first major area for the bulls might be near 1.1575.
A close below 1.1575 might spark heavy bearish moves. The next support could be 1.1520, below which the bears might aim for a move toward 1.1450.
Looking at Gold, the price started another increase, and the bulls were able to pump the price to a new all-time high above $4,660.
Upcoming Key Economic Events:
- Euro Zone CPI for Dec 2025 (YoY, Preliminary) - Forecast +2%, versus +2% previous.
- Euro Zone CPI for Dec 2025 (MoM, Preliminary) - Forecast +0.2%, versus +0.2% previous.
Fed Pressure, Rising Yields, and Geopolitics Keep Markets Range-Bound
Markets were mostly range-bound last week, with focus on political pressure around U.S. interest rate policy. Reports that the Trump administration’s Justice Department was investigating Federal Reserve Chair Jerome Powell raised concerns about central bank independence, after Trump criticized the Fed for not cutting rates faster. Powell responded publicly, pushing back against the pressure and stating he would defend the Fed’s independence, a stance later supported by several global central bank leaders.
U.S. and Japanese equity markets moved slightly higher and briefly hit record levels, but ended the week little changed. U.S. inflation data came in below expectations, while consumer spending remained strong, with November retail sales rising 0.6%. U.K. GDP also surprised to the upside, growing 0.3%, supporting overall risk sentiment.
U.S. long-term yields rose as markets considered the possibility that the next Fed chair could be less dovish. Meanwhile, ongoing tensions in Iran and the risk of greater U.S. involvement supported safe-haven demand, keeping gold well supported, while geopolitical risks also helped underpin WTI crude oil prices.
Markets This Week
U.S. Stocks
U.S. stocks attempted to move higher last week but repeatedly met resistance near record highs, as rising long-term interest rates made buyers cautious about pushing equities further. The broader uptrend remains intact, with the 10-day moving average continuing to provide support. However, the better short-term trading opportunity may come from a pullback if the Dow breaks below the 10-day moving average in the week ahead. Resistance is seen at 49,500 and 50,000, while support is located at 49,000, 48,000, 47,500, and 47,000.
Japanese Stocks
TThe Nikkei index reached record highs early last week as a weaker yen supported equities. However, the yen later strengthened on rising speculation about possible intervention, leading to some profit-taking and a modest weekly gain for the index. While the broader uptrend remains strong, waiting for pullbacks toward the 10-day moving average looks like the better approach this week. Resistance is seen at 54,000円, 54,500円, and 55,000円, while support is located at 52,500円, 51,500円, and 51,000円.
USD/JPY
USD/JPY surged at the start of the week as long-term Japanese yields rose and there were no signs of intervention from the Bank of Japan above 158. Later in the week, comments from Japanese officials expressing concern over yen weakness triggered profit-taking, leading to a pullback from recent highs. The broader uptrend remains intact, with prices holding above the 10-day moving average and support around 158, keeping the focus on higher levels this week. Resistance is seen at 159, 159.5, and 160, while support is located at 158, 157, and 156.
Gold
Gold had another strong week, reaching new record highs as rising tensions in Iran and the risk of U.S. involvement supported safe-haven demand. Some profit-taking appeared late in the week as U.S. long-term yields rose, with prices testing the 10-day moving average. The uptrend remains intact, favoring buying pullbacks, though a break below the 10-day average could lead to a deeper short-term correction. Resistance is seen at $4,650, $4,700, and $4,750, while support is located at $4,550, $4,450, and $4,400.
Crude Oil
WTI crude broke above the $60 resistance level as unrest in Iran and the risk of U.S. involvement raised concerns over supply disruptions. The breakout ended the recent range-bound trading, with prices now looking to build on recent gains as the 10-day moving average turns higher. Further moves will depend on developments in Iran, with resistance seen at $65, $66.50, $70, and $75, while support is located at $59, $55, and $50.
Bitcoin
Bitcoin extended its recent recovery, moving above resistance at $95,000 as expectations of improved investor protection and regulatory clarity in the U.S. helped support confidence. The market may look to test the $100,000 level in the coming week, while pullbacks toward the $90,000–$92,500 area could offer buying opportunities. Resistance is seen at $100,000 and $105,000, while support is located at $95,000, $90,000, $85,000, and $80,000.
This Week’s Focus
- Monday: Chinese Unemployment Rate, GDP and Industrial Production, Japan Industrial Production, E.U. CPI, U.S. Holiday
- Tuesday: U.K. Unemployment Rate, E.U. ZEW Economic Sentiment
- Wednesday: U.K. CPI and PPI, U.S. Pending Home Sales and Construction Spending
- Thursday: Japan Trade Balance, Australia Unemployment Rate, U.S. GDP, Core PCE Price Index and Personal Spending
- Friday: Japan National CPI, au Jibun Bank Services PMI and BoJ Interest Rate Decision, U.K. Retail Sales and S&P Global Manufacturing PMI, U.S. S&P Global Manufacturing PMI and Michigan Consumer Sentiment
The week may start slowly due to the U.S. holiday on Monday, but volatility could pick up quickly. A U.S. Supreme Court ruling on the legality of tariffs is expected as early as Tuesday, alongside key data releases including U.S. GDP and the Core PCE Price Index. The Bank of Japan is widely expected to keep interest rates unchanged at 0.75%, with the next hike anticipated in April, although continued yen weakness could increase pressure on the BoJ to act sooner.
Eco Data 1/19/26
| GMT | Ccy | Events | Act | Cons | Prev | Rev |
|---|---|---|---|---|---|---|
| 23:50 | JPY | Machinery Orders M/M Nov | -11.00% | -5.10% | 7.00% | |
| 00:00 | AUD | TD-MI Inflation Gauge M/M Dec | 1.00% | 0.30% | ||
| 02:00 | CNY | GDP Y/Y Q4 | 4.50% | 4.50% | 4.80% | |
| 02:00 | CNY | Industrial Production Y/Y Dec | 5.20% | 5.00% | 4.80% | |
| 02:00 | CNY | Retail Sales Y/Y Dec | 0.90% | 1.20% | 1.30% | |
| 02:00 | CNY | Fixed Asset Investment YTD Y/Y Dec | -3.80% | -3.00% | -2.60% | |
| 04:30 | JPY | Tertiary Industry Index M/M Nov | -0.20% | 0.00% | 0.90% | |
| 04:30 | JPY | Industrial Production M/M Nov F | -2.70% | -2.60% | -2.60% | |
| 10:00 | EUR | Eurozone CPI Y/Y Dec F | 1.90% | 2.00% | 2.00% | |
| 10:00 | EUR | Eurozone Core CPI Y/Y Dec F | 2.30% | 2.30% | 2.30% | |
| 13:30 | CAD | CPI M/M Dec | -0.20% | -0.40% | 0.10% | |
| 13:30 | CAD | CPI Y/Y Dec | 2.40% | 2.20% | 2.20% | |
| 13:30 | CAD | CPI Median Y/Y Dec | 2.50% | 2.80% | 2.80% | |
| 13:30 | CAD | CPI Trimmed Y/Y Dec | 2.70% | 2.80% | 2.80% | 2.90% |
| 13:30 | CAD | CPI Common Y/Y Dec | 2.80% | 2.80% | 2.80% | |
| 15:30 | CAD | BoC Business Outlook Survey |
| 23:50 | JPY |
| Machinery Orders M/M Nov | |
| Actual | -11.00% |
| Consensus | -5.10% |
| Previous | 7.00% |
| 00:00 | AUD |
| TD-MI Inflation Gauge M/M Dec | |
| Actual | 1.00% |
| Consensus | |
| Previous | 0.30% |
| 02:00 | CNY |
| GDP Y/Y Q4 | |
| Actual | 4.50% |
| Consensus | 4.50% |
| Previous | 4.80% |
| 02:00 | CNY |
| Industrial Production Y/Y Dec | |
| Actual | 5.20% |
| Consensus | 5.00% |
| Previous | 4.80% |
| 02:00 | CNY |
| Retail Sales Y/Y Dec | |
| Actual | 0.90% |
| Consensus | 1.20% |
| Previous | 1.30% |
| 02:00 | CNY |
| Fixed Asset Investment YTD Y/Y Dec | |
| Actual | -3.80% |
| Consensus | -3.00% |
| Previous | -2.60% |
| 04:30 | JPY |
| Tertiary Industry Index M/M Nov | |
| Actual | -0.20% |
| Consensus | 0.00% |
| Previous | 0.90% |
| 04:30 | JPY |
| Industrial Production M/M Nov F | |
| Actual | -2.70% |
| Consensus | -2.60% |
| Previous | -2.60% |
| 10:00 | EUR |
| Eurozone CPI Y/Y Dec F | |
| Actual | 1.90% |
| Consensus | 2.00% |
| Previous | 2.00% |
| 10:00 | EUR |
| Eurozone Core CPI Y/Y Dec F | |
| Actual | 2.30% |
| Consensus | 2.30% |
| Previous | 2.30% |
| 13:30 | CAD |
| CPI M/M Dec | |
| Actual | -0.20% |
| Consensus | -0.40% |
| Previous | 0.10% |
| 13:30 | CAD |
| CPI Y/Y Dec | |
| Actual | 2.40% |
| Consensus | 2.20% |
| Previous | 2.20% |
| 13:30 | CAD |
| CPI Median Y/Y Dec | |
| Actual | 2.50% |
| Consensus | 2.80% |
| Previous | 2.80% |
| 13:30 | CAD |
| CPI Trimmed Y/Y Dec | |
| Actual | 2.70% |
| Consensus | 2.80% |
| Previous | 2.80% |
| Revised | 2.90% |
| 13:30 | CAD |
| CPI Common Y/Y Dec | |
| Actual | 2.80% |
| Consensus | 2.80% |
| Previous | 2.80% |
| 15:30 | CAD |
| BoC Business Outlook Survey | |
| Actual | |
| Consensus | |
| Previous | |
When the First Crack of 2026 Appears in US Treasuries
The second full week of 2026 was dominated by high-level political and macro headlines, leaving markets in a constant state of reassessment rather than conviction. Traders were confronted with a dense mix of headlines, ranging from renewed scrutiny of the Fed’s independence to mounting speculation over who will succeed Jerome Powell as Fed chair.
At the same time, incoming US data reinforced the message that the Fed is in no hurry to deliver another rate cut. Firm labor market indicators, resilient regional manufacturing surveys, and inflation readings showing no further progress on disinflation kept expectations for near-term easing under pressure, pushing markets to further scale back bets on a Q1 or even early Q2 move.
Geopolitical risks also remained fluid. Fears of imminent US military intervention in Iran eased as Washington adopted a more cautious tone, helping to calm safe-haven demand. However, attention quickly shifted to a new flashpoint, with rising tension between the US and Europe over Greenland introducing fresh political and trade uncertainty into the global outlook.
While markets are still digesting these developments, one move stood out clearly by week’s end: the late selloff in US Treasuries. The 10-year yield broke decisively above the key 4.2% level, signaling a potential shift toward higher term premiums. The impact on US equities and Dollar has so far been restrained, but history suggests such yield moves rarely remain isolated for long.
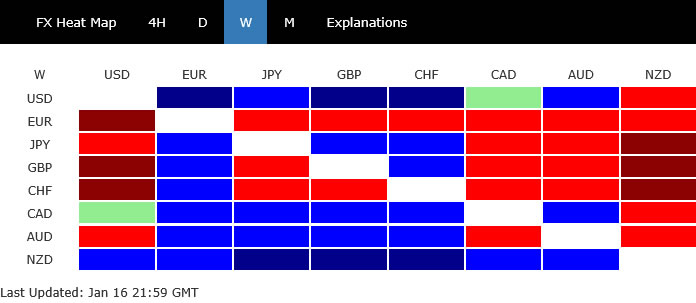
In currencies, Kiwi finished the week as the strongest performer, supported by a string of upbeat domestic data including surging business confidence and a sharp rebound in manufacturing activity. Loonie tied with Dollar for second place. Canadian Dollar found some support as it attempted to claw back recent losses, aided in part by optimism surrounding Canada’s trade agreement with China following Prime Minister Mark Carney’s visit to Beijing.
European currencies underperformed. Euro ended as the weakest major, followed by Swiss Franc and then Sterling, with political and trade risks linked to Greenland adding to existing growth concerns across the region. Yen ended mixed, rebounding intermittently on talk of joint Japan-US intervention and earlier BoJ tightening, while Aussie also traded sideways in the middle of the pack.
US Data Keeps Fed in No Hurry as Cut Bets Fade
US economic data over the past week delivered a consistent message: conditions remain firm enough to keep the Fed firmly on hold. While none of the releases were individually dramatic, together they reinforced the view that policy easing is not imminent and that downside growth risks remain contained.
Inflation data for December showed no further progress toward disinflation. Headline CPI held at 2.7%, while core CPI stayed at 2.6%, undershooting expectations only marginally. The absence of renewed cooling was enough to keep hawkish voices within the FOMC alert to the risk that inflation pressures could linger longer than hoped.
The labor market provided additional of support for that stance. Initial jobless claims fell back below the 200k mark, one of the lowest readings in around a year, signaling that layoffs remain limited. The data directly counters concerns among Fed doves that a sharper labor-market deterioration might be unfolding beneath the surface.
Manufacturing indicators also surprised on the upside. The Empire State index jumped from -3.9 to 7.7 in January, while the Philly Fed survey surged from -10.2 to 12.6. While regional data can be volatile, the synchronized rebound reinforced the perception that US activity has reaccelerated into the new year.
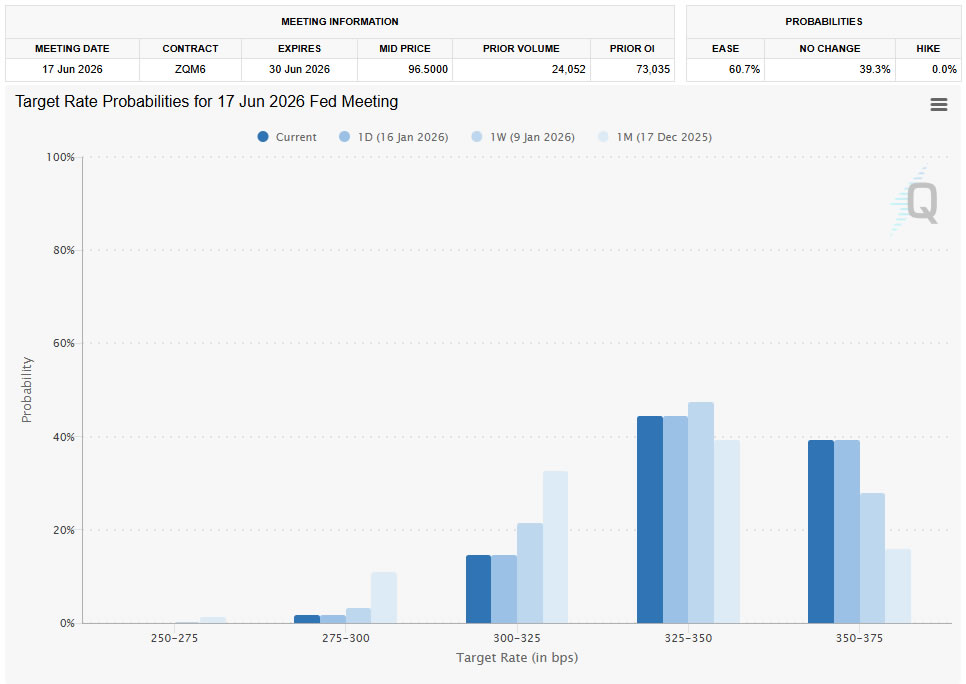
As a result, rate-cut expectations were pared back further. Futures pricing now assigns only around 21% probability to a 25bp cut at the March meeting, down from close to 30% just a week earlier. Markets are increasingly comfortable with the idea that Q1 easing is off the table.
More notably, confidence in a cut by the end of June has also eroded. Odds for a move by then slipped to just above 60%, compared with roughly 73% a week ago. At that level, markets are no longer pricing easing as a base case for the first half of the year.
Fed Chair Succession Shifts as Warsh Emerges as Front-Runner
Another key factor reshaping expectations for US monetary policy this week was renewed focus on who will succeed Jerome Powell when his term as Fed chair ends later this year. While markets have long viewed the race as a two-horse contest, the balance appears to have shifted meaningfully over the past few days.
The contest has centered on National Economic Council Director Kevin Hassett and former Fed Governor Kevin Warsh. Until recently, Hassett was widely seen as President Donald Trump’s preferred choice, given his close alignment with the administration’s economic agenda.
That perception changed after Trump publicly suggested he would prefer Hassett to remain in his current role as his top economic adviser. Praising Hassett during a White House appearance, Trump’s remarks were interpreted by markets as a signal that he may be reluctant to move him out of the NEC.
As a result, Warsh is increasingly viewed as the more likely candidate. Markets generally perceive Warsh as more hawkish, more independent, and more committed to monetary discipline than Hassett. His background as a former Fed governor and his emphasis on price stability have bolstered his credibility among investors concerned about inflation risks.
In policy terms, a Warsh appointment would likely reinforce the Fed’s cautious stance. He is seen as less inclined to front-load rate cuts and more focused on ensuring inflation is decisively under control before easing policy, especially in an environment where inflation expectations remain sensitive.
Crucially, Warsh is also viewed as better positioned to defend the Fed’s institutional independence. At a time when political pressure on the central bank has become a key market concern, that distinction carries significant weight in shaping long-term rate expectations.
If Warsh emerges as Trump’s nominee, the probability of an early rate cut in the first half of the year diminishes further. Even expectations for easing later in the year would likely be tempered.
Fed Independence Shock Reprices Credibility and Yields
One of the most consequential developments shaping markets at the start of 2026 has been the sharp rise in political risk surrounding the Fed. The focus has been on Chair Jerome Powell, who is now under federal criminal investigation related to the renovation of the Fed’s headquarters and his congressional testimony on the issue.
What set this episode apart was Powell’s unusually direct response. In a blunt public statement, he warned that “the threat of criminal charges is a consequence of the Federal Reserve setting interest rates based on our best assessment of what will serve the public, rather than following the preferences of the President.”
Markets reacted less with panic than with repricing. The core concern is not the legal outcome itself, but the signal it sends about political interference in monetary policy. Any perception that the Fed’s independence is being eroded risks undermining confidence in its commitment to price stability.
That concern quickly gained international dimensions. Fourteen major global central bank leaders issued a rare joint statement in support of Powell, emphasizing that central bank independence is a cornerstone of price, financial, and economic stability. The coordinated response highlighted how closely global policymakers are watching developments in Washington.
From a market perspective, the implications are clearest in the bond market. Investors worry that diminished institutional credibility could lift long-term inflation expectations, forcing markets to demand additional compensation for holding longer-dated US Treasuries. That dynamic helps explain the steepening pressure seen at the long end of the curve.
This risk was explicitly flagged by Chicago Fed President Austan Goolsbee, who warned that “anything that’s infringing or attacking the independence of the central bank is a mess.” Speaking to CNBC, Goolsbee cautioned that political interference would almost certainly cause inflation to “come roaring back.”
Importantly, this is not a near-term policy issue alone. Even if the Fed maintains its current stance, lingering doubts about independence could embed a higher structural term premium into yields, altering financial conditions regardless of policy rates. In that sense, the Fed independence risk is already feeding into markets. The selloff in Treasuries may be an early signal that investors are reassessing not just the path of rates, but the credibility framework underpinning US monetary policy.
Greenland Standoff Revives Tariff Risk, Clouds Inflation Outlook
A fourth theme weighing on markets this week was the re-emergence of tariff risk, this time linked to rising tension between the US and Europe over Greenland. While not yet reflected in hard policy action, the rhetoric alone has been enough to reintroduce tariffs into the inflation conversation.
Trump reiterated forcefully his view that US control over Greenland is essential for national security, citing concerns over China and Russia. Although the US already maintains a military presence on the island, Trump framed the issue as strategic rather than symbolic.
More importantly for markets, Trump suggested tariffs could be used as leverage against countries that “don’t go along with Greenland.” For inflation dynamics, timing matters. With US inflation no longer falling and the Fed already reluctant to ease policy quickly, even a temporary inflation uplift could delay policy easing if officials fear second-round effects on wages and expectations.
European economies appear particularly exposed. Euro has already underperformed this week, and the prospect of renewed trade friction adds to existing growth and political challenges across the region. Markets appear to be assigning a modest but growing probability to escalation.
For now, tariffs remain a tail risk rather than a base case. Still, the willingness to openly weaponize trade policy introduces uncertainty that is difficult for central banks to ignore. In that sense, Greenland has become more than a geopolitical talking point. It has evolved into a potential inflation channel, reinforcing the case for caution in pricing aggressive Fed rate cuts.
US 10-Year Yield Breaks 4.2% as Bullish Reversal Builds
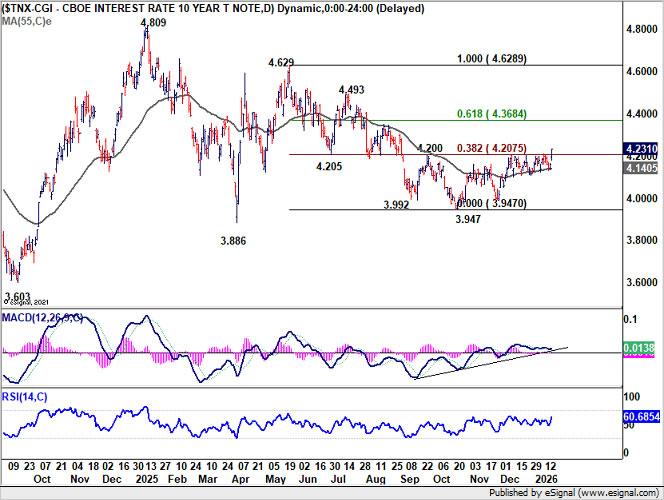
One of the most consequential technical developments of the week was the decisive break higher in the US 10-year yield. The late-week selloff in Treasuries pushed yields firmly above the 4.2% level, a zone that had acted as both technical resistance and a psychological ceiling in recent months.
The break is technically significant. The move cleared 38.2% retracement of 4.629 to 3.947 at 4.207, suggesting that the entire decline from last year’s peak has completed. As long as 55 D EMA (now around 4.140) holds, further upside is favored. The next key target lies at 61.8% retracement of 4.368. Sustained momentum toward that level would confirm that the rebound is more than corrective.
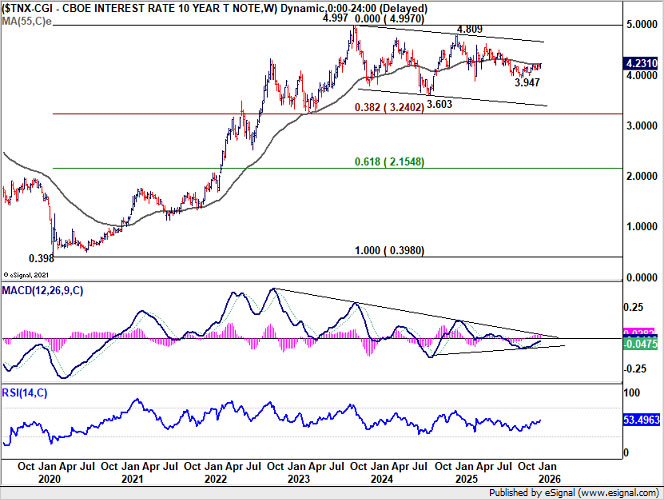
Zooming out to the medium-term structure, price action since 4.997 (2023 high) continues to be viewed a broad consolidation pattern. 10-year yield remain well supported above 38.2% retracement of 0.398 (2020 low) to 4.997 at 3.240, keeping the secular uptrend intact.
One interpretation is that the three-wave corrective decline from 4.809 (2025 high) has ended at 3.947. If that view holds, the current advance would represent the start of a new impulsive leg higher for retest of 4.809. A break beyond that level would reopen the path toward the 2023 high at 4.997. Sustained trading above 55 W EMA (now near 4.211) would further reinforce this bullish case.
Dollar Lags Yield Breakout, Awaits Equity Signal
Despite the sharp rise in US yields last week, Dollar Index posted only modest gain. One explanation lies in resilient risk sentiment. US equities continued to absorb higher yields without major stress, reducing the need for defensive Dollar positioning. As long as stocks remain firm, Dollar’s upside from yield differentials alone appears constrained.
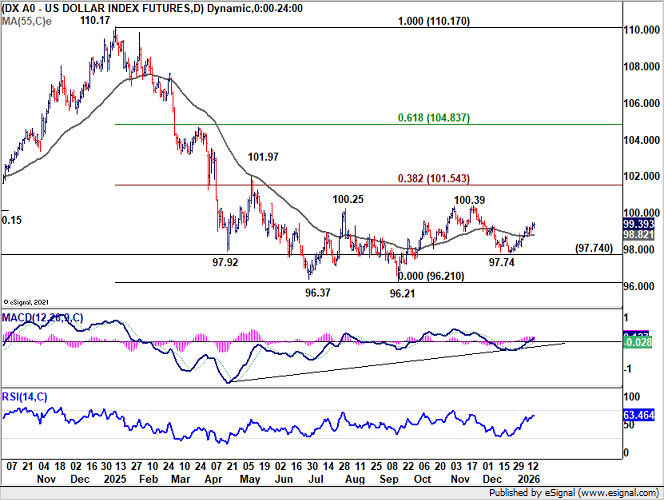
Technically, rise from 97.73 in Dollar Index is seen as the third leg of the corrective pattern from 96.21 (2024 low). Further rise is expected as long as 55 D EMA (now at 98.82) holds, to 100.39 resistance and above.
But strong resistance is expected from 38.2% retracement of 110.17 to 96.21 at 101.54 to limit upside to complete the corrective bounce. Nevertheless, this view is subject to change if there is notable pickup in upside momentum. So D MACD will be monitored closely ahead.
So far, US stocks have shown little concern over higher yields, tariff rhetoric, or Fed credibility risks. Outlook remains bullish, but there is risk of a pullback ahead.
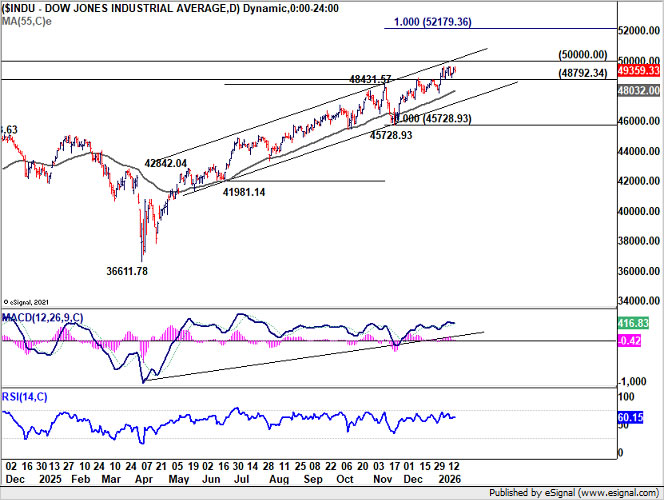
For DOW, the key lies in 50,000 psychological level, which is just a few hundred points away. Break of 48,792.34 near term support will indicate first rejection by 50k, and bring pullback to 55 D EMA (now at 48,032.00), or below. However, decisive break of 50k will pave the way to 100% projection of 41,981.14 to 48,431.57 from 45,728.93 at 52,179.36, probably within Q1. In such development, there would be little chance for Dollar Index to stage a near term bullish trend reversal.
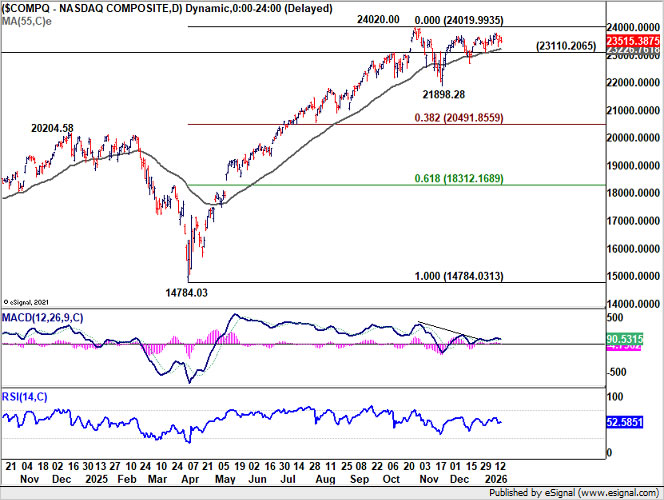
NASDAQ is clearly lagging behind other major indexes as it's still capped below the record high of 24,020.00 set back in October. On the downside, break of 23110.20 support would argue that the corrective pattern from 24,020.00 has started the third leg, and would target 21,898.28 support and below. In this case, there would be corresponding pullback in DOW, which together should give Dollar Index a lift. However, decisive break of 24,020.00 will resume the long term up trend and indicate that full-fledge risk-on markets are back.
EUR/USD Weekly Outlook
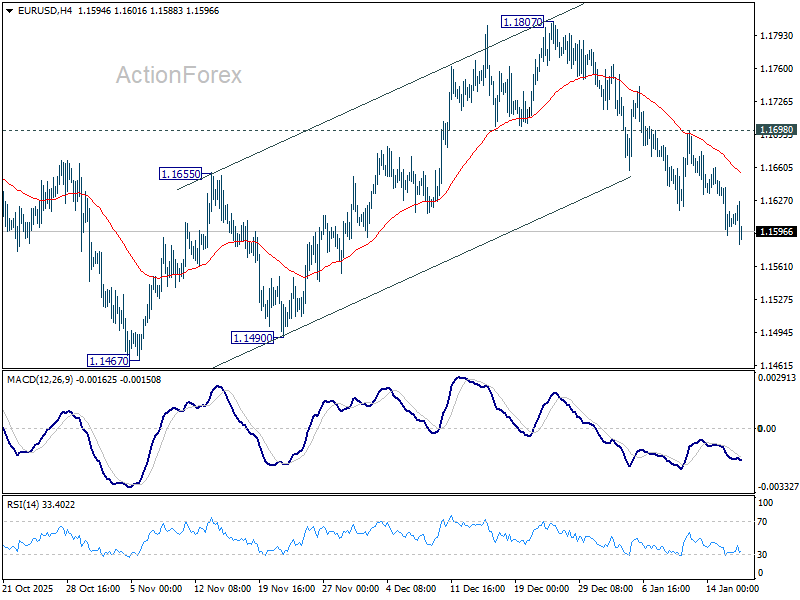
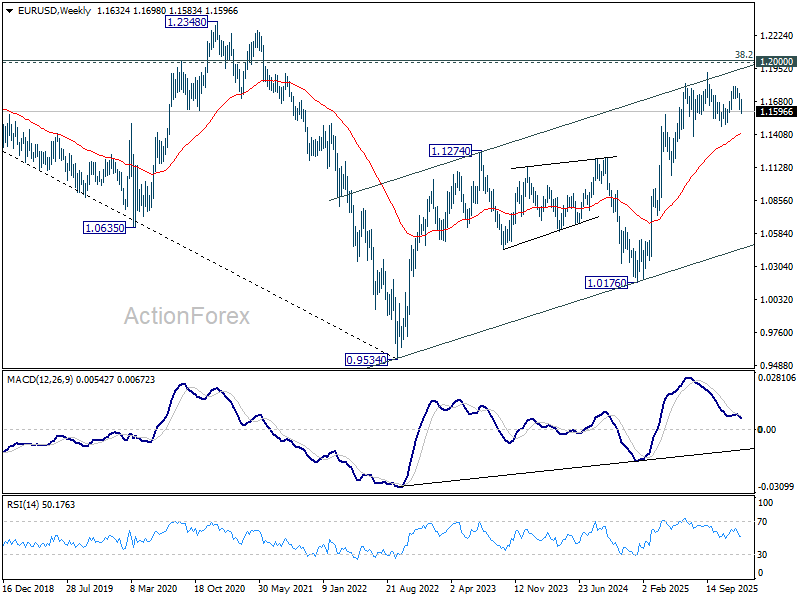
EUR/USD's fall from 1.1807 continued last week and the development solidifies that it's in the third leg of the corrective pattern from 1.1917. Initial bias stays on the downside this week for 1.1467 and below. For now, risk will stay on the downside as long as 1.1698 resistance hods, in case of recovery.
In the bigger picture, as long as 55 W EMA (now at 1.1413) holds, up trend from 0.9534 (2022 low) is still in favor to continue. Decisive break of 1.2 key psychological level will carry larger bullish implication. However, sustained trading below 55 W EMA will argue that rise from 0.9534 has completed as a three wave corrective bounce, and keep long term outlook bearish.
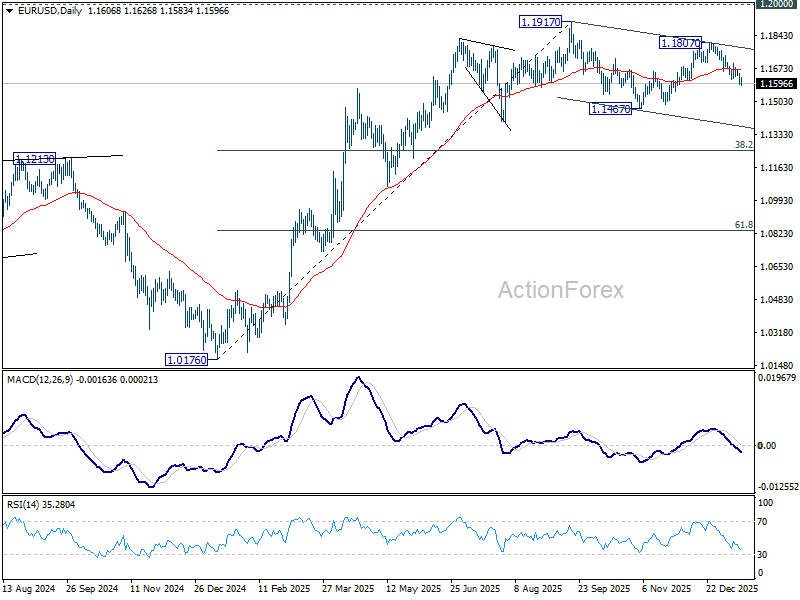
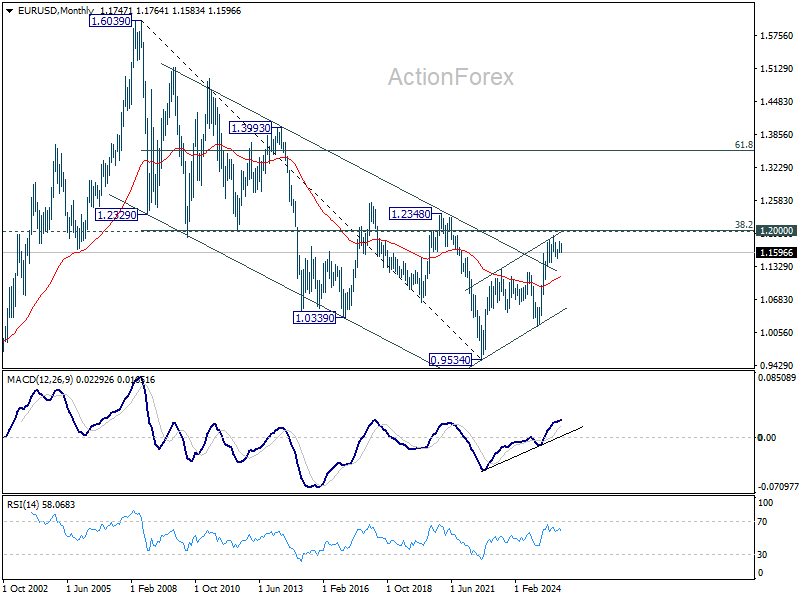
In the long term picture, 38.2% retracement of 1.6039 to 0.9534 at 1.2019, which is close to 1.2000 psychological level is the key for the outlook. Rejection by this level will keep the multi decade down trend from 1.6039 (2008 high) intact, and keep outlook neutral at best. However, decisive break of 1.2000/19, will suggest long term bullish trend reversal, and target 61.8% retracement at 1.3554.
EUR/USD Weekly Outlook
EUR/USD's fall from 1.1807 continued last week and the development solidifies that it's in the third leg of the corrective pattern from 1.1917. Initial bias stays on the downside this week for 1.1467 and below. For now, risk will stay on the downside as long as 1.1698 resistance hods, in case of recovery.
In the bigger picture, as long as 55 W EMA (now at 1.1413) holds, up trend from 0.9534 (2022 low) is still in favor to continue. Decisive break of 1.2 key psychological level will carry larger bullish implication. However, sustained trading below 55 W EMA will argue that rise from 0.9534 has completed as a three wave corrective bounce, and keep long term outlook bearish.
In the long term picture, 38.2% retracement of 1.6039 to 0.9534 at 1.2019, which is close to 1.2000 psychological level is the key for the outlook. Rejection by this level will keep the multi decade down trend from 1.6039 (2008 high) intact, and keep outlook neutral at best. However, decisive break of 1.2000/19, will suggest long term bullish trend reversal, and target 61.8% retracement at 1.3554.
USD/JPY Weekly Outlook
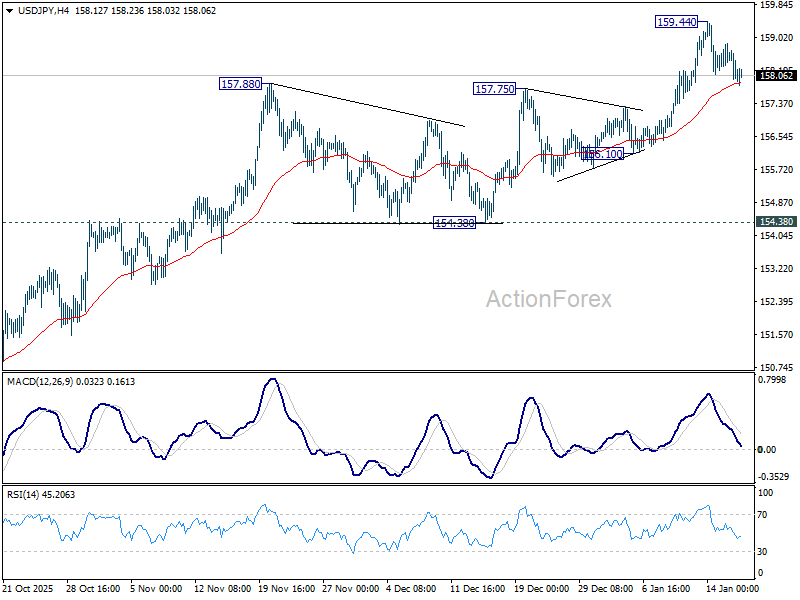
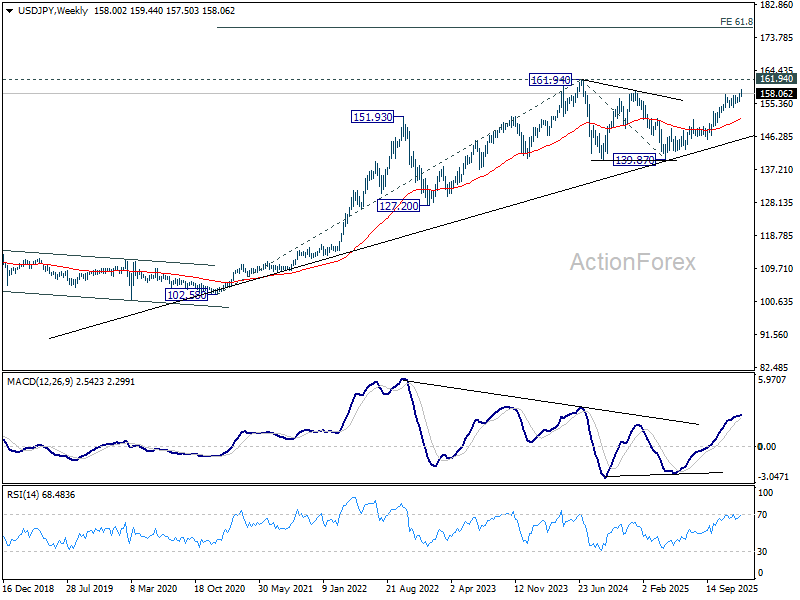
USD/JPY edged higher to 159.44 last week but retreated since then. Initial bias remains neutral this week first and more consolidations could be seen. Deeper fall cannot be ruled out. But still, outlook stays bullish as long as 156.10 support holds. On the upside, break 159.44 will resume the rise from 139.87 towards 161.94 high.
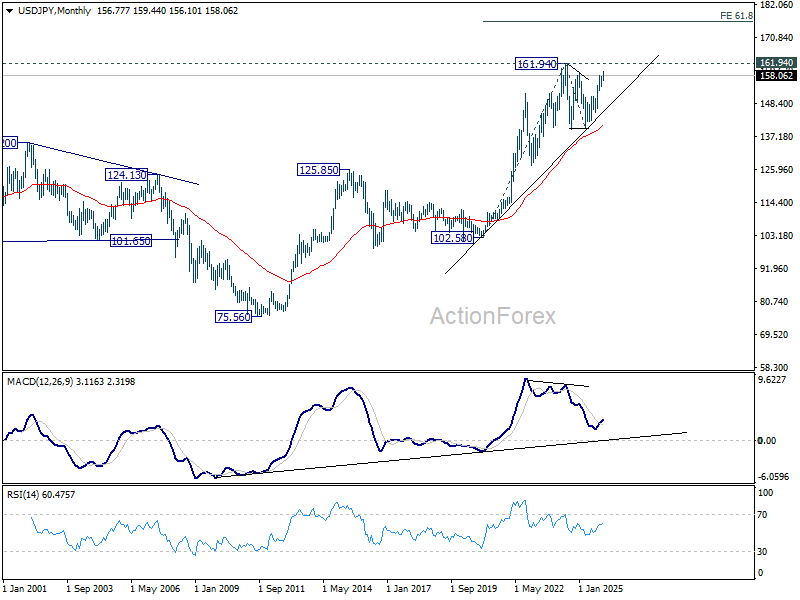
In the bigger picture, corrective pattern from 161.94 (2024 high) should have completed with three waves at 139.87. Larger up trend from 102.58 (2021 low) could be ready to resume through 161.94. Decisive break of 158.86 structural resistance will solidify this bullish case and target 161.94 for confirmation. On the downside, break of 154.38 support will dampen this bullish view and extend the corrective range pattern with another falling leg.
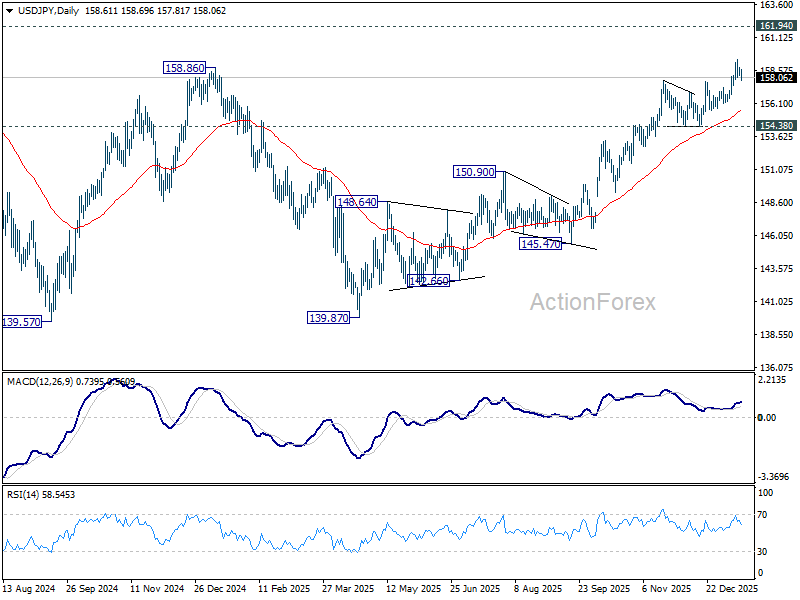
In the long term picture, up trend from 75.56 (2011 low) is still in progress and might be ready to resumption. Firm break of 161.94 will target 61.8% projection of 102.58 (2020 low) to 161.94 (2024 high) from 139.87 at 176.55 in the medium term.
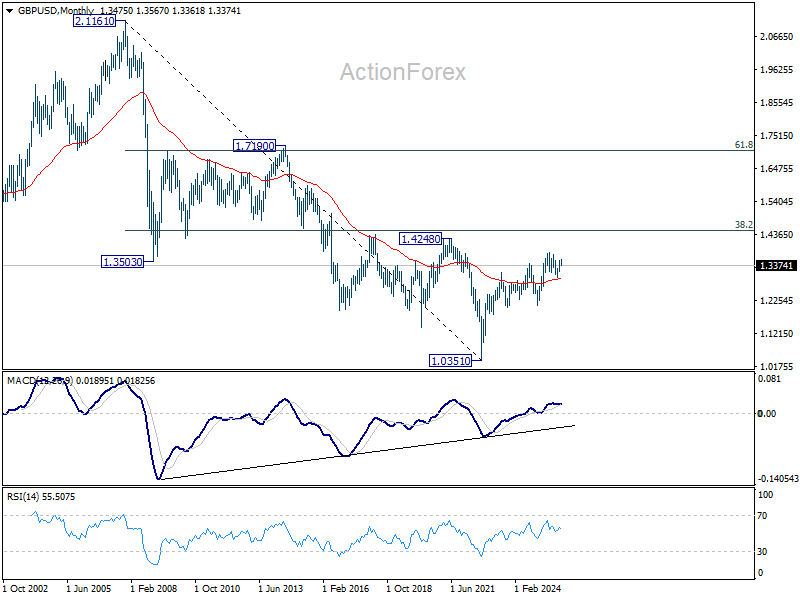
GBP/USD Weekly Outlook
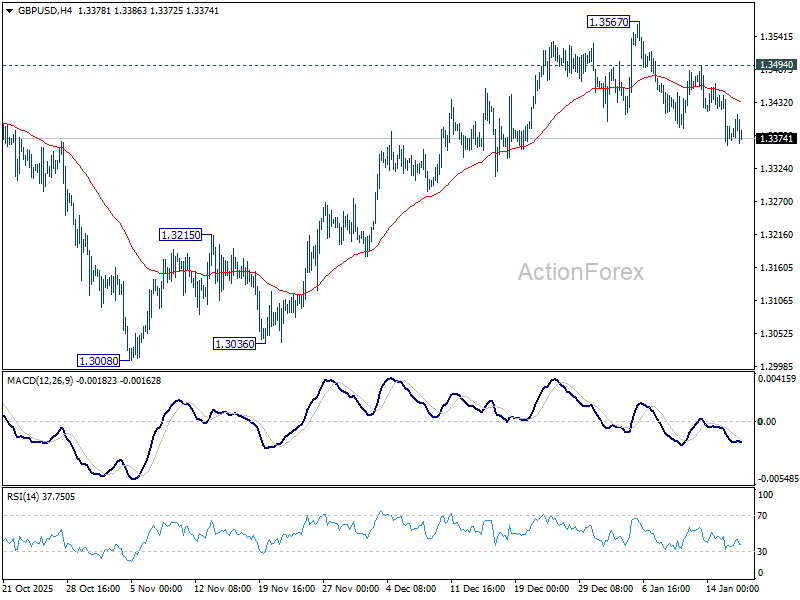
GBP/USD's fall from 1.3567 short term top extended lower last week. Initial bias stays on the downside this week. Sustained trading below 55 D EMA (now at 1.3374) will argue that the decline is another falling leg in the corrective pattern from 1.3787. In this case, deeper fall should be seen back to 1.3008 support. For now, risk will stay mildly on the downside as long as 1.3494 holds, in case of recovery.
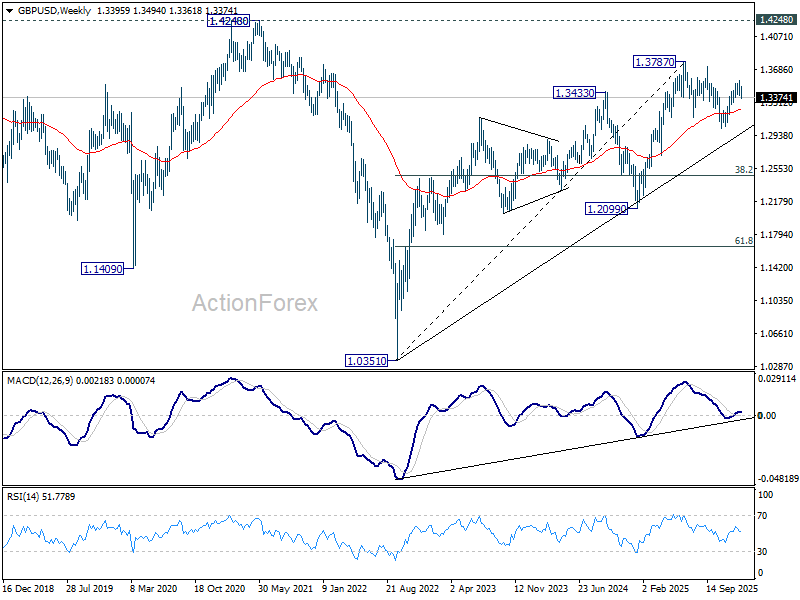
In the bigger picture, price actions from 1.3787 (2025 high) are seen as a correction to the larger up trend from 1.3051 (2022 low). Deeper decline could be seen as the pattern extends, but downside should be contained by 38.2% retracement of 1.0351 to 1.3787 at 1.2474 to bring rebound. Break of 1.3787 for up trend resumption is expected at a later stage.

In the long term picture, as long as 1.4248/4480 resistance zone holds (38.2% retracement of 2.1161 to 1.0351 at 1.4480), the long term outlook will remain bearish. That is, price actions from 1.3051 are seen as a corrective pattern to down trend from 2.1161 (2007 high) only. Nevertheless, decisive break of 1.4248/4480 will be a strong sign of long term bullish reversal.
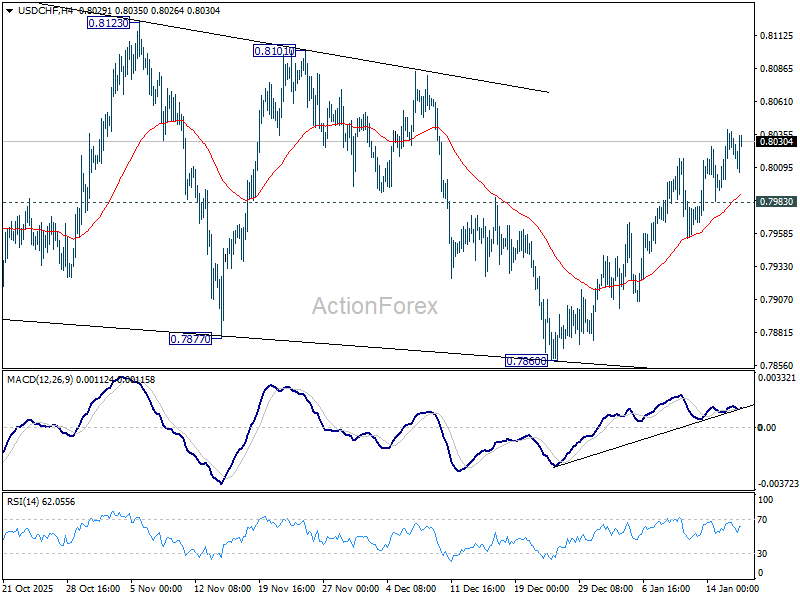
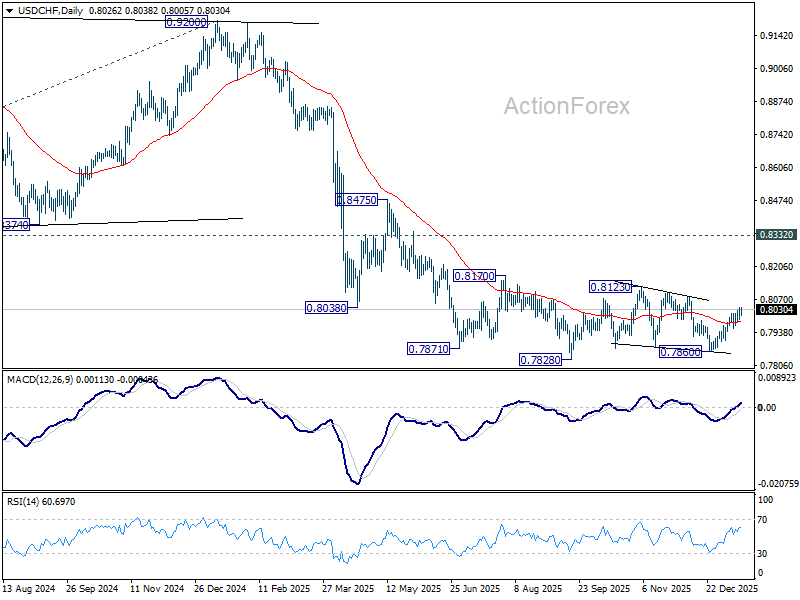
USD/CHF Weekly Outlook
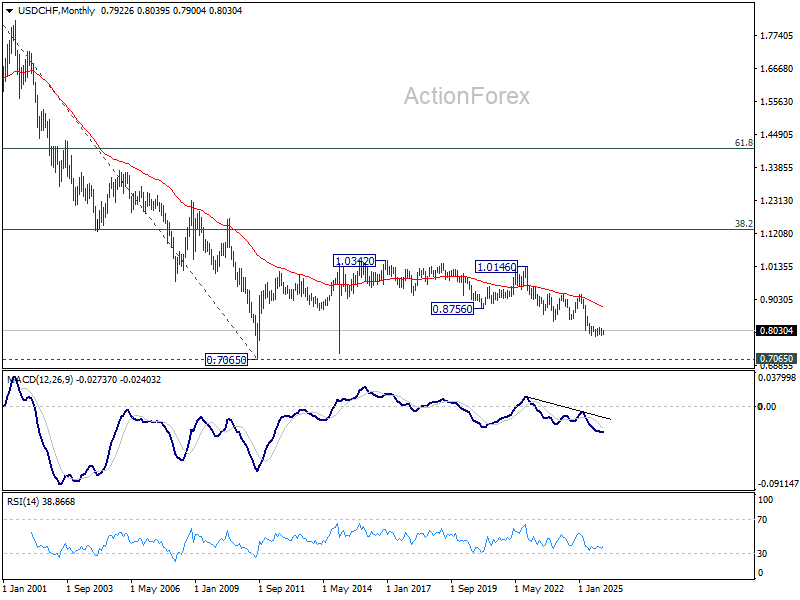
USD/CHF's rise from 0.7860 continued last week even though momentum hasn't been too convincing. Initial bias stays on the upside this week for 0.8123 resistance. On the downside, below 0.7983 minor support will turn bias neutral first. Overall, corrective pattern from 0.7828 is extending.
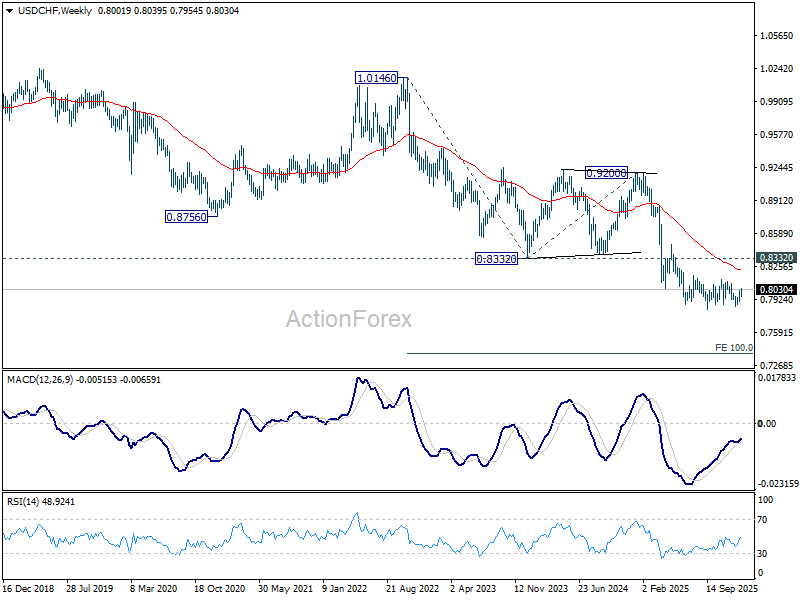
In the bigger picture, price actions from 0.7828 are seen as a correction. Larger down trend from 1.0342 (2017 high) is still in progress. Break of 0.7828 will target 100% projection of 1.0146 (2022 high) to 0.8332 from 0.9200 at 0.7382. In any case, outlook will stay bearish as long as 0.8332 support turned resistance holds (2023 low).
In the long term picture, price action from 0.7065 (2011 low) are seen as a corrective pattern to the multi-decade down trend from 1.8305 (2000 high). It's uncertain if the fall from 1.0342 is the second leg of the pattern, or resumption of the downtrend. But in either case, outlook will stay bearish as long as 0.8756 support turned resistance holds (2021 low). Retest of 0.7065 should be seen next.
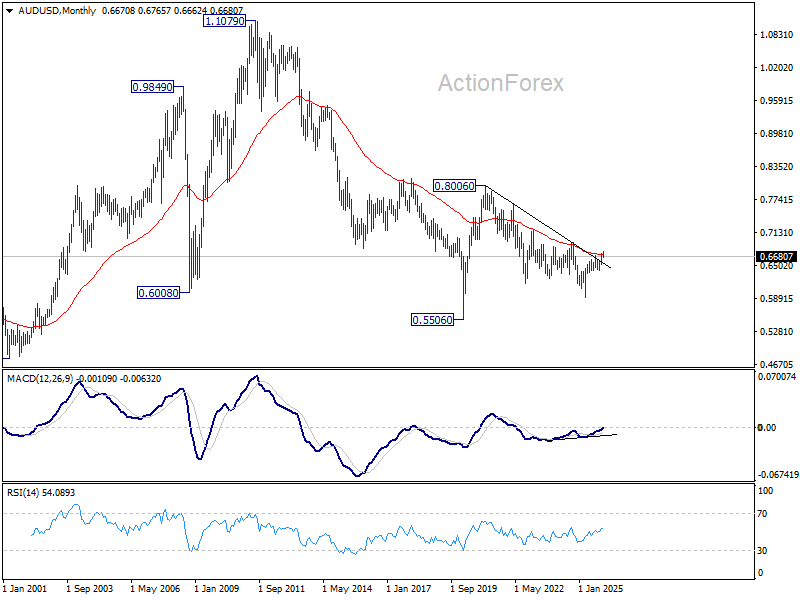
AUD/USD Weekly Report
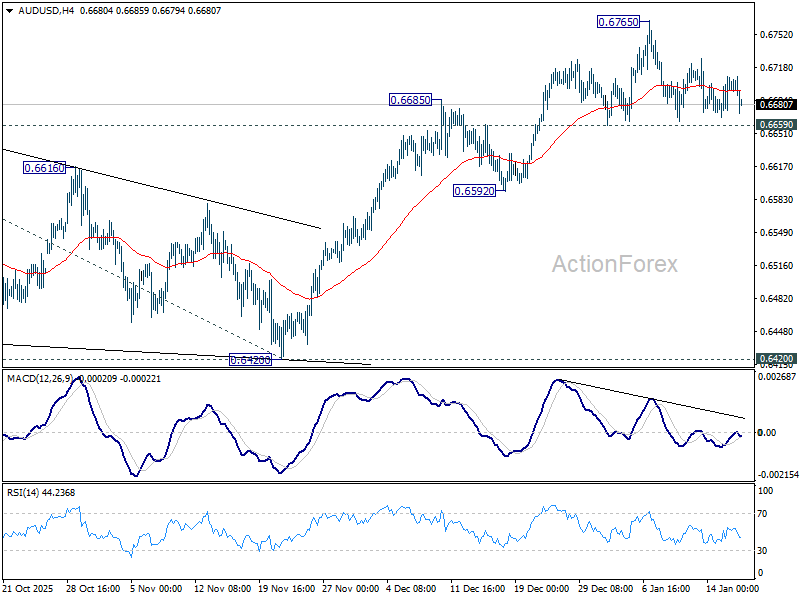
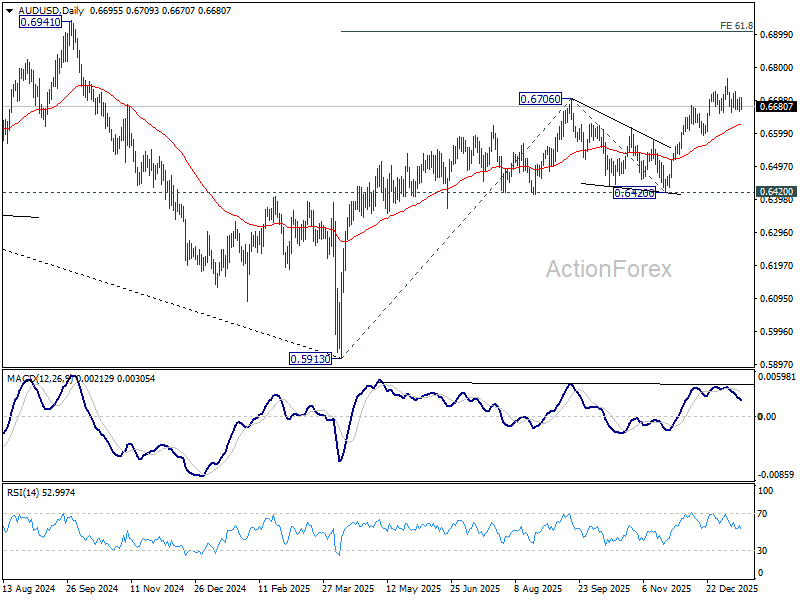
AUD/USD remains bounded in range of 0.6659/6765 last week. Initial bias stays neutral this week and further rise is in favor. On the upside, above 0.6765 will resume the whole rise from 0.5913 and target 61.8% projection of 0.5913 to 0.6706 from 0.6420 at 0.6910. However, considering bearish divergence condition in 4H MACD, firm break of 0.6659 will confirm short term topping, and bring deeper correction back to 55 D EMA (now at 0.6627) and below.
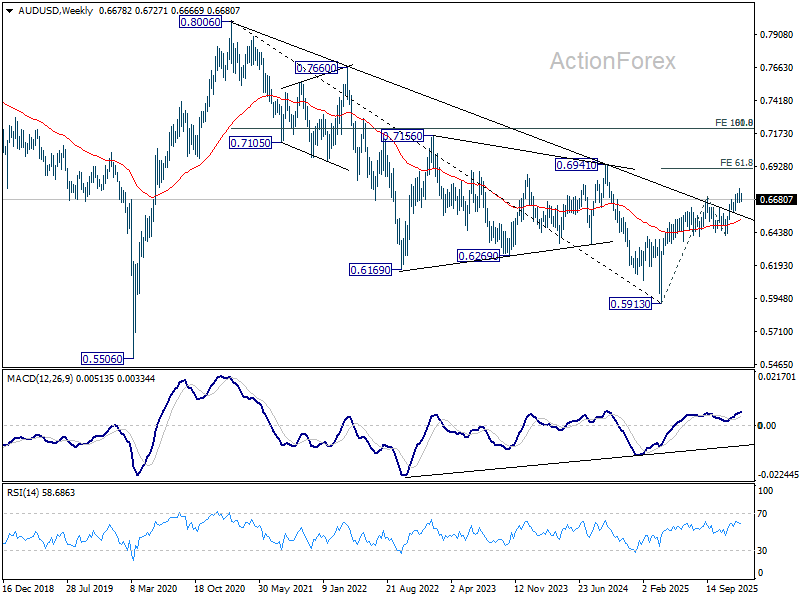
In the bigger picture, current development argues that rise from 0.5913 (2024 low) is reversing whole down trend from 0.8006 (2021 high). Further rally should be seen to 61.8% retracement of 0.8006 to 0.5913 at 0.7206. This will remain the favored case as long as 0.6420 support holds, even in case of deep pullback.
In the long term picture, rise from 0.5913 is tentatively seen as the third leg of the pattern from 0.5506 (2020 low). Sustained trading above 55 M EMA (now at 0.6711) will solidify this medium term bullish case. It's still early to judge if this is an impulsive or corrective pattern. But in either case, firm break of 0.6941 will open up further rise back to 0.8006. However, rejection by the 55 M EMA will retain bearishness and bring another fall through 0.5913.
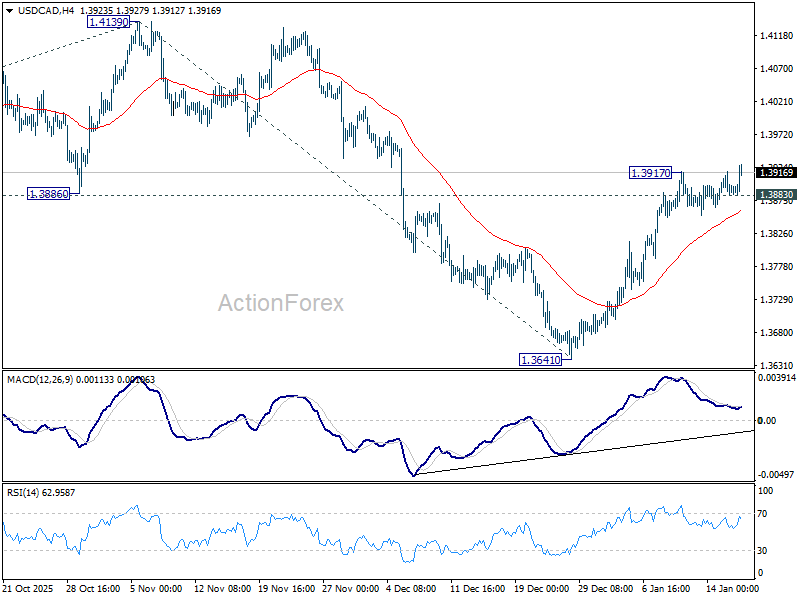
USD/CAD Weekly Outlook
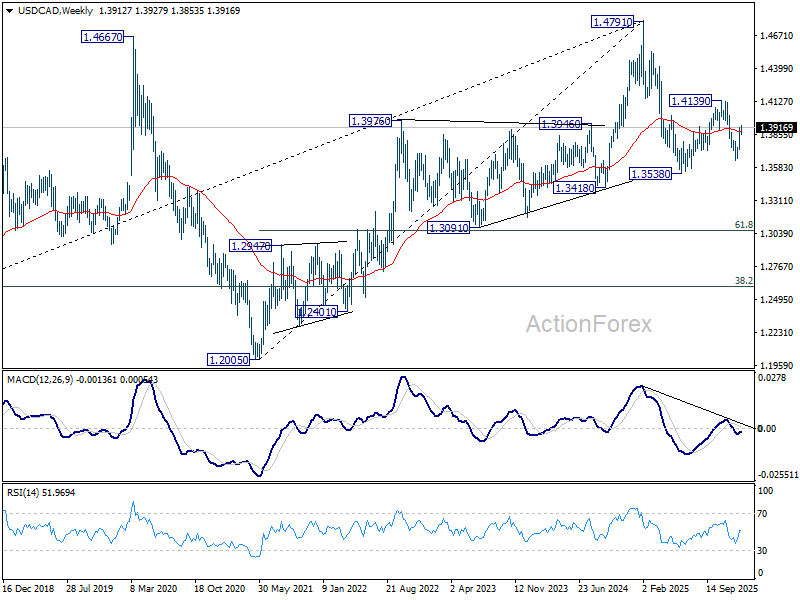
USD/CAD's rise from 1.3641 continued last week, and the late break of 1.3917 suggests that it's resuming. Initial bias is back on the upside this week. As in the third leg of the corrective pattern from 1.3538, further rise should be seen to 1.4139 first. Break there will target 100% projection of 1.3538 to 1.4139 from 1.3641 at 1.4242. On the downside, below 1.3883 minor support will turn intraday bias neutral first.
In the bigger picture, price actions from 1.4791 are seen as a corrective pattern to the whole up trend from 1.2005 (2021 low). Deeper fall could be seen as the pattern extends, and break of 1.3538 will target 61.8% retracement of 1.2005 to 1.4791 at 1.3069. For now, medium term outlook will be neutral until there are signs that the correction has completed.
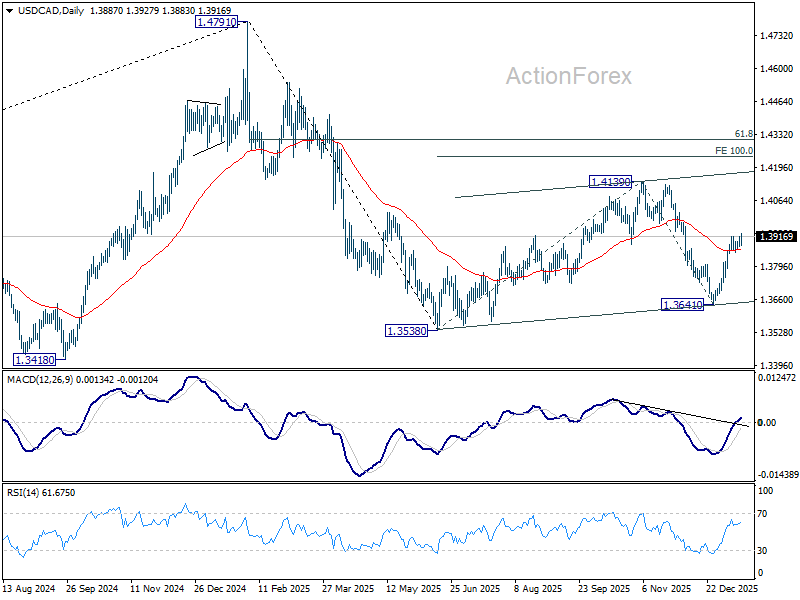
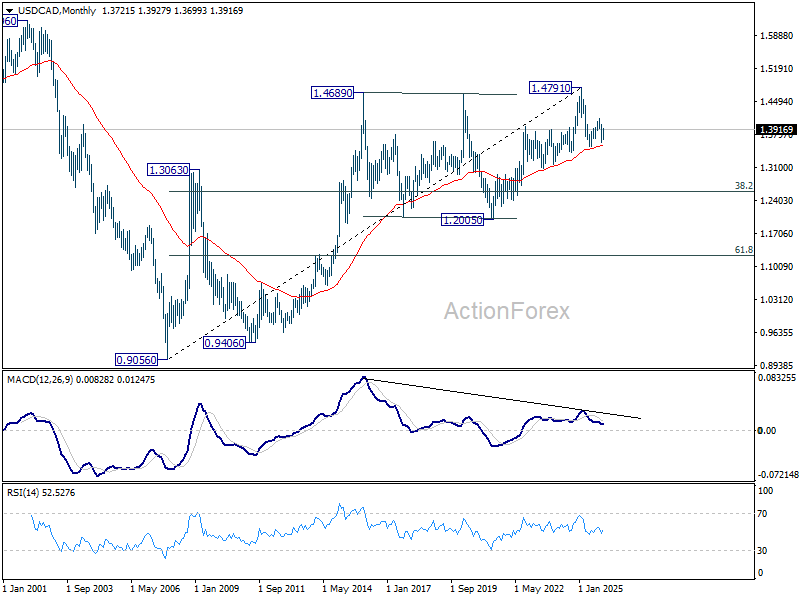
In the long term picture, rising 55 M EMA (now at 1.3576) remains intact. Thus, up trend from 0.9056 (2007 low) should still be in progress. However, considering bearish divergence condition M MACD, sustained trading below 55 M EMA will argue that the up trend has completed with five waves up to 1.4791, and turn medium term outlook bearish for correction to 38.2% retracement of 0.9056 to 1.4791 at 1.2600.