Sample Category Title
ECB accounts signal patience, reject directional bias
The December meeting accounts showed the ECB broadly aligned with prevailing market rate expectations of not rate move in the near term. Nevertheless, the accounts emphasized that patience should not be misread as inertia.
While the Governing Council felt policy was “in a good place,” members stressed that this did not imply a static stance. The ECB retains flexibility to respond as conditions evolve, indicating that patience does not equate to reluctance to act or a one-sided reaction function.
Uncertainty featured prominently in the discussion. Novel risks—including the AI-driven investment boom, potential U.S. tariffs, and concerns over Chinese dumping—cloud the outlook. While some members saw risks skewed toward inflation undershooting the target, a smaller group warned of overshoot risks.
Against that backdrop, "it was important not to give the impression that the next move would be in one direction or the other, or to suggest any tightening or easing bias," the minutes noted.
(ECB) Monetary policy accounts
Account of the monetary policy meeting of the Governing Council of the European Central Bank held in Frankfurt am Main on Wednesday and Thursday, 17-18 December 2025
22 January 2026
1. Review of financial, economic and monetary developments and policy options
Financial market developments
Ms Schnabel started her presentation by noting that, since the Governing Council’s previous monetary policy meeting on 29-30 October 2025, the financial market narrative that ECB interest rates were in a good place had been further consolidated. Incoming data had reinforced expectations that inflation would remain close to the 2% target over the medium term and that the euro area economy would grow at a rate near potential. On the back of the resilient economy and stickier services inflation, expectations of further rate cuts had vanished, with both markets and survey participants expecting policy rates to remain at their current levels for an extended period. Better than expected macroeconomic data and the reappraisal of monetary policy expectations had also pushed longer-term risk-free rates higher, a development driven by real rates, while the euro exchange rate had remained within a narrow range. Strong global risk sentiment had kept equity markets at high levels, while sovereign and corporate bond spreads had remained compressed and volatility in euro area money markets had remained limited. Overall, euro area financial conditions had tightened slightly since October 2025 but had fluctuated in a narrow range since the ECB’s last rate cut in June 2025, remaining closely aligned with its key policy rates.
Since the Governing Council’s October monetary policy meeting, the overnight index swap (OIS) forward curve had shifted significantly upwards, as investors had priced out any additional interest rate cut in 2026, in line with the median expectation reported in the Survey of Monetary Analysts. Beyond 2026, both market pricing and the survey participants suggested that the ECB’s next policy move would be a rate hike, after an extended period of stable rates. While interest rate markets saw the first hike coming in 2027, surveys put it no earlier than 2028. At the same time, the option-implied uncertainty around the expected path for ECB policy rates had decreased substantially. The key driver of the change in policy rate expectations had been the more resilient outlook for euro area growth. As indicated by the Citigroup Economic Surprise Index, incoming macroeconomic data for the euro area had mostly surprised on the upside in 2025, as the implications of US trade tariffs had turned out to be more benign than originally anticipated. This was also reflected in resilient global economic activity. Moreover, the range of data surprises in 2025 had been more contained than in any other year over the past two decades in spite of the high level of geopolitical uncertainty, underlining the euro area’s resilience.
The pricing out of rate cuts in 2026 on the back of better macroeconomic data had also had an impact on longer-term risk-free rates. The euro area ten-year nominal OIS rate had increased by 26 basis points since the October meeting, driven primarily by higher real rates. A decomposition into structural drivers showed that domestic factors, namely positive macroeconomic developments in the euro area and expectations of tighter ECB monetary policy, had been the main drivers of higher longer-term rates.
Market-based indicators of inflation compensation across horizons had remained broadly unchanged since the previous monetary policy meeting. The one-year inflation-linked swap (ILS) rate two years ahead had hovered around 1.85% since August, corresponding to around 1.95% when including tobacco. A small uptick had been observed since the previous meeting, after data prints had indicated that inflation, and especially services inflation, had been stickier than expected. The five-year ILS rate five years ahead remained close to but slightly above 2%, indicating broadly anchored longer-term inflation expectations. The euro exchange rate had been range-bound since July 2025, with the EUR/USD exchange rate fluctuating between 1.14 and 1.18.
The resilient and improving macroeconomic environment had supported investors’ risk appetite, keeping equity markets near record highs. Concerns about stretched valuations in the technology sector due to potential overcapacities and questions over long-term profitability had contributed to elevated volatility in US share prices, affecting equity markets globally. Notably, US and euro area benchmarks, which had remained broadly unchanged since the previous monetary policy meeting, had performed almost identically in the year to date, after diverging markedly earlier in the year. The artificial intelligence (AI) rally over recent years had not been limited to US companies, as euro area firms that made intensive use of AI had also seen strong gains. Grouping European companies by their AI intensity, those with a high level had outperformed firms with medium and, especially, low levels over the past three years.
The implications of a market correction in AI-related companies would likely not be limited to institutional investors. Euro area retail investors had become increasingly exposed to US equity markets in recent years, mainly indirectly through investment funds. Since late 2020, euro area households’ holdings of US equities had more than doubled to roughly one-third of households’ total equity portfolio. A correction in this market segment could have meaningful consequences for euro area households.
Looking ahead, developments in the US technology sector would not only affect global equity markets. As debt issuance by US hyperscalers in 2025 had been more than four times the levels seen in 2023 and 2024, and was projected to grow further, this could also have implications for corporate and sovereign bond markets if strong demand for highly rated US technology debt were to crowd out other fixed income assets.
The current low-volatility, risk-on environment had extended into fixed income markets. Sovereign bond spreads over the OIS rate across euro area jurisdictions had continued to narrow in recent weeks. The dispersion of sovereign bond yields across euro area countries had converged towards ranges last observed in the period 2001-07, before the global financial crisis. Strong risk sentiment had also been evident in corporate bond markets. Bond spreads had remained at compressed levels for euro area investment grade and high-yield corporates, outperforming US peers.
The new ECB staff Macro-Finance Financial Conditions Index for the euro area showed that, throughout the latest policy cycle, developments in financial conditions had tracked the ECB’s key short-term rate very closely. They had tightened during the hiking phase, plateaued during the holding phase, eased when rates had been cut and remained broadly stable since the last interest rate cut in June. This suggested that ECB policy actions had been smoothly transmitted to financial conditions.
Finally, Ms Schnabel turned to developments in money markets. In the United States, the spread between the general collateral repo rate and the Federal Reserve System’s interest rate on reserve balances had been subject to sharp volatility over recent months, as excess liquidity had become less ample. By contrast, euro area general collateral repo rates stood close to the ECB’s deposit facility rate and had shown limited volatility. Looking ahead, excess liquidity in the euro area was expected to decline further, owing primarily to redemptions in the monetary policy portfolios alongside additional absorption from the growth in banknotes.
The global environment and economic and monetary developments in the euro area
Mr Lane then went through the latest economic, monetary and financial developments in the global economy and the euro area.
Starting with inflation developments in the euro area, Mr Lane noted that the overall inflation rate had held steady at 2.1% in November and had been stable within a narrow range since the spring. While energy inflation and services inflation had risen over the last three months and now stood, respectively, at -0.5% and 3.5%, food inflation and goods inflation had eased to 2.4% and 0.5% respectively.
The updated assessment reconfirmed that inflation should stabilise at the Governing Council’s 2% target in the medium term. The December 2025 Eurosystem staff macroeconomic projections for the euro area saw headline inflation, as measured by the Harmonised Index of Consumer Prices (HICP), averaging 2.1% in 2025, 1.9% in 2026, 1.8% in 2027 and 2.0% in 2028. The projected decline in inflation in 2026 consisted of two phases: in the early months of 2026, the increases in energy prices seen in early 2025 would drop out of the annual rates and, later in 2026, gradually lower services inflation and food inflation should underpin lower overall inflation. Headline inflation was expected to stay below 2%, on average, in 2026 and 2027: energy inflation was seen to remain negative over most of this period, while non-energy inflation gradually declined. However, headline inflation should return to target in 2028 on the back of a strong rise in energy inflation. This mainly reflected the upward effect on energy prices from the introduction of the EU Emissions Trading System 2 (ETS2), which was now expected to start in 2028, one year later than assumed in the previous staff projections in September. Inflation excluding energy was seen stabilising at around 2% in 2027-28.
Relative to the September projections, headline inflation had been revised up by 0.2 percentage points for 2026, owing mainly to recent upside surprises in energy and services inflation, but had been revised down by 0.1 percentage points for 2027, as a higher projected path for services inflation was more than offset by downward revisions to energy inflation. Core inflation – excluding the volatile components of energy and food from the HICP – was projected to ease from 2.4% in 2025 to 2.2% in 2026 and 1.9% in 2027, before settling at 2.0% in 2028. This decline was expected to be supported by lower wage pressures and the past appreciation of the euro.
Indicators of underlying inflation had changed little over recent months and remained consistent with the 2% medium-term target. Annual growth in the GDP deflator had been stable in the third quarter at 2.4%. Unit profit growth had been unchanged at 1.0%, while unit labour cost growth had edged up by 0.1 percentage points to 3.2%. Looking ahead, the buffering role of profits was projected to fade gradually as margins improved. However, domestic cost pressures were still projected to ease over the next 12 months before stabilising just above 2%, as productivity picked up and labour cost pressures moderated.
The annual rate of change in the labour cost index, which measures the total hourly cost of employing labour, had edged down by 0.4 percentage points to 3.4% in the third quarter. Negotiated wage growth remained volatile but had turned out as expected. It had fallen to 1.9% in the third quarter from 4.0% in the second quarter, partly owing to base effects from one-off payments made in 2024 in some countries. However, the broader measure of growth in compensation per employee had surprised to the upside on account of higher wage drift. It had been unchanged at 4.0% in annual terms in the third quarter, 0.8 percentage points above what had been anticipated in the September projections. While growth in compensation per employee was now expected to moderate more slowly than previously anticipated, the December staff projections saw a deceleration over the coming quarters followed by a stabilisation at levels around 3% towards the end of 2026. Forward-looking indicators, such as the ECB’s wage tracker and surveys on wage expectations, signalled a similar deceleration.
Most measures of longer-term inflation expectations continued to stand at around 2%, supporting the stabilisation of inflation around target. The latest Survey of Monetary Analysts showed a medium-term inflation profile similar to the one in the December staff projections. Market-based indicators of inflation compensation were marginally below the staff projections over the forecast horizon but were closer to 2% at longer horizons.
Turning to the external environment, the euro had appreciated significantly against the US dollar and in nominal effective terms in the first half of the year. This strengthening had levelled off since July. Since the Governing Council’s October monetary policy meeting, the euro had been relatively stable against the US dollar and in nominal effective terms. Oil spot prices had fallen around 7% below the levels observed at the time of the previous monetary policy meeting, with gas prices declining by around 14%. Food prices had declined slightly over the same period. Compared with the September staff projections, the oil price assumptions underlying the December projections had been revised down by around 4% on average for 2026 and 2027, and gas prices by 8.6%, while the euro had depreciated by 0.5% against the US dollar and by 0.1% in nominal effective terms.
Global economic activity had remained resilient. The outlook for global import growth and foreign demand had been revised up in the December staff projections, owing mainly to positive data surprises. However, the incoming data suggested a slight contraction in global import growth in the third quarter and the global economic growth outlook was still subdued relative to the pre-pandemic average. Volumes of euro area imports from China had continued to increase in the third quarter, rising in annual terms by 4.9%. At the same time, the decline in euro area prices for imports from China had accelerated in the third quarter, with prices in euro falling by 4.8% in annual terms. The evidence so far pointed to only a limited role being played by trade diversion, with excess production capacity and weak domestic demand in China continuing to be the dominant factors.
The euro area economy had been resilient. It had grown by 0.3% in the third quarter, primarily owing to increased consumption and investment. Exports had also increased, reflecting a significant contribution from chemicals, with weight-loss drugs playing a key role. However, on account of a very strong rise in imports, net exports had weighed on growth in the third quarter.
The sectoral composition of growth had been dominated by services, especially in the information and communication sector, while activity in industry and construction had remained flat. Recent surveys suggested that this pattern of services-led growth was likely to continue in the near term, with manufacturing remaining subdued.
The economy had continued to benefit from a resilient labour market. Unemployment, at 6.4% in October, was close to its historical low. Employment had grown by 0.2% in the third quarter, compared with 0.1% in the second quarter. At the same time, labour demand had cooled further. The job vacancy rate had declined to its lowest level since the pandemic, easing to 2.2% in the third quarter from 2.3% in the second quarter.
Regarding fiscal policies, the December staff projections entailed limited changes at the euro area aggregate level compared with the September projections. After a slight decline to 3.0% of GDP expected in 2025, the euro area budget deficit was projected to increase to 3.3% of GDP in 2026 and 3.5% of GDP in 2027, and to moderate only slightly to 3.4% of GDP in 2028. The euro area debt-to-GDP ratio remained on an upward path over 2026-28.
Domestic demand was expected to remain the main driver of growth over the projection horizon. Real incomes were set to rise further and the saving rate should gradually come down from its elevated level, supporting consumption. Business investment and substantial government expenditure on infrastructure and defence should increasingly underpin the economy over the coming years. However, the challenging backdrop for global trade was likely to remain a drag on euro area growth in 2025 and 2026. The December staff projections saw real GDP growth of 1.4% in 2025, 1.2% in 2026 and 1.4% in both 2027 and 2028.
Relative to the September projections, GDP growth had been revised up by 0.2 percentage points for 2025 and 2026, and by 0.1 percentage points for 2027. These upward revisions mostly reflected stronger domestic demand. The latest Survey of Monetary Analysts pointed to real GDP growth in line with the December staff projections for 2025 and 2027 but saw growth rates that were 0.1 and 0.2 percentage points lower in 2026 and 2028 respectively.
Market rates had increased since the last monetary policy meeting. After declining in response to the ECB’s policy rate cuts over the previous year, bank lending rates for firms had stood at 3.5% in October, unchanged from September. The cost of issuing market-based debt had been 3.4%, close to its September level. The average interest rate on new mortgages had again held steady, at 3.3% in October.
Bank lending to firms had grown by 2.9% on a yearly basis in October, unchanged from September. Corporate bond issuance had risen by 3.2%, broadly unchanged as well. Mortgage lending had strengthened, growing by 2.8% in October after 2.6% in September. While credit growth had been slowly recovering over the year, it remained weaker than would be expected on the basis of historical regularities. In part, subdued growth of credit to firms and households could reflect a shift in asset allocation strategies by banks, with a greater focus on bond purchasing and lending to non-bank financial intermediaries.
Monetary policy considerations and policy options
Based on this assessment, Mr Lane proposed that the Governing Council keep the three key ECB interest rates unchanged. While headline inflation was projected to be below target in 2026 and 2027, this could be attributed to volatile energy prices; non-energy inflation should remain at or slightly above 2% throughout the projection horizon. The risks surrounding the outlook continued to call for a data-dependent approach to monetary policy, with no pre-commitment to a particular rate path.
2. Governing Council’s discussion and monetary policy decisions
Economic, monetary and financial analyses
Regarding the economic analysis, members broadly agreed with the assessment provided by Mr Lane in his introduction. Although the global growth outlook had improved, it remained subdued relative to its pre-pandemic average. The global economy, driven by China and the United States, had proven more resilient than anticipated, suggesting that trade tensions had left fewer traces than originally feared – at least so far. The outlook for the United States had been upgraded on account of more resilient domestic demand, supported in the near term by positive wealth effects stemming from higher equity prices, higher fiscal spending and AI-related investment. For China, the growth outlook had been revised slightly up to reflect stronger than expected export dynamics and greater fiscal stimulus. Frontloading related to tariff threats and a booming trade in technology goods helped to explain the strong global trade performance in 2025. However, high-frequency trade-related data had weakened significantly compared with the first half of the year, and tariffs could yet exert a growing drag on global trade growth in the coming quarters. At the same time, lower trade policy uncertainty would probably cushion some of the tariff headwinds, and global supply chain disruptions had remained contained so far. The euro had been relatively stable against the US dollar and in nominal effective terms since the Governing Council’s October meeting. However, there was a risk that the dollar could depreciate owing to a potentially easier than expected monetary policy stance in the United States.
The “second China shock” – referring to the country’s increased global presence in more advanced products and technologies – was widely highlighted as a major challenge for the euro area economy. While the euro area seemed not to be a leader in the development of new AI technology, China was becoming a strong competitor in the euro area’s traditional industries. Additionally, the ongoing weakness in China’s domestic economy was likely to reinforce its incentive to export excess supply at low prices, including in third-country markets, thereby reducing the euro area’s market shares. Beyond these competitiveness challenges from China, it was also observed that the EU would eventually face increasing competition from India.
Geopolitical risks also remained elevated. The main pillars of the global geopolitical landscape had been changing rapidly. It was argued that these developments might raise uncertainty for an extended period and adversely affect the growth dynamics of the euro area economy.
With regards to economic activity, members concurred with the assessment presented by Mr Lane. The euro area economy had been resilient, growing by 0.3% in the third quarter, mainly reflecting stronger consumption and investment. Exports had also increased, with a significant contribution from chemicals. The sectoral composition of growth had been dominated by services, especially in the information and communication sector, while activity in industry and construction had remained flat. This pattern of services-led growth was likely to continue in the near term. The economy was benefiting from a robust labour market. Unemployment, at 6.4% in October, was close to its historical low, and employment had grown by 0.2% in the third quarter. At the same time, labour demand had cooled further, with the job vacancy rate at its lowest level since the pandemic. The December staff projections saw domestic demand as the main engine of growth in the years ahead. Real incomes were set to rise further and the saving rate should gradually come down from its still high level, supporting consumption. Business investment and substantial government spending on infrastructure and defence should increasingly underpin the economy. However, the challenging environment for global trade was likely to remain a drag on growth in the euro area in 2025 and 2026.
It was highlighted that the euro area economy had surprised to the upside, despite the dramatic change in global trade policies over the past year and general geopolitical uncertainty. There had been a string of positive macroeconomic surprises since October. Weak net exports had been more than compensated for by strong domestic demand. The robust labour market continued to support private consumption. Investment had also significantly contributed to growth, supported by favourable financing conditions, the decline in global trade policy uncertainty and an increase in AI-related activities. In this context, it was also suggested that the capacity of the economy to absorb shocks may have been underestimated and that downside risks had not materialised to the extent previously expected.
The December staff projections for euro area growth had been revised up across the projection horizon. Remarkably, despite the greatest trade disruption since the Second World War, the euro area economy was projected to grow at 1.4% in 2025, which was 0.5 percentage points more than expected in the March staff projections preceding the April announcement of higher US tariffs. Over the coming years, the economy was set to grow steadily at around or slightly above potential, with the output gap expected to close faster than previously forecast. The macroeconomic narrative of a recovery driven by domestic demand remained intact, while trade was expected to recover over the projection horizon. It was suggested that, overall, this looked almost like a “Goldilocks forecast”. It was also argued that there were some upside risks to the staff projections for growth. Private investment in the euro area’s largest economy could pick up earlier than projected owing to a crowding-in effect from the fiscal package announced in March, and consumption could grow more strongly than expected in light of strong wage growth. More generally, fiscal multipliers could be higher than assumed and the fiscal stance across the euro area could be looser than expected in the outer years of the projection horizon. In addition, the projections embedded a relatively strong impact from the appreciation of the euro, which might not materialise.
At the same time, it was argued that economic resilience did not constitute economic dynamism. Growth was not exceptionally strong and potential growth remained modest. Moreover, the staff projections were quite dependent on private investment and net exports, expenditure components which were both facing large challenges owing to the “second China shock” and the volatile external environment, including the growing fragmentation of the world economy. In addition, even with the US-EU trade deal and the related reduction in uncertainty, tariffs on euro area exports to the United States had increased considerably since the start of the year and were still likely to have some lagged effects. Given all of this, an export-driven expansion was not viable and stronger domestic demand was deemed crucial for the euro area to face its external challenges.
There were also risks to domestic demand. It was argued that private consumption was relatively fragile. Although consumption was expanding, it had not yet picked up strongly and, according to one view, it seemed unlikely to become the decisive engine behind the recovery. In particular, given increasing pressure on public finances, households might have doubts about fiscal sustainability, which could be reflected in a high saving rate if they expected higher taxes and lower welfare spending in the future – a behaviour often described as the Ricardian saving motive. This was in line with findings of the recent Consumer Expectations Survey, which had shown households perceiving Ricardian and precautionary motives to be the main drivers of their saving behaviour. Concerns about government debt tended to strengthen the Ricardian saving motive, and this helped to explain differences across countries. In addition, if consumption did not pick up significantly, it was difficult to envisage a strengthening expansion of private investment. Indeed, given that it was subject to “animal spirits” and linked to business confidence, private investment was volatile by definition and very sensitive to growth expectations and financial conditions. In this context, there was a risk that geopolitical developments in the coming months would not provide a strong environment for a significant increase in business investment. It was also suggested that the euro area’s competitiveness problems could be detrimental to consumption and business investment in that they would lead firms and households to hold back spending and save more, or even to invest abroad. Relatedly, the lack of structural reforms in the euro area could impede growth. More generally, it was pointed out that a significant part of the euro area’s growth momentum was due to fiscal stimulus, which was temporary by nature. In addition, given that the information and communication sector had been a key contributor to recent growth in the euro area in the context of the AI revolution, a potential correction of stretched corporate valuations in this sector also risked having a direct adverse impact on the economy. More broadly, an increase in risk aversion or effects on financial stability from any deterioration in global financial market sentiment could weigh on growth. Overall, from this perspective, there were clear threats to the growth outlook and it would be misguided to use the “Goldilocks” label.
It was also highlighted that growth performance still varied across the euro area. The recovery in two of its largest economies, which were strongly dependent on exports, remained fragile. Given downward wage and price rigidities, these differences were also seen as weighing on the aggregate economic performance of the euro area, as the economic gains in one country would not necessarily make up for the losses in another country.
There was a discussion about the extent to which the growth challenges facing the euro area were structural or could be influenced by monetary policy and macroeconomic conditions. On the one hand, it was argued that the latest economic developments had dispelled the narrative according to which structural issues in the euro area were so severe that they prevented growth, and any stimulus would lead to inflation. In particular, despite its many structural weaknesses, the euro area economy was still able to grow at a reasonable rate if the right macroeconomic conditions were in place. In addition, the extra boost to growth from private investment, together with higher structural total factor productivity growth from new technologies, would support the supply side of the economy, increasing the growth potential of the economy and thereby exerting downward pressure on inflation. On the other hand, it was argued that the low potential growth rate in the euro area was a structural problem that could not be solved by monetary policy. For example, demand policies could not address the euro area’s competitiveness challenges. Structural policy measures could help to generate more optimistic sentiment in Europe that might support investment and consumption, but these were outside the realm of monetary policy. In this context, reference was made to the European AI sector, highlighting the importance of economic clusters and ecosystems for the diffusion and financing of new projects and companies.
Questions were also raised about how to understand the economic impact of higher defence spending. Would it crowd out private investment and activity, or was it going to catalyse higher private investment and growth? Would the economic impact depend on the approach used to develop defence capabilities? These were complex economic issues, as the rise in defence spending was driven by a structural shift in Europe’s security. On the one hand, as defence spending was predominantly about managing external security risks, it was argued that the fiscal multiplier on output was likely to be low. Higher defence spending was essentially trying to control potential damage. Therefore, since much of it was intended to avoid a worse outcome, the point was made that it was unlikely to durably increase the potential of the economy. In addition, since people were more reluctant to invest and consume in the face of insecurity, this might weigh on output. On the other hand, it was also argued that the fiscal multipliers from defence spending might be higher than those assumed in the staff projections, depending on the share of spending that went on imports and research and development.
In the context of rising geopolitical tensions and higher defence spending, members shared the perception that there was increasing pressure on public finances in the euro area. The staff projections suggested that no reduction in public deficits was to be expected. With budget deficits remaining elevated, fiscal policy was constrained and might eventually prove unable to durably stimulate aggregate demand. Against this backdrop, the lack of economic dynamism, despite the economy’s resilience, presented a further challenge for future fiscal policy. With persistently weak fiscal fundamentals, it was also argued that there was a growing need for fiscal consolidation in some euro area countries. In addition, there was a need to underscore the importance of a robust and credible medium-term fiscal framework.
Against a background of rising economic challenges and with monetary policy having taken all necessary measures to safeguard price stability, the need for structural reforms in the euro area was greater than ever. The gradual fall in potential output growth to about 1%, compared with about 2% in the early 2000s, reflected the lack of dynamism in the euro area economy and suggested that it could do much better in terms of growth. Europe should make a conscious, strategic choice to assert a globally meaningful, independent role.
However, there had been little progress on structural reforms so far, despite the reports of Mario Draghi and Enrico Letta and the European Commission's Competitiveness Compass. It was suggested that there had not been much progress in completing the Single Market since 1992, and the barriers to competition and entry in the services sector remained high, also between euro area countries. In this context, the Governing Council could play a supporting role by identifying a short list of granular initiatives that could make a concrete difference, such as steps towards the key reform projects of strengthening the Single Market and completing the capital markets union.
The view was also expressed that better economic performance would require deep changes in economic structure and an appetite for risk, and national governments might not have much public support to deliver significant structural reforms. Therefore, there was a need to focus more on European structural reforms, such as strengthening the Single Market, although the view was also expressed that monetary policy should support growth to the extent possible, as it would be easier to implement structural reforms when demand conditions were strong and the labour market was buoyant.
In this context, members stressed the urgent need to strengthen the euro area and its economy in the present geopolitical context. They welcomed the European Commission’s call for governments to prioritise sustainable public finances, strategic investment and growth-enhancing structural reforms. Unlocking the full potential of the Single Market was crucial. It was also vital to foster further capital market integration by completing the savings and investments union and the banking union to an ambitious timetable, and to rapidly adopt the Regulation on the establishment of the digital euro.
Against this background, members assessed that, while trade tensions had eased, the still volatile international environment could disrupt supply chains, dampen exports and weigh on consumption and investment. A deterioration in global financial market sentiment could lead to tighter financing conditions, greater risk aversion and weaker growth. Geopolitical tensions, in particular Russia’s unjustified war against Ukraine, remained a major source of uncertainty. By contrast, planned defence and infrastructure spending, together with productivity-enhancing reforms, might drive up growth by more than expected. An improvement in confidence could stimulate private spending.
With regard to price developments, members concurred with the assessment presented by Mr Lane in his introduction. Annual inflation had been in a narrow range since the spring and had remained at 2.1% in November. Energy prices had been 0.5% lower than a year earlier, after a larger decline in October. Food price inflation had been 2.4%, after 2.5% in October and 3.0% in September. Inflation excluding energy and food had been steady at 2.4%, as goods and services inflation had moved in opposite directions. Goods inflation had declined to 0.5% in November, from 0.6% in October and 0.8% in September. Services inflation had risen to 3.4% in October and 3.5% in November, from 3.2% in September.
Members welcomed the fact that inflation had continued to hover around 2% in recent months. However, price pressures had been more persistent than anticipated in the June and September staff projections. While large declines in oil and gas prices had made a significant negative contribution to inflation recently, energy inflation was stronger than would have been expected given these commodity price developments. This was due to an increase in refining margins in the last few months, partly on account of uncertainty related to energy sanctions. The pass-through from commodity prices to retail prices had therefore been weaker than expected. This was one important reason behind the higher than expected inflation in the second half of 2025.
The biggest surprise since the October meeting had been the considerably slower than expected deceleration in the growth of compensation per employee, which had risen at an annual rate of 4% in the third quarter – the third upward surprise in a row. This had been particularly notable in the euro area’s largest economy. The surprise was due to payments over and above negotiated wages and was therefore not captured by the ECB’s wage tracker, which only covered negotiated wages. It was argued that strong wage growth was likely to be one reason why services inflation had been stickier than expected. Compared with the March projections, services inflation had come down by less than expected, and its momentum was currently higher than a year before. Services inflation also remained well above historical averages. Given that services inflation had stood at 4% in November 2023 and then at 3.9% one year later, and had only dropped to 3.5% two years later, it was suggested that the “last mile” of disinflation, which had started two years ago, was still not fully concluded.
However, while the complete breakdown of the November HICP data was not yet available, it was pointed out that the higher than expected services inflation did not seem to originate from wage-intensive services. The pick-up in recent months seemed to be largely due to an increase in travel-related services, partly driven by the euro area’s largest economy. While this could reflect a long-term preference shift, it could also be a temporary factor that would reverse quickly, as had been the case with other recent spikes in services inflation that had subsequently subsided. Moreover, when two sectors had different productivity growth rates but wages growing at similar rates, it was normal for inflation in the sector with lower productivity growth, which in this case was services, to be higher. This was the Balassa-Samuelson effect, which had also been a feature of the pre-pandemic period. Services inflation had then been, on average, above 2%, while goods inflation had usually been below 2%. In addition, it was suggested that the stickiness in services inflation had been almost independent of demand and so could be related to structural factors such as a lack of competition.
According to the December staff projections, inflation should decline in the near term, mostly because past energy price rises would drop out of the annual rates. Staff expected it to stay below 2% on average in 2026 and 2027, with energy inflation being negative over most of that period and inflation excluding energy gradually declining. It was highlighted that negative energy price inflation was projected to significantly dampen headline inflation well into 2027 and that significant downward base effects from energy price spikes at the beginning of 2025 would distort the headline inflation figures in 2026. Inflation was then expected to return to target in 2028, amid a strong rise in energy inflation. This in part reflected the upward effect on inflation of ETS2, which was now expected to start in 2028, a year later than had been assumed in the September staff projections.
High services inflation also explained the upward revision for inflation in 2026, and the comparatively small downward revision for 2027 in spite of the postponement of ETS2. Therefore, it was argued that wage growth posed an upside risk to the inflation projections. In particular, wage growth might no longer reflect mere catch-up effects but also rapid demographic change, with a large number of people retiring and immigration slowing, against the backdrop of an economic recovery with unemployment below the natural rate. Labour scarcity in sectors with high demand, such as services, and in sectors that were benefiting from fiscal expansion, such as defence and construction, could put further upward pressure on wage growth, and the labour market could be stronger than previously thought. At the same time, the view was expressed that the staff projections overstated the impact of wage pressures on inflation. While the increase in wage drift in the largest euro area economy warranted close monitoring, the situation was different in most other countries, and it was also observed that there would only be a limited impetus from rising minimum wages in the future, in contrast to the past few years. In addition, the upward surprise in wage growth had originated in two large euro area economies. As these economies had not performed well in the past two years and were projected to remain relatively weak in the near term, it was likely that the increase in wage growth was temporary. If such a large part of the euro area was struggling, it was very difficult to see the euro area economy booming, with wages and inflation accelerating. In this context, it was noted that the heterogenous economic performance also seemed to be reflected in services price inflation across countries, which was now significantly more dispersed than before the pandemic.
Members also discussed the potential implications of competitive pressures from China for euro area inflation. The prices of exports from China to the euro area had been decreasing more quickly than in the past. While rising Chinese exports to the euro area had been a structural factor for a long time, the rate of increase over the second and third quarters of 2025 had been notably higher than in the recent past. This could be at least partly related to the increase in US tariffs on Chinese products, which had reinforced China’s need to bolster its wider export performance, including via some form of export price adjustments in other markets. This phenomenon affected not only the euro area but also other foreign markets where European exporters competed with Chinese firms. However, it was also suggested that there was so far only limited evidence of an increasingly negative impact on consumer goods prices in the euro area beyond the structural deflation in prices for imports from China. Moreover, it was suggested that the impact of increased trade redirection on inflation would be limited even in extreme circumstances. At the same time, it was pointed out that it could be more appropriate to focus on the gap between goods and services inflation, which might have widened owing to falling Chinese import prices. While goods inflation was rising in the United States, it had been stable or had fallen slightly in the euro area. Given that firms were reorganising their supply chains to become more resilient, structural upward pressure on goods inflation might have been offset by the downward impact of decreasing Chinese import prices.
Finally, it was suggested that house prices might pose an upside risk to the inflation projections since they had started to rise rapidly again, supported by strong housing demand. However, it was pointed out that housing supply was unlikely to increase unless people were confident that house prices would rise further. House price increases were therefore part of the adjustment mechanism, so it remained to be seen how this would develop in the future. The HICP inflation rate including owner-occupied housing had been slightly higher than the standard HICP inflation rate in the recent period. It was argued, however, that this effect was not large enough to influence the policy discussion, especially given the long lags in the availability of these data.
Turning to inflation expectations, most measures of longer-term inflation expectations remained at around 2%, supporting the stabilisation of inflation around target. Inflation expectations of market participants, as reflected in both surveys and inflation compensation, were broadly aligned with the staff projections, although it was highlighted that expectations based on inflation fixings suggested that inflation would be slightly below target in both 2026 and 2027. Consumer inflation expectations had been broadly stable but stood at a higher level than a year ago, especially when looking at mean expectations.
Against this background, members assessed that the outlook for inflation continued to be more uncertain than usual on account of the still volatile international environment. Inflation could turn out to be lower if the rise in US tariffs reduced demand for euro area exports and if countries with overcapacity increased their exports to the euro area. Moreover, a stronger euro could bring inflation down further than expected. An increase in volatility and risk aversion in financial markets could weigh on demand and thereby also lower inflation. By contrast, inflation could turn out to be higher if more fragmented global supply chains pushed up import prices, curtailed the supply of critical raw materials and added to capacity constraints in the euro area economy. A slower reduction in wage pressures could delay the decline in services inflation. A boost in defence and infrastructure spending could also raise inflation over the medium term. Extreme weather events, and the unfolding climate and nature crises more broadly, could drive up food prices by more than expected.
Turning to the monetary and financial analysis, members largely concurred with the assessment provided by Ms Schnabel and Mr Lane in their introductions. Market rates had increased since the Governing Council’s previous monetary policy meeting. Market participants attached zero probability to a rate cut at the December monetary policy meeting and financial markets had now also priced out any further interest rate cut. The expected date of a first rate hike had been brought forward by about a year since the late November cut-off date for the December staff projections. It was suggested that this could be attributed to the resilience of the economy, with macroeconomic data surprising mostly to the upside. Longer-term interest rates had gone back up to levels prevailing prior to the April announcement of higher US tariffs, predominantly driven by an increase in real interest rates, including real forward rates. It was suggested that these moves reflected expectations of higher growth and therefore expectations of a higher natural rate of interest. This interpretation was supported by the fact that the premia-adjusted one-year forward real interest rate nine years ahead – a commonly used market-based measure of the natural rate of interest – had increased by around 20 basis points during 2025, with only half of that increase occurring at around the time of the announcement in March of the fiscal package in the euro area’s largest economy. From this perspective, financial conditions had not been tightening overall but were instead responding to the incoming data flow and remained supportive despite the increase in market rates. At the same time, it was suggested that ECB communication may also have played a role in the recent rise in market rates and that this had precipitated a tightening of financial conditions.
The average interest rate on new mortgages had again held steady, at 3.3%, in October. Mortgage lending had strengthened, growing by 2.8%, after 2.6% in September. However, given the relatively long interest rate fixation period for mortgages, it was suggested that the increase in longer-term interest rates over the course of the year had the potential to weigh on mortgage demand.
Bank lending rates for firms had been broadly stable since the summer, after falling in response to policy rate cuts over the previous year. In October they had stood at 3.5%, unchanged from September. The cost of issuing market-based debt had been 3.4%, which was close to the September level. Bank lending to firms had grown by 2.9% on a yearly basis in October, unchanged from September. Corporate bond issuance had risen by 3.2%, broadly unchanged as well.
Bank lending to firms had recently been more focused on larger firms and less risky firms. While it was contended that there was currently no restriction on credit, concern was raised over access to credit for riskier corporations and for small and medium-sized enterprises (SMEs), which could also be limiting the ability of some companies to introduce AI into their regular business processes. Such financing constraints could be partly linked to substantial collateral requirements for SMEs. Insufficient collateral could thus constrain the borrowing capacity of SMEs, a topic which merited further reflection. It was also questioned whether the small size of private finance markets in the euro area compared with the United States might be creating financing challenges in some sectors for both new start-ups and firms wishing to scale up. At the same time, it was argued that business-to-business AI start-ups and innovators were able to attract sufficient funding.
Euro area banks had also been increasing their lending to the non-bank financial intermediation (NBFI) sector. This seemed to be crowding out their lending to firms. In terms of equity investments, the NBFI sector had recently been increasing its allocation to US firms relative to euro area firms. However, it was unclear to what extent the non-bank financial institutions behind this shift were the same as those that had been receiving more funding from banks. Still, these developments underscored the need to complete the savings and investments union to open up more investment opportunities in the euro area.
The Governing Council held its biannual structured exchange on the links between monetary policy and financial stability. As had been discussed in the November Financial Stability Review, financial stability vulnerabilities were elevated. Geopolitical uncertainty, the impact of trade tariffs and the possibility of a sudden repricing in global financial markets posed risks to financial stability in the euro area in an environment in which global stock markets were near all-time highs and corporate bond spreads were achieving historic lows. These financial stability risks were mainly related to possible spillovers from the United States. US financial markets showed signs of exuberance, with US equity valuations, especially for AI-related assets, remaining particularly elevated and prone to a correction. Financial stability risks in the United States could build further owing to more accommodative US monetary policy. In addition, there were rising concerns over the US fiscal position owing to persistently high deficits, growing debt servicing costs and high borrowing needs, all of which were compounded by a large current account deficit. Any significant market correction in the United States would probably result in a strong and quick transmission to the euro area, amplified by the increasing exposure of the euro area NBFI sector to US assets.
The latest Financial Stability Review had also highlighted risks from interconnections between the NBFI sector and banks. As a result, the significant exposure of the NBFI sector to sovereign bonds could pose a future risk to financial stability given the large budget deficits and challenging fiscal outlook in some euro area economies, and this warranted monitoring. Another concern was related to links between private finance markets and the banking system. Private equity and private credit markets had been growing very rapidly. These instruments could involve multiple layers of leverage, with overall levels sometimes being very high, extending beyond the layer at the fund level to encompass the leverage in corporations receiving funding and the leverage in institutional investors that invested in these types of fund. Private funds were now also encountering difficulties in disposing of assets held in their portfolios, which indicated that valuations might not be correct. The sector was increasingly resorting to continuation funds as a way of demonstrating its ability to dispose of assets, an approach which was seen as problematic.
Financial stability risk was also moving into new instruments and new channels and was becoming increasingly complex. One example was the increase in the volume of credit default swaps seeking protection against AI credit risk given hyperscalers’ increased reliance on debt. Another manifestation of this increasing complexity was the connection between the crypto-asset industry and the stock market. For example, bitcoin's correlation with stock prices had been strengthening recently and it appeared that AI stock volatility affected crypto-asset prices. Broader market concerns were also evident in the flight to gold worldwide.
Overall, if there were a deterioration in global financial market sentiment and an increase in volatility, it could lead to tighter financing conditions and greater risk aversion in the euro area, which could weigh on consumption and investment, and thereby also lower growth and inflation. At the same time, euro area banks were resilient, supported by strong capital and liquidity ratios, solid asset quality and robust profitability. Macroprudential policy remained the first line of defence against the build-up of financial vulnerabilities, enhancing resilience and preserving macroprudential space.
Monetary policy stance and policy considerations
Turning to the monetary policy stance, members assessed the data that had become available since the last monetary policy meeting in accordance with the three main elements that the Governing Council had communicated in 2023, and updated in July 2025, as shaping its reaction function, namely: (i) the implications of the incoming economic and financial data for the inflation outlook and the risks surrounding it; (ii) the dynamics of underlying inflation; and (iii) the strength of monetary policy transmission.
Starting with the inflation outlook, members welcomed the fact that headline inflation was currently close to the 2% medium-term target and had been in a narrow range since the spring. They judged that the incoming information and the December staff projections were broadly in line with their previous assessment of the inflation outlook. Inflation remained in a good place and was expected to stay close to the 2% target for the next few quarters, while also stabilising around target over the medium term. The December staff projections saw headline inflation declining to 1.9% in 2026 and 1.8% in 2027, before picking up to 2.0% in 2028. The projected undershoot in 2026 was smaller than had been anticipated in the September staff projections, mainly because staff now expected services inflation to decline more slowly. In view of positive macroeconomic surprises, inflation had also been revised up across later horizons when excluding the impact of ETS2, which had been shifted out in time. However, it was pointed out that the new staff projections still entailed a persistent undershooting of inflation lasting for the next two years, with inflation returning to target more slowly than previously anticipated. In addition, the return to target in 2028 was supported by a 0.2 percentage point upward effect on inflation from the introduction of ETS2. Inflation expectations remained well anchored, with most measures of longer-term inflation expectations continuing to stand at around 2%, which also supported the stabilisation of inflation around target.
Against this background, most members viewed the risks surrounding the inflation outlook as two-sided, with some members judging that the distribution of risks had shifted up since the previous meeting, while recognising that downside risks remained important. The outlook for inflation continued to be more uncertain than usual on account of the still volatile international environment and elevated geopolitical risks. There were still multiple, significant risks to inflation on both sides. It was important to be attentive to these risks and avoid focusing excessively on the baseline outlook. This was especially true because many of these risks were novel and not in the historical data set, while also being very large. As a result, modelling these risks was subject to high uncertainty. In particular, there were no historical examples pertaining to recent trade policy developments, the evolution of AI or structural change from China’s evolving engagement with the world economy, while there had been no significant increase in defence spending in the euro area’s history.
Some members viewed inflation risks as tilted to the downside. From this perspective, it was highlighted that tariffs on euro area exports to the United States had increased considerably since the start of the year despite the US-EU trade agreement, with some lagged effects still likely to materialise. Inflation could turn out to be lower if the rise in US tariffs reduced demand for euro area exports and if countries with overcapacity increased their exports to the euro area. In this context, it was argued that competitive pressures from China had intensified, with prices for exports to the euro area decreasing more quickly than in the past and export volumes growing rapidly. While China had been structurally increasing its export market shares at the global level for a long time, it was suggested that the current speed was abnormal. A stronger euro, possibly prompted by a more accommodative US monetary policy than expected and associated dollar depreciation, could also add to the effects from tariffs and bring inflation down further than expected. It was also argued that the possible positive effects from AI, which was now an important part of investment in the euro area, could boost potential output and imply that the output gap might not close as quickly as anticipated, thereby posing a downside risk to the inflation outlook. In addition, without the expected upward effect of ETS2 on projected inflation in 2028, a sustainable return of inflation to target after the expected undershoot in 2026 and 2027 would be further delayed. The effects of fiscal expansion on growth and inflation could also be more limited than expected if they led households to maintain a high saving rate in anticipation of potential future tax increases or cuts in welfare spending. Following the recent upward surprise in wage growth, there could also be downside risks from wage growth ahead. Finally, widespread concern was expressed regarding financial stability risks, and it was suggested that the likelihood of their materialisation may be increasing. An increase in volatility and risk aversion in financial markets, possibly prompted by a sharp correction in some asset prices, could weigh on demand and thereby also lower inflation.
A few members viewed inflation risks as tilted to the upside. From this perspective, some upside risks, especially related to wage growth and services inflation, had intensified. Services inflation had been sticky and there was a risk that this could persist. Wage growth had continued to exceed expectations, and a slower reduction in wage pressures could delay the decline in services inflation. This could stem both from cyclical factors, such as labour scarcity in sectors with high demand in a situation in which unemployment was already below the natural rate, and from demographic factors reducing labour supply. A boost in defence and infrastructure spending could also raise inflation more generally over the medium term. In addition, it was suggested that the near-term fiscal stimulus would necessitate subsequent fiscal consolidation efforts that could include increases in indirect taxes, thereby posing a further potential upside risk to inflation in the longer term. Regarding trade tensions, inflation could turn out to be higher if more fragmented global supply chains pushed up import prices, curtailed the supply of critical raw materials and added to capacity constraints in the euro area economy. It was also suggested that diversion of Chinese trade to the euro area at abnormally low prices had not occurred to the extent feared, that the effects so far had been small, and that this channel was unlikely to have a significant effect on inflation in the future even in extreme circumstances. In this regard, it was argued that low import prices and deflation coming from China were a structural phenomenon that had been present for a protracted period and that there had been little sign of additional effects from trade diversion after the increase in tariffs. More broadly, other downside inflation risks relating to external demand and the euro area’s competitiveness had not materialised so far, with the trade environment improving recently and the euro exchange rate remaining broadly constant since July. It was also suggested that there could be upside risks to inflation from energy prices, due both to a possible escalation of tensions in Venezuela and to the possibility of the relatively low current levels of energy prices having increased the probability of upward surprises in the future, especially given the expected recovery in the global economy. Finally, extreme weather events, and the unfolding climate and nature crises more broadly, could drive up food prices by more than expected.
Turning to underlying inflation, the measures had changed little over recent months and members concurred that they remained consistent with the 2% medium-term target. However, it was noted that some underlying inflation indicators, including core inflation, had recently surprised to the upside. According to the December staff projections, inflation excluding energy and food was now expected to remain above 2% in 2026, before stabilising at around 2% thereafter. Inflation excluding energy was projected to follow a similar profile, stabilising at around 2% in the outer years of the projection horizon. The increase in projected core inflation in 2026 was driven by materially higher services inflation, which was closely related to domestic inflation. It was therefore argued that services inflation was the aspect of inflation that was most closely connected to monetary policy, and that domestic inflation remained an important metric to judge progress in disinflation. It was suggested that strong wage growth was one reason why services inflation was much stickier than had been previously expected. While growth in unit profits had been unchanged in the third quarter, unit labour costs had grown at a slightly higher rate than in the second quarter. Compensation per employee had risen by more than expected in the September staff projections. Still, forward-looking indicators, such as the ECB’s wage tracker and surveys on wage expectations, suggested that wage growth would ease in the coming quarters, before stabilising somewhat below 3% towards the end of 2026. It was also suggested that the stickiness in services inflation could be related to structural factors, in which case it would be more appropriate to call for structural reforms rather than for monetary policy to try to address it by compressing aggregate demand.
Finally, the transmission of monetary policy continued to be smooth and effective. More favourable financing conditions following past interest rate cuts had supported investment and thereby contributed to economic growth. However, any crowding-out of corporate lending linked to increasing bank lending to the NBFI sector could undermine investment and growth in the future. There was also a risk that financial conditions could tighten owing to a sharp correction in financial markets. If this occurred, it could adversely affect consumption and especially investment, in view of the latter being highly sensitive to financial conditions, thereby weighing on inflation and the economic outlook.
Monetary policy decisions and communication
Against this background, all members supported the proposal made by Mr Lane to keep the three key ECB interest rates unchanged. The Governing Council’s updated assessment had reconfirmed that inflation should stabilise at the 2% target in the medium term, with the incoming data also confirming that the economy had remained resilient. The December staff projections had strengthened confidence in the medium-term outlook. Despite the challenging global environment, euro area economic activity was proving more resilient than previously anticipated, with solid domestic demand and a strong fiscal impulse starting to take effect. Economic growth was expected to be stronger than in the September projections, driven especially by domestic demand. Unemployment was at historically low levels and projected to fall further. The inflation outlook continued to be in a good place. Inflation was projected to remain around target over the projection horizon, with its path closer to target than in the September staff projections. Taken together, the incoming data since the October meeting and the December staff projections presented a strong case for keeping monetary policy unchanged. While the environment remained more uncertain than usual, the current level of policy rates also provided sufficient flexibility to act in response to shocks, in view of the two-sided inflation risks and taking into account a broad range of possible scenarios. All of this meant that the Governing Council could be patient, although this should not be mistaken for being hesitant to act or being asymmetric. Overall, the ECB was currently in a good place from a monetary policy point of view, but this did not mean the stance was to be seen as static.
With regard to communication, members reiterated that the Governing Council was determined to ensure that inflation would stabilise at its 2% target in the medium term. Future interest rate decisions would continue to be based on its assessment of the inflation outlook and the risks surrounding it, in light of the incoming economic and financial data, as well as the dynamics of underlying inflation and the strength of monetary policy transmission. The Governing Council would also continue to follow a data-dependent and meeting-by-meeting approach to determining the appropriate monetary policy stance without pre-committing to a particular rate path.
The outlook for inflation remained more uncertain than usual, with many novel risks and the possibility of large inflation and growth shocks in both directions. Therefore, it was important for the Governing Council to maintain full optionality in either direction for future meetings and to be agile in order to react quickly, if necessary, to new information that changed the outlook, or to large shocks. Communication should therefore remain prudent and non-committal about the future interest rate path. In particular, it was important not to give the impression that the next move would be in one direction or the other, or to suggest any tightening or easing bias.
Looking ahead, members reflected on possible strategies for future monetary policy. While the baseline outlook was benign, with steady, resilient growth and inflation projected to remain around target, it was important to avoid an excessive emphasis on the baseline given the significant risks and uncertainties surrounding the outlook. Many different risks, each with the capacity to materially affect price stability, had been discussed. Therefore, in line with the updated monetary policy strategy adopted earlier in the year, the environment called for a careful, ongoing assessment of these risks. Any data surprises warranted close attention and systematic analysis. In this regard, it was important to monitor whether services inflation and wage growth decelerated as expected, and whether core inflation continued to decline steadily as projected, to provide confidence that the disinflation process in domestic inflation remained intact. Given that the continuing economic recovery was predicated primarily on domestic demand, it was also important to monitor whether investment remained robust and consumption picked up as expected. Moreover, there was a continued need to monitor the strength of monetary policy transmission, including via developments in financing conditions and bank lending, to gauge the degree of accommodation or restrictiveness of the current monetary policy stance. At the same time, while monitoring risks related to the development of certain trends was relatively manageable given the ongoing flow of incoming data, some of the risks that had been discussed were very large, highly unpredictable and had limited or no historical precedent, meaning that it was difficult to have much foresight on how they might develop or what their effects might be.
Against this backdrop, the reality confronting the Governing Council at future meetings could materially diverge from the current outlook that was embodied in the December staff projections. In this context, calibrating monetary policy should not be seen as following a preset path but should be understood as being about continuously assessing risks, trade-offs, the resilience of the economy and the implications of all of this for the inflation outlook.
Still, the view was expressed that the softening of downside risks since September meant that maintaining interest rates at their current level represented a fairly solid path under the baseline outlook, with an extended period of stable rates likely to be appropriate in the absence of large shocks if the December staff projections for both headline and core inflation materialised. From this perspective, it was also argued that if core inflation did not fall as projected, it could be a sign that monetary policy was more accommodative than currently thought. This was a possibility because a rising natural rate of interest could make monetary policy more accommodative over time. In this context, it was noted that the rise in longer-term interest rates after the post-April trough had gone hand in hand with an improving macroeconomic outlook, possibly reflecting higher growth expectations and a higher natural rate of interest. It was also suggested that a rising natural rate of interest could be connected with the ongoing gradual improvement in productivity growth, which could be partly structural in nature and linked to the broader use of new information and communication technologies, including AI. However, while the investment surge associated with AI could put upward pressure on the interest rate, it was also noted that a significant increase in productivity from the application of AI could be disinflationary by reducing marginal costs, meaning that the overall implications for the policy path were ambiguous because these two forces moved in opposite directions. Moreover, the effects could play out differently in Europe and the United States if AI investment was concentrated in the United States. This was because strong European interest in high expected returns from US technology stocks could – if those savings were channelled abroad – prompt an increase in the saving rate in the euro area without a corresponding surge in domestic investment. In any case, the possible implications of AI and the digital transformation for monetary policy warranted close monitoring and further assessment.
At the same time, the view was expressed that the economic recovery remained fragile, especially since the composition of growth had recently shifted towards private investment, which was very sensitive to growth expectations and financial conditions. Together with the subdued recovery in consumption, this suggested that domestic demand was unlikely to exert meaningful pressure on inflation. The baseline inflation outlook also still entailed a persistent undershooting of the target lasting two years, and three years when excluding the one-off effects from the introduction of ETS2 in 2028. This was a cause for concern because, if realised, such a long period of persistent undershooting risked leading to a downward unanchoring of inflation expectations. It was also observed that there had been an increase in market interest rates since the cut-off date for the staff projections in late November, even though it was noted that the effect from this would be small when considered in the broader context of the overall outlook. Still, given the modest outlook for growth and inflation, the materialisation of downside risks could easily lead to close-to-stagnant growth rates and a deeper undershooting of the inflation target. Given these considerations, there could be a case for erring on the dovish side, as this would support higher investment and higher potential growth. It was also argued that it was important to clearly reiterate that the Governing Council’s target was fully symmetric and hedge against any market misperception that the Governing Council would be hesitant to cut rates even if inflation were to undershoot the target for much of the projection horizon. From this perspective, a concern was raised about a potential decoupling between market expectations for inflation and for interest rates. It was suggested that the sensitivity of market interest rate expectations to market inflation expectations had been decreasing over the past year, thereby weakening an important stabilising factor coming from financial markets. However, it was also argued that current market pricing for interest rates was consistent with market-based inflation expectations, especially after adjusting fixings to add in a tobacco component. Given the Governing Council’s medium-term orientation, which allowed moderate, short-term deviations of inflation from the target, and given that the expected deviation was likely to be temporary since much of it was attributable to energy prices, the current market pricing of interest rates was seen as consistent with the latest fixings and in line with the Governing Council’s reaction function. Still, this was an issue that warranted further reflection.
Taking into account the foregoing discussion among the members, upon a proposal by the President, the Governing Council took the monetary policy decisions as set out in the monetary policy press release. The members of the Governing Council subsequently finalised the monetary policy statement, which the President and the Vice-President would, as usual, deliver at the press conference following the Governing Council meeting.
Monetary policy statement
Monetary policy statement for the press conference of 18 December 2025
Press release
Meeting of the ECB’s Governing Council, 17-18 December 2025
Members
- Ms Lagarde, President
- Mr de Guindos, Vice-President
- Mr Cipollone
- Mr Elderson
- Mr Escrivá
- Mr Kazāks
- Mr Kažimír
- Mr Kocher*
- Mr Lane
- Mr Makhlouf
- Mr Müller
- Mr Nagel
- Mr Panetta
- Mr Patsalides
- Mr Pereira*
- Mr Radev**
- Mr Rehn
- Mr Reinesch
- Ms Schnabel
- Mr Scicluna*
- Mr Šimkus
- Mr Sleijpen
- Mr Stournaras
- Mr Villeroy de Galhau*
- Mr Vujčić
- Mr Wunsch
* Members not holding a voting right in December 2025 under Article 10.2 of the ESCB Statute.
** As observer.
Other attendees
- Mr Dombrovskis, Commissioner***
- Ms Senkovic, Secretary, Director General Secretariat
- Mr Rostagno, Secretary for monetary policy, Director General Monetary Policy
- Mr Kapadia, Head of Division, Directorate General Monetary Policy
*** In accordance with Article 284 of the Treaty on the Functioning of the European Union.
Accompanying persons
- Ms Bénassy-Quéré
- Ms Brezigar, Alternate to Mr Dolenc, Deputy Governor of Banka Slovenije
- Mr De Backer
- Mr Demarco
- Mr Gilbert
- Mr Horváth
- Mr Kaasik
- Mr Leppin
- Mr López
- Mr Lünnemann
- Mr Madouros
- Mr Nicoletti Altimari
- Ms Pelekanou
- Ms Raposo
- Mr Rutkaste
- Mr Šiaudinis
- Mr Šošić
- Ms Stiftinger
- Mr Välimäki
Other ECB staff
- Mr Proissl, Director General Communications
- Ms Vansteenkiste, Counsellor to the President
- Ms Rahmouni-Rousseau, Director General Market Operations
- Mr Arce, Director General Economics
- Mr Sousa, Deputy Director General Economics
Release of the next monetary policy account foreseen on 5 March 2026.
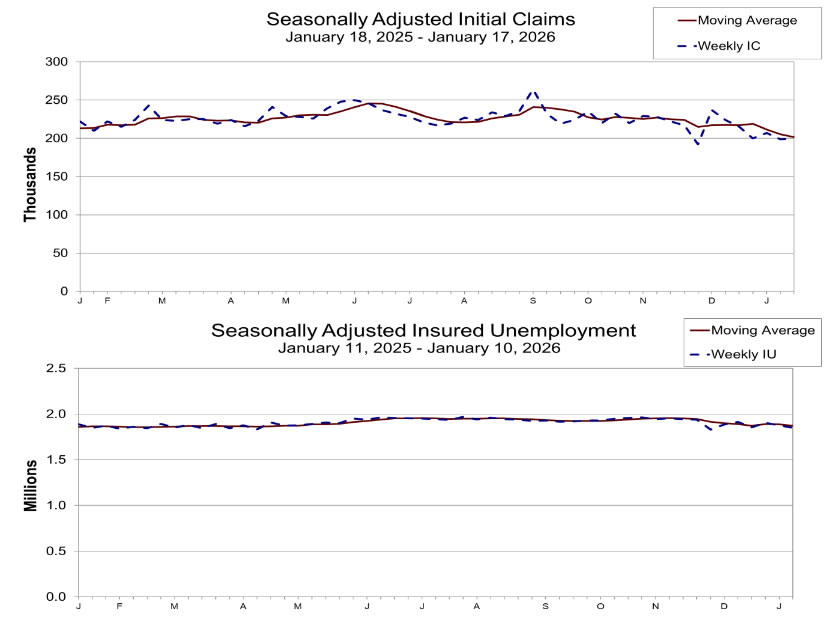
US initial jobless claims tick up to 200k vs exp 209k
US initial jobless claims fell -1k to 200k in the week ending January 17, below expectation of 209k. Four-week moving average of initial claims fell -4k to 201.5k, lowest since January 13, 2024.
Continuing claims fell -26k to 1849k in the week ending January 10. Four-week moving average of continuing claims fell -16k to 1871k.
AUD/USD Extends Advance After Upbeat Labor Data
Steep bull-leg from the larger higher base at 0.6665 zone extends into fourth straight day and hit the highest level since late September 2024 on Thursday (0.6811).
The Aussie dollar was inflated by weaker US dollar on the recent rally into safety of precious metals, following escalation of conflict between the US and EU over Greenland, while upbeat Australia’s December labor report further lifted the currency.
Employment unexpectedly rose to more than double value of forecast and negative and downwardly revised November’s figure, with strong drop in unemployment (Dec 4.1% vs 4.4% f/c and Nov 4.3%) brightening the sentiment and boosting expectations that the RBA may opt for a rate hike in February policy meeting following strong improvement in the labor sector.
Markets focus on next week’s release of inflation data, which is expected to provide final touch to the RBA’s monetary policy decision.
Daily studies remain in full bullish configuration, although overbought conditions warn that bulls may start to lose traction, but strong positive signals have also developed on weekly chart (bullish continuation pattern / 10/200WMA golden-cross) and expected to contribute to bullish outlook.
Daily close above broken Fibo 76.4% (0.6699) is minimum requirement to keep bulls in play, while sustained break above cracked 0.6800 level would provide fresh impetus for acceleration towards 0.6900 (round figure) and 0.6942 (Sep 30 2024 peak).
Res: 0.6811; 0.6850; 0.6900; 0.6942.
Sup: 0.6766; 0.6738; 0.6699; 0.6665.
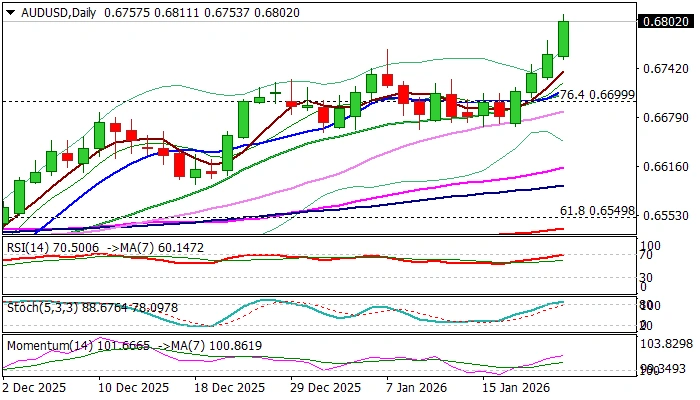
Why Silver Prices in the US and China Have Diverged So Sharply
- The price gap between silver in the US and in Shanghai has widened and is larger than normal.
- Western prices are driven mainly by futures and paper trading, while Chinese prices reflect physical supply and demand.
- Strong industrial and investment demand for physical silver in China supports a persistent price premium.
- Logistical and regulatory barriers limit arbitrage, allowing the divergence to last.
In recent weeks, the gap between silver prices in the United States and China has widened noticeably and is now larger than usual. According to the chart, silver is currently priced at around USD 94 per ounce in the US, while the equivalent price in Shanghai is roughly USD 104 per ounce after currency conversion. A spread of nearly USD 10 per ounce is not a minor discrepancy but a meaningful signal that the two markets are being driven by different forces.
This divergence is not primarily the result of exchange rates or transaction costs. Instead, it reflects fundamental differences in market structure, pricing mechanisms, and local supply and demand dynamics.
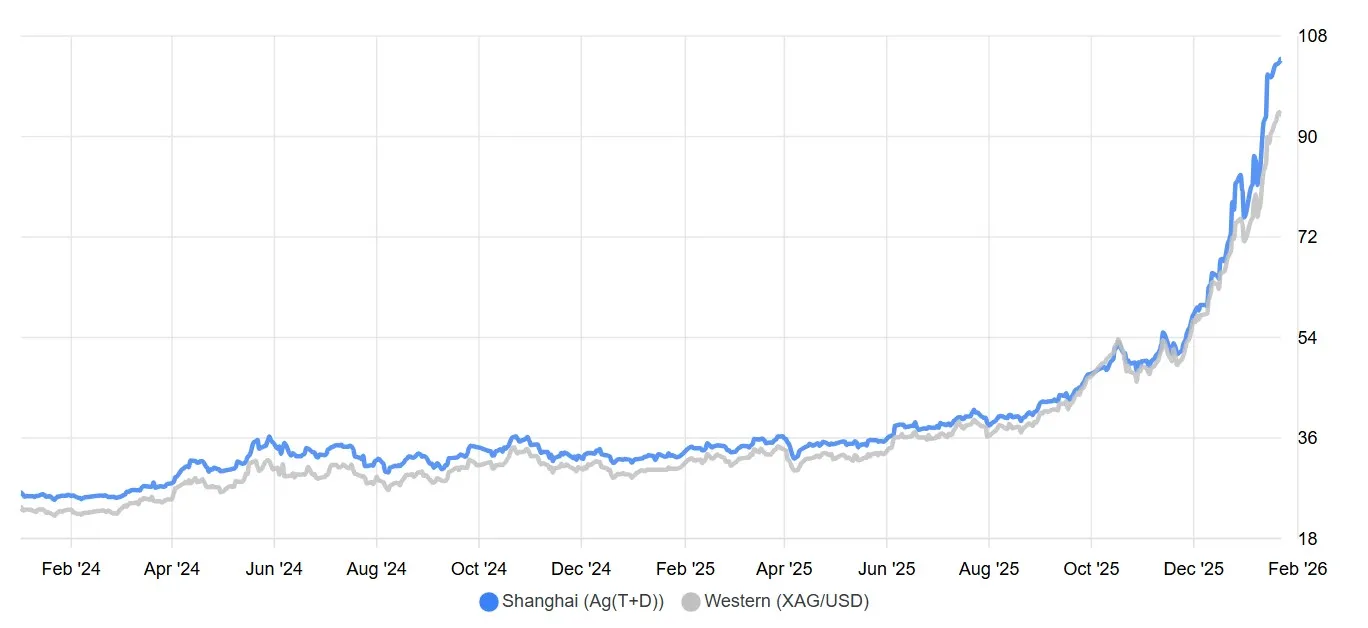
Chart compares daily silver prices from the Shanghai Gold Exchange with Western silver prices, converted to USD/oz using daily CNY/USD rates
Chart compares daily silver prices from the Shanghai Gold Exchange with Western silver prices, converted to USD/oz using daily CNY/USD rates
Paper pricing versus physical metal pricing
In the US and Europe, silver prices are largely determined on markets such as COMEX and in London, where futures contracts and financial instruments dominate trading activity. The vast majority of these contracts are settled financially rather than through physical delivery. As a result, prices tend to reflect liquidity conditions, speculative positioning, movements in the US dollar, and interest rate expectations more than the immediate availability of physical silver.
In China, pricing works differently. On the Shanghai Gold Exchange and the Shanghai Futures Exchange, physical delivery plays a far more important role. Prices in Shanghai are therefore much more closely tied to actual demand for metal that can be taken out of the exchange system. When demand for physical silver rises, this pressure is quickly reflected in higher local prices.
Strong physical demand in China
A key driver of the current premium in Shanghai is strong physical demand for silver in China. Silver is a strategically important industrial metal, used extensively in solar panels, electronics, and advanced manufacturing. In addition, Chinese investors tend to place greater emphasis on owning physical bullion rather than paper exposure.
When this demand intensifies, local supply can become tight. In such an environment, the market clears not through higher trading volumes in derivatives, but through higher prices for immediately available metal, pushing Shanghai prices well above Western futures-based benchmarks.
Supply, inventories, and logistics
Differences in local inventories and logistics also matter. If physical silver stocks in China are relatively low while demand remains strong, prices must rise to balance the market. In the US and Europe, where inventories are larger and financial instruments dominate, similar demand pressures may not show up as quickly in prices.
At the same time, moving physical silver between regions is costly and complex. Transportation, certification, regulatory requirements, and capital constraints all limit how easily silver can flow from lower-priced markets to higher priced ones. These frictions allow price gaps to persist.
Why arbitrage does not eliminate the gap
In theory, a USD 10 per ounce price difference should invite arbitrage. In practice, arbitrage in the silver market is far from frictionless. Access to deliverable metal, export and import rules, and the time and cost involved in moving bullion across borders significantly weaken the arbitrage mechanism.
As a result, the price link between COMEX and Shanghai is looser than many investors assume, allowing China to trade at a sustained premium.
What the current 94 vs 104 USD spread is telling us
The current situation - around USD 94 per ounce in the US versus about USD 104 per ounce in Shanghai - suggests that:
- physical silver is relatively scarcer and more highly valued in China than in Western markets,
- Western “paper” prices may not fully reflect physical market tightness,
- the physical market is sending an early signal of supply-and-demand stress.
Historically, such sustained premiums on physical markets have often preceded either higher global prices or periods of increased volatility as Western markets eventually react.
Silver ETFs see heavy outflows despite firm prices
Since the start of the year, silver-focused exchange-traded funds have recorded substantial withdrawals. Data from Bloomberg show that ETF holdings of silver fell by around 528 tonnes within the first two weeks of the year. A significant share of this reduction came from the largest silver-backed ETF in the United States.
The rapid appreciation in silver prices appears to have prompted many ETF investors to lock in gains, although part of the decline in holdings may also be linked to physical metal being removed from ETF vaults. Notably, these outflows have not translated into downward pressure on prices, indicating that demand from other parts of the market has absorbed the metal.
A comparable dynamic was seen in the palladium market several years ago, when ETF inventories fell sharply even as prices continued to climb. At that time, ETF disinvestment contributed to alleviating tight physical supply conditions. That said, it remains premature to assume a similar outcome for silver, and the current developments should be interpreted cautiously.
Conclusion
The growing gap between silver prices in the US and in Shanghai highlights the contrast between a financially driven paper market and a physically driven commodity market. The unusually large premium in China indicates that real, deliverable silver is currently more valuable there than futures-based pricing in the West suggests. While this does not guarantee an immediate global repricing, it is a signal that the physical side of the silver market is under pressure and one that global investors would be wise to watch closely.
Dollar Played Out TACO Trade
- Trump’s retreat helped the EURUSD bears.
- USDJPY intends to resume its uptrend.
The US dollar got the upper hand after Donald Trump’s speech in Davos. The US president announced that there was some framework for a deal on Greenland and that he was abandoning his intention to impose additional tariffs on a number of European countries. The markets immediately switched from ‘sell America’ to TACO-trade or Trump-Always-Chickens-Out mode. Stock indices rose, Treasury yields fell, while EURUSD bears went on the counterattack.
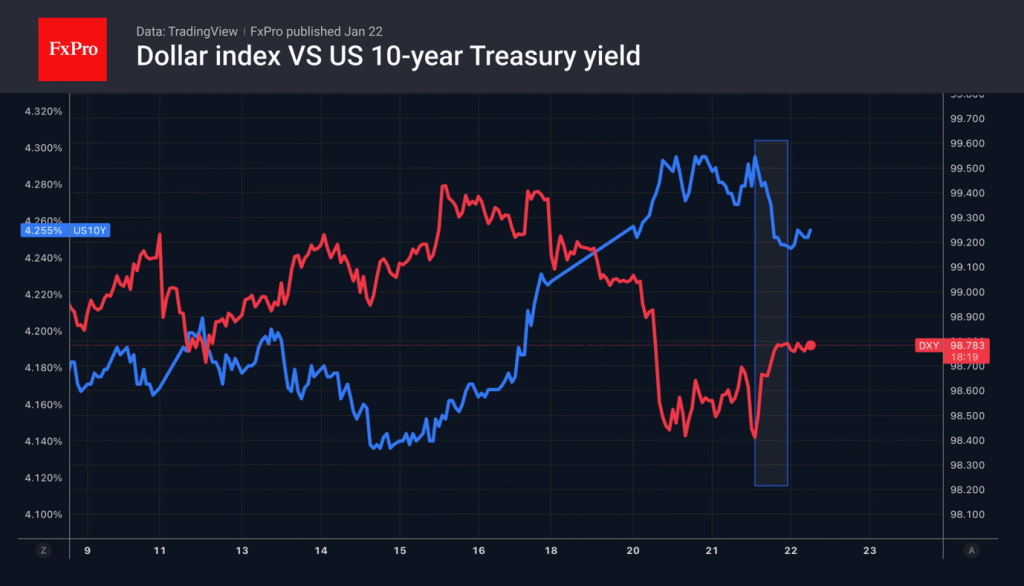
The Supreme Court did not support the White House’s intention to dismiss Lisa Cook from her position as FOMC governor. The judges recognised that this could undermine the independence of the Fed. They are considering various options. The most conservative would be to keep the official in office while the lower courts discuss her mortgage case. The most radical would be to write a broad ruling on the extent of the president’s authority to remove members of the central bank.
The USD index received support from the SWIFT report, which showed that the share of the greenback in international transactions rose from 46.8% to 50.5% in December, reaching its highest level since 2023. De-dollarisation is not an urgent matter against the backdrop of a division between the West and the East. The US currency keeps its dominance and is still in demand.
The strengthening of the US dollar has been a tailwind for USDJPY. The pair risks quickly resuming its upward trend and coming under currency intervention due to large-scale sell-offs of Japanese bonds. The yield on 30-year bonds saw the biggest one-day jump in history, while yields on 10-year bonds reached their highest since 1999. Sanae Takaichi’s hints at abolishing the consumption tax on food products are forcing the Ministry of Finance to rack its brains over where to get the money.
Concerns about the financial stability of debt-ridden Japan are compounded by uncertainty over the outcome of the parliamentary elections scheduled for 8 February. The LDP’s long-time ally, Komeito, has joined the opposition, so Sanae Takaichi’s success is not guaranteed.
Donald Trump’s retreat, the Supreme Court’s defence of the Fed’s independence and the strengthening of the US dollar could have sent gold into a knockout. However, the precious metal took only a modest step back, and Goldman Sachs raised its forecast for the gold price from 4900 to 5400 per troy ounce by the end of 2026.
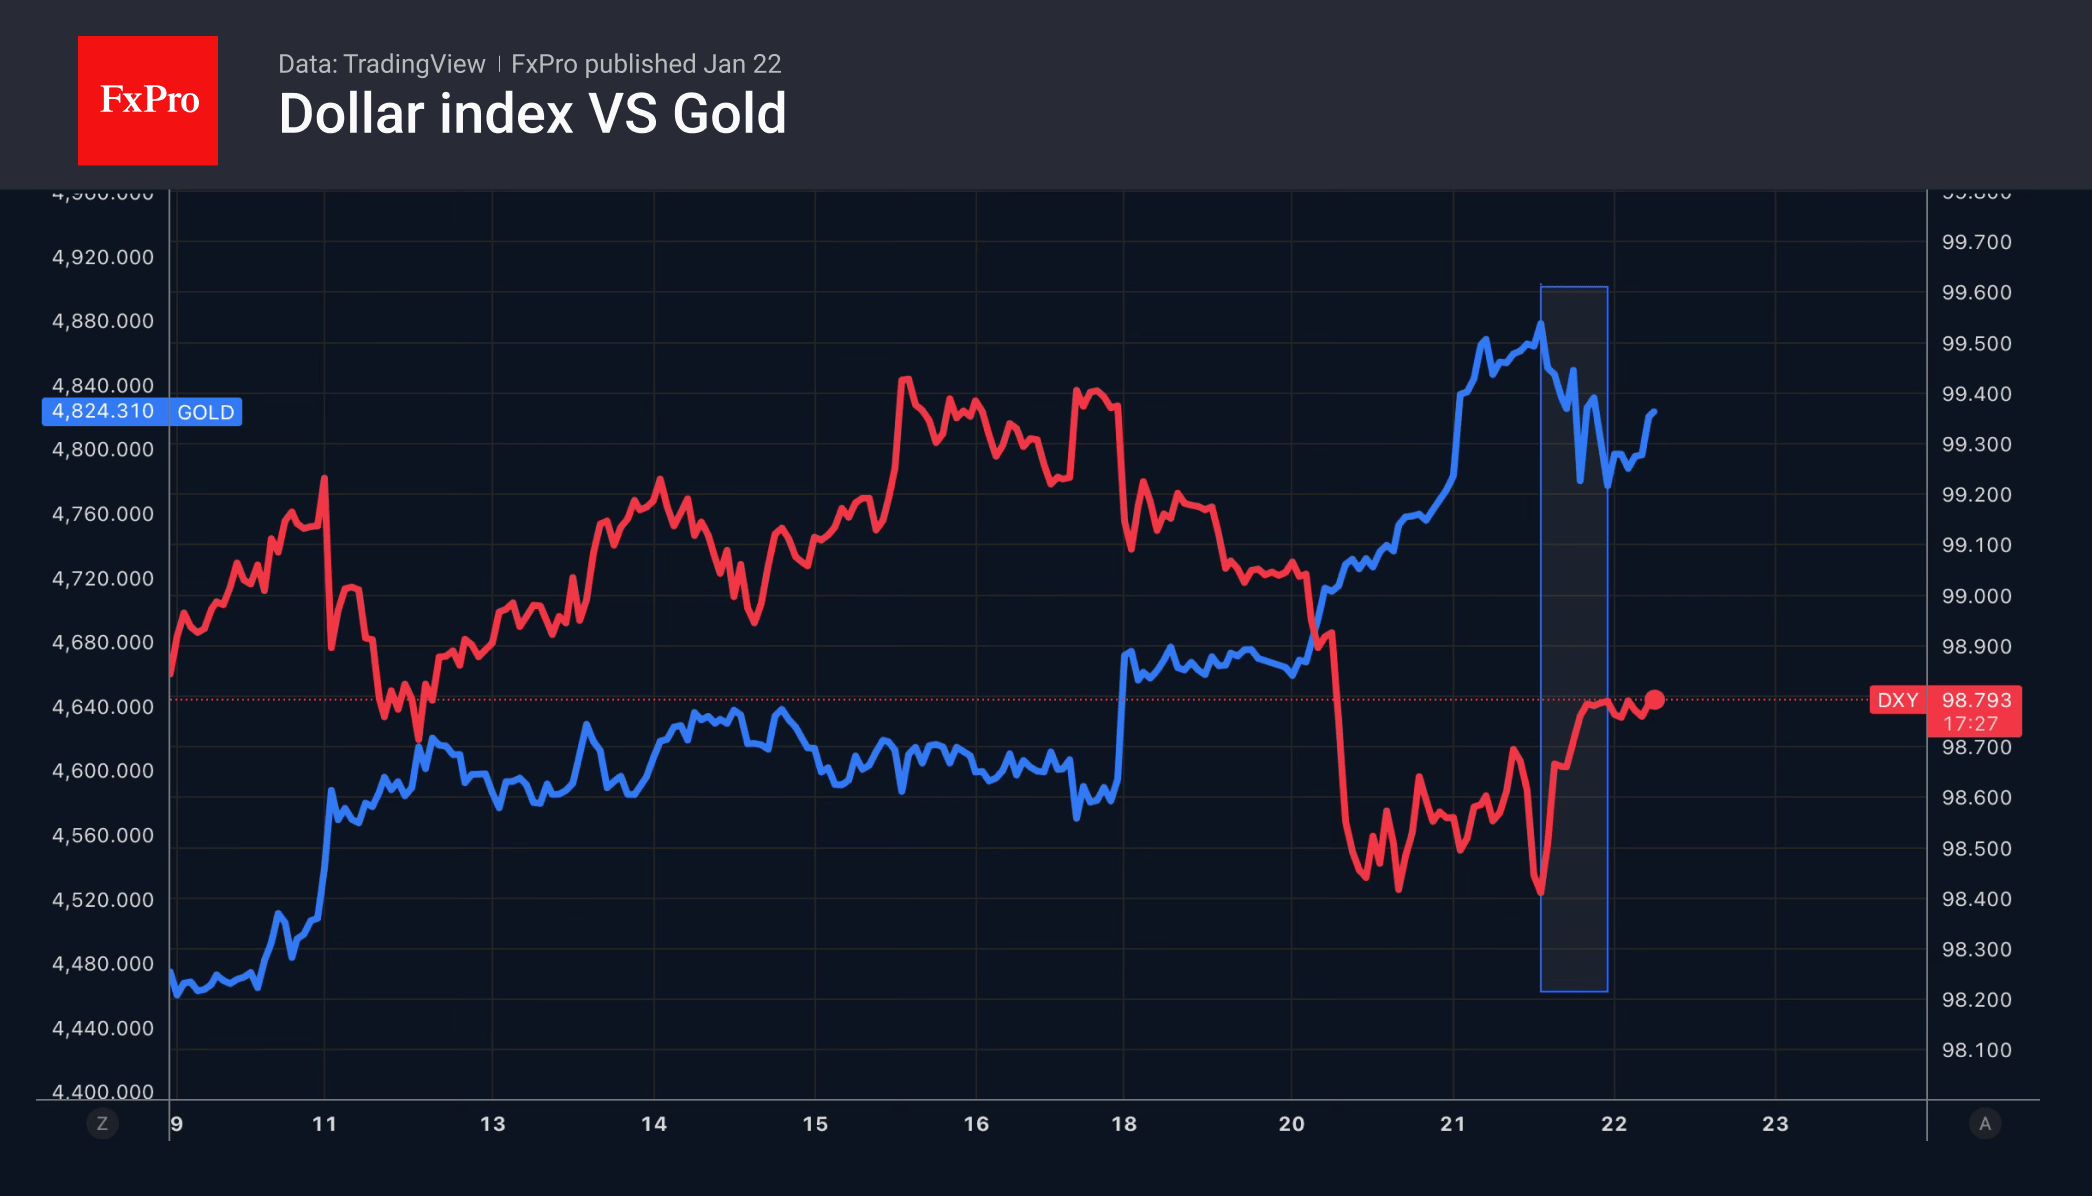
US Dollar Strengthens After Trump’s Statements on Greenland
During his visit to the World Economic Forum in Davos, Donald Trump softened his stance on claims over Greenland. According to media reports, the US President pledged not to use military force against NATO allies and also withdrew threats to impose tariffs on goods from several European countries. This eased geopolitical tensions, leading not only to a recovery in US equities but also to a strengthening of the US dollar.
The USD/JPY chart, for example, shows the US dollar gaining ground against the yen (marked by the orange arrow), which is under pressure ahead of the Bank of Japan’s interest rate decision scheduled for tomorrow.
Technical Analysis of the USD/JPY Chart
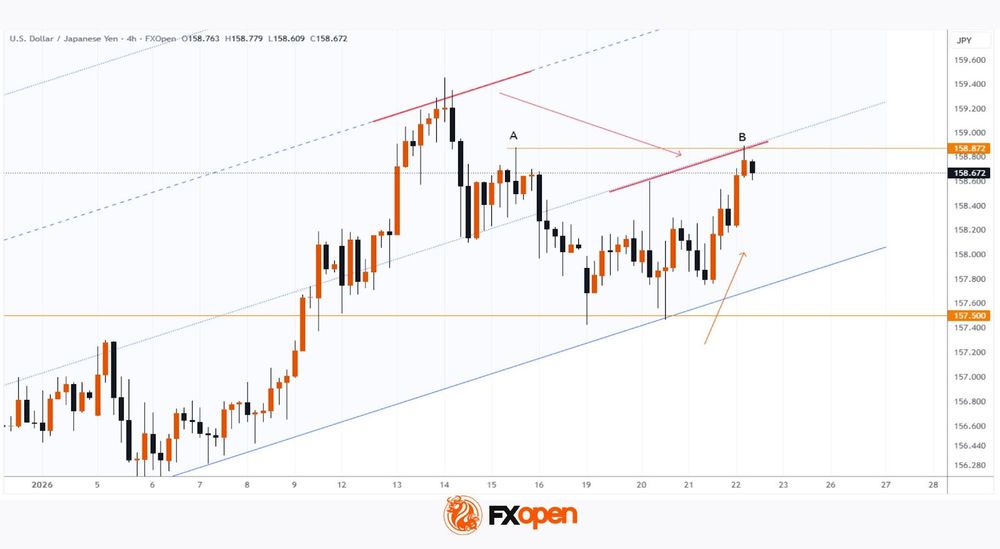
In late December, when analysing movements in the dollar–yen exchange rate, we identified a long-term ascending channel that remains valid (with a slight adjustment to reflect January data).
The lower boundary of this channel continues to act as solid support, but it is under threat because:
→ as indicated by the red arrow, bears are asserting control over the lower internal trendlines within the channel;
→ today’s peak (B) only marginally exceeds the high of 15 January (A). This resembles a bull trap, and a failed attempt to move higher could trigger renewed bearish pressure.
How the situation develops next will largely depend on a dense and rapidly changing news backdrop. In addition to the drivers already mentioned, attention should be paid to the release of US GDP data and initial jobless claims (scheduled for today at 16:30 GMT+3), which could have a significant impact on USD/JPY dynamics.
Trade over 50 forex markets 24 hours a day with FXOpen. Take advantage of low commissions, deep liquidity, and spreads from 0.0 pips (additional fees may apply). Open your FXOpen account now or learn more about trading forex with FXOpen.
This article represents the opinion of the Companies operating under the FXOpen brand only. It is not to be construed as an offer, solicitation, or recommendation with respect to products and services provided by the Companies operating under the FXOpen brand, nor is it to be considered financial advice.
EUR/USD Daily Outlook
Daily Pivots: (S1) 1.1660; (P) 1.1701; (R1) 1.1727; More….
EUR/USD retreated well ahead of 1.1807 resistance and intraday bias is turned neutral. Risk will stay on the upside as long as 55 4H EMA (now at 1.1672) holds. Break of 1.1807 will will resume whole rally from 1.1467, and target a retest on 1.1917 key resistance level. However, sustained trading below 55 4H EMA will bring deeper fall back to 1.1576 support instead.
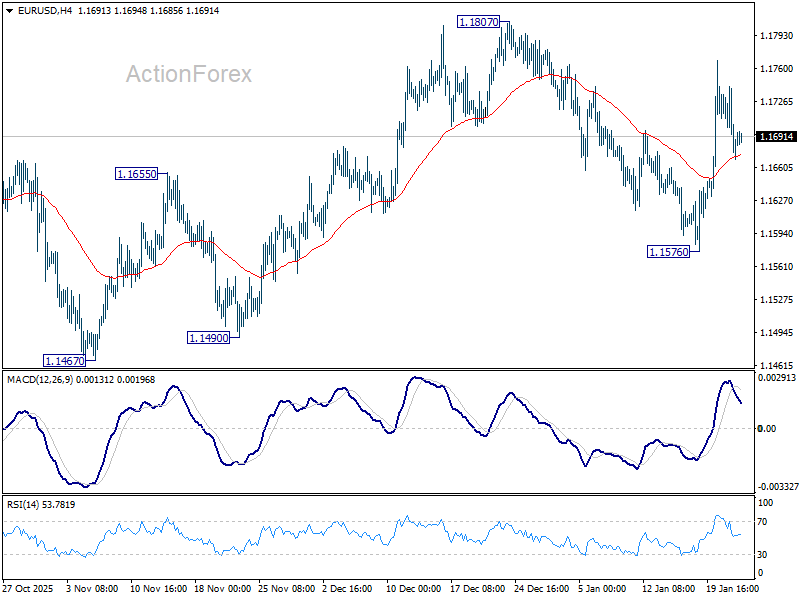
In the bigger picture, as long as 55 W EMA (now at 1.1413) holds, up trend from 0.9534 (2022 low) is still in favor to continue. Decisive break of 1.2 key psychological level will carry larger bullish implication. However, sustained trading below 55 W EMA will argue that rise from 0.9534 has completed as a three wave corrective bounce, and keep long term outlook bearish.
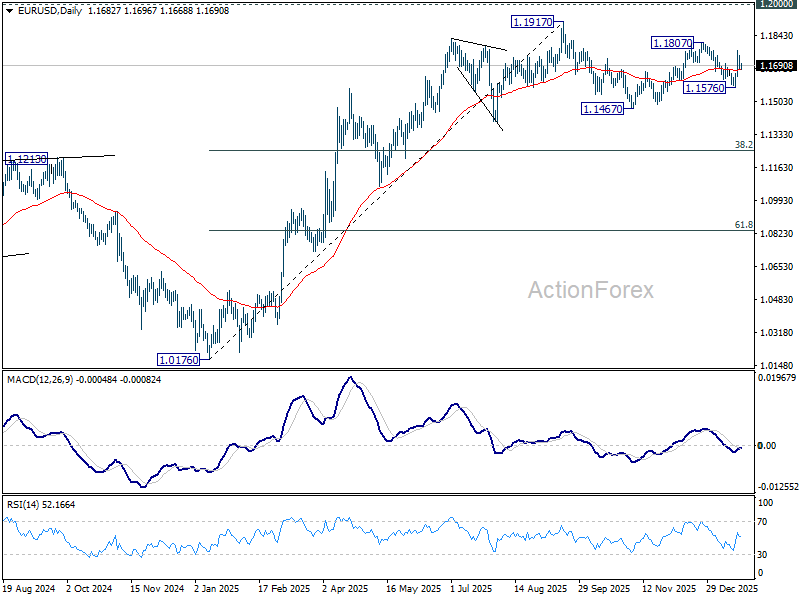
USD/JPY Daily Outlook
Daily Pivots: (S1) 157.86; (P) 158.19; (R1) 158.64; More...
USD/JPY is still bounded in consolidations below 159.44 and intraday bias stays neutral. With 156.10 support intact, outlook remains bullish. On the upside, break of 159.44 will resume the rise from 139.87 towards 161.94 high. However, firm break of 156.10 will confirm short term topping, and turn bias back to the downside for deeper pullback.
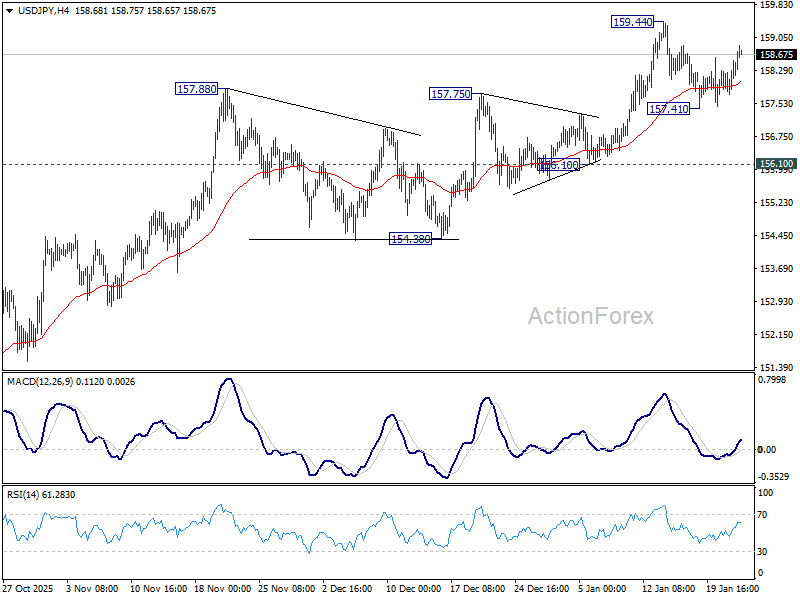
In the bigger picture, corrective pattern from 161.94 (2024 high) should have completed with three waves at 139.87. Larger up trend from 102.58 (2021 low) could be ready to resume through 161.94. Decisive break of 158.86 structural resistance will solidify this bullish case and target 161.94 for confirmation. On the downside, break of 154.38 support will dampen this bullish view and extend the corrective range pattern with another falling leg.
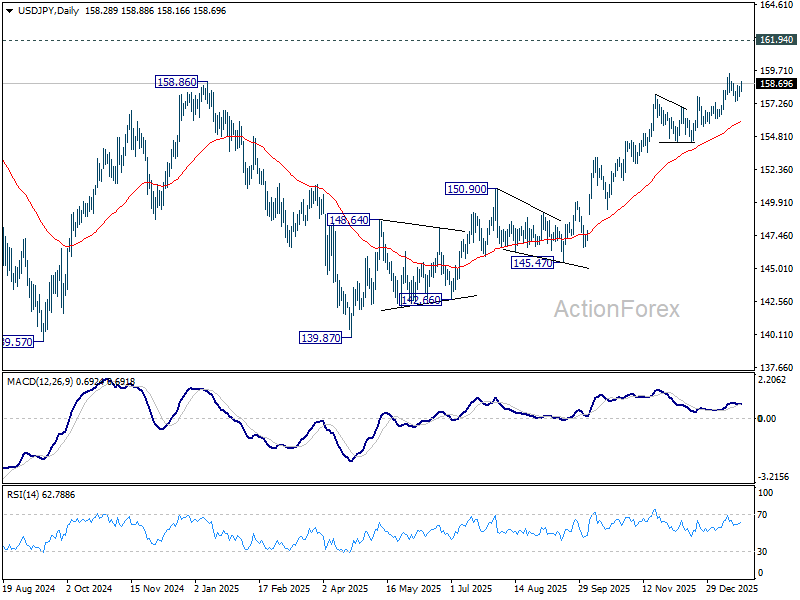
GBP/USD Daily Outlook
Daily Pivots: (S1) 1.3400; (P) 1.3430; (R1) 1.3458; More...
Range trading continues in GBP/USD and intraday bias stays neutral. On the upside, firm break of 1.3494 will suggest that pullback from 1.3567 has completed at 1.3342, after drawing support from 55 D EMA (now at 1.3382). Intraday bias will be back on the upside for 1.3567 first. Break there will resume the rally from 1.3008 to retest 1.3787 high. On the downside, sustained trading below 55 D EMA will argue that the decline is another falling leg in the corrective pattern from 1.3787.
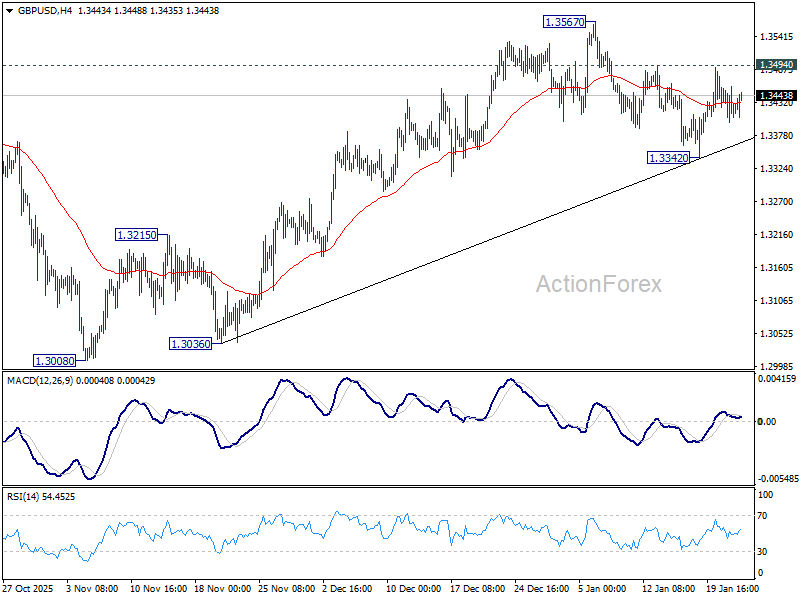
In the bigger picture, price actions from 1.3787 (2025 high) are seen as a correction to the larger up trend from 1.3051 (2022 low). Deeper decline could be seen as the pattern extends, but downside should be contained by 38.2% retracement of 1.0351 to 1.3787 at 1.2474 to bring rebound. Break of 1.3787 for up trend resumption is expected at a later stage.