
Sample Category Title
USD/JPY Mid-Day Outlook
Daily Pivots: (S1) 158.10; (P) 158.50; (R1) 158.82; More...
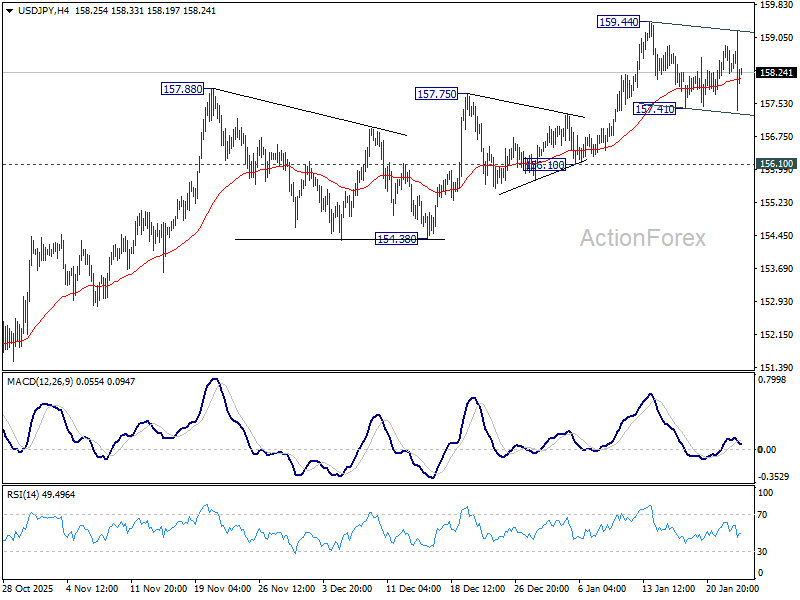
Range trading continues in USD/JPY and intraday bias stays neutral. With 156.10 support as well as 55 D EMA (now at 156.03) intact, further rise is expected. On the upside, break of 159.44 will resume the rise from 139.87 towards 161.94 high. However, firm break of 156.10 will confirm short term topping, and turn bias back to the downside for deeper pullback.
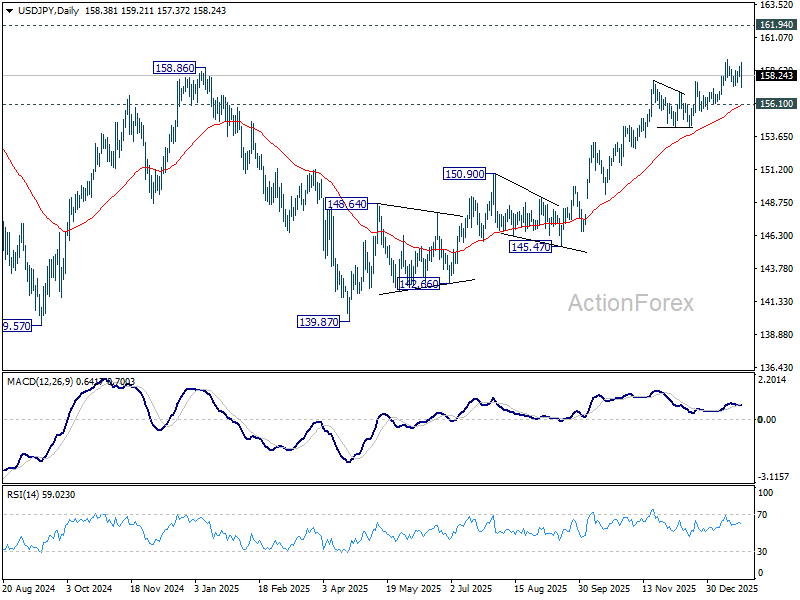
In the bigger picture, corrective pattern from 161.94 (2024 high) should have completed with three waves at 139.87. Larger up trend from 102.58 (2021 low) could be ready to resume through 161.94. Decisive break of 158.86 structural resistance will solidify this bullish case and target 161.94 for confirmation. On the downside, break of 154.38 support will dampen this bullish view and extend the corrective range pattern with another falling leg.
GBP/USD Mid-Day Outlook
Daily Pivots: (S1) 1.3434; (P) 1.3471; (R1) 1.3539; More...
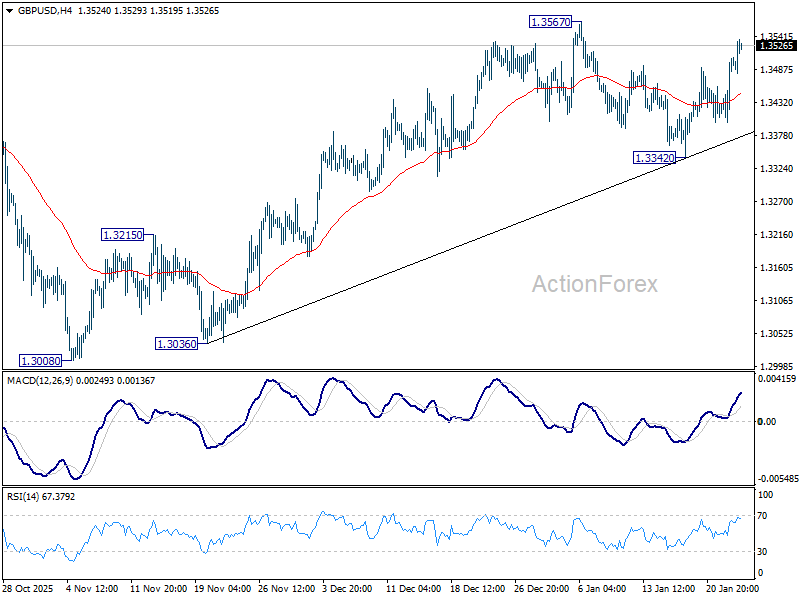
Intraday bias in GBP/USD remains on the upside for 1.3567 resistance. Firm break there will resume the rally from 1.3008 to retest 1.3787 high. For now, risk will stay on the upside as long as 1.3342 support holds, in case of retreat.
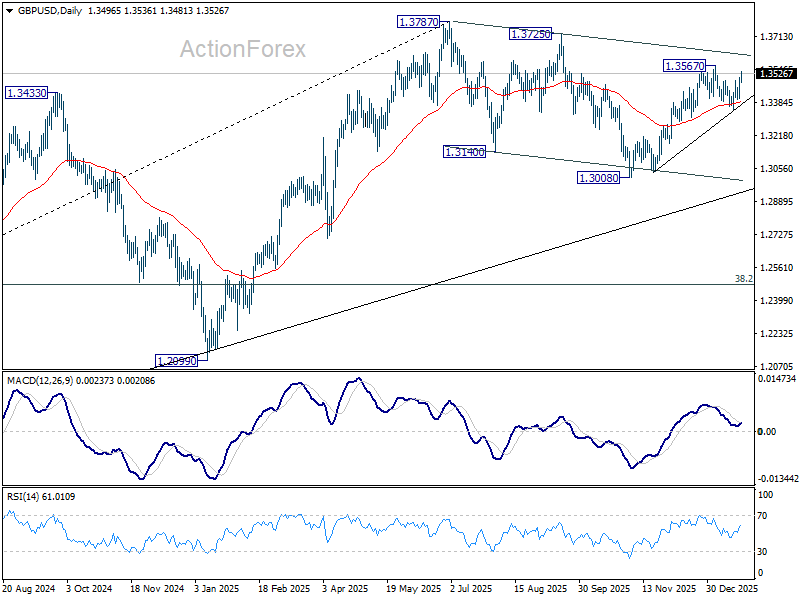
In the bigger picture, price actions from 1.3787 (2025 high) are seen as a correction to the larger up trend from 1.3051 (2022 low). Deeper decline could be seen as the pattern extends, but downside should be contained by 38.2% retracement of 1.0351 to 1.3787 at 1.2474 to bring rebound. Break of 1.3787 for up trend resumption is expected at a later stage.
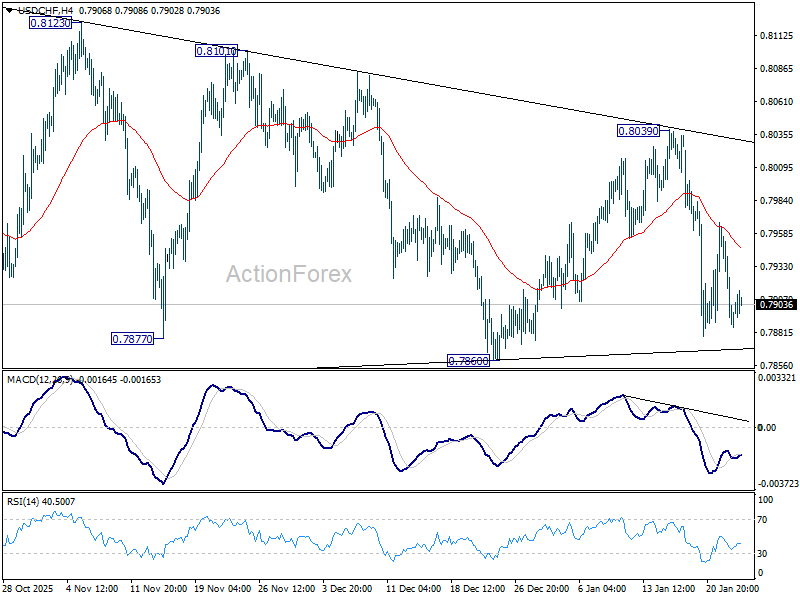
USD/CHF Mid-Day Outlook
Daily Pivots: (S1) 0.7864; (P) 0.7915; (R1) 0.7941; More….
Sideway trading continues in USD/CHF and intraday bias remains neutral. Also, risk stays on the downside with 55 4H EMA (now at 0.7948) intact. Firm break of 0.7860 support will argue that larger down trend is ready to resume through 0.7828 low. Nevertheless, sustained break of 55 4H EMA will bring stronger rebound towards 0.8039 resistance. Overall, price actions from 0.7828 are seen as a corrective pattern, which could still extend.
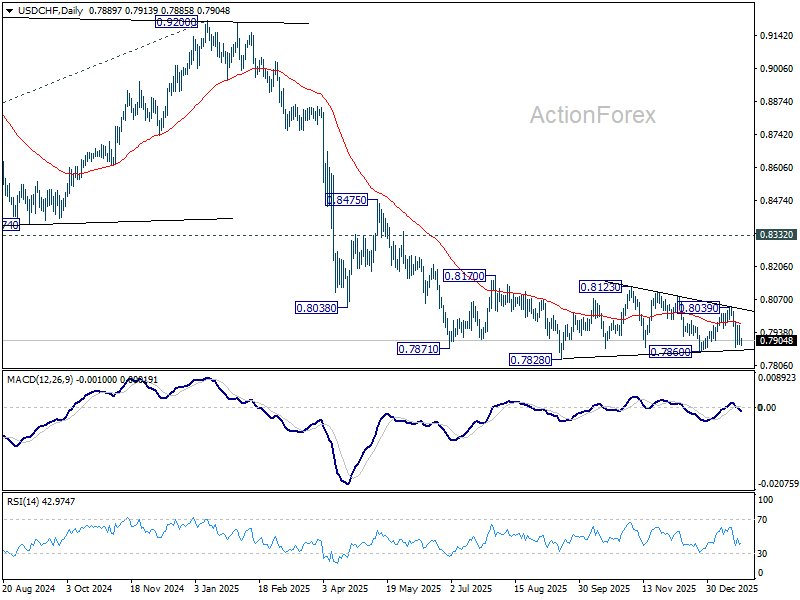
In the bigger picture, price actions from 0.7828 are seen as a correction. Larger down trend from 1.0342 (2017 high) is still in progress. Break of 0.7828 will target 100% projection of 1.0146 (2022 high) to 0.8332 from 0.9200 at 0.7382. In any case, outlook will stay bearish as long as 0.8332 support turned resistance holds (2023 low).
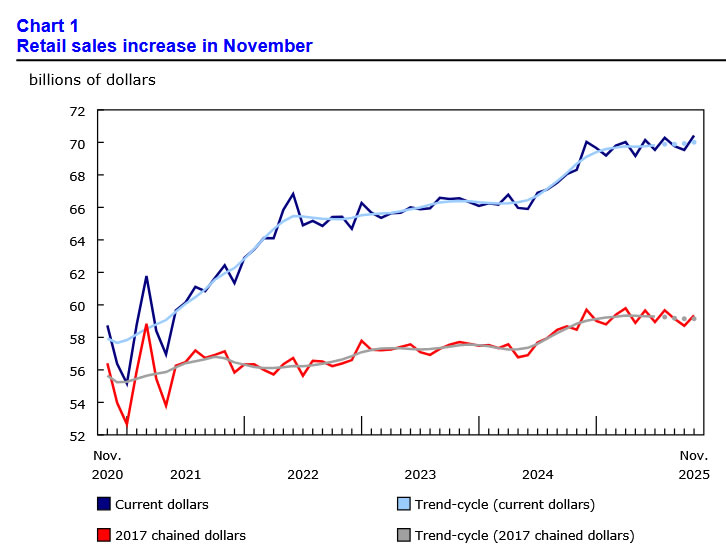
Canada: Retail Sales Rebound in November, Lose Steam in December
Retail sales rose 1.3% month-on-month (m/m) in November, stronger than Statistics Canada's 1.2% advanced estimate.
After adjusting for inflation, sales volumes rose by a more modest 1.1% m/m.
Auto sales continued to edge higher, rising 0.3% m/m in November.
Receipts at gas stations and fuel vendors rose 2.0% m/m, driven by stronger demand, with volumes also up 0.7% m/m.
Core sales – excluding auto sales and receipts at gas stations – rebounded after two straight months of declines, rising 1.6% m/m.
Gains were broad-based across most categories, led by a strong rebound in food and beverage retailers (+3.0% m/m). Part of this strength reflects volatility in beer, wine and liquor retailers, which bounced back after a sharp decline in previous month due to a labour dispute in British Columbia. Other notable contributors included clothing and clothing accessories stores (+2.4% m/m) building material & garden supplies dealers (+2.1% m/m).
The two laggards were miscellaneous store retailers (-0.5% m/m) and electronics and appliance stores (-0.2% m/m).
E-commerce sales declined by 2.8% m/m in November.
Statistics Canada's advanced estimate points to moderation in December, with sales projected to decline 0.5% m/m.
Key Implications
November delivered a welcome rebound, but there is little to get excited about. Part of the strength reflects volatility tied to a labour dispute, rather than a meaningful improvement in underlying demand. The pick-up follows a weak and downwardly revised October and is already giving way to softer momentum in December. Looking through the monthly volatility, the underlying trend in real sales remains negative. Soft consumer sentiment is likely a key factor: the Bank of Canada's latest consumer survey shows households are feeling increasingly pessimistic about their finances, weighing on spending decisions.
Our outlook for Q4 real consumption growth remains subdued, tracking close to 0.9% (quarter-on-quarter, annualized). There is some upside risk from services, as our internal credit and debit card data point to building momentum toward year-end. Still, we don’t think expect it to be large enough to lift overall consumption above a below-trend pace.
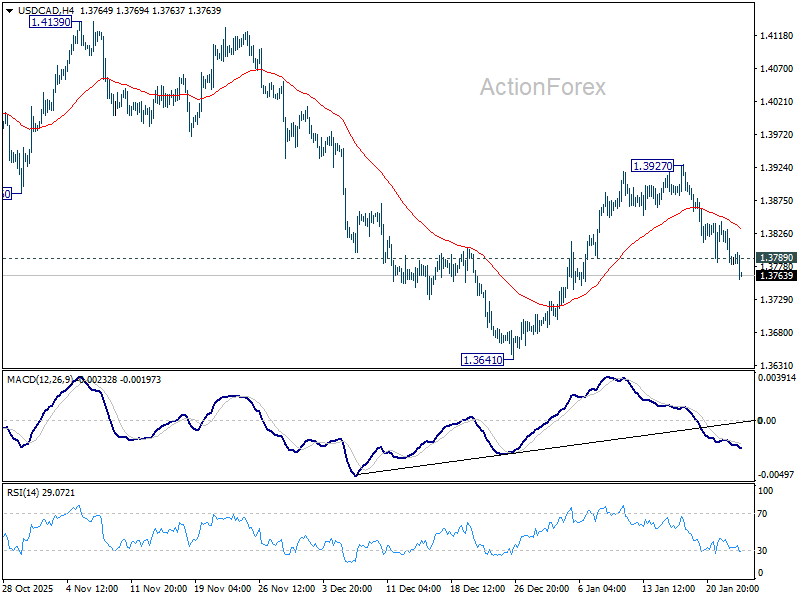
USD/CAD Mid-Day Outlook
Daily Pivots: (S1) 1.3764; (P) 1.3805; (R1) 1.3826; More...
USD/CAD's break of 1.3789 support suggests that rebound from 1.3641 as already completed at 1.3927. Intraday bias is back on the downside for retesting 1.3538/3641 support zone. Decisive break there will resume whole down trend from 1.4791. For now, risk will stay on the downside as long as 1.3927 resistance holds, in case of recovery.
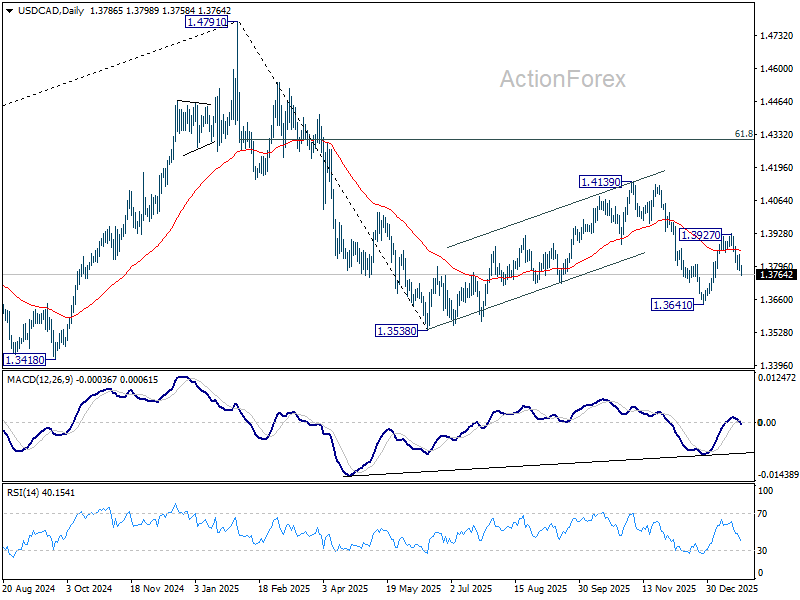
In the bigger picture, price actions from 1.4791 are seen as a corrective pattern to the whole up trend from 1.2005 (2021 low). Deeper fall could be seen as the pattern extends, and break of 1.3538 will target 61.8% retracement of 1.2005 to 1.4791 at 1.3069. For now, medium term outlook will be neutral until there are signs that the correction has completed.
Yen Bounce Short-Lived Without Market Buy-In, Loonie Bounces After Retail Sales
Yen’s sharp rebound today, triggered by suspected official intervention, is already fading quickly, highlighting the market’s skepticism toward one-off defensive actions. After an abrupt spike higher, the currency quickly lost momentum as traders faded the move. The development is inline with the view that government action alone is insufficient to reverse the broader bearish trend.
Japanese officials offered no confirmation. Finance Minister Satsuki Katayama acknowledged close monitoring of FX markets but avoided addressing speculation that authorities had checked rates with banks. Similarly, Atsushi Mimura, Japan’s top currency official, declined to comment on whether Yen-buying intervention had occurred, or whether rate checks had taken place.
Markets know from experience that intervention only works when it catalyzes a broader shift in positioning, rather than acting as a standalone signal. Without that alignment, intervention typically delays—rather than prevents—the underlying trend. Today’s price action fits that pattern, with selling pressure already returning as initial excitement fades. The broader backdrop remains unfavorable for Yen. Limited policy urgency from the BoJ, and strong risk-on appetite continue to weigh.
In contrast, Canadian Dollar strengthened, extending gains after retail sales surprised to the upside. The data added to evidence that consumer demand stabilized late last year. That strength builds on earlier CPI data showing headline inflation firming in December, which effectively closed the door on further near-term easing by the BoC.
With inflation and activity holding up, markets continues to see the BoC firmly on hold, and while talk of hikes remains premature, the directional risk has clearly shifted away from cuts.
Elsewhere, Kiwi leads performance this week as speculation grows that the RBNZ may deliver a rate hike this year. Aussie follows, buoyed by similar expectations for the RBA, but likely earlier than New Zealand. Swiss Franc ranks third, hinting that residual risk-off sentiment persists, particularly in Europe. At the bottom, Yen remains the weakest currency of the week. Dollar and Sterling also lag, while Euro and Loonie trade in the middle.
In Europe, at the time of writing, FTSE is up 0.06%. DAX is up 0.02%. CAC is down -0.23%. UK 10-year yield is up 0.029 at 4.504. Germany 10-year yield is up 0.008 at 2.896. Earlier in Asia, Nikkei rose 0.29%. Hong Kong HSI rose 0.45%. China Shanghai SSE rose 0.33%. Singapore Strait Times rose 1.31%. Japan 10-year JGB yield rose 0.023 to 2.264.
Canada retail sales rise 1.3% mom in November, but December cools
Canada’s retail sales rebounded strongly in November, rising 1.3% mom to CAD 70.4B, slightly above expectations of 1.2% mom. Gains were broad-based, with sales increasing in eight of nine subsectors, led by higher spending at food and beverage retailers, pointing to resilient consumer demand late in the year.
Underlying momentum was even firmer. Core retail sales, which exclude gasoline and autos, climbed 1.6% mom, suggesting household spending strength extended beyond volatile categories and reflecting solid discretionary demand.
However, the outlook is less upbeat. An advance estimate from Statistics Canada indicates retail sales likely -fell 0.5% mom in December, hinting that November’s surge may not have been sustained.
UK PMI composite jumps to 21-month high, growth kicks up a gear but price pressures stir
UK business activity accelerated sharply in January, with PMI surveys pointing to the strongest momentum in nearly two years. Manufacturing PMI rose from 50.6 to 51.6, a 17-month high, while Services PMI jumped from 51.4 to 54.3, lifting Composite PMI from 51.4 to 53.9, its highest level in 21 months.
According to Chris Williamson of S&P Global Market Intelligence, UK firms “kicked up a gear” despite geopolitical headwinds. The flash PMI reading is consistent with quarterly GDP growth approaching 0.4%, with services—especially financial services and tech—leading the expansion. Manufacturing also showed a gathering recovery, helped by goods exports rising for the first time in four years.
However, the upbeat activity picture is tempered by continued job losses, as firms cut headcount to manage elevated costs. High staffing costs were again widely cited as a driver of higher selling prices, pointing to intensifying inflation pressures above the BoE's target.
Eurozone PMI composite stalls at 51.5, ECB likely to stay put
Eurozone business activity showed little momentum at the start of 2026, with January PMI data pointing to a fragile and uneven recovery. Manufacturing PMI improved modestly from 48.8 to 49.4, but remained in contraction. Services PMI eased from 52.4 to 51.9, leaving Composite PMI unchanged at 51.5, a level consistent with only modest growth.
According to Cyrus de la Rubia of Hamburg Commercial Bank, the recovery “still looks rather feeble.” Manufacturing continues to signal weakness, while services growth has moderated.
For the ECB, the details are "anything but reassuring". Services inflation has risen sharply in terms of sales prices, while input cost inflation remains elevated. That dynamic is likely to reinforce the Governing Council’s preference to hold rates steady, with some hawkish members potentially arguing that the next move should be up rather than down.
Country-level divergences persist. Services activity in Germany expanded at a relatively solid pace in January, while French services slipped into contraction. In manufacturing, France marginally outperformed Germany, though output growth in both remains weak.
BoJ holds rates, upgrades growth outlook, hawkish dissent keeps hike risk alive
The BoJ left its benchmark interest rate unchanged at 0.75%, in line with expectations, but the decision revealed persistent internal debate. Hawkish board member Hajime Takata proposed a hike toward 1%, citing upside risks to inflation, though the motion was voted down by the majority.
The central bank maintained its assessment that the 2% inflation target will be achieved in the latter half of the three-year projection period through fiscal 2027, keeping its medium-term normalization narrative intact despite near-term caution.
At the post-meeting press conference, Governor Kazuo Ueda reiterated a data-dependent tightening bias. He said the BoJ would "continue to raise rates if economic and price forecasts materialize", stressing that the pace and path of hikes would be determined meeting by meeting as conditions evolve.
In its quarterly outlook report, the BoJ upgraded growth forecasts, reflecting the impact of fiscal stimulus under Prime Minister Sanae Takaichi. The economy is now seen growing 0.9% in the current fiscal year and 1.0% next year, up from 0.7% previously. Inflation projections were largely unchanged, aside from a 0.1pp upward revision to 1.9% for fiscal 2026.
The BoJ highlighted risks from overseas growth and prices, adding "exchange rate developments are, compared to the past, more likely to affect prices."
Japan's CPI core falls to 2.4% with sharp energy drag, limited core-core cooling
Japan’s December CPI report showed sharp moderation in headline inflation, largely reflecting energy relief rather than broad-based disinflation. Headline CPI slowed to 2.1% yoy from 2.9%, the weakest pace since early 2022. Core CPI (ex-fresh food) fell from 3.0% to 2.4%, helped by government measures to stabilize gasoline prices.
However, the decline was far less pronounced beneath the surface. Core-core CPI (ex-fresh food and energy) edged down just 0.1pp to 2.9% yoy, highlighting the stickiness of domestic inflation. Food prices excluding fresh items remained elevated at 6.7% yoy, though the pace eased slightly from 7.0%. Rice prices were still up 34.4%, even as inflation in the staple continued to cool gradually from prior peaks.
Energy prices were the key drag, reversing into a -3.1% yoy decline as gasoline prices fell -7.1%, reflecting higher subsidies and preparation for a gasoline tax cut late in the month. While these policy measures are temporarily easing inflation readings, the modest pullback in core-core CPI suggests underlying price pressures remain too firm to ignore.
Japan PMI composite jumps to 52.8, manufacturing returns to growth
Japan’s January PMI readings delivered an upbeat signal, indicating a broadening recovery across the private sector, with PMI data pointing to the strongest expansion in 17 months. Manufacturing PMI rose from 50.0 to 51.1, returning to expansion. Services PMI jumped from 51.6 to 53.4. As a result, Composite PMI climbed from 51.1 to 52.8, signaling broad-based growth momentum.
According to Annabel Fiddes of S&P Global Market Intelligence, the data show a "solid start" to the year, supported primarily by accelerating services activity. Also, manufacturing output rose for the first time since June 2025, marking an important shift after a prolonged period of weakness.
The improvement was reinforced by the first increase in manufactured goods sales in more than three-and-a-half years, alongside rise in new export orders for the first time since early 2022.
However, business optimism weakened, reflecting concerns over rising costs, global uncertainty, labour shortages, and Japan’s ageing population, suggesting growth momentum may face headwinds later in the year.
Australia PMI composite surges to 55.0, manufacturing and services in solid expansion
Australia’s business activity accelerated sharply in January, pointing to a strong start to 2026. PMI Manufacturing rose from 51.6 to 52.4, while PMI Services surged from 51.1 to 56.0. As a result, PMI Composite jumped from 51.0 to 55.0, marking the joint-highest level since April 2022 and signaling a broad-based expansion.
According to Jingyi Pan of S&P Global Market Intelligence, the flash PMI data show that growth has become "more balanced", with "solid expansions evident across both manufacturing and services". The readings reflect resilient domestic demand and improving momentum entering the new year.
That said, forward-looking indicators were mixed. Faster new order growth contrasted with declining business confidence, particularly among service providers.
While output price inflation eased, driven by softer service-sector charges, rising manufacturing input costs remain a risk factor, suggesting inflation pressures could re-intensify later in the quarter.
NZ CPI pushes above target as RBNZ Breman's tone shifts
New Zealand inflation accelerated again. Headline CPI rose 3.1% yoy, up from 3.0% and above expectations of 3.0%, pushing inflation back above the RBNZ’s 1–3% target band. It marked the highest annual rate since Q2 2024.
The composition of inflation showed renewed pressure from tradeable prices. Tradeable CPI jumped from 2.2% yoy to 2.6% yoy, while non-tradeable CPI held steady at 3.5% yoy.
On a quarterly basis, CPI rose 0.6% q/q, exceeding expectations of 0.5%, with both tradeable (0.7% qoq) and non-tradeable (0.6% qoq) components contributing.
Notably, RBNZ Governor Anna Breman struck a firmer in a Bloomberg interview, pledging that policymakers will ensure inflation returns to the midpoint of the target band. She declined to push back against market pricing for a rate hike, saying policy decisions would be based on a "holistic view" of incoming data at the February meeting—marking a clear shift from her more neutral comments earlier this month.
USD/CAD Mid-Day Outlook
Daily Pivots: (S1) 1.3764; (P) 1.3805; (R1) 1.3826; More...
USD/CAD's break of 1.3789 support suggests that rebound from 1.3641 as already completed at 1.3927. Intraday bias is back on the downside for retesting 1.3538/3641 support zone. Decisive break there will resume whole down trend from 1.4791. For now, risk will stay on the downside as long as 1.3927 resistance holds, in case of recovery .
In the bigger picture, price actions from 1.4791 are seen as a corrective pattern to the whole up trend from 1.2005 (2021 low). Deeper fall could be seen as the pattern extends, and break of 1.3538 will target 61.8% retracement of 1.2005 to 1.4791 at 1.3069. For now, medium term outlook will be neutral until there are signs that the correction has completed.
Canada retail sales rise 1.3% mom in November, but December cools
Canada’s retail sales rebounded strongly in November, rising 1.3% mom to CAD 70.4B, slightly above expectations of 1.2% mom. Gains were broad-based, with sales increasing in eight of nine subsectors, led by higher spending at food and beverage retailers, pointing to resilient consumer demand late in the year.
Underlying momentum was even firmer. Core retail sales, which exclude gasoline and autos, climbed 1.6% mom, suggesting household spending strength extended beyond volatile categories and reflecting solid discretionary demand.
However, the outlook is less upbeat. An advance estimate from Statistics Canada indicates retail sales likely -fell 0.5% mom in December, hinting that November’s surge may not have been sustained.
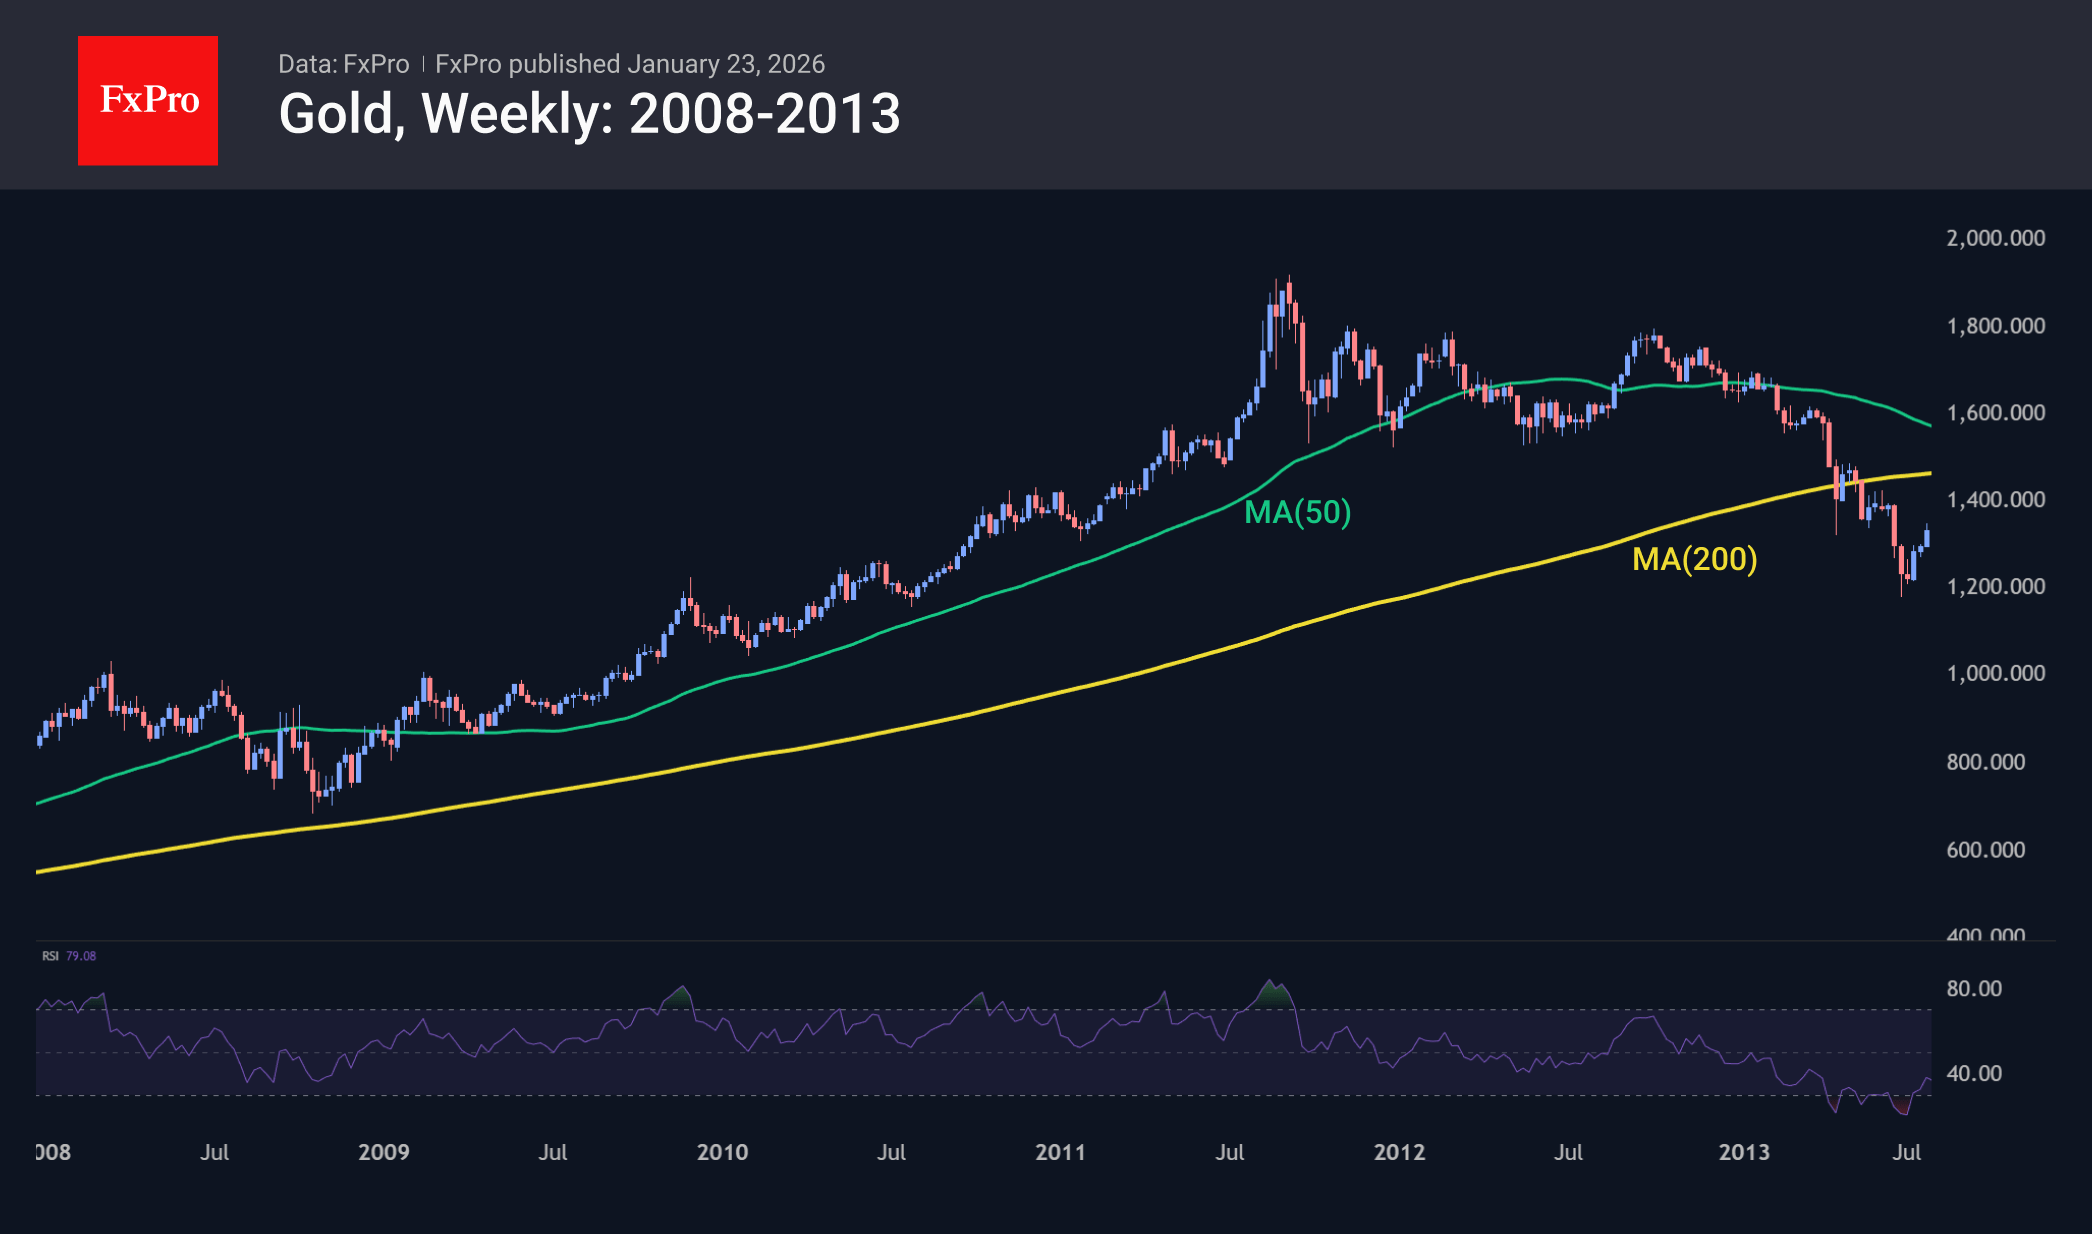
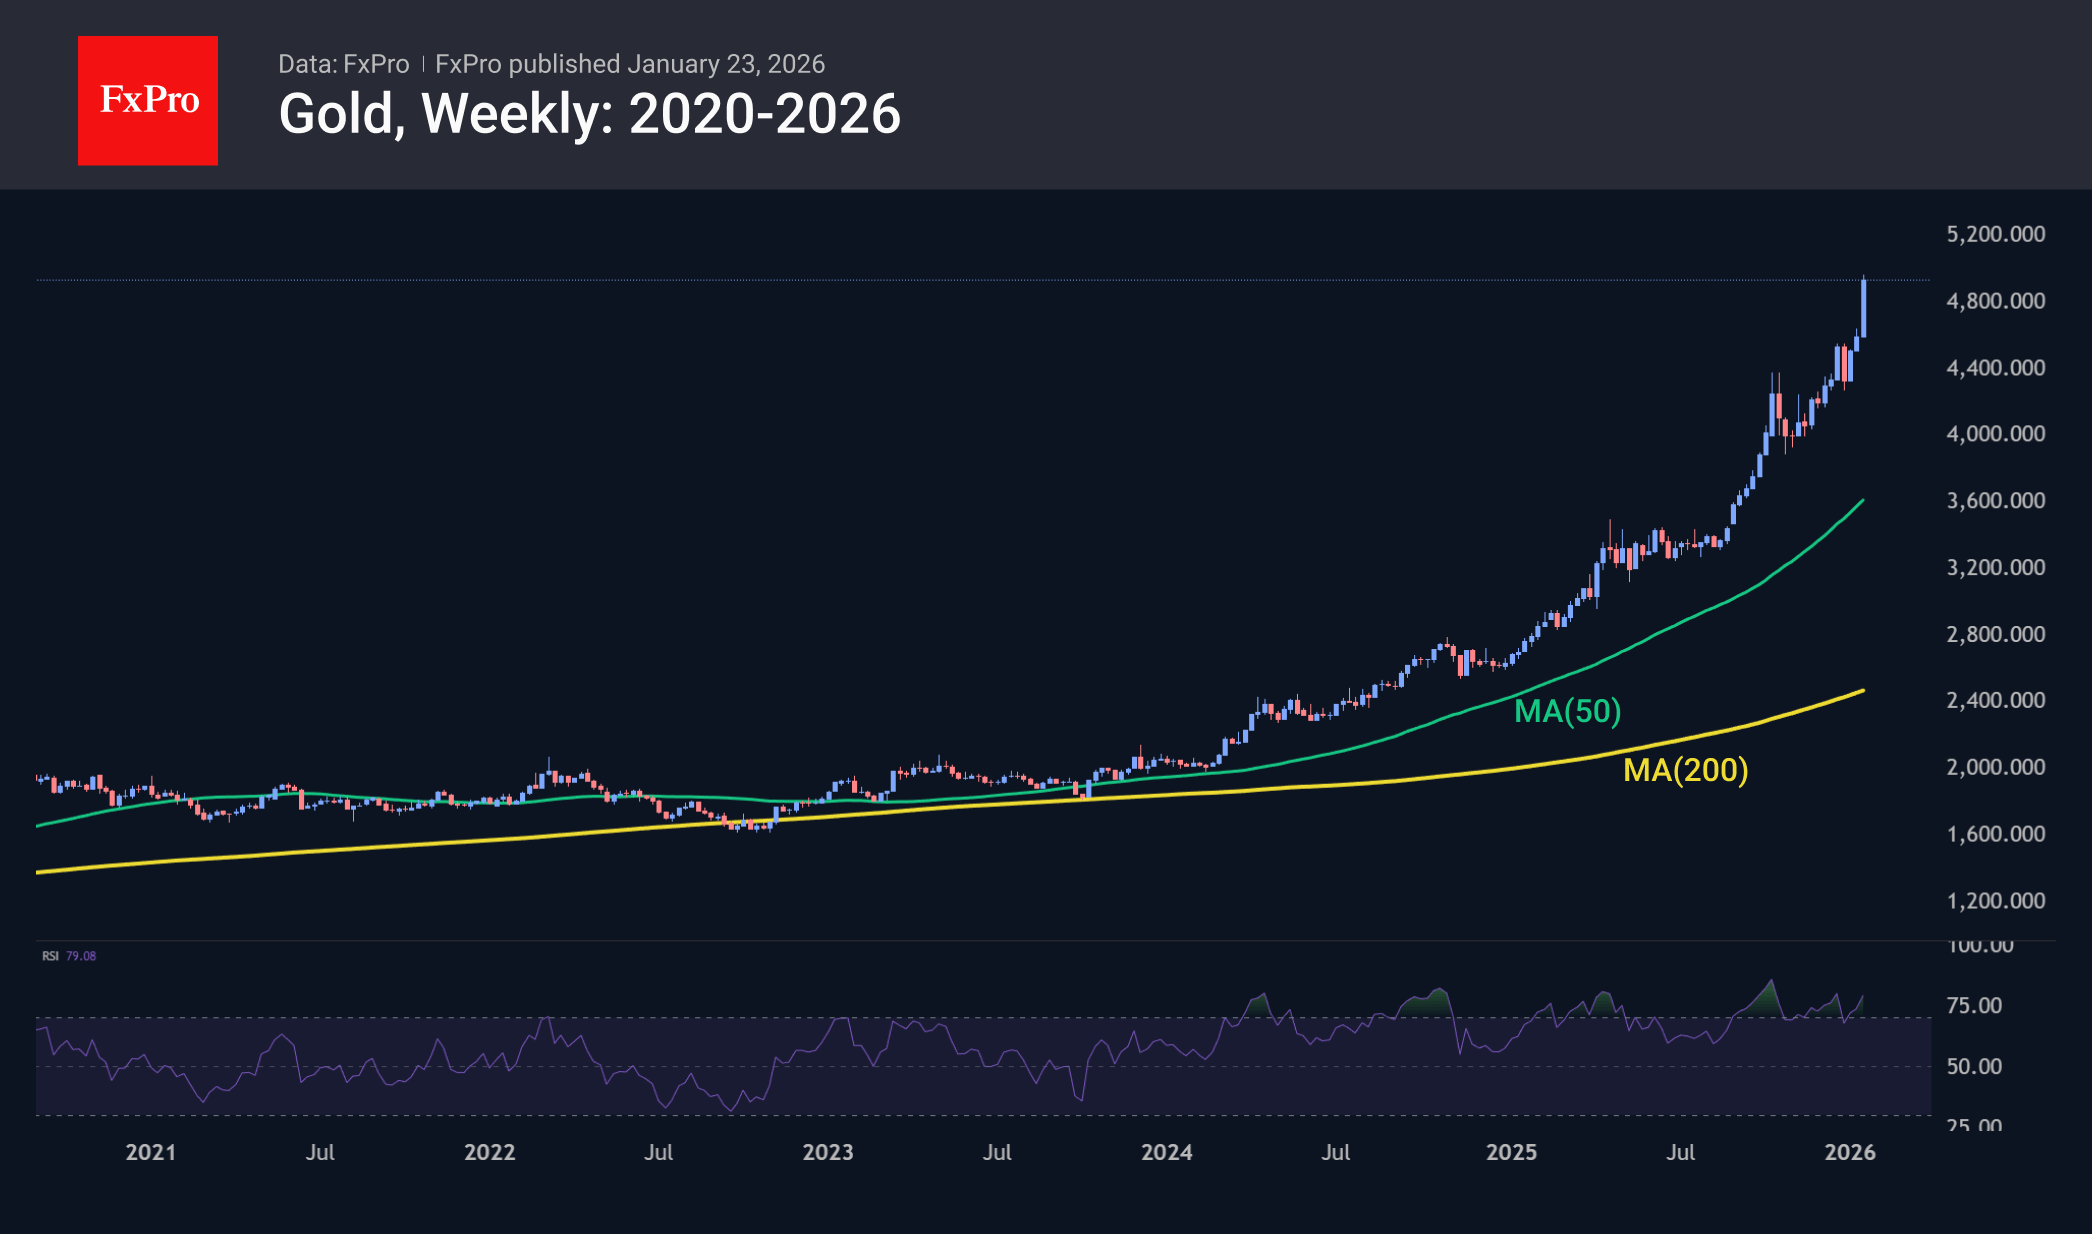
Gold Repeats Pattern Seen in Mid-2011
Gaining nearly 7% since Monday, gold is recording its strongest nominal growth in history and one of its most powerful weeks in terms of momentum. Gold is now within striking distance of the psychologically important $5,000 per ounce mark, which was unthinkable just a couple of years ago when the market was resting at $2,000.
The rally is driven by geopolitics, fiscal problems, the associated debasement trade, lower rates and capital outflows from other markets. When the Fed began tightening monetary policy in 2022, money market fund holdings stood at $5.5 trillion. By the end of 2025, they had increased to $7.7 trillion. As interest rates fall, money will flow into other assets. But to where? Stocks are fundamentally overbought, and Bitcoin has fallen out of favour due to declining volatility. Precious metals, on the other hand, are shining.
So, Goldman Sachs’ upward revision of its gold forecast for the end of 2026 from $4,900 to $5,400 seems logical. The bank expects a 50-basis-point cut in the federal funds rate and points to a 500-tonne increase in precious metal-focused ETF holdings since the beginning of 2025.
On the other hand, such an explosion of volatility after a prolonged rise is often the last impulse before a global reversal. The problem is understanding exactly when the turning point will occur. The current growth of more than 25% over the past 11 weeks is comparable to what happened at the end of the rally in 2011, and this week’s growth dynamics are similar to what happened during the last week of sharp growth a decade and a half ago. But history also teaches us patience: gold cautiously retested its highs for another three weeks, even though the downward slumps were becoming increasingly fierce. We may see something similar this time around.
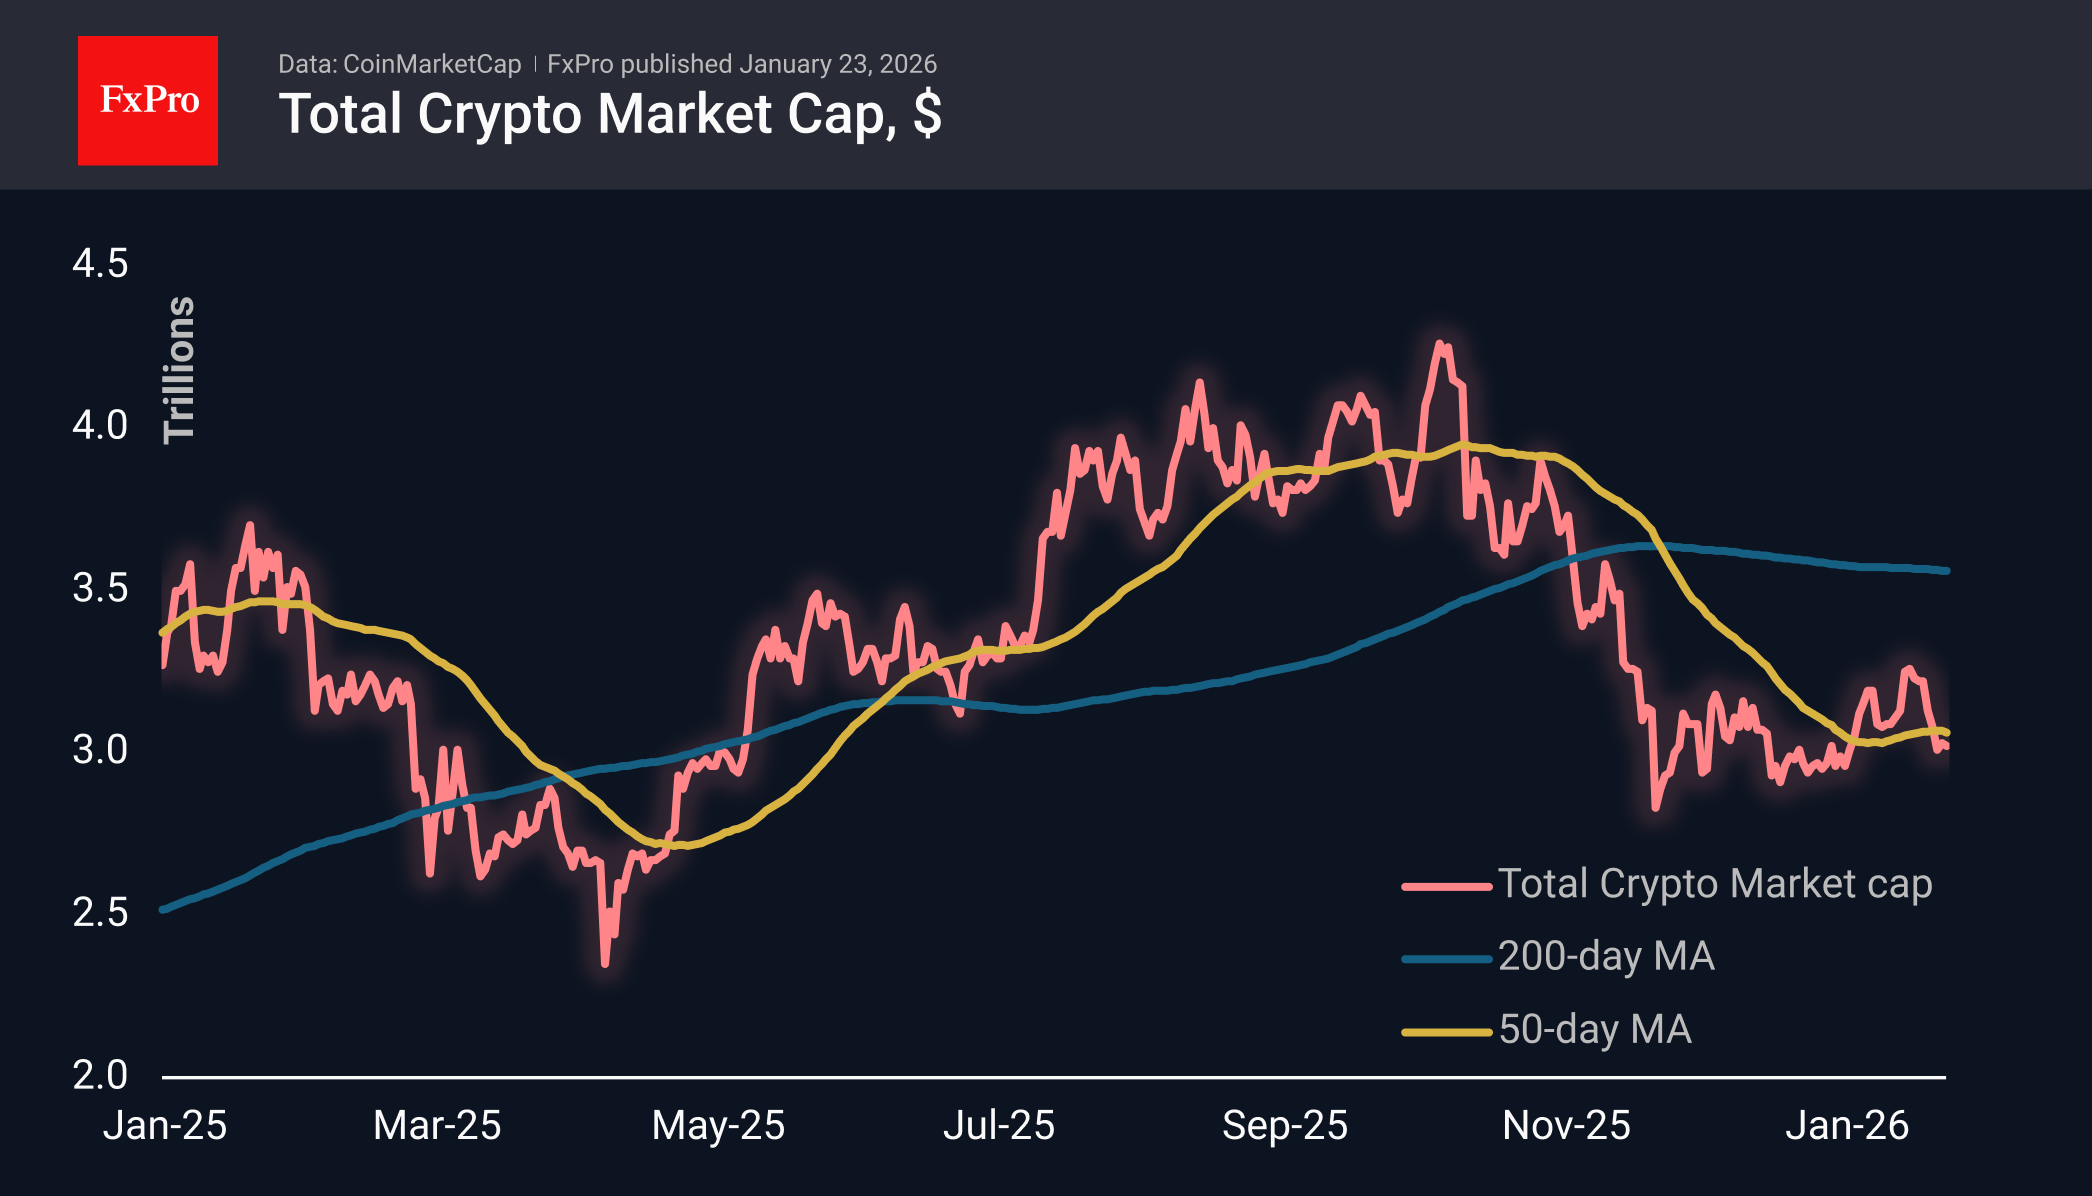
Crypto: On the Sidelines of Optimism
Market Overview
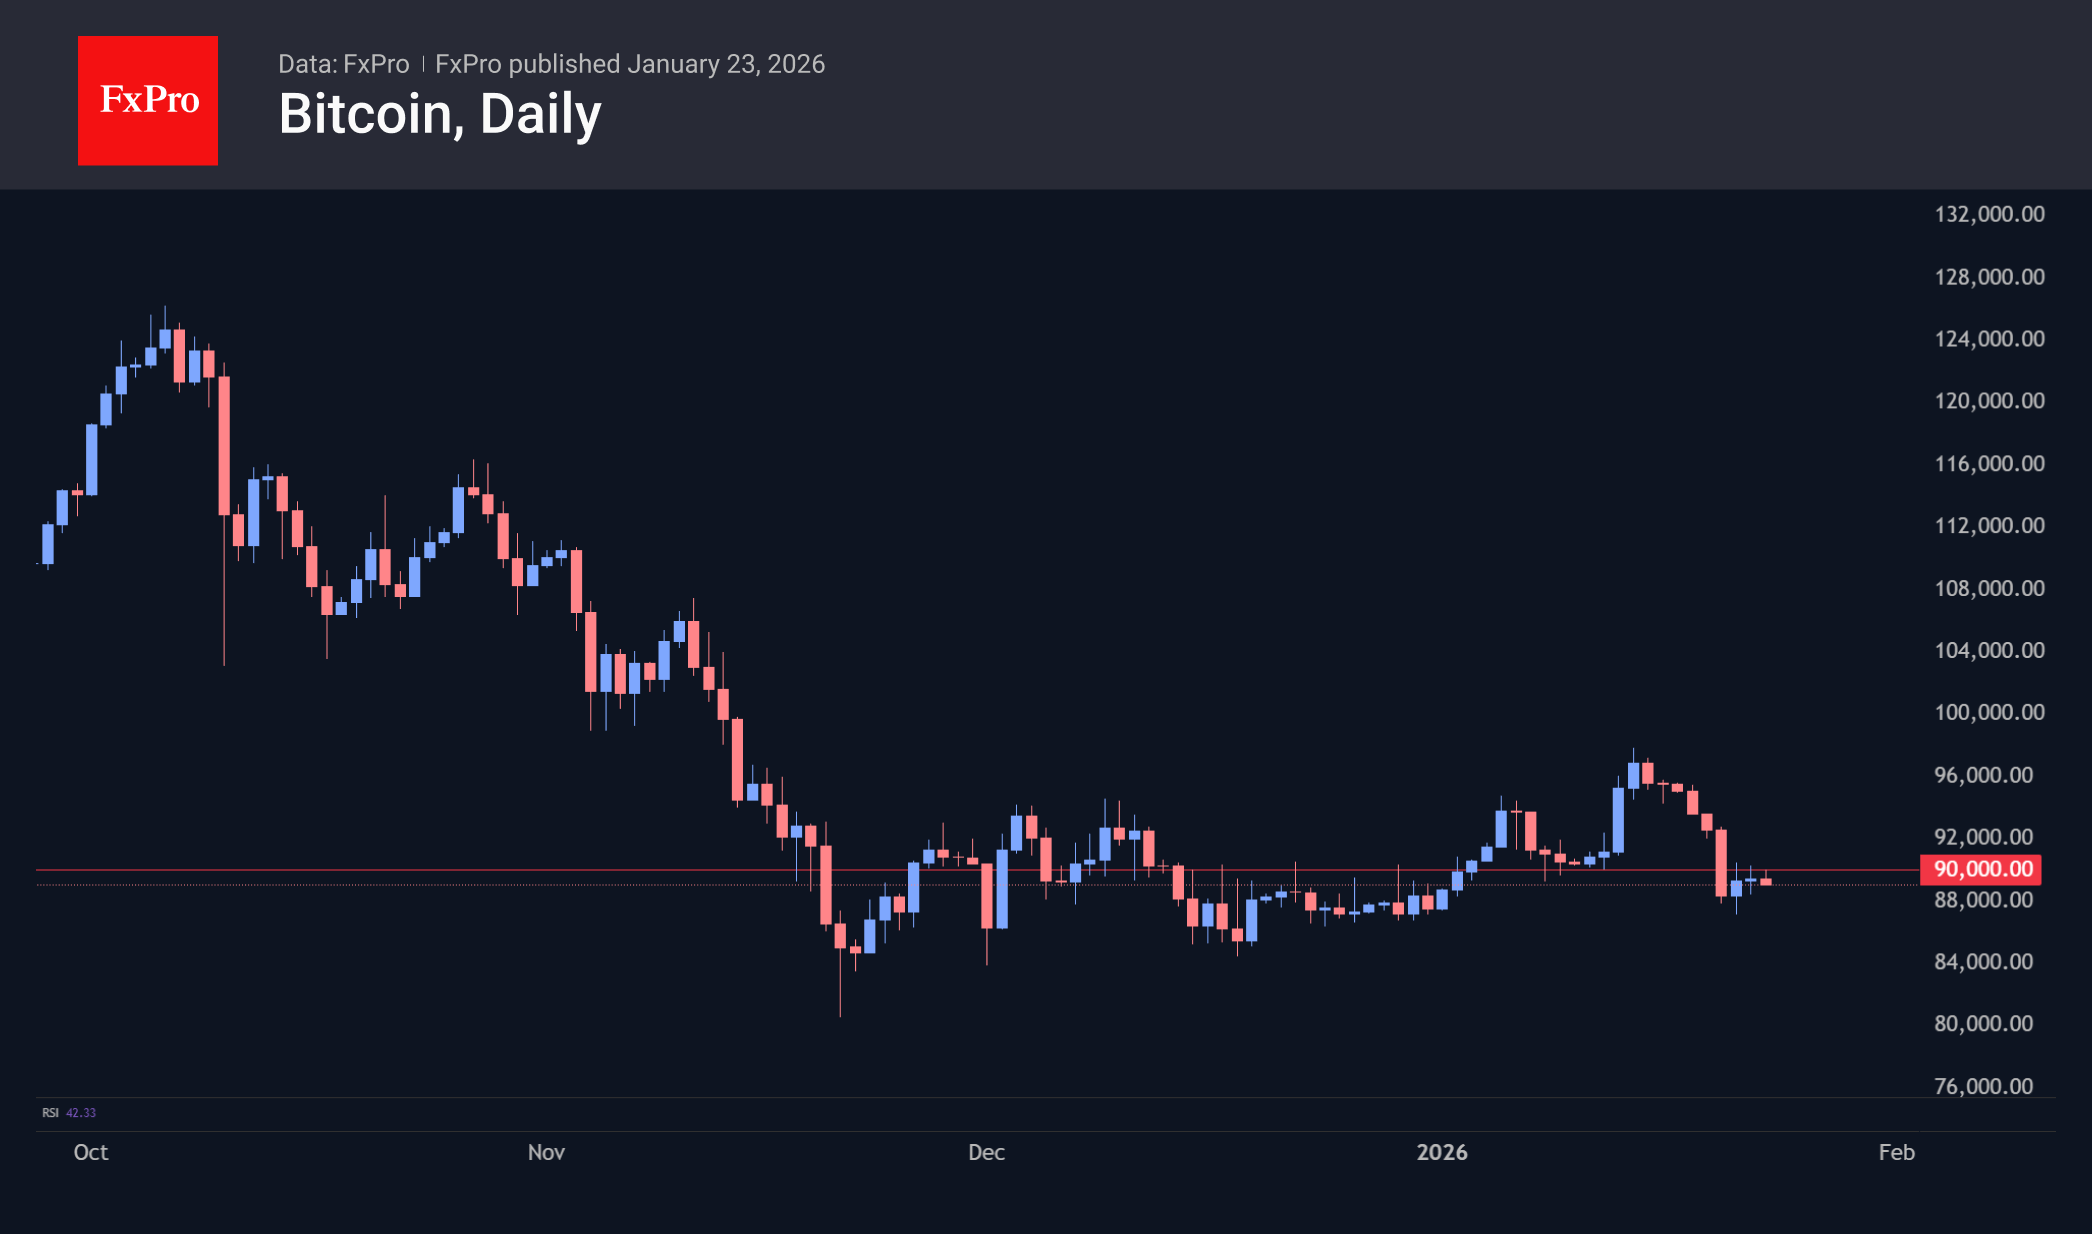
The total capitalisation of the crypto market has changed little over the past two days, fluctuating mainly just above the $3T level. The crypto market remains largely on the sidelines of the positive dynamics in stocks and metals. This apathy in the face of good news in recent months goes hand in hand with complete sympathy when adverse events occur. If we assume that a bear market begins not with a 20% decline from its peak, but first in the minds of investors, then this shift seems to have occurred in October.
Bitcoin continues to attempt to break above $90K, a round level that has become a kind of glass ceiling. On the other hand, the general increase in risk appetite in financial markets is providing support during intraday declines. On Friday, the bulls may be motivated by the desire to lock in some of their bearish positions at the end of the week after a 6% decline since Monday.
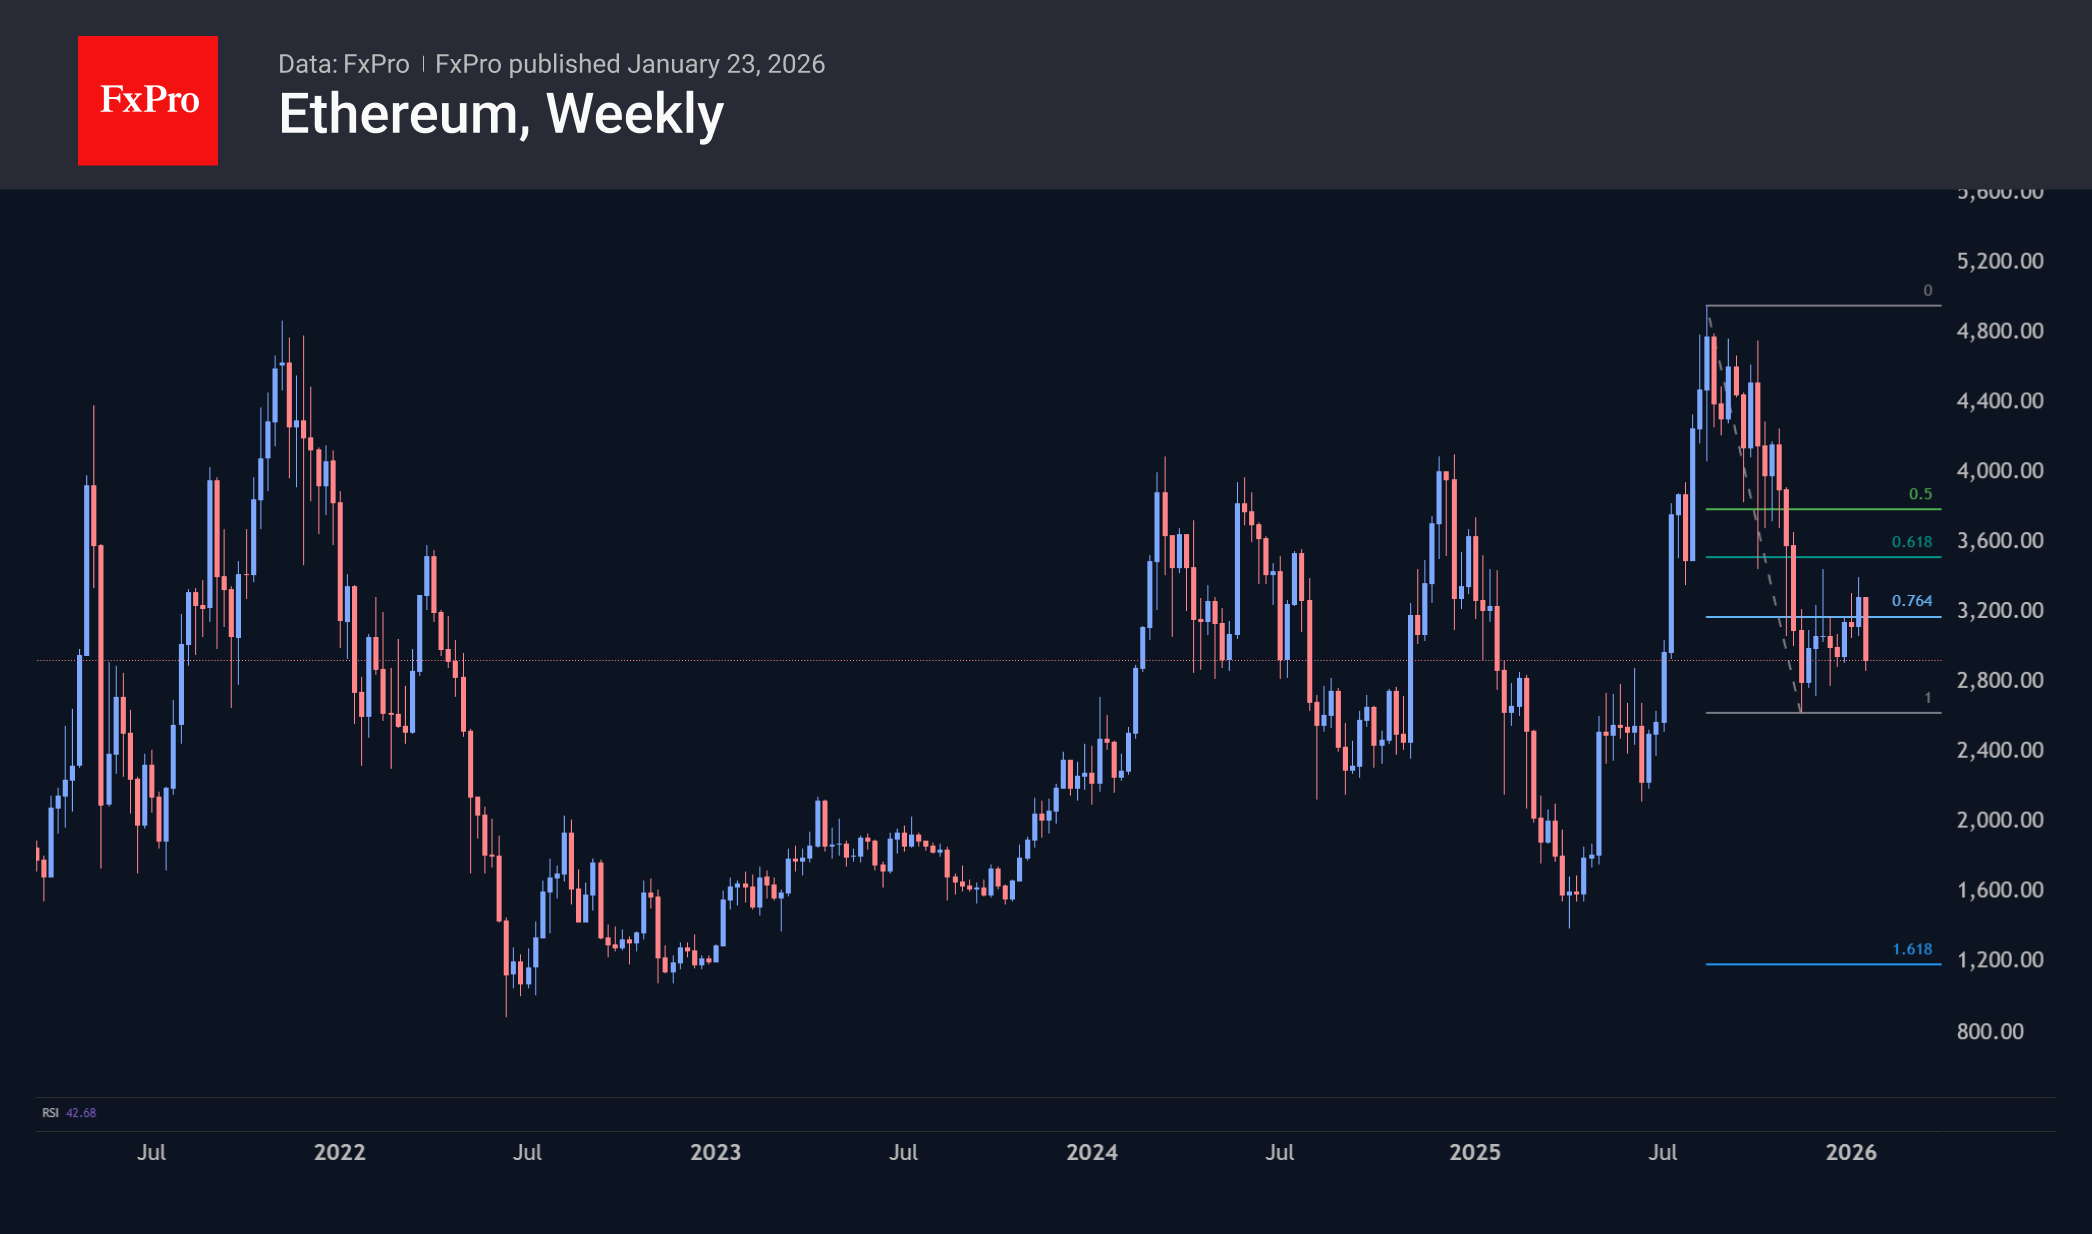
Since the beginning of the week, Ethereum has lost twice as much as Bitcoin – 12% – and is back in the November and December support zone. In May and June last year, there was active resistance from the bears here, which increased the focus on the battle for the current $2700-2900 zone. A victory for the bears at this stage could unlock a shocking scenario of ETHUSD falling to $1000–1100, with a Fibonacci extension of 161.8% from the August peak to the November low.
News Background
Recent buyers are using short-term Bitcoin rallies to exit their positions, limiting upside potential. The main pressure comes from participants who bought coins 3–6 months ago for over $110,000, Glassnode notes. Additional pressure is created by a large cluster of supply above $100,000 formed by long-term holders.
CryptoQuant refers to 2024–2025 as a period of record BTC sales by long-term holders. This indicates a structural rotation of capital from early investors to new participants who are focused on price levels, macroeconomics and global liquidity.
The fourth quarter of last year was probably the end of the bear cycle, Bitwise suggests, comparing the current situation with the first quarter of 2023. At that time, the market was recovering after the collapse of the FTX exchange.
Interest payments on stablecoins do not threaten the banking system, said Circle CEO Jeremy Allaire. He called fears about a possible outflow of deposits from banks ‘absolutely absurd.’
On 22 January, as a result of another recalculation, the difficulty of mining Bitcoin decreased by 3.28% to 141.67 T. This is the second consecutive decline in the indicator after a 1.2% reduction. According to Glassnode, the Bitcoin hash rate, smoothed by a seven-day moving average, is at 1.01 ZH/s.
USD/JPY Continues Its Uptrend as Yen Weakens Further
USD/JPY rose to 158.61 on Friday, continuing its upward movement as the yen remains under pressure. Investors are adopting a wait-and-see approach ahead of the Bank of Japan’s (BOJ) monetary policy decision.
The BOJ recently kept rates unchanged after a hike to 0.75% in December – ** the highest level in nearly 30 years. Market participants are now focusing on comments from BOJ Governor Kazuo Ueda for clues on the timing of the next rate hike, especially amid the yen’s persistent weakness.
Recent data showed a slowdown in core inflation in December, but it remains above the BOJ’s 2% target. Additionally, fiscal risks have added pressure on the yen, as Prime Minister Sanae Takaichi prepares to dissolve parliament and call early elections, a move aimed at consolidating power and promoting fiscal expansion.
As USD/JPY approaches the psychologically significant 160 level, market expectations of possible currency intervention are growing, leading to increased caution among traders.
Technical Analysis
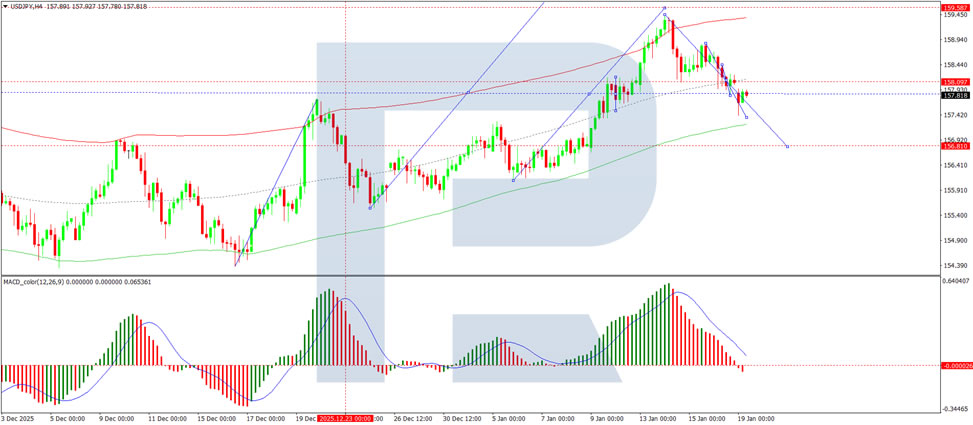
On the H4 chart, USD/JPY has formed a consolidation range around 158.50. The breakout to the upside has opened the potential for a rise to 160.00. After reaching this level, a potential decline to 158.00 may occur. The MACD indicator supports this bullish scenario, with its signal line above zero and pointing upward.
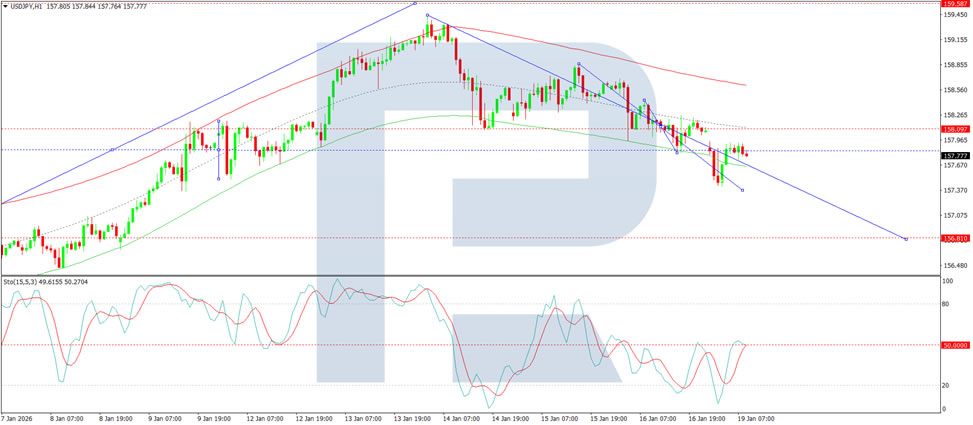
On the H1 chart, a growth wave structure is forming towards 159.30, with a possible correction to 158.70 before continuing the ascent to 160.00. This scenario is confirmed by the Stochastic oscillator, whose signal line is above 50 and pointing towards 80.
Conclusion
USD/JPY continues to rise, driven by the yen’s weakness and market expectations of further BOJ rate hikes. As the pair approaches the 160 level, the potential for currency intervention increases, keeping market participants cautious. Technically, the upward trend remains intact, with key levels to watch at 160.00 and 158.00.