Sample Category Title
GBP/JPY Daily Outlook
Daily Pivots: (S1) 155.71; (P) 156.71; (R1) 157.55; More...
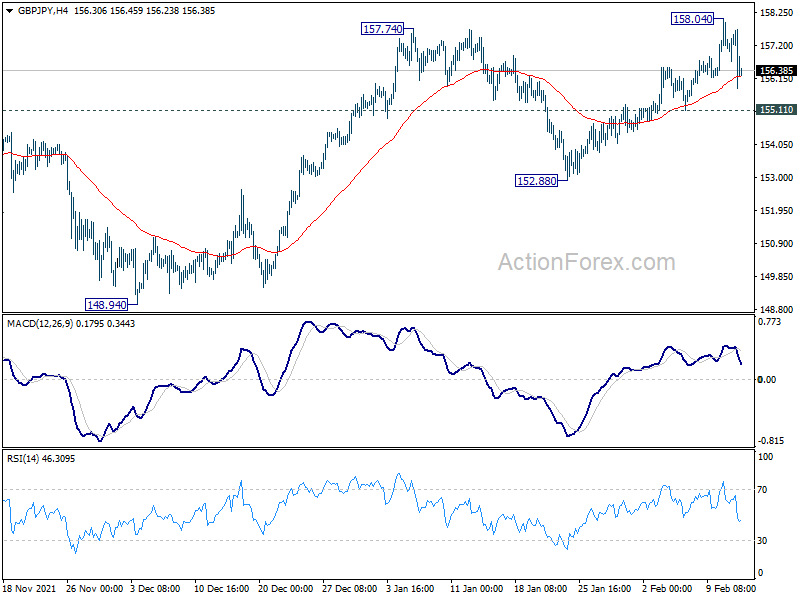
Intraday bias in GBP/JPY remains neutral for the moment. On the downside, break of 155.11 resistance should confirm rejection by 158.19 resistance. Intraday bias will be turned to the downside for 152.88 support, to extend the corrective pattern from 158.19 with another falling leg. However, on the upside, sustained break of 158.19 will resume larger up trend.
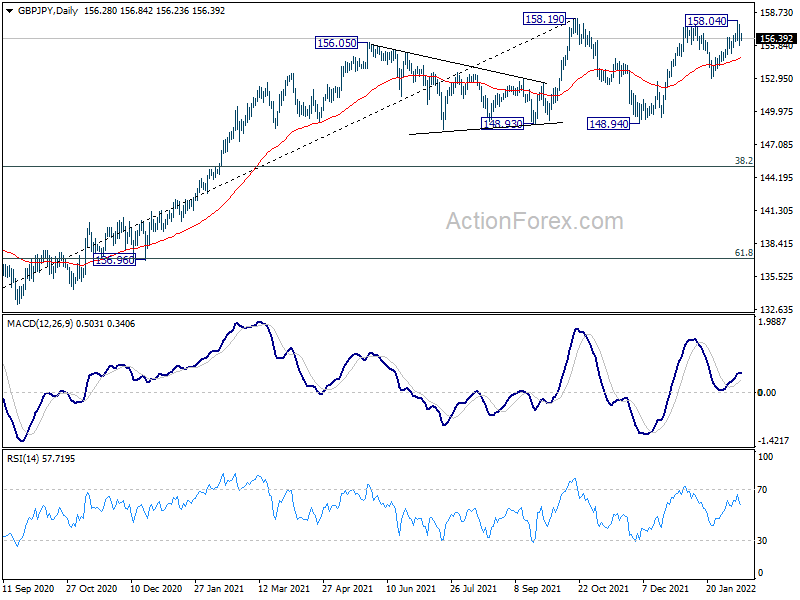
In the bigger picture, price actions from 158.19 are seen as developing into a consolidation pattern to up trend from 123.94 (2020 low). Downside should be contained by 123.94 to 158.19 at 145.10 to bring rebound. Firm break of 158.19 will resume the up trend to long term fibonacci level at 167.93. However, sustained break of 145.10 will raise the chance of trend reversal and target 61.8% retracement at 137.02.
Asian Markets Open on Risk Aversion, Russia-Ukraine Situation Still in Focus
Asian markets open with heavy selling today as worries remain that Russia could invade Ukraine "any day now". New Zealand Dollar is leading Aussie lower on risk aversion. But Canadian Dollar is the stronger one with WTI crude oil staying comfortably at around 94.5. Dollar, and Euro are also slightly stronger. FOMC minutes and comments from Fed officials on the idea of a 50bps March hike would be closely watched. But this should be overwhelmed by news on Russia-Ukraine situations.
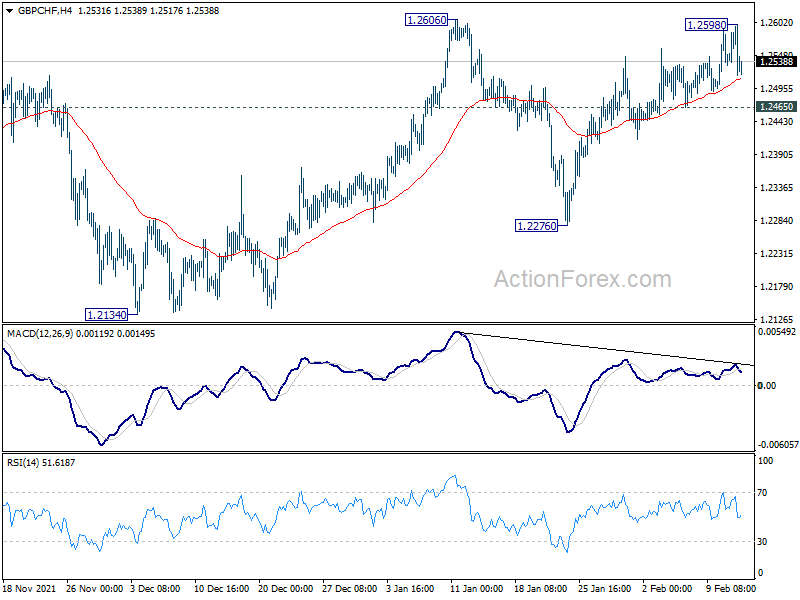
Technically, attention will be on some Swiss Franc pairs to gauge the sentiments in Europe. Break of 1.0439 minor support in EUR/CHF will suggest that rebound form 1.0298 has completed at 1.0610 already and bring deeper fall to retest this low. that would reaffirm medium term bearishness for downtrend resumption later. Also, break of 1.2465 minor support will argue that rebound from 1.2276 has completed at 1.2598, after rejection by 1.2606. Deeper decline would be seen back to 1.2276 support, with prospect of retesting 1.2134 low.
In Asia, at the time of writing, Nikkei is down -2.18%. Hong Kong HSI is down -1.25%. China Shanghai SSE is down -0.63%. Singapore Strait Times is up 0.01%. Japan 10-year JGB yield is down -0.0055 at 0.224.
Fed Daly prefers measured approach after March hike
San Francisco Fed President Mary Daly told CBS on Sunday, "it is obvious that we need to pull some of the accommodation out of the economy". However, "history tells us with Fed policy that abrupt and aggressive action can actually have a destabilizing effect on the very growth and price stability that we're trying to achieve," she warned.
"What I would favor is moving in March and then watching, measuring, being very careful about what we see ahead of us — and then taking the next interest rate increase when it seems the best place to do that. And that could be in the next meeting or it could be a meeting away," Daly said.
ECB Rehn: Better to look beyond short-term inflation
ECB Governing Council member Olli Rehn said on Saturday, "If we reacted strongly to inflation in the short term, we would probably cause economic growth to stop. It's better to look beyond short-term inflation and look at what inflation is in 2023, 2024." He expected inflation to be close to the 2% target in the coming years.
"We will have time to react in the March meeting and in later meetings if it looks like the situation is markedly different than it now appears," Rehn added.
Another Governing Council member Ignazio Visco said, "the monetary policy stance remains expansionary, though the gradual normalization will continue at a pace consistent with the economic recovery and changes in the outlook for prices."
"I do not believe that the overall picture underlying this stance has changed significantly," Visco said. Still, "in the short term, there has been an increase in the risk of consumer prices growing faster than expected and production activity growing more slowly."
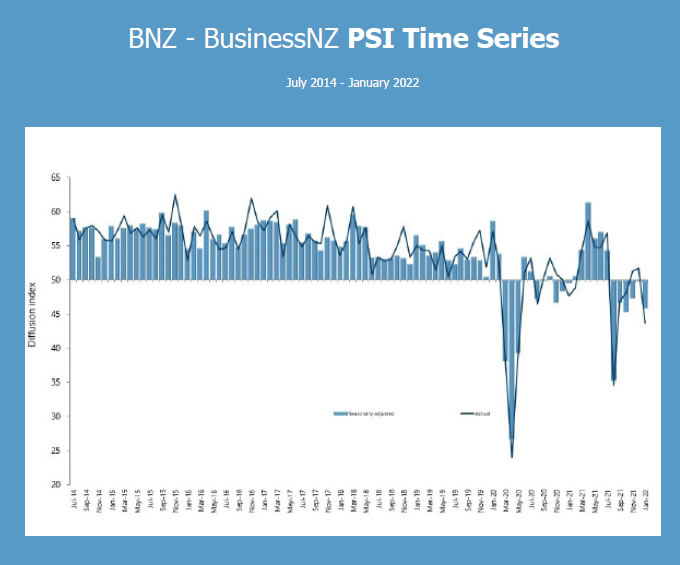
New Zealand BNZ services dropped to 45.9, lowest since Oct
New Zealand BusinssNZ Performance of Services index dropped -3.9 to 45.9 in January. That was the lowest result since October 2021. Looking at some details, activity/sales dropped sharply from 50.7 to 44.1. Employment ticked down from 49.1 to 48.1. New orders/businesses dropped deeply from 52.0 to 41.8. Stocks/inventories dropped from 51.0 to 47.6. Supplier deliveries also tumbled from 49.8 to 43.6.
BNZ Senior Economist Craig Ebert said that "the PSI can jag around quite a lot from month to month – upwards and downwards. However, it's also worth pointing out that the long-term average of the PSI is 53.6, which is starting to feel some distance away. So much for the new traffic light system releasing the brakes on activity."
A week with FOMC minutes and inflation data from UK, Canada and Japan
FOMC minutes are a major focus of the week. Currently, markets are heading towards fully pricing in a 50bps rate hike in March. The minutes might reveal any discussion for a more aggressive tightening cycle. Of course, comments from Fed officials on this topic will be closely watched too. US PPI and retail sales will also catch some attention.
A wave of data will be release from the UK, including employment CPI and PPI, retail sales. CPI data will be the focus. Eurozone GDP and Germany ZEW economic sentiment; Canada CPI and retail sales; Japan GDP and CPI; RBA minutes and Australia employment and New Zealand PPI will also be watched.
Here are some highlights for the week:
- Monday: Swiss PPI.
- Tuesday: Japan GDP, industrial production final; RBA minutes; UK employment; Germany ZEW economic sentiment; Eurozone GDP, employment change, trade balance; US PPI, Empire state manufacturing; Canada housing starts.
- Wednesday: China CPI, PPI; Japan tertiary industry activity index; UK CPI, PPI; Eurozone industrial production; Canada CPI, manufacturing sales, whole sales sales; US retail sales, import prices, industrial production, business inventories, NAHB housing market index, FOMC minutes.
- Thursday: Japan trade balance, machine orders; Australia employment; Swiss trade balance; ECB monthly bulletin; Canada foreign securities purchases; US Philly Fed survey, jobless claims, housing starts and building permits.
- Friday: New Zealand PPI, Japan CPI; UK retail sales; Eurozone current account; Canada retail sales, new housing price index; US existing home sales.
GBP/JPY Daily Outlook
Daily Pivots: (S1) 155.71; (P) 156.71; (R1) 157.55; More...
Intraday bias in GBP/JPY remains neutral for the moment. On the downside, break of 155.11 resistance should confirm rejection by 158.19 resistance. Intraday bias will be turned to the downside for 152.88 support, to extend the corrective pattern from 158.19 with another falling leg. However, on the upside, sustained break of 158.19 will resume larger up trend.
In the bigger picture, price actions from 158.19 are seen as developing into a consolidation pattern to up trend from 123.94 (2020 low). Downside should be contained by 123.94 to 158.19 at 145.10 to bring rebound. Firm break of 158.19 will resume the up trend to long term fibonacci level at 167.93. However, sustained break of 145.10 will raise the chance of trend reversal and target 61.8% retracement at 137.02.
Economic Indicators Update
| GMT | Ccy | Events | Actual | Forecast | Previous | Revised |
|---|---|---|---|---|---|---|
| 07:30 | CHF | Producer and Import Prices M/M Jan | 0.10% | -0.10% | ||
| 07:30 | CHF | Producer and Import Prices Y/Y Jan | 5.60% | 5.10% |
New Zealand BNZ services dropped to 45.9, lowest since Oct
New Zealand BusinssNZ Performance of Services index dropped -3.9 to 45.9 in January. That was the lowest result since October 2021. Looking at some details, activity/sales dropped sharply from 50.7 to 44.1. Employment ticked down from 49.1 to 48.1. New orders/businesses dropped deeply from 52.0 to 41.8. Stocks/inventories dropped from 51.0 to 47.6. Supplier deliveries also tumbled from 49.8 to 43.6.
BNZ Senior Economist Craig Ebert said that "the PSI can jag around quite a lot from month to month – upwards and downwards. However, it's also worth pointing out that the long-term average of the PSI is 53.6, which is starting to feel some distance away. So much for the new traffic light system releasing the brakes on activity."
ECB Rehn: Better to look beyond short-term inflation
ECB Governing Council member Olli Rehn said on Saturday, "If we reacted strongly to inflation in the short term, we would probably cause economic growth to stop. It's better to look beyond short-term inflation and look at what inflation is in 2023, 2024." He expected inflation to be close to the 2% target in the coming years.
"We will have time to react in the March meeting and in later meetings if it looks like the situation is markedly different than it now appears," Rehn added.
Another Governing Council member Ignazio Visco said, "the monetary policy stance remains expansionary, though the gradual normalization will continue at a pace consistent with the economic recovery and changes in the outlook for prices."
"I do not believe that the overall picture underlying this stance has changed significantly," Visco said. Still, "in the short term, there has been an increase in the risk of consumer prices growing faster than expected and production activity growing more slowly."
Fed Daly prefers measured approach after March hike
San Francisco Fed President Mary Daly told CBS on Sunday, "it is obvious that we need to pull some of the accommodation out of the economy". However, "history tells us with Fed policy that abrupt and aggressive action can actually have a destabilizing effect on the very growth and price stability that we're trying to achieve," she warned.
"What I would favor is moving in March and then watching, measuring, being very careful about what we see ahead of us — and then taking the next interest rate increase when it seems the best place to do that. And that could be in the next meeting or it could be a meeting away," Daly said.
Technical Outlook and Review
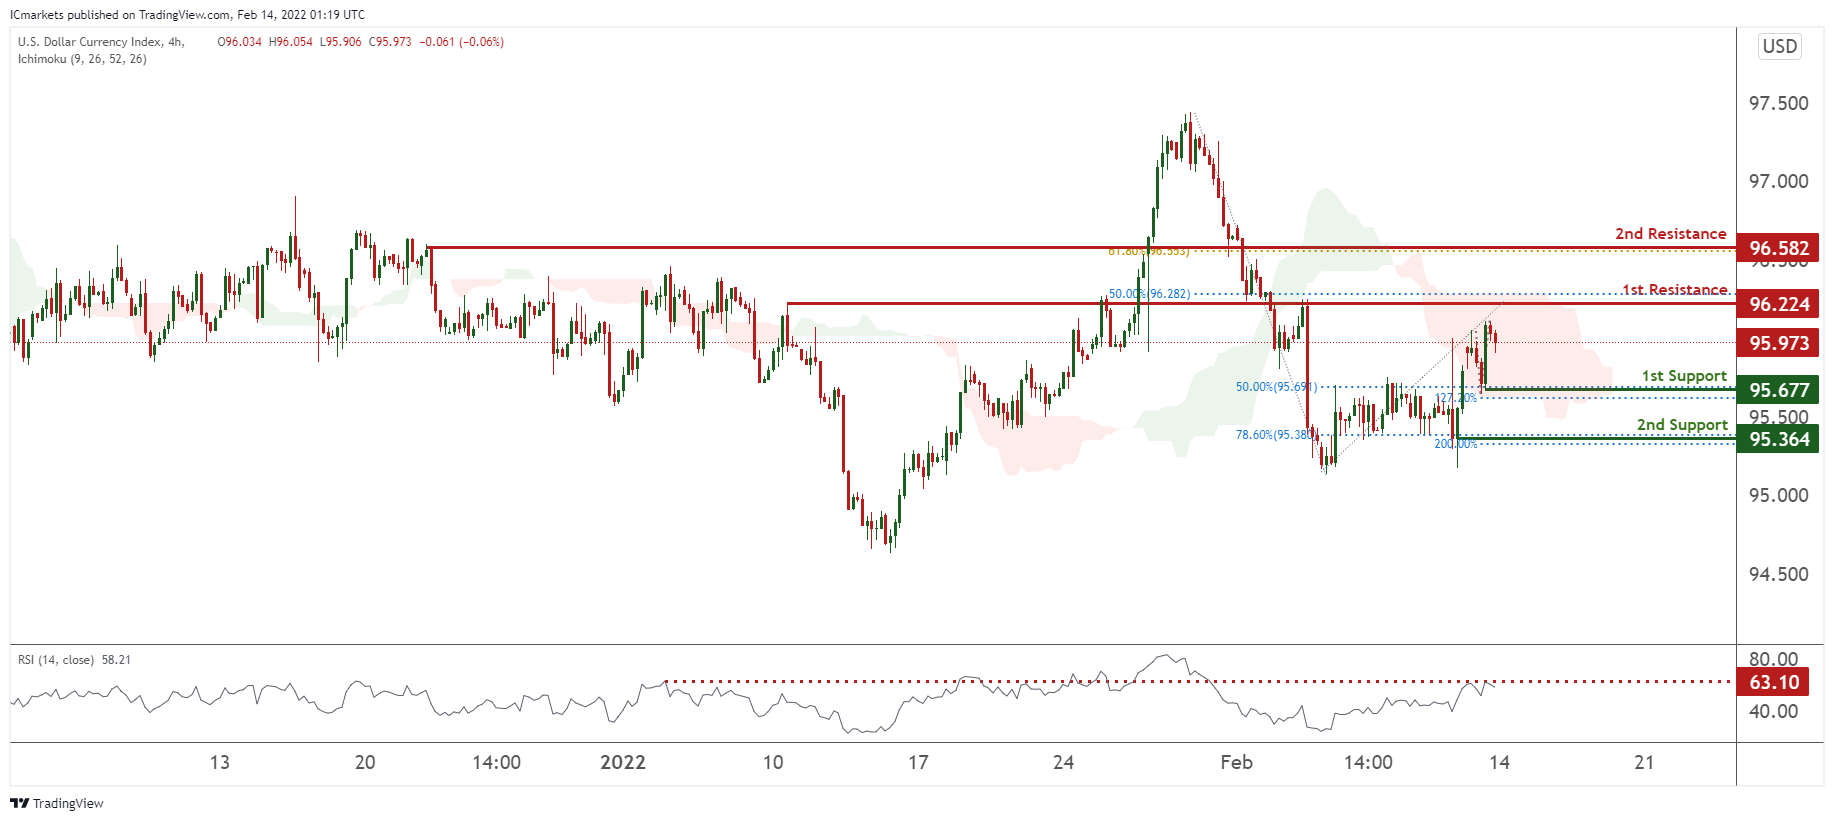
DXY:
On the H4 timeframe, prices are approaching a pivot resistance and are experiencing bearish momentum. We see the potential for a dip from our 1st resistance at 96.224 in line with 50% Fibonacci retracement and graphical overlap towards our 1st support at 95.677 in line with 127.2% Fibonacci Projection and 50% Fibonacci retracement. Our bearish bias is further supported by our RSI being at levels where dips previously occurred and also ichimoku showing bearish momentum.
Areas of consideration:
- H4 time frame, 1st resistance at 96.224
- H4 time frame, 1st support at 95.677
XAU/USD (GOLD):
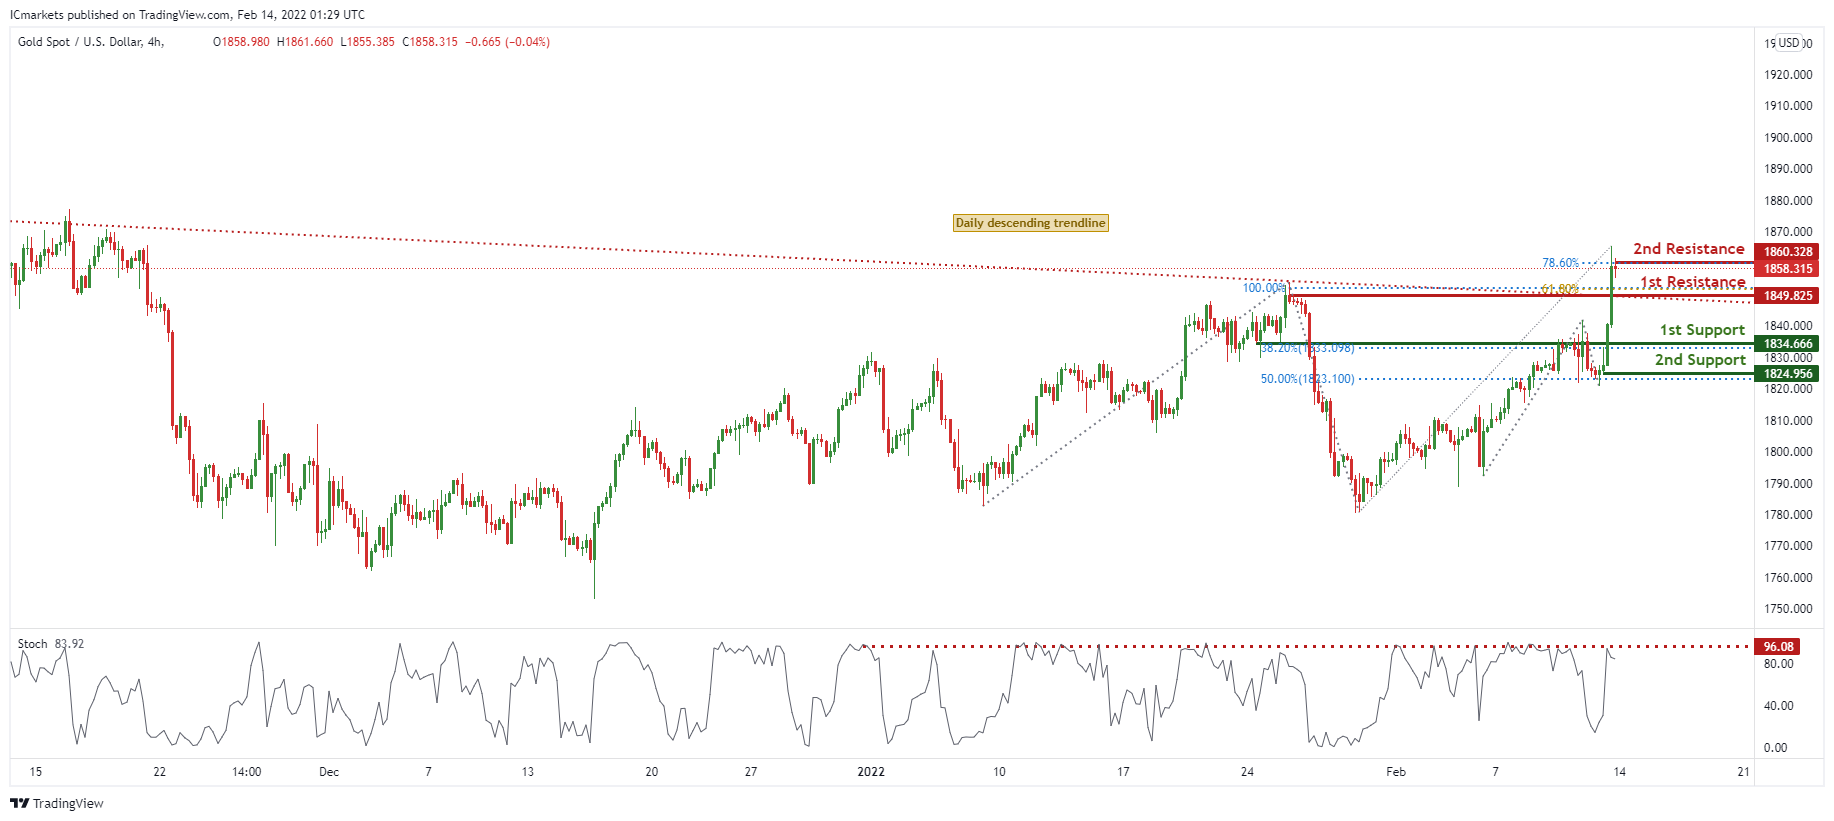
On the H4 chart, prices have recently broken out of our daily descending trendline and might be due for a pullback. We see potential for a pullback from our 1st resistance at 1849.825 in line with 100% Fibonacci extension and 61.8% Fibonacci retracement towards our 1st support at 1834.666 in line with 38.2% Fibonacci retracement. RSI are at levels where dips previously occurred.
Areas of consideration:
- 4h 1st support at 1834.666
- 4h 1st resistance at 1849.825
GBP/USD
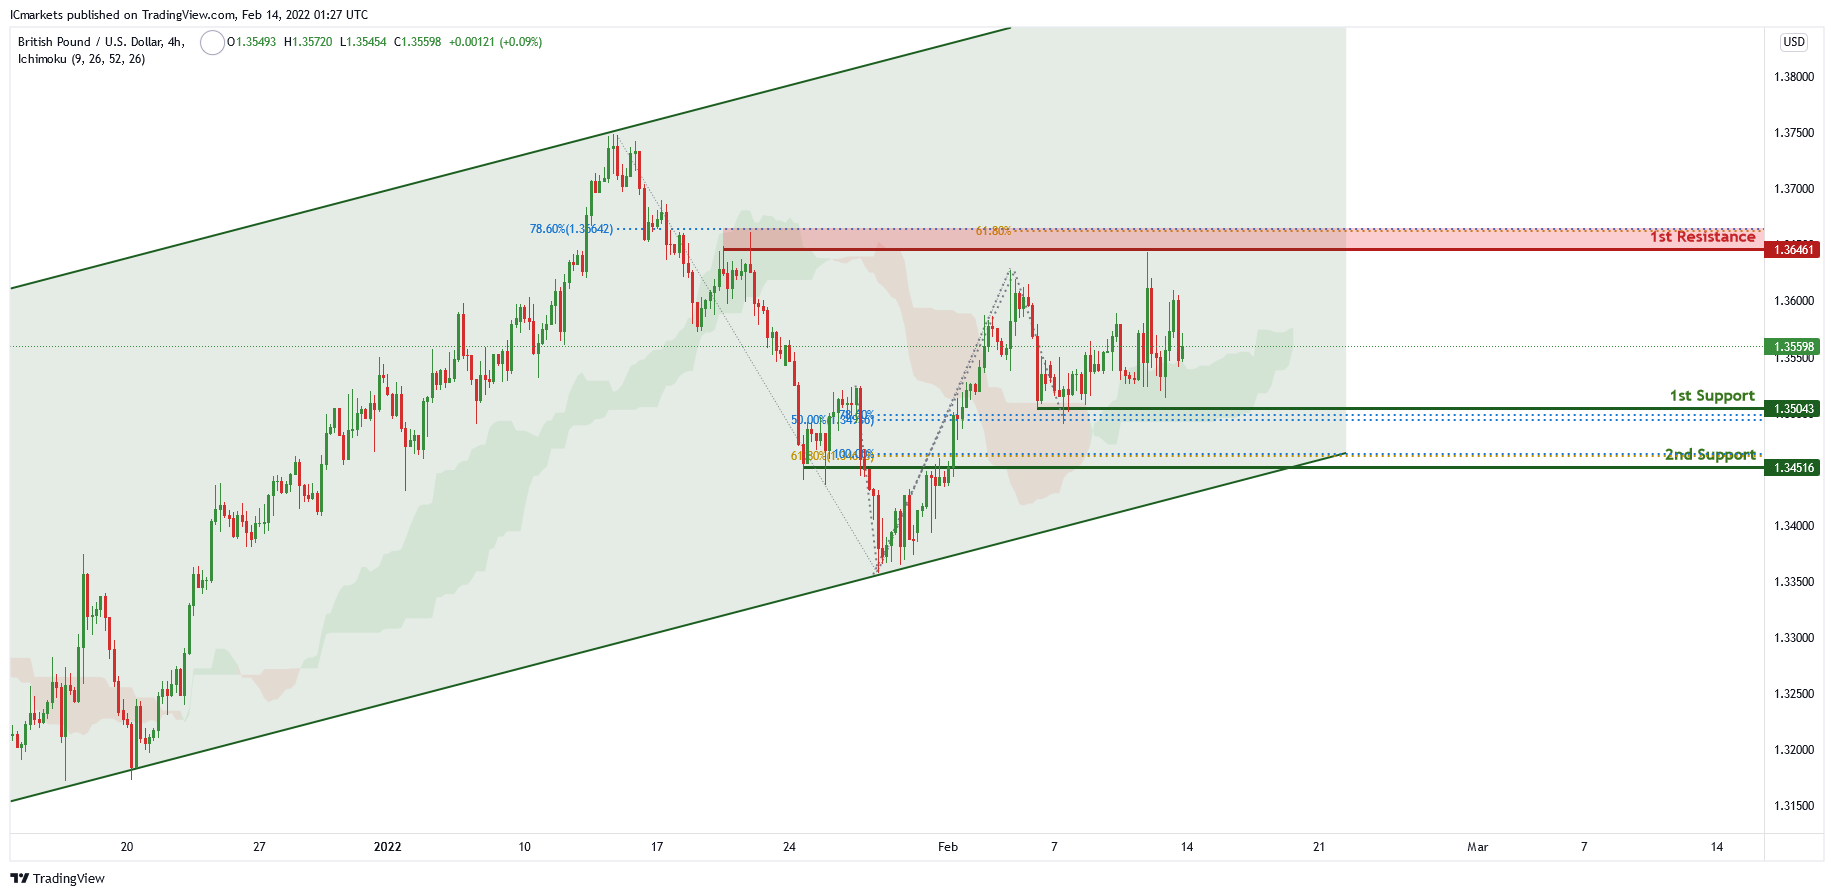
In the H4 chart , price is trading in an ascending channel and near 1st support level of 1.35043 which is also 50% Fibonacci retracement and 78.6% Fibonacci projection. Price can potentially continue its bullish momentum to the 1st resistance level of 1.36461 in line with 61.8% Fibonacci projection and 78.6% Fibonacci retracement. Our bullish bias is supported by the ichimoku cloud indicator as price is trading above it.
Areas of consideration:
- H4 1st resistance 1.36461
- H4 1st support 1.35043
USD/CHF:
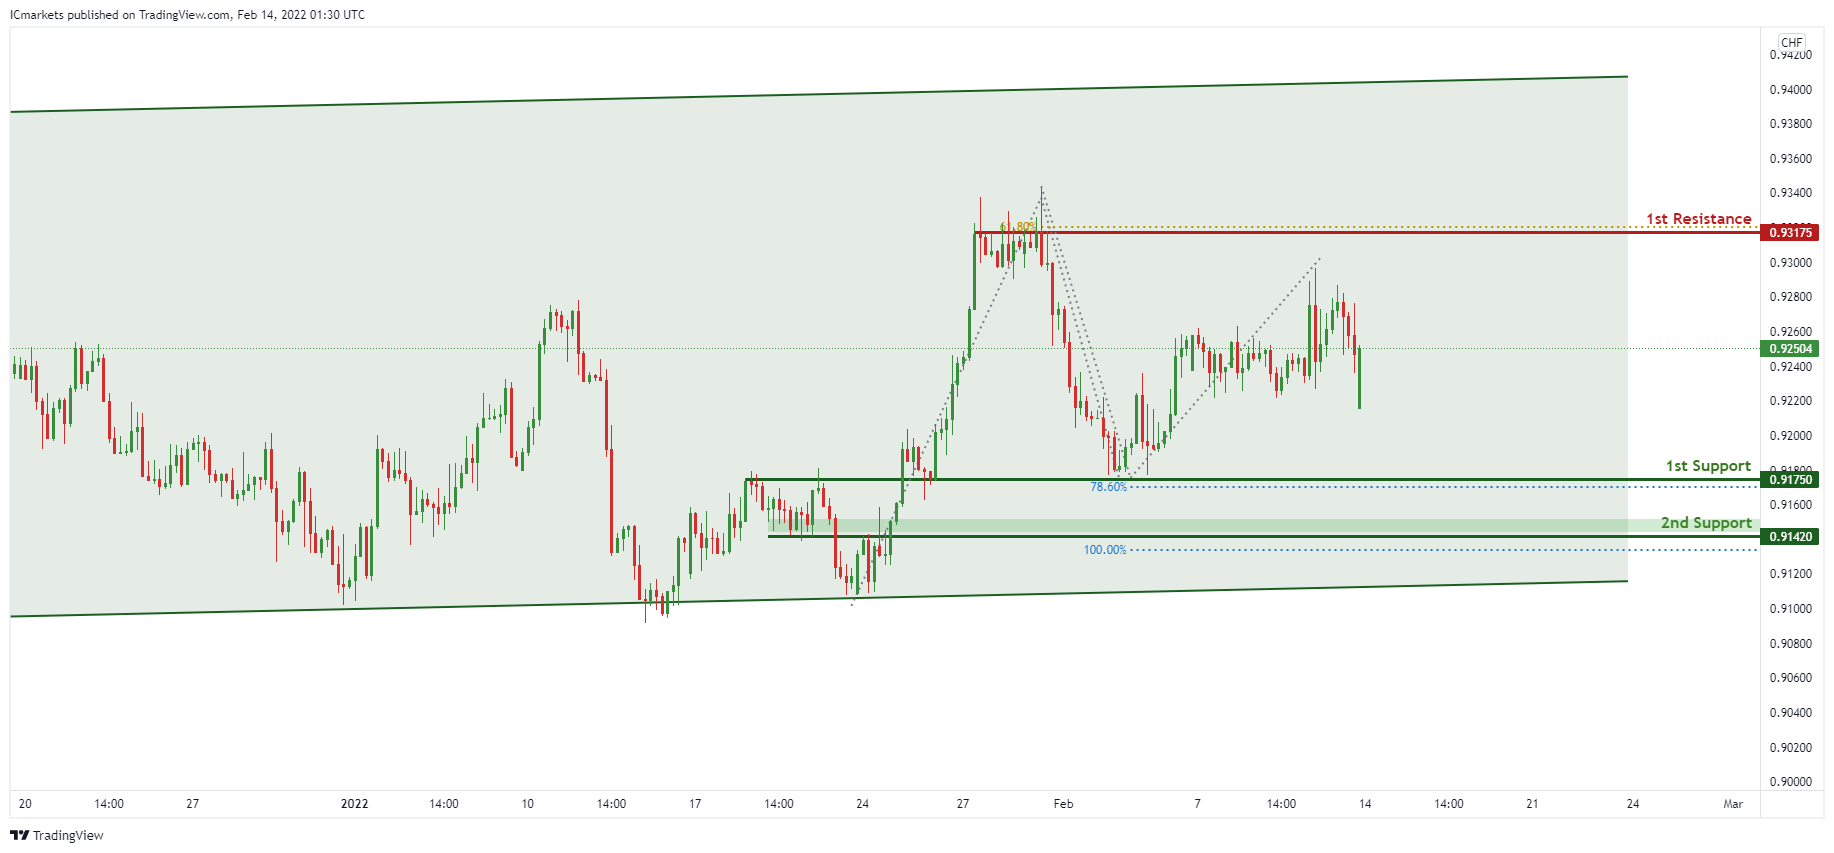
On the H4 timeframe,in reference to last week’s analysis price indeed bounced at the 1st Support level. Price is abiding to the daily ascending channel signifying an overall bullish momentum. We can expect the price to bounce from 1st Support in line with 78.6% Fibonacci projection and 61.8% fibonacci retracement towards 1st Resistance in line with 61.8% Fibonacci projection and previous swing high. Our bullish bias is further supported by the RSI indicator where it is at the support level. Traders should wait for prices to swing higher or lower before entering.
Areas of consideration:
- Watch 1st Support at 0.91750
- Watch 1st Resistance at 0.93175
EUR/USD :
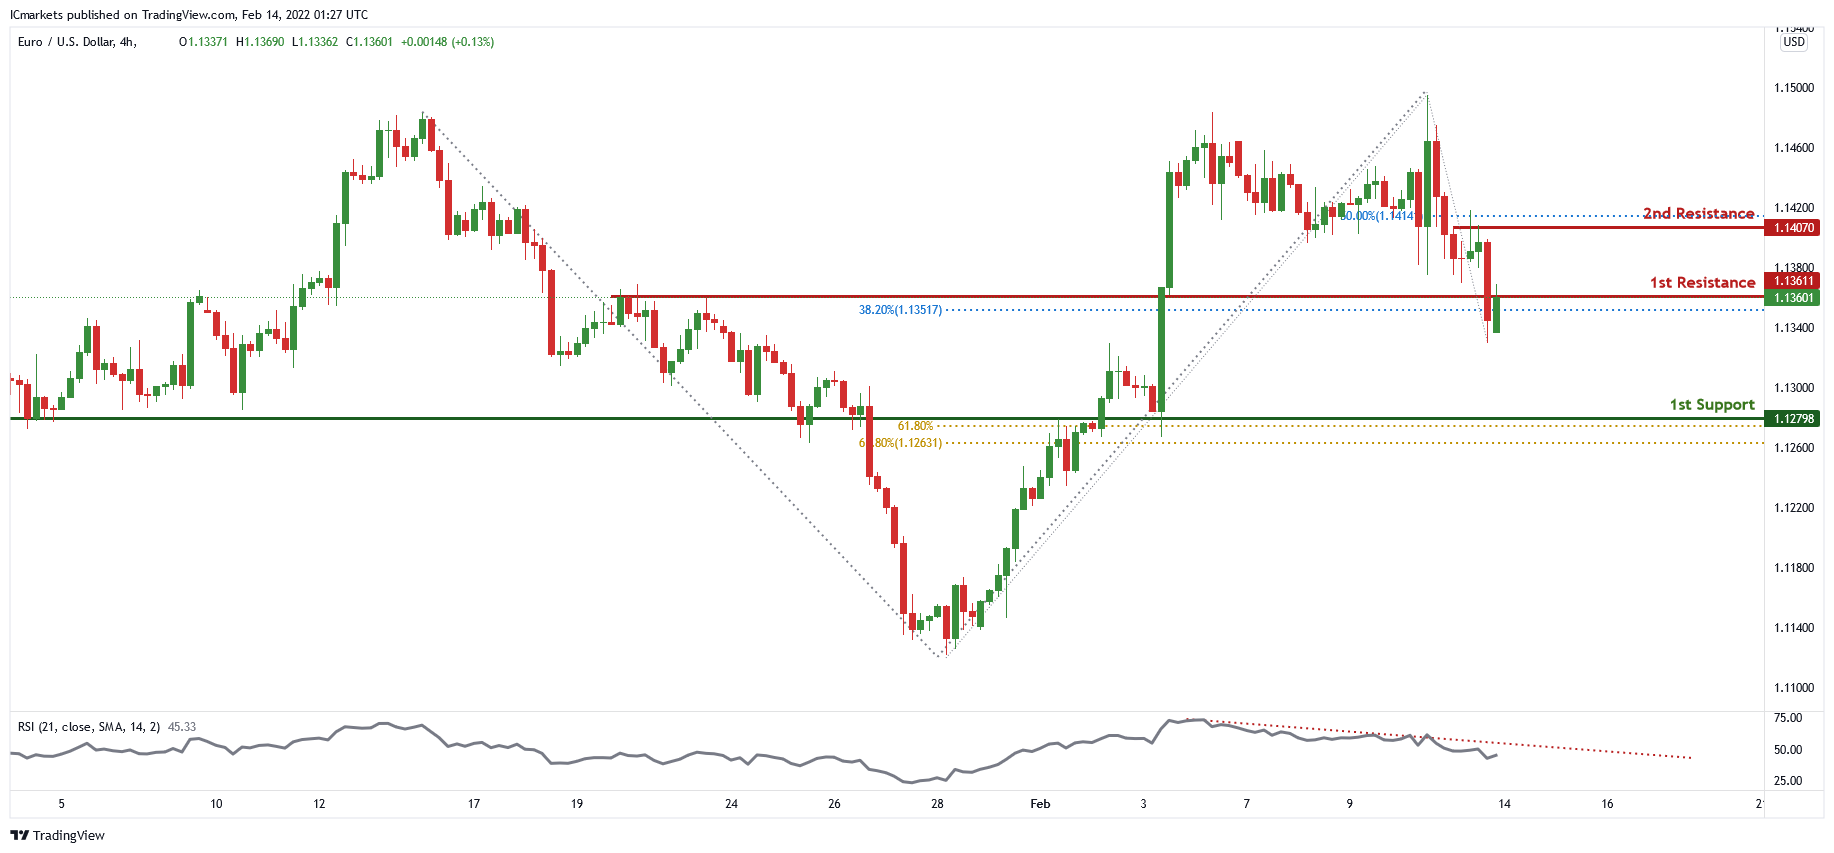
On the H4 price is near the first resistance level of 1.13611 in line with 38.2% Fibonacci retracement. Price can potentially dip to the 1st support level of 1.12789 which is in line with 61.8% Fibonacci retracement and 61.8% Fibonacci projection. Our bearish bias is supported by the RSI indicator as it is abiding by a descending trendline
Areas of consideration:
- H4 1st resistance at 1.13611
- H4 1st support at 1.12789
USD/JPY:
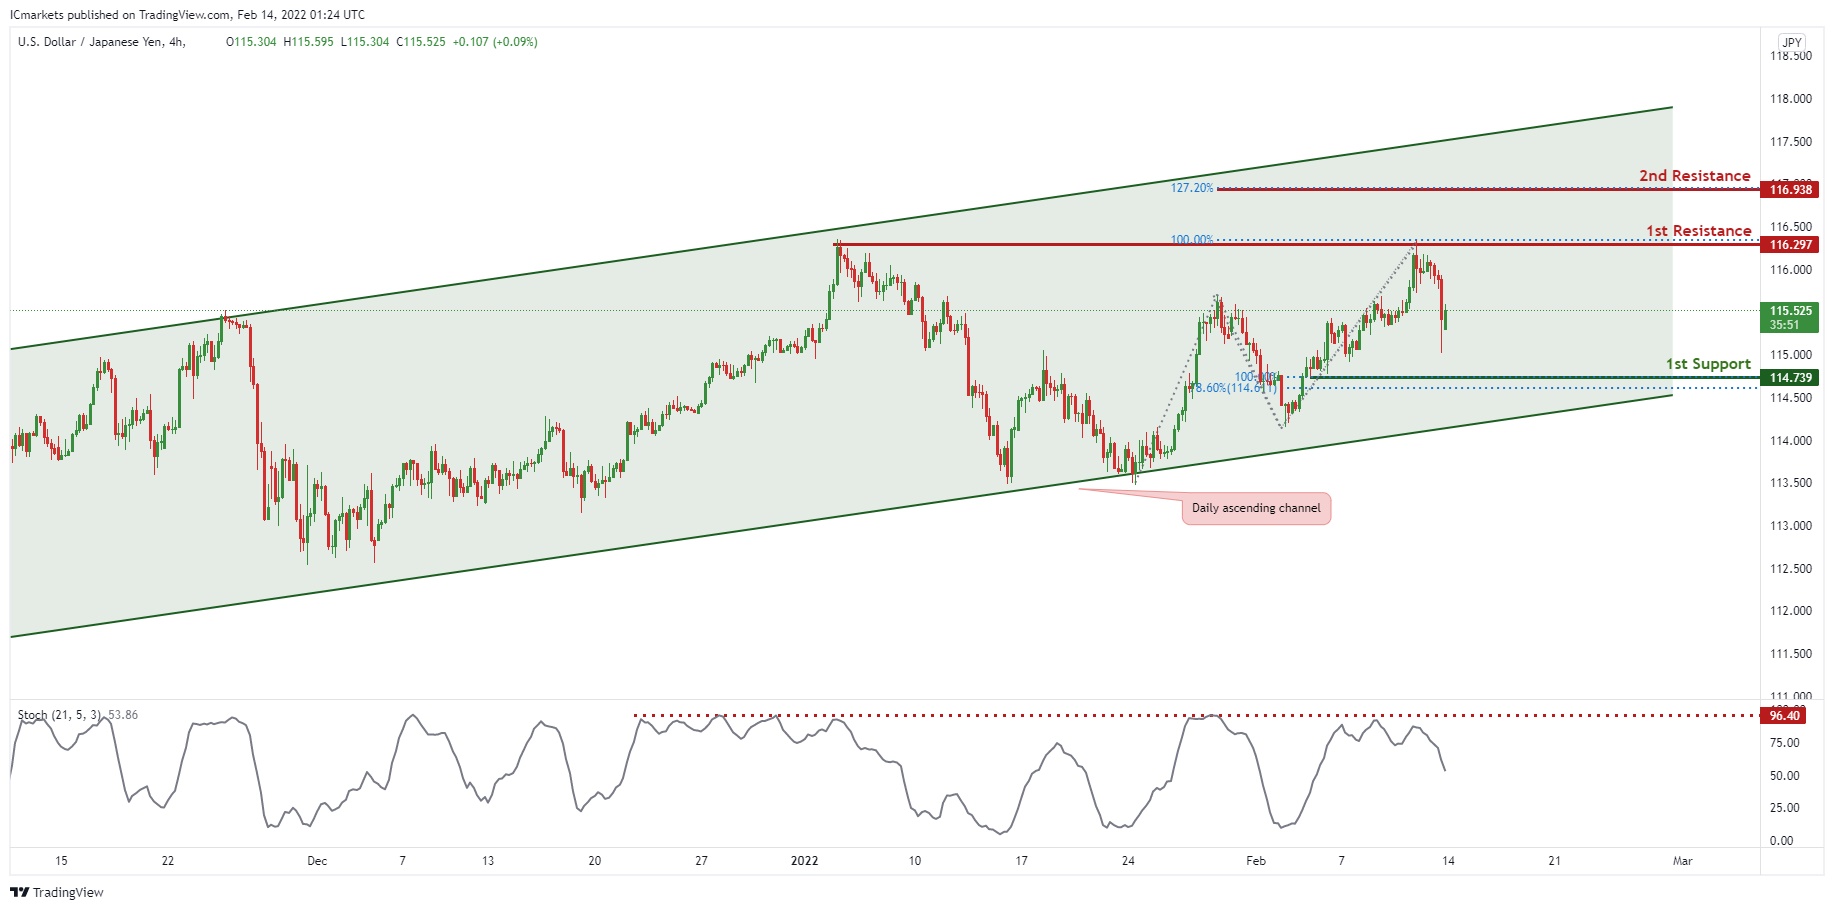
On the H4 chart,in reference to last week’s analysis, price indeed dropped at 1st Resistance and it is reaching our potential 1st Support level @ 114.739.
Price is trading in an ascending channel signifying an overall bullish momentum, however, we can expect a short-term bearish drop from 1st Resistance level in line with horizontal resistance and 100% Fibonacci projection towards 1st Support in line with 100% Fibonacci projection and 78.6% Fibonacci retracement. Our bearish bias is further supported by the stochastic indicator where the %K line is at the resistance level. Traders can wait for prices to swing higher or lower before entering.
Areas of consideration:
- H4 1st support at 114.739
- H4 1st resistance at 116.297
AUD/USD:
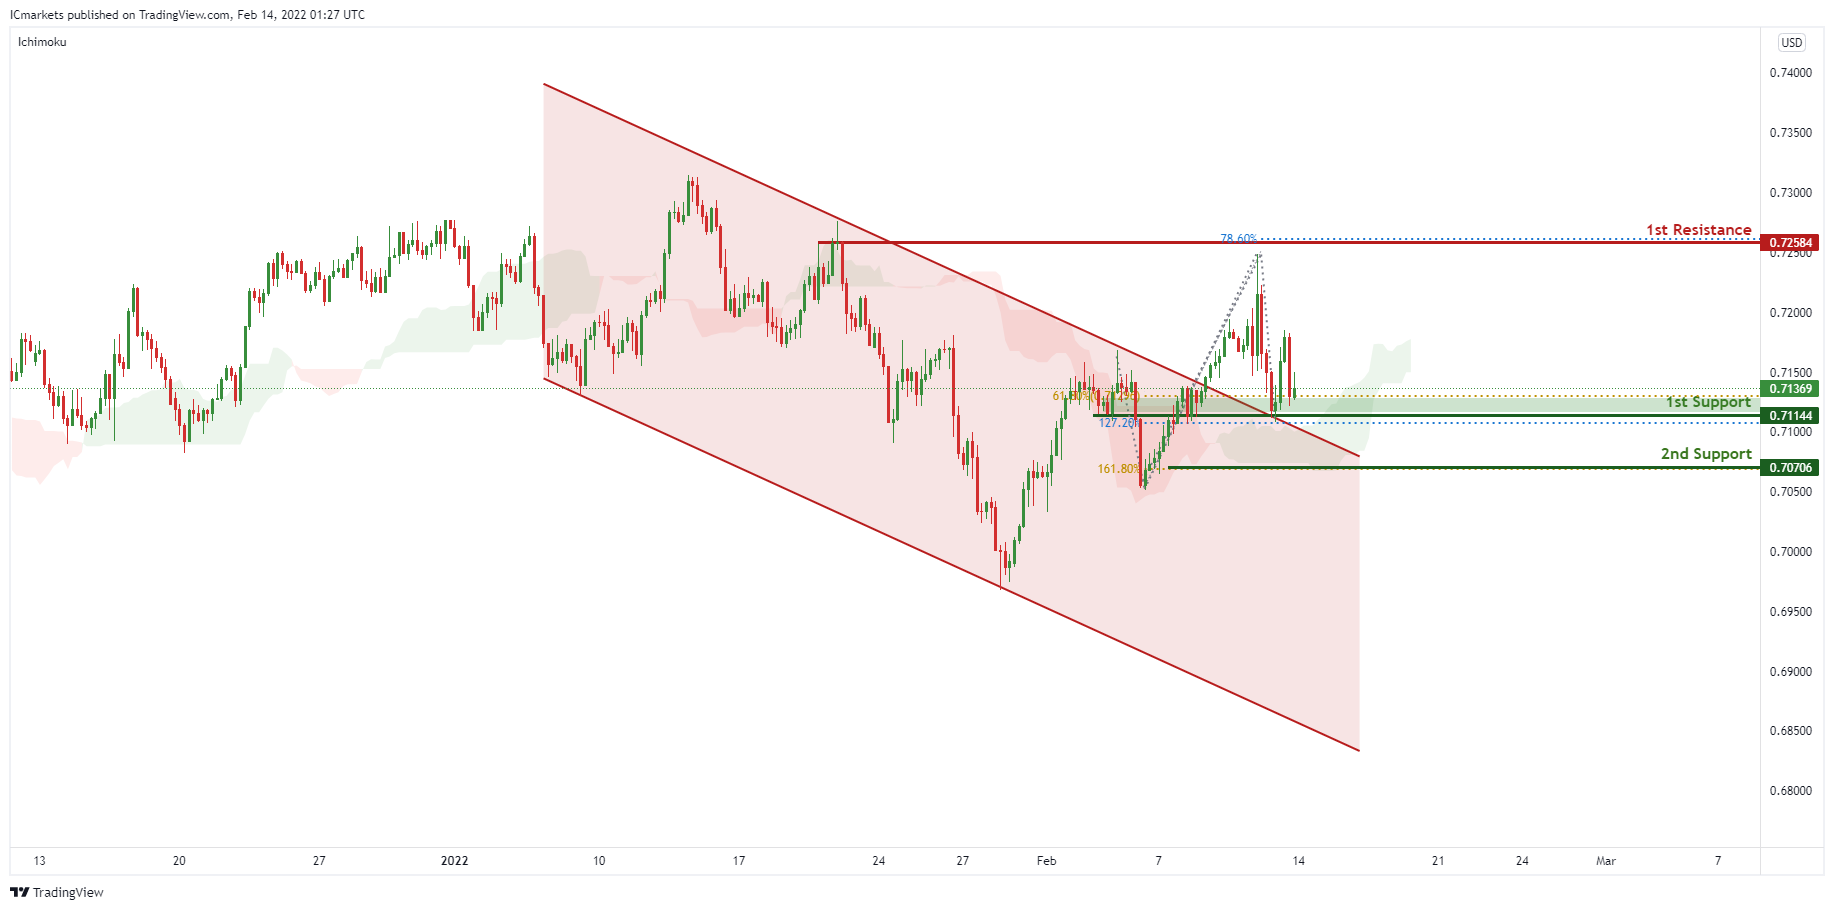
Price broke out of the descending channel, signifying an overall bullish momentum. We can expect price to bounce from 1st Support in line with 61.8% Fibonacci retracement, 127.2% Fibonacci projection and graphical overlap support towards 1st Resistance in line with previous swing high and 78.6% Fibonacci projection. Our bullish bias is further supported by the Ichimoku indicator where the prices are holding above the cloud.
Areas of consideration:
- H4 1st Support level 0.71144
- H4 1st resistance level 0.72584
NZD/USD:
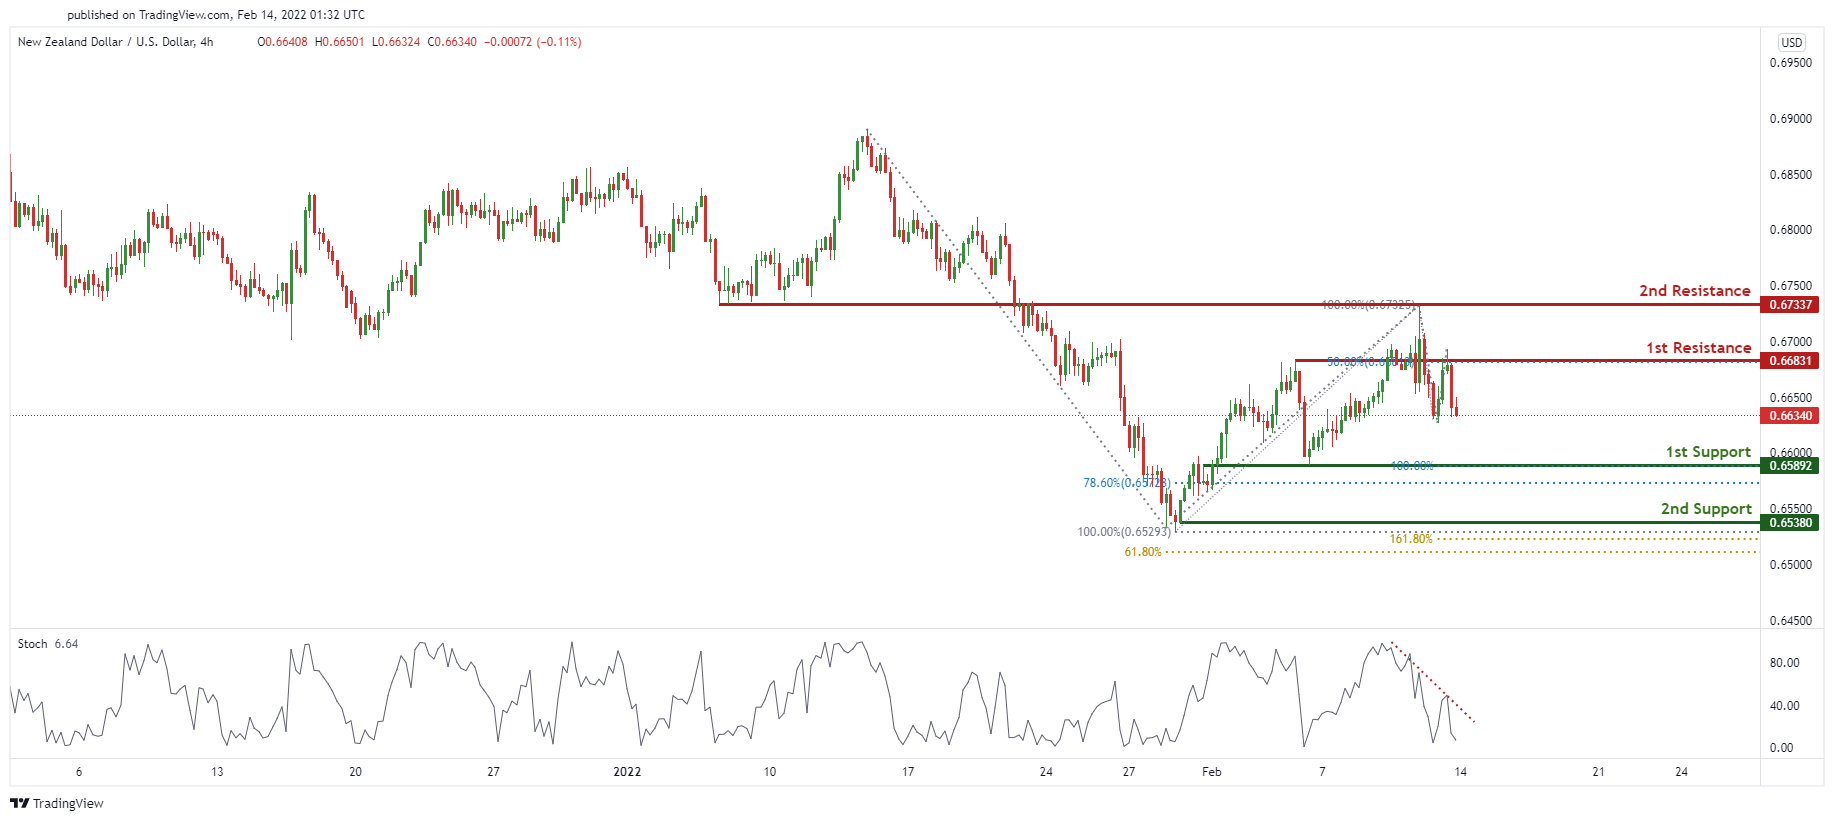
On the H4 timeframe, prices are on bearish momentum. We see potential for bearish continuation from our 1st resistance at 0.66831 in line with 50% Fibonacci retracement towards our 1st support at 0.65892 in line with 100% Fibonacci extension and 78.6% Fibonacci retracement. Our bias is further supported by RSI portraying bearish momentum. Alternatively, our stop loss will be placed at 2nd resistance at 0.67337 in line with 100% Fibonacci retracement.
Areas of consideration:
- H4 time frame, 1st resistance at 0.66831
- H4 time frame, 1st support at 0.65892
USD/CAD:
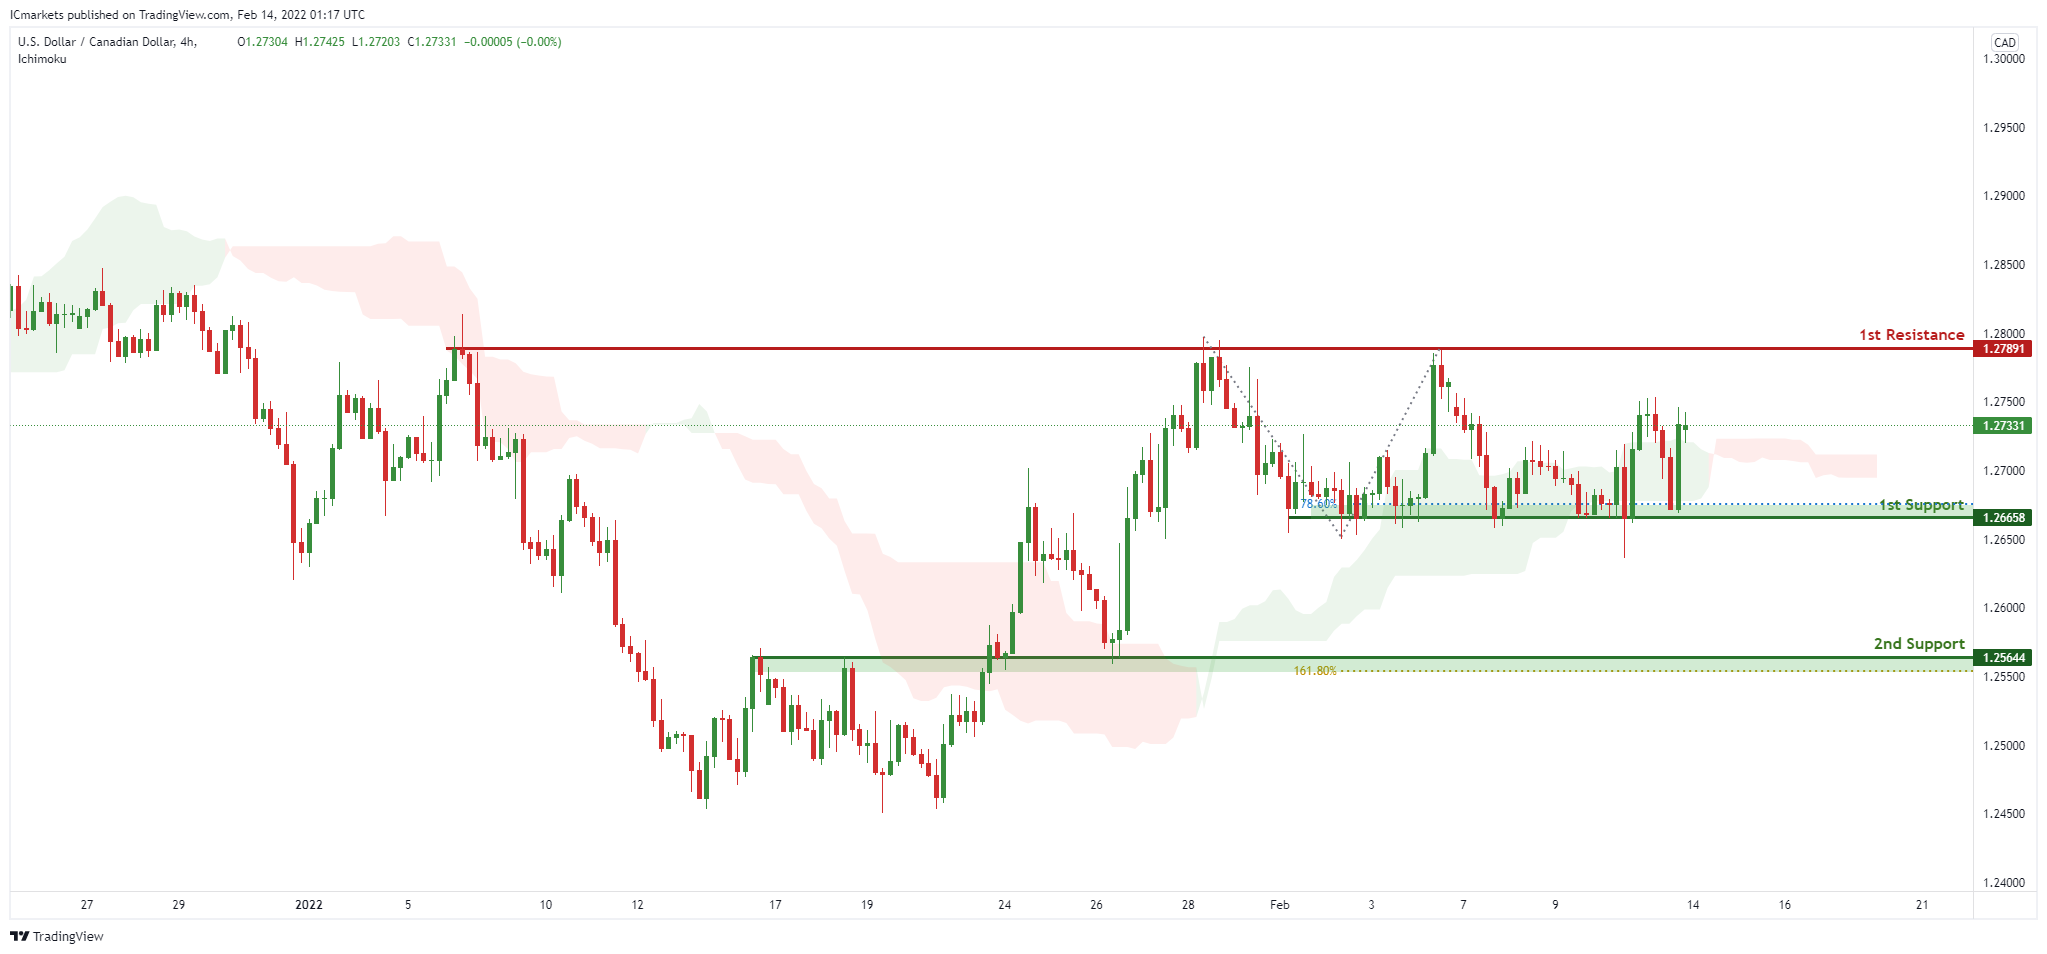
On the H4, with price moving above the ichimoku cloud, signifying an overall bullish momentum. We can expect price to rise to our 1st resistance at 1.27891 in line horizontal graphical swing high resistance from our 1st support in line with horizontal overlap support and 78.6% Fibonacci retracement at 1.26658. Alternatively, price may break 1st support structure and head for 2nd support, which coincides with horizontal swing low support and 161.8% Fibonacci extension at 1.25644.
Areas of consideration:
- H4 time frame, 1st support at 1.26658
- H4 time frame, 1st resistance at 1.27891
OIL:
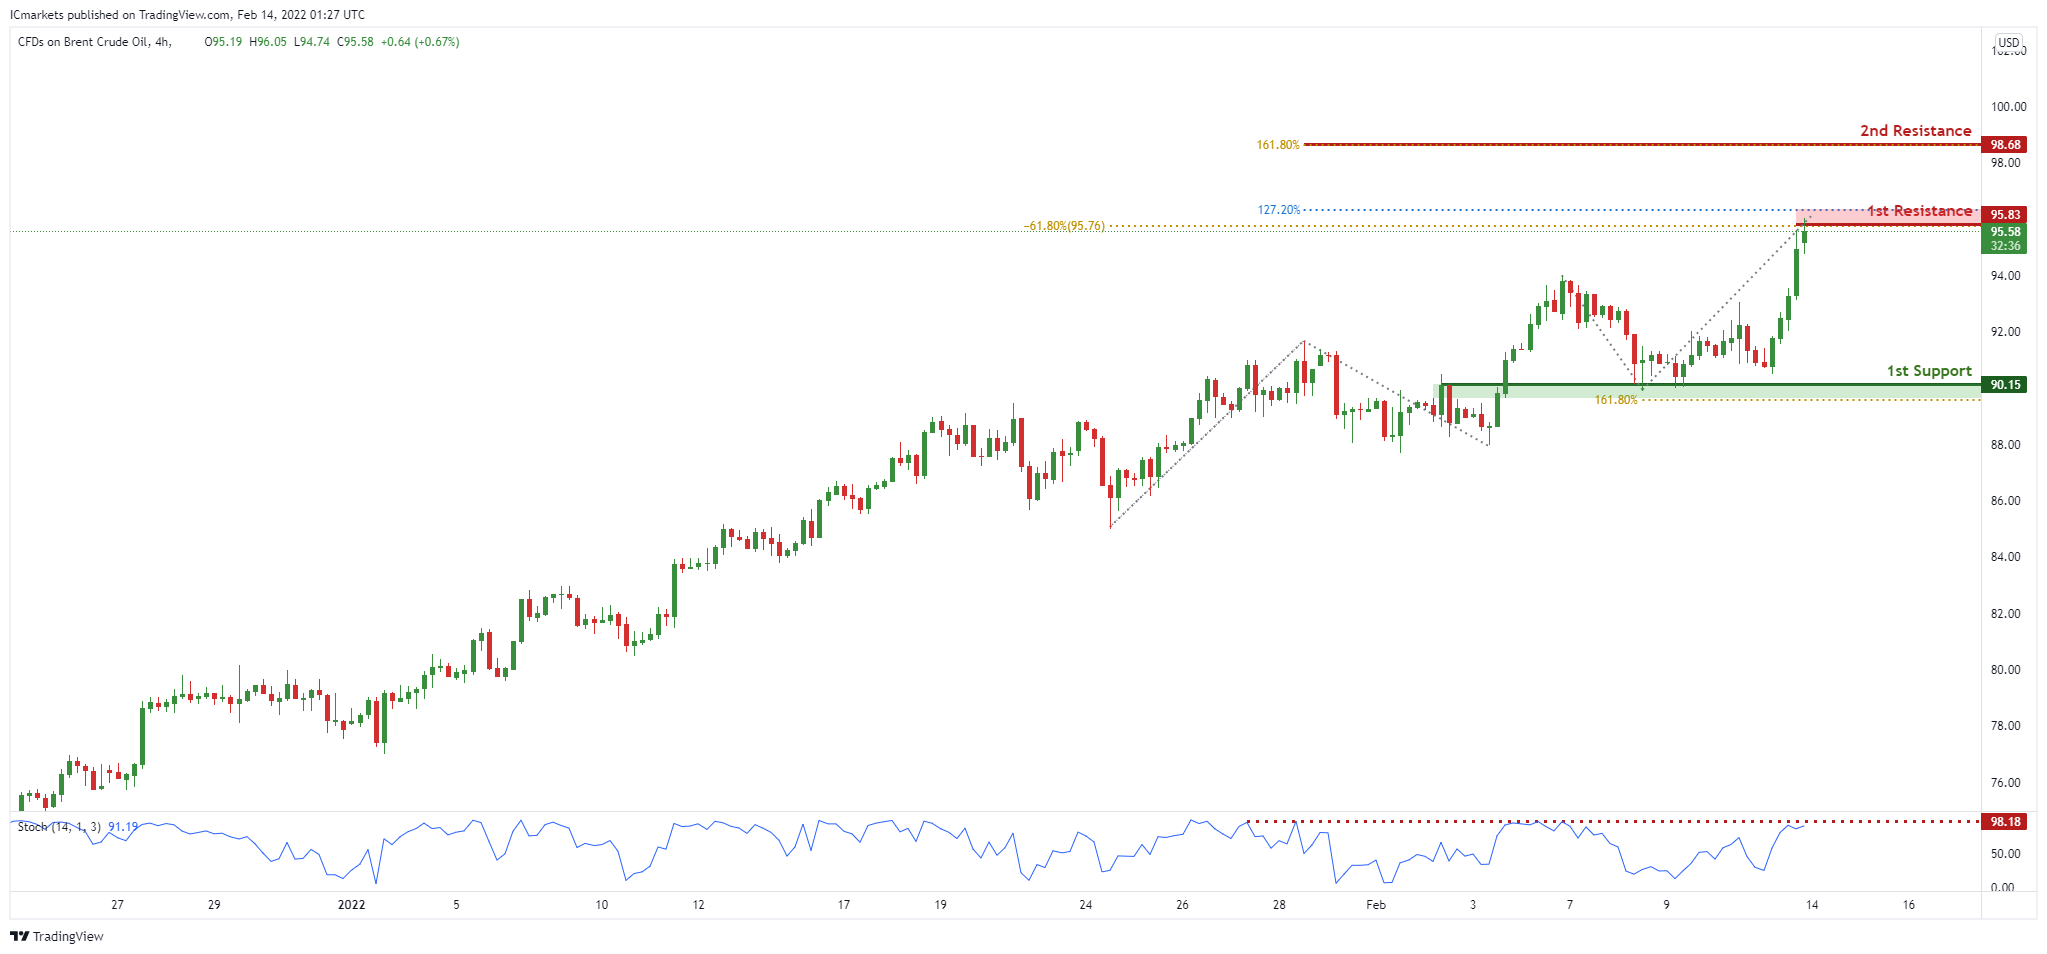
On the H4, with prices expected to reverse off the resistance of the stochastics indicator, we see the potential for a drop to our 1st support at 90.15 in line with horizontal overlap support from our 1st resistance at 95.83 in line with the 127.2% Fibonacci extension and -61.8% Fibonacci expansion. Alternatively, price may break 1st resistance structure and head for 2nd resistance at 98.68, in line with the horizontal swing low support and 161.8% Fibonacci extension.
Areas of consideration:
- H4 time frame, 1st resistance of 95.83
- H4 time frame, 1st support of 90.15
Dow Jones Industrial Average:
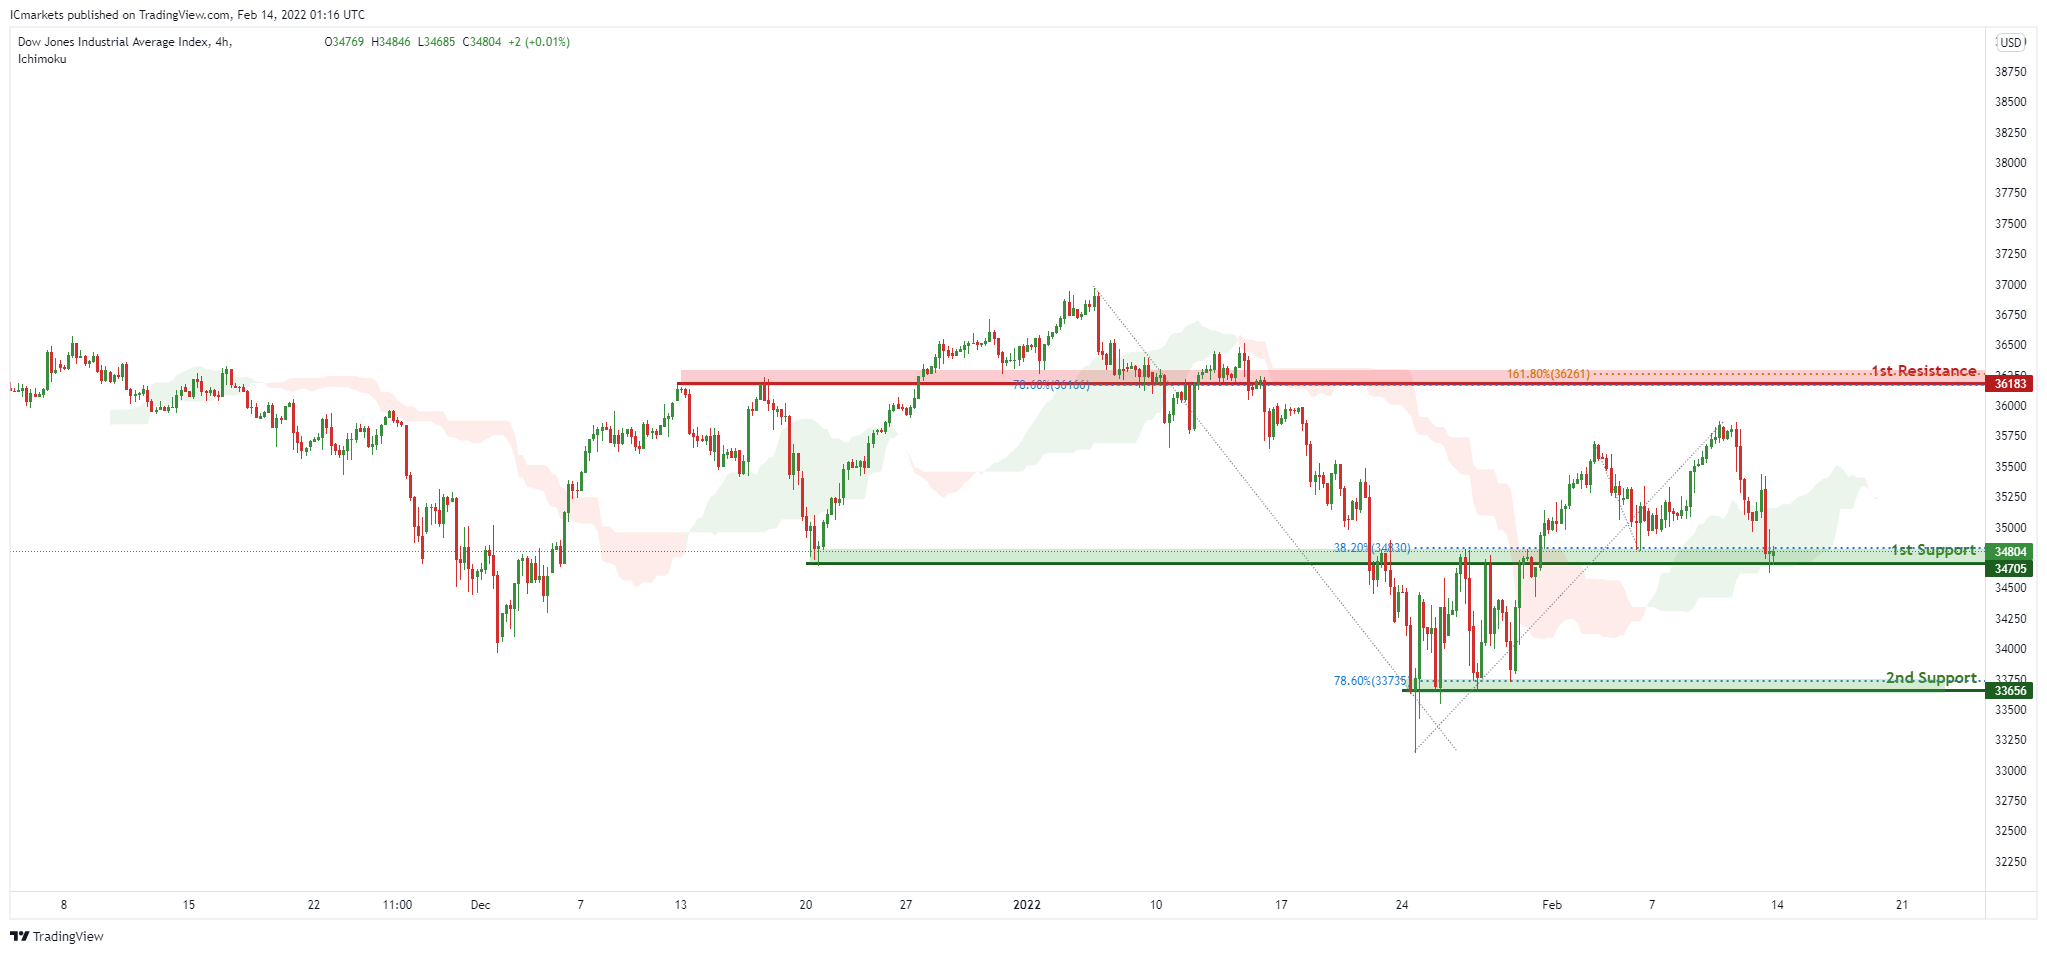
On the H4, with price moving above the ichimoku cloud, signifying an overall bullish momentum. We can expect price to rise to our 1st resistance at 36183 in line horizontal graphical swing high resistance and 161.8% Fibonacci extension from our 1st support in line with horizontal overlap support and 38.2% Fibonacci retracement at 34705. Alternatively, price may break 1st support structure and head for 2nd support, which coincides with horizontal swing low support and 78.6% Fibonacci retracement at 33656.
Areas of consideration:
- H4 time frame, 1st resistance of 36183
- H4 time frame, 1st support of 34705
EUR/USD Starts Another Correction, Gold Rallies
Key Highlights
- EUR/USD failed near 1.1495 and started a downside correction.
- It traded below a key bullish trend line with support near 1.1385 on the 4-hours chart.
- GBP/USD is still struggling to clear the key 1.3600 resistance.
- Gold price extended rally above the $1,850 resistance.
EUR/USD Technical Analysis
The Euro made another attempt to clear the 1.1500 zone against the US Dollar. However, EUR/USD failed to gain pace and formed a short-term high near 1.1494.
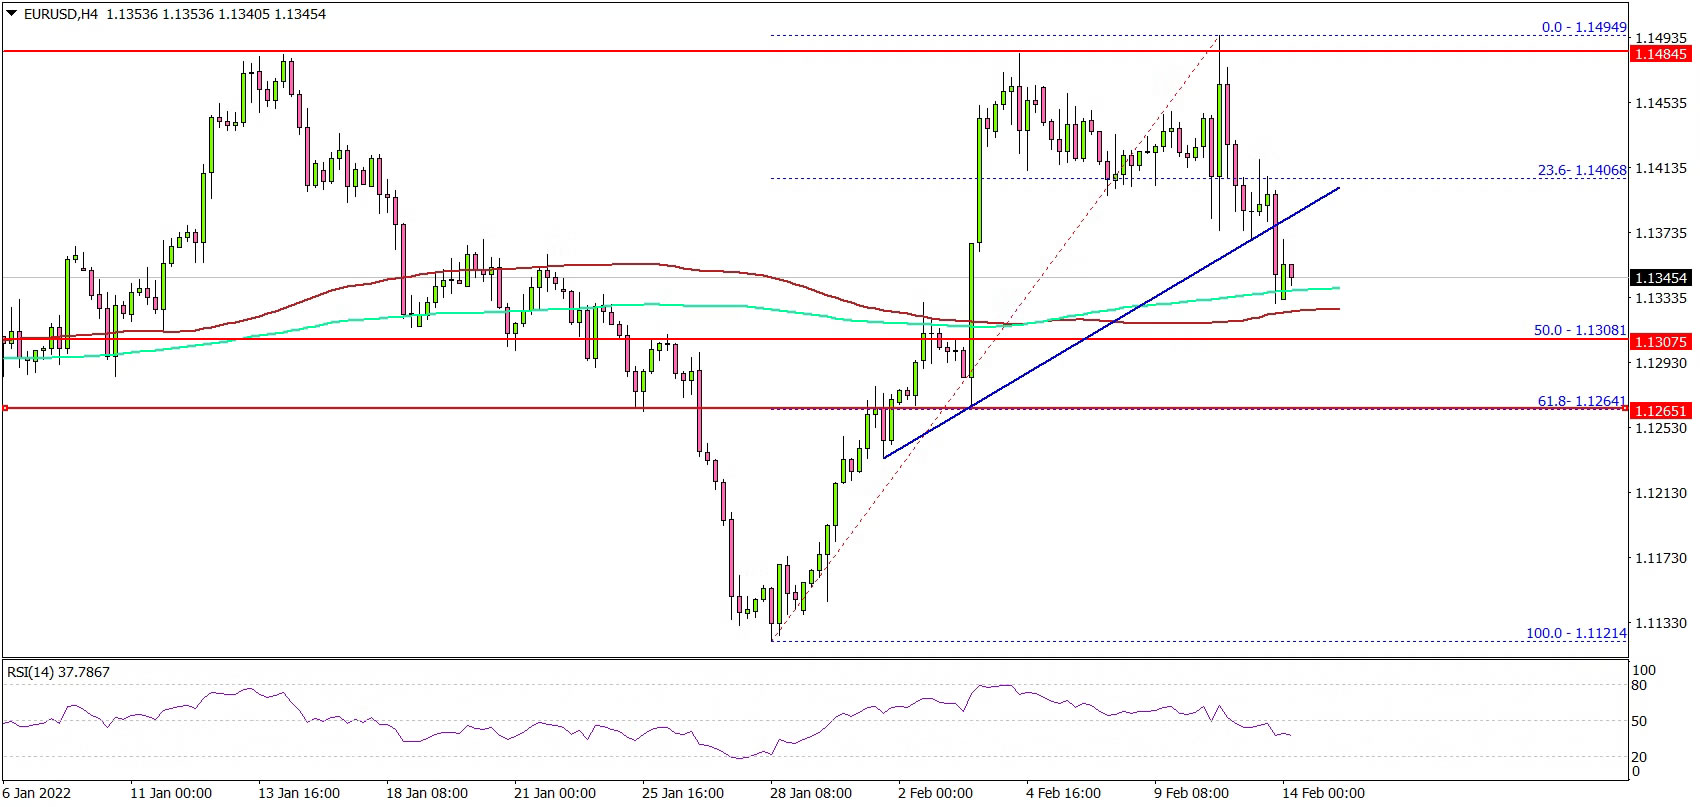
Looking at the 4-hours chart, the pair started a downside correction below the 1.1450 level. The pair spiked below the 38.2% Fib retracement level of the upward move from the 1.1124 swing low to 1.1494 high.
Besides, there was a break below a key bullish trend line with support near 1.1385 on the same chart. It tested the 100 simple moving average (red, 4-hours) and the 200 simple moving average (green, 4-hours).
The next major support is near the 1.1310 level. It is near the 50% Fib retracement level of the upward move from the 1.1124 swing low to 1.1494 high.
Any more losses could push EUR/USD towards the 1.1250 support. On the upside, the pair might face sellers near the 1.1400 level. The main breakout resistance is still near the 1.1480 and 1.1500 levels.
Looking at GBP/USD, the pair is still struggling to clear the 1.3600 resistance level. Conversely, gold price and crude oil price saw a major increase above $1,850 and $92.00 respectively.
Economic Releases
Swiss PPI for Jan 2022 (YoY) – Forecast +5.6%, versus +5.1% previous.
Eco Data 2/14/22
[php_everywhere instance="1"]
Forex and Cryptocurrency Forecast
EUR/USD: Tsunami Due to US Inflation
Ancient Greeks began to declare a truce during the Olympic Games more than 2,800 years ago. It seems that the EUR/USD bulls and bears have decided to adopt this tradition during the current Winter Olympics in Beijing. We observed a complete lull for at least the first half of the week, and the pair moved eastward under slight pressure in a narrow channel not exceeding 60 points, 1.1400-1.1460.
This calm was interrupted by a small tsunami that swept on Thursday, February 10 after the latest US inflation data was published. Consumer prices grew by 7.5%, while core inflation reached 6.0% (against 5.5% a month earlier). Both values are the highest for the last 40 years, and this has not been observed since 1982. And it scared the markets.
To be completely accurate, it was not the numbers themselves that frightened them, but the possible reaction of the US Federal Reserve to them. Investors were concerned that the US Central bank would act even more aggressively than expected in order to curb inflation. The probability that the FOMC (Federal Open Market Committee) will raise interest rates by 50 basis points (bp) in March has jumped to 80%. There have also been rumors that the rate could be raised as many as seven times in 2022. Analysts at Goldman Sachs predict that federal borrowing costs could rise to 2.0% by early 2023.
As a result of the panic, the dollar began to rise, while stock indices (S&P500, Dow Jones, Nasdaq) and the EUR/USD pair rolled down. However, the situation changed very quickly: the markets were afraid of the general economic risks caused by such a strong increase in consumer prices. And, having bounced off the level of 1.1374, the pair soared up by almost 120 points, to a height of 1.1494. After that, it changed the course again by 180 degrees.
There were two reasons for this reversal, the third in a row. The first was those overall economic risks, on the contrary, could push the US Federal Reserve to raise interest rates more vigorously. The second reason was Christine Lagarde. The head of the ECB said last week that a sharp tightening of monetary policy will have a negative effect on the Eurozone economy. This suggests the conclusion that this regulator is still not ready to raise rates, even despite high inflation rates. And according to forecasts, the first rate increase by 25 bp. can only be expected in December 2022.
Divergence in the pace of monetary tightening by the Fed and the ECB has always been good for the dollar. The same happened this time: the EUR/USD pair flew down again without reaching the height of 1.1500, reaching the local bottom at the level of 1.1329. As for the final chord of the week, it sounded at the height of 1.1340.
Taking into account the dynamics of the last two weeks, the readings of indicators on D1 are as follows at the time of writing the forecast on the evening of Friday, February 11: 65% of oscillators are colored green, the remaining 35% are neutral. As for trend indicators, only 25% are colored green, the remaining 75% are red. As for the experts, of course, all of them will pick up signals from the US Federal Reserve, primarily regarding how much the rate will be raised at the FOMC meeting in March. But it is already now that 55% of them are voting for the strengthening of the US currency and the movement of the EUR/USD pair to the south. 30% vote for an uptrend, and 15% of analysts predict a sideways movement of the pair.
The nearest resistance is 1.1370, followed by 1.1415, 1.1480-1.1525, 1.1560 and 1.1625. Supports in zones and at levels 1.1275-1.1315, 1.1220, 1.1185 and January 28 low 1.1120.
As for the upcoming week, Eurozone GDP data will be published on Tuesday, February 15. High volatility can be expected due to the release of the next portion of data on the US consumer market the next day, on Wednesday, February 16. The publication of the February FOMC meeting minutes will also cause unconditional interest on this day.
GBP/USD: The Trend Is Rising. Still Rising.
While the ECB is lagging behind the Fed, the Bank of England is so far ahead, raising interest rates faster than its peers across the Atlantic. Therefore, unlike the euro, the British pound managed to hold its ground so far last week, finishing the five-day period at 1.3551. The key word here is "so far": "so far ahead" and "managed so far." The superiority of the pound over the dollar is very shaky and it can quickly start retreating.
The main factors that could force the Bank of England to stop raising the rate, leaving it at a low level, are weak GDP and labor market growth, as well as low levels of consumer spending. According to the data published on Friday, February 11, the UK's GDP, instead of the expected 1.1%, grew by only 1.0% in the Q4 2021. And the situation in the labor market and the consumer marke will become known next week: statistics on the unemployment rate will be released on February 15, and that on the level of prices in the United Kingdom - on February 16.
When predicting the upcoming steps of the British regulator, it is appropriate to recall that only 4 out of 9 members of the Bank of England committee voted for a rate increase by 50 bps at the last meeting. The majority, including the head of the bank, Andrew Bailey, citing a slowdown in economic growth, decided to raise the rate by only 25 basis points.
The fact that this regulator will continue to act very carefully, which was confirmed by the Bank of England chief economist Hugh Pill. He said in an interview with Reuters that the bank expects "further moderate tightening in the coming months if everything goes as planned" and that "one needs to be careful in setting the rate level."
At the moment, most experts (60%) are betting on the strengthening of the dollar, believing that the GBP/USD pair will go down in the near future. The opposite position is taken by 30% of analysts, the remaining 10% remain neutral. Indicators on D1 look as follows: 90% of oscillators point to the north (10% of them are in the overbought zone), 10% look to the south. Among trend indicators, the ratio of forces is almost the same, 85/15%. Supports are located at 1.3500, 1.3425, 1.3365, the next strong support is 100 points lower. The resistance levels are 1.3585, 1.3600-1.3625, 1.3700, 1.3750, 1.3835 and 1.3900.
USD/JPY: The Pair Storms a Five-Year High Again
The correlation between US Treasuries and USD/JPY is not a secret to anyone. If the yield on US bills grows, so does the dollar against the yen. And the Japanese currency received a double blow last week: both the yield on 10-year treasury bonds, which reached peak levels since August 2019, and the USD DXY index, which soared sharply after the events described above on February 10, rose. As a result, the pair retested the multi-year high of 116.35, recorded on January 04, 2022. However, it failed to break this record, and completed the working week at 115.30.
Currently, most experts (60%) expect the USD/JPY pair to try again to update this high and rise to the point where it has not been seen since January 2017. All 100% of oscillators on D1 and 80% of trend indicators support this development. The nearest resistance zone is 115.70. The remaining 40% of experts and 20% of trend indicators side with the bears. Support levels are at 115.00 followed by 114.15, 113.75, 113.45, 113.20, 112.55 and 112.70.
Japan's GDP (Q4) data, which will be made public on Tuesday, February 15, may be able to provide some assistance to the yen. According to forecasts, the country's Gross Domestic Product may grow from minus 0.9% to plus 1.4% during the quarter. Although, in the current post-COVID situation, such economic growth may, on the contrary, play against its national currency, confirming the correctness of the super-dove policy of the Bank of Japan, which has frozen the interest rate at minus 0.1% for a long time.
CRYPTOCURRENCIES: Correction or Reversal?
The question of what we have seen the last three weeks, just a correction to a downtrend or the beginning of a new rise, remains open. Cryptocurrency quotes are going up along with the S&P500 and Dow Jones stock indices, and even slightly ahead of them.
Something similar could be observed a few months ago. But then, digital currencies outperformed stocks by almost two months with the transition from growth to collapse. The BTC/USD pair reached a high on November 10, 2021, after which it turned south. As for the S&P500, its high was on January 04, 2022. And this is logical: despite the correlation, the stock market is still much more stable than the cryptocurrency market. But both of them are very dependent on the monetary policy of the US Federal Reserve (and, in part, on the actions of other Central banks).
The stimulus program that kicked off the printing press flooded the US economy with cheap dollars and boosted risky assets. The Fed is currently tightening its policy. Based on this logic, we can predict a further decline in investors' interest primarily in cryptocurrencies.
We have already said that the movement of crypto quotes will depend in the near future (and already depends) on the mood of just a few governments and Central banks. But the expert community has not yet come to a consensus as to what their attitude will be.
For example, Johnny Liu, CEO of the KuCoin crypto exchange, has taken the "bright side", believing that the authorities will gradually understand the advantages of cryptocurrencies. According to him, there is a trend in the mass adoption of cryptocurrencies at the state level, governments are exchanging experience in their legalization, so any restrictions are only a temporary measure.
The opposite view was expressed by the billionaire founder of Bridgewater Associates, Ray Dalio, who believes that this asset class is likely to be banned by the governments of a number of countries.
Ricardo Salinas Pliego, one of the richest people in Mexico and founder of the Grupo Salinas group of companies, also believes that governments are not interested in facilitating the use of bitcoin, since the decentralized nature of the first cryptocurrency makes it much more difficult to control its turnover.
The same opinion is shared by Parallax Digital CEO Robert Breedlove, who said that the authorities will try to make life as difficult as possible for cryptocurrencies, as a class that poses a threat to their financial systems. To do this, they will use all their tools, aiming to regulate digital assets as much as possible. This is what we have seen lately in countries such as China or Russia.
Some optimism is caused by the fact that quite a lot of representatives of large businesses already side with digital assets, recognizing the merits of cryptocurrencies to one degree or another. Of course, not all of them are ready to invest serious capital in this market right now. The aforementioned billionaire Ray Dalio, while stating that "cash is trash," admitted that digital assets make up a "tiny percentage" of his personal investment portfolio. And that in general, given the small size of the cryptocurrency market, it "is given too much attention."
In terms of market size, Robert Breedlove believes that the market capitalization of bitcoin will increase dramatically over the next few years and exceed $5.0 trillion. Inflation in the US is at a 40-year high at the moment. And according to the head of Parallax Digital, the same thing can happen with the dollar as with the currency of Venezuela. The US currency will hyperinflate by 2035, at which point the price of BTC in dollar terms will become astronomical: 1, 5, or 10 million USD per coin. That is, the Fed's printing press can provide tremendous support to bitcoin. But the biggest threat to it, according to Robert Breedlove, comes from the same regulator.
All indicators of the crypto market look much more modest at the time of writing the review on the evening of Friday, February 04. The total market capitalization is still slightly closer to $2.0 trillion and is at the level of $1.90 trillion ($1.85 trillion a week ago), the Bitcoin Dominance Index is 42.46%. The BTC/USD pair is trading in the $42,500 zone, and the Crypto Fear & Greed Index has left the Extreme Fear zone and, having gone up sharply, reached 50 points, which corresponds to the neutral state of the market.
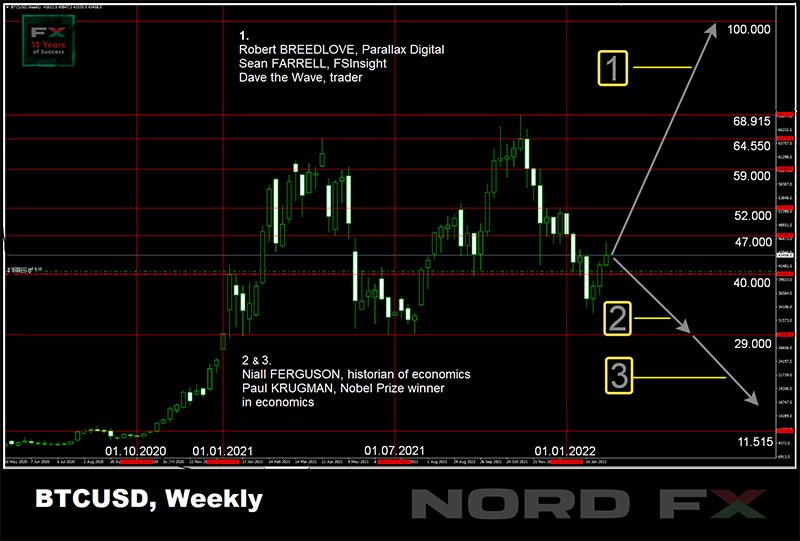
A number of experts monitoring the dynamics of supply and demand for bitcoin are alarmed by the weak base for the current growth of the coin. As a result, in their opinion, the BTC/USD pair may return to the $40,000 zone within a month, and then fall even lower, to $29,000, in the medium term.
An even more pessimistic forecast was given by the author of the book "The Ascent of Money", historian of economics Niall Ferguson. He believes that if the historical dynamics of BTC fluctuations is repeated, the price of the first cryptocurrency will fall to a low of $11,515 by November 2022. This is 83% below the historic peak in bitcoin value reached in November 2021.
At the same time, Ferguson disagrees categorically with the opinion of the Nobel Prize winner in economics Paul Krugman, who draws a parallel between the volatility of the cryptocurrency market and the collapse of the US real estate market in 2007-2008. Which, as you know, was followed by the global economic crisis.
Niall Ferguson believes that "it is not worth waiting for a polar vortex or a giant ice cyclone. And a drop in the value of bitcoin to the lows of the 2010s is unlikely. However, this does not mean that crypto winter will bring less cold."
Of course, there are much more optimistic forecasts. According to Sean Farrell, an analyst at financial research firm FSInsight, bitcoin's dominance over altcoins will remain unshakable and its price, despite a "shaky start" in January, could reach $200,000 in the second half of 2022.
The FSInsight report also states that the ethereum platform is undervalued and the second largest cryptocurrency by capitalization may reach $12,000 this year. Sean Farrell is optimistic about the transition of ethereum to the Proof-of-Stake algorithm. And if the process goes smoothly, capital inflows into the ecosystem will increase, "regardless of bitcoin's performance." And the CEO of the KuCoin crypto exchange, Johnny Liu, believes that since most innovative projects are launched on the ethereum, it will break ahead of BTC in the long run.
The fact that the BTC/USD pair could overcome the $100,000 mark at the end of this year or at the beginning of 2023 is also indicated by the forecast of a crypto trader nicknamed Dave the Wave. However, this scenario also implies a "decent correction". The trader notes that the $100,000 cyclical curve should be interpreted not as a support level, but as an average price trajectory that bitcoin can roughly follow.
In regard to the near future, Dave the Wave noted that while bitcoin's monthly chart may still look bearish, certain bullish signals are emerging on the weekly chart. In addition, bitcoin managed to break out of the narrow downward channel, which also indicates an upcoming increase.
And at the end of the review, our traditional heading of crypto life hacks. This time we will mention a trader nicknamed macromule who shared a very interesting trading algorithm. According to this trader, the signal to open a position is the tweets of the bitcoin skeptic and gold supporter Peter Schiff about the first cryptocurrency. The user recommended buying BTC every time after the next such tweet and closing the position after 72 hours. According to macromule, this strategy could have made 203 trades since last May, of which 65% 65% would have been in positive territory and brought about 1,000% per annum income.
Of course, we cannot recommend using this "strategy". But if someone still wants to test it, they can do it on a demo account without risking real money.
EUR/USD Weekly Outlook
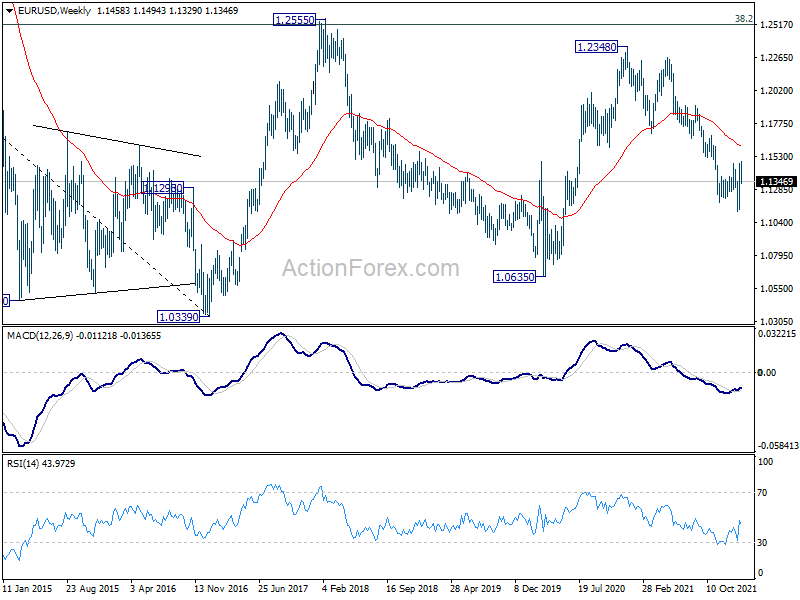
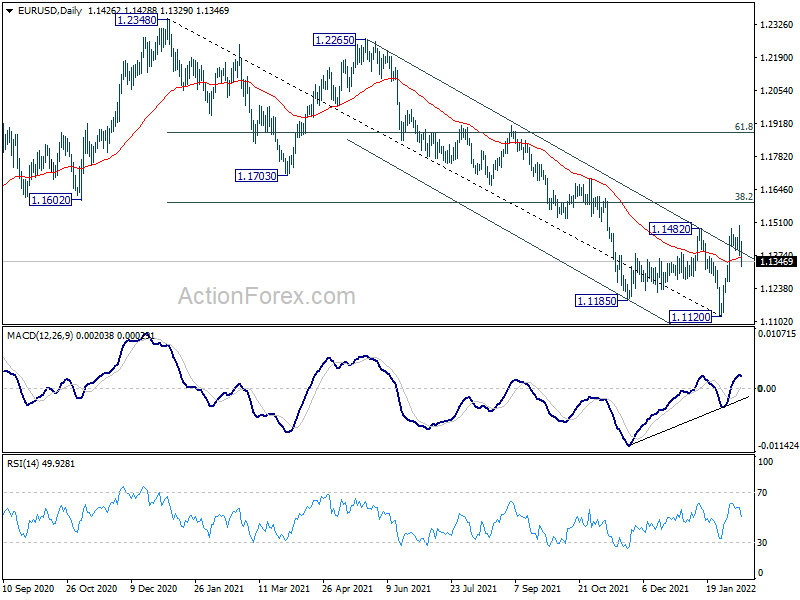
EUR/USD edged higher to 1.1494 but failed to sustain above 1.1482 resistance. Initial bias remains neutral this week first. Further rise will remain mildly in favor as long as 1.1265 minor support holds. On the upside break of 1.1482 will target 38.2% retracement of 1.2348 to 1.1120 at 1.1589 next. Sustained break there will argue that whole fall from 1.2348 has completed too and target 61.8% retracement at 1.1879. On the down, however, break of 1.1265 support will dampen this bullish view and bring retest of 1.1120 low instead.
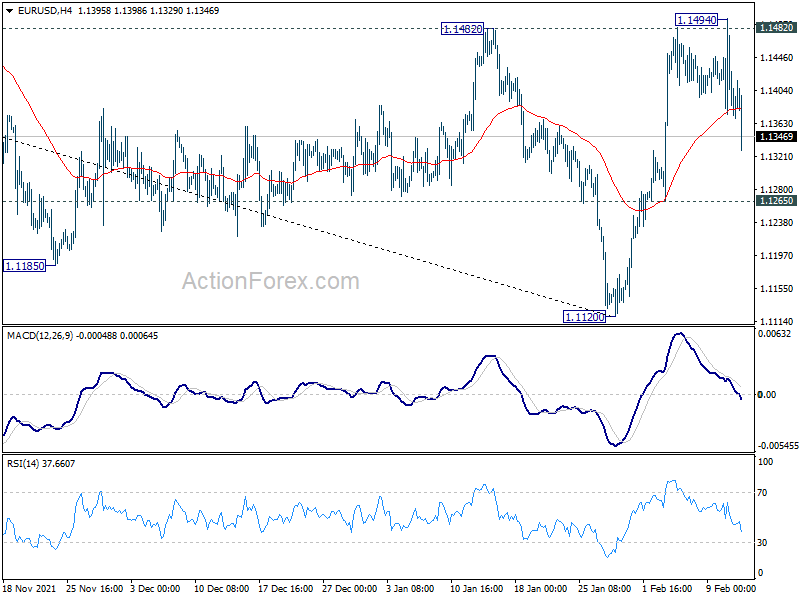
In the bigger picture, the decline from 1.2348 (2021 high) is seen as a leg inside the range pattern from 1.2555 (2018 high). Sustained trading above 55 week EMA (now at 1.1613) will argue that it has completed and stronger rise would be seen back towards top of the range between 1.2348 and 1.2555. However, firm break of 1.0635 (2020 low) will raise the chance of long term down trend resumption and target a retest on 1.0339 (2017 low) next.
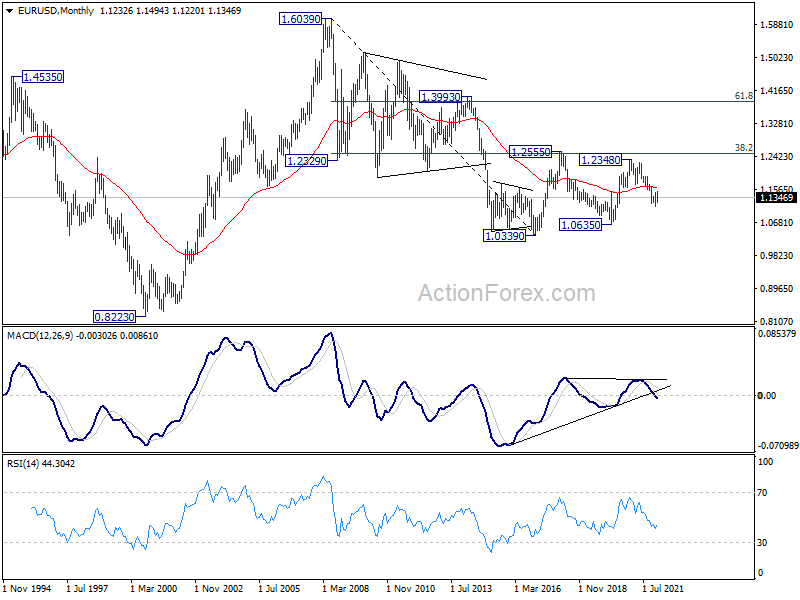
In the long term picture, in another case, as long as (38.2% retracement of 1.6039 (2008 high) to 1.0339 (2017 low) at 1.2516 holds, the down trend from 1.6039 could still resume through 1.0339 low. However, sustained trading above 1.2516 will argue that the long term trend has reversed.