Sample Category Title
WTI Oil Outlook: Oil Price Would Easily Rise Above $100 If Situations Over Ukraine Deteriorates
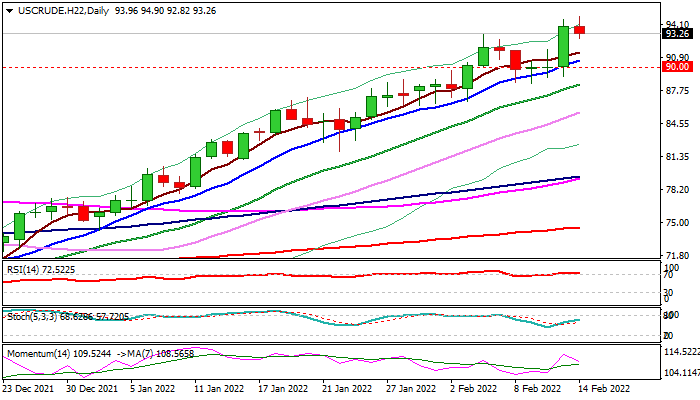
WTI oil price is holding near new highest since September 2014 in early European trading on Monday, following Friday’s 4.3% advance the biggest one-day rally since Aug 23).
Rising geopolitical tensions on possible military conflict over Ukraine, continue to lift oil prices as war would disrupt already tight oil market, after OPEC and its allies announced the struggle to increase output despite strong demands for a monthly production increase by 400,000 barrels per day.
In such scenario, oil prices would easily rise through psychological $100 barrier and focus targets at $107.45 and $110.00.
Technical studies support the action, mainly driven by fundamentals, with loss of bullish momentum on daily chart and overbought conditions on weekly chart, suggesting bulls may take a breather.
Dips are expected to be shallow on overheated situation, with price action to remain highly volatile and sensitive to updates regarding the situation over Ukraine.
Rising 10DMA ($90.68) should ideally contain and guard pivotal supports at $88.30 (last week’s higher base, reinforced by rising 20DMA), loss of which would signal deeper pullback.
Res: 94.90; 96.08; 97.89; 99.59.
Sup: 92.41; 91.68; 90.68; 90.00.
GBP/USD: Indecision Abound
Despite GBP/USD managing a gain of 0.19% on the week, the weekly candlestick formation wasn’t the thick body that would give confidence of any sort of big range breakout this week.
GBP/USD had an inconclusive end to last week. Daily price action looked indecisive as the pair came under strong selling pressure in the 1.3560 to 1.3640 zone. GBP/USD opened the week at 1.35340, then early on edged to a low of 1.34906, then floundered, with the pair eventually hitting a high of 1.3647, before strong selling led it to close at 1.35992.
GBP/USD weekly candle (w/e 11 February)

Despite GBP/USD managing a gain of 0.19% on the week, the weekly candlestick formation wasn’t the thick body that would give confidence of any sort of big range breakout this week. Bigger picture, the 1.3745 and 1.33529 levels, the latest swing high and lows on the weekly chart, still look like big hurdles to break.
In terms of the daily setup, market structure still points to a continuation of the downtrend that has gripped the market since September last year. Price is confined between the 8 December swing low of 1.31610 and high of 1.37489. Furthermore, the pair after breaking above the 1.35740 - 61.8% Fib level of that last impulse and corrective move – failed to sustain on the retest and continues to bump up against the 200-EMA.
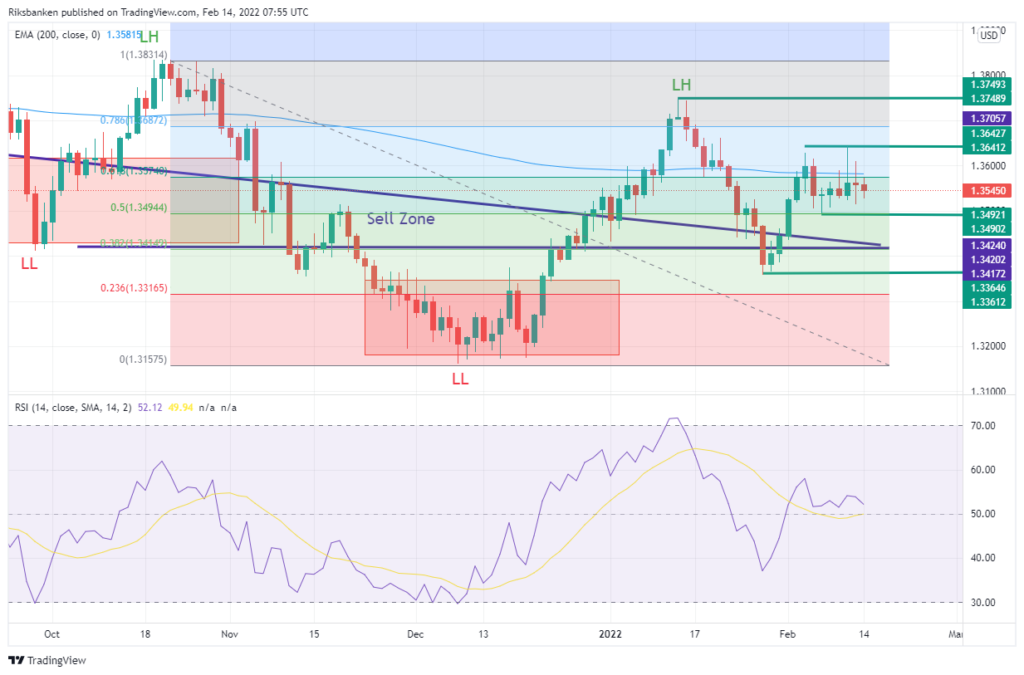
More recently, the pair has been trading in a range between 1.3612 and 1.34902. But a break higher above 1.37489 is needed to confirm any chance of a real shift in trend. While a fall back closer to 1.3433-1.34161, would put price back into a sell zone and would give greater confidence of a resumption of the downward trend.
Nasdaq 100 Retreats Amid Geopolitical Tensions
US equities crashed sharply on Friday as investors reacted to the latest warning by the US intelligence on Russia’s activity near Ukraine. In a statement, the agencies said that Russia had amassed enough troops near the Ukrainian border and the Baltic Sea. They warned that an invasion could happen any time in the coming days. These were the latest revelations by the intelligence community. Two weeks ago, they warned that Russia was planning some fake attacks in a bid to provoke an invasion. Still, analysts believe that any geopolitical crisis in the region will have minimal impact on stocks. This partially explains why US futures pointed higher.
US stocks are also reacting to the ongoing earning releases. Most companies in the S&P 500 index have already published their quarterly results. According to FactSet 72% of companies in the index have already published their results. Of these companies, 77% of them have published results that have beaten analysts’ forecasts. Earnings growth has been about 30%, marking the fourth straight quarter of over 20% earnings growth. The 12-month PE ratio of companies in the S&P 500 is at about 12 months. The next key companies that will publish their results are Airbnb, Roblox, Continental Resources, Vornado Realty Trust, and Arista Networks among others.
The price of crude oil jumped sharply as investors predicted a growing supply and demand imbalance in the coming months. On supply, there are signs that some countries like Nigeria and Angola are struggling to meet their quotas. Therefore, unless other producers boost their production, there is a possibility that prices will remain steady. There is also a risk that Russia’s oil industry will be sanctioned, leading to more challenges since it is the third-biggest oil producer in the world. At the same time, demand is expected to keep rising as the world reopens.
EURUSD
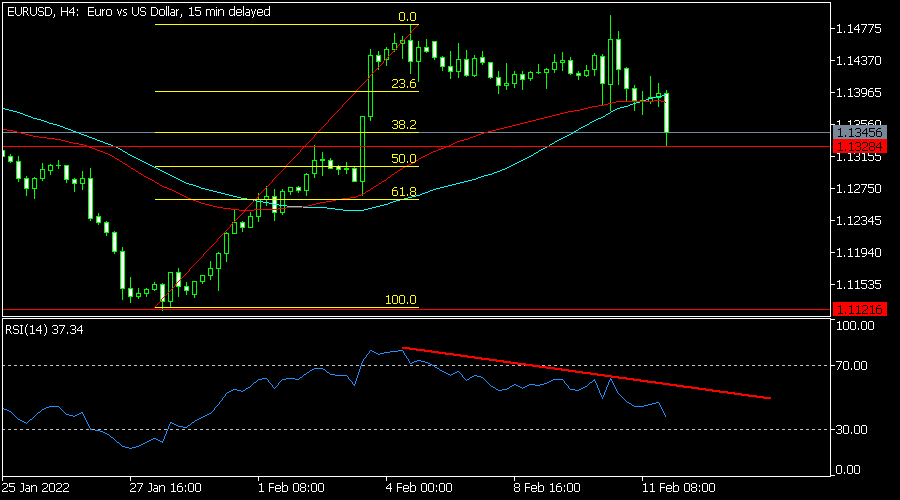
The EURUSD pair declined to a low of 1.1328, which was the lowest level since February 3. The pair has managed to drop substantially from last week’s high of 1.1496. It has moved below the 38.2% Fibonacci retracement level. The Relative Strength Index (RSI) has also formed a bearish divergence pattern and moved below the 25-day moving average. Therefore, the pair will likely keep falling as bears target the key support at 1.1280.
XBRUSD
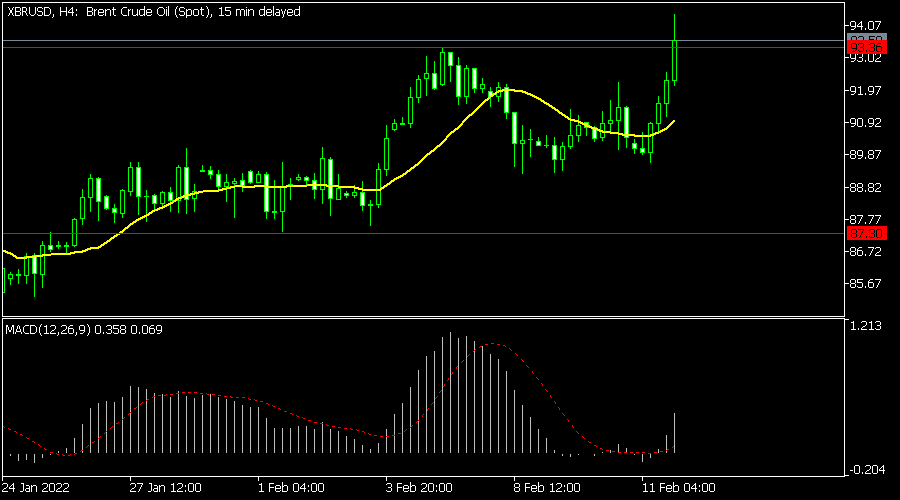
The XBRUSD pair has been in a strong bullish trend in the past few months. The pair soared to a high of 95 last week. It is trading at 93.40, which is slightly above the key resistance level at 92. Additionally, the pair moved above the 25-day and 50-day moving averages while the MACD has moved slightly above the neutral level. Therefore, there is a likelihood that the bullish momentum will continue as bulls target the next resistance at 100.
NAS100
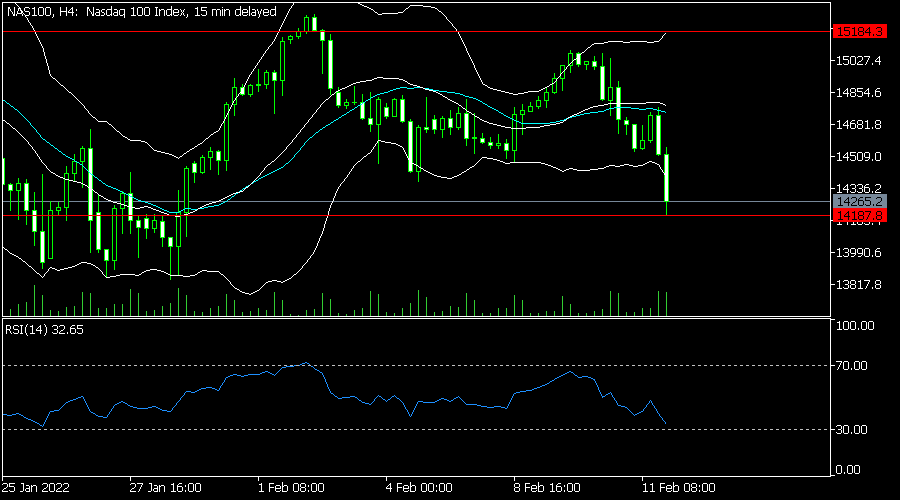
The Nasdaq 100 index declined to a low of 14,187 as geopolitical and Fed risks rose. That price was significantly lower than last week’s high of $15,184. On the four-hour chart, the pair moved below the 25-day and 50-day moving averages. It also moved to the lower side of the Bollinger Bands while the Relative Strength Index (RSI) has continued dropping. Therefore, the pair will likely keep falling in the coming days.
Daily Technical Analysis
EUR/USD
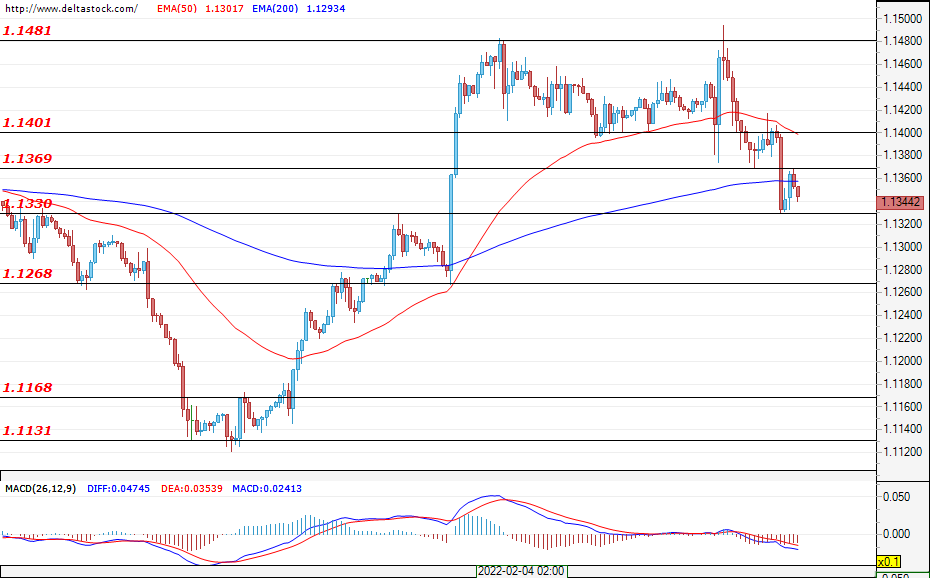
At the end of last week, the euro was sold off and the pair broke the support at 1.1400. The corrective phase has deepened and is currently limited by support 1.1330. The market is expected to remain undecided and a break of the main resistance at 1.1480 seems unlikely. The risk of conflict in Ukraine may plunge prices to the support at 1.1260, but it is possible the market will wait for the situation to develop. A return above 1.1400 would encourage the bulls for a new test at 1.1480. The first local resistance is the area around 1.1370. Today, an increase in activity can be expected around the speech of ECB's Christine Lagarde at 16:15 GMT.
USD/JPY
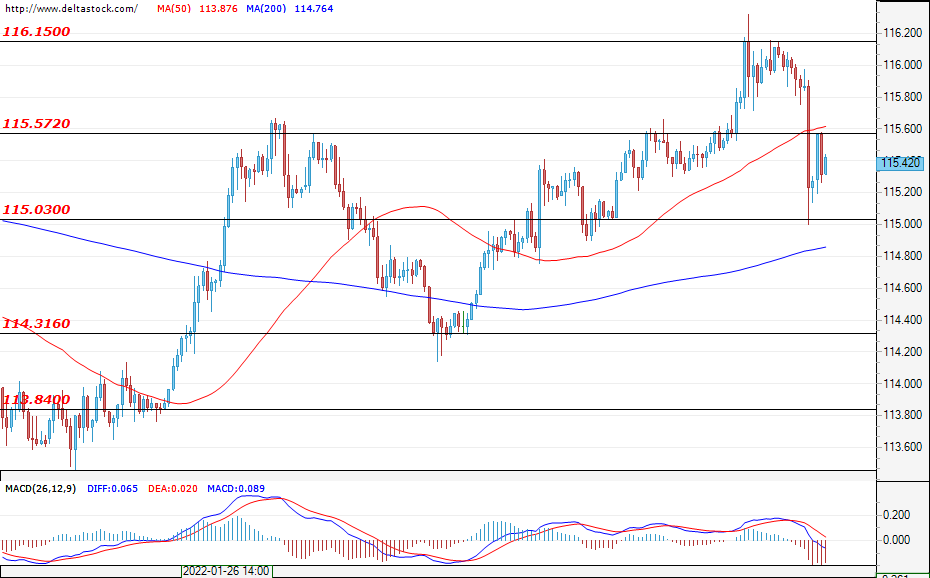
As the crisis in Ukraine grows, so does the demand for heaven assets. The pair sold out on the last day of last week and the bears tested the support at 115.00. Double tops at 116.30 limit the potential for growth and a convincing breakthrough will be needed to continue the uptrend towards 118.60. The bears are hesitant in today’s early hours and the pair formed the first daily resistance at 115.57. A break of 115.00 would strengthen the bearish sentiment in the market and this could pave the way towards the support at 113.84.
GBP/USD
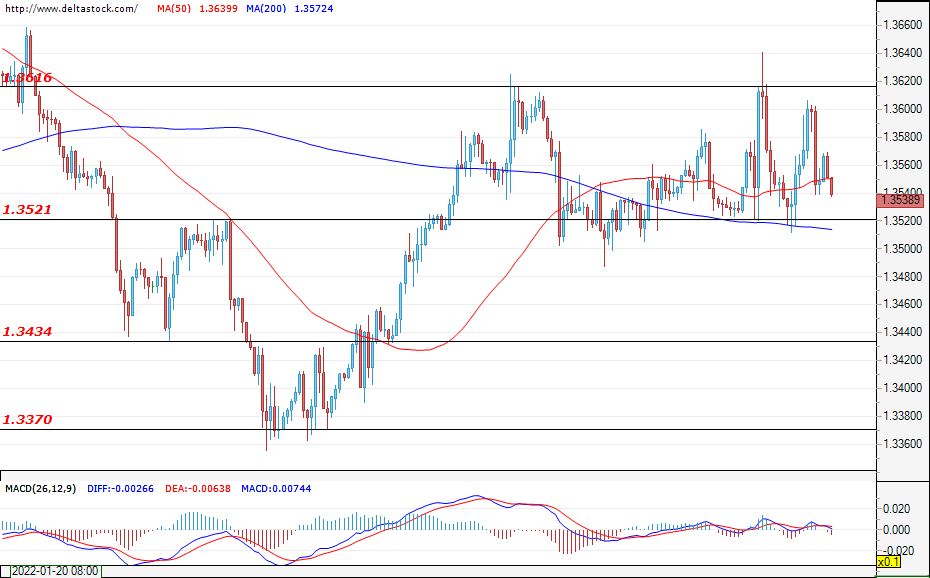
The cable is currently above 1.3520, but the Bulls seem to be losing patience after several failures to break the resistance at 1.3616. Sentiments at the beginning of the week are neutral as a break of 1.3520 would lead to sell-offs towards 1.3430. The main support from the higher time frames is 1.3370 and in the coming days the market may remain volatile, but without a clear direction. To continue the momentum to 1.3750, the bulls will first have to overtake the zone around 1.3616.
EUGERMANY40
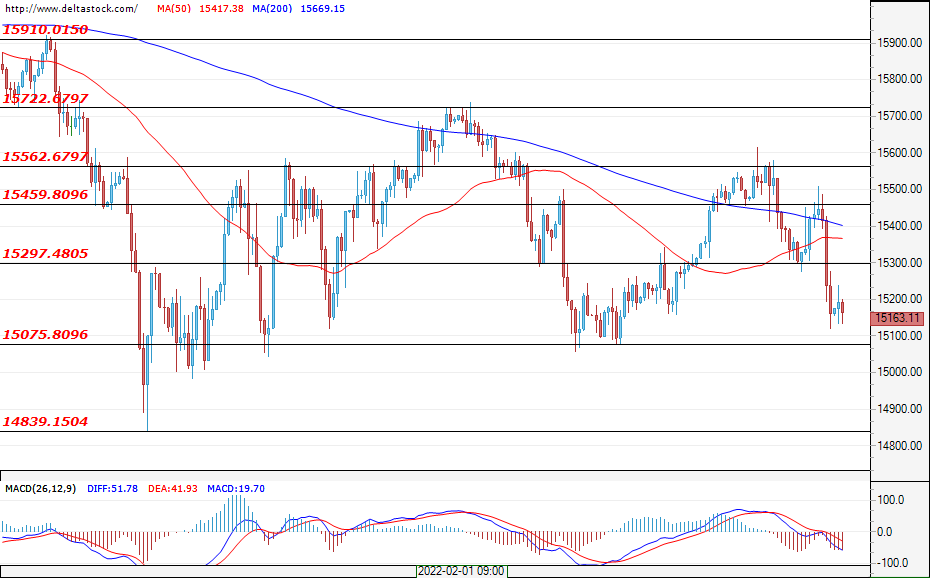
The German index failed to hold last week's gains and after the sell-off prices approached the support at 15075. It is possible for the bulls to test the resistance at 15300 and, if the zone is breached, the next target for them would be 15460. Seasonality supports bullish scenarios and reversal of the movement from the current levels has the potential to reach the resistance at 15722. Until this zone is cleared, the opportunities for gains remain severely limited. If the bearish pressure continues and the zone at 15075 is broken, a new test of the zone around 14800 is possible. This support has been holding the market since March last year, its role is key and a breach here could send the market crashing towards 14130.
US30
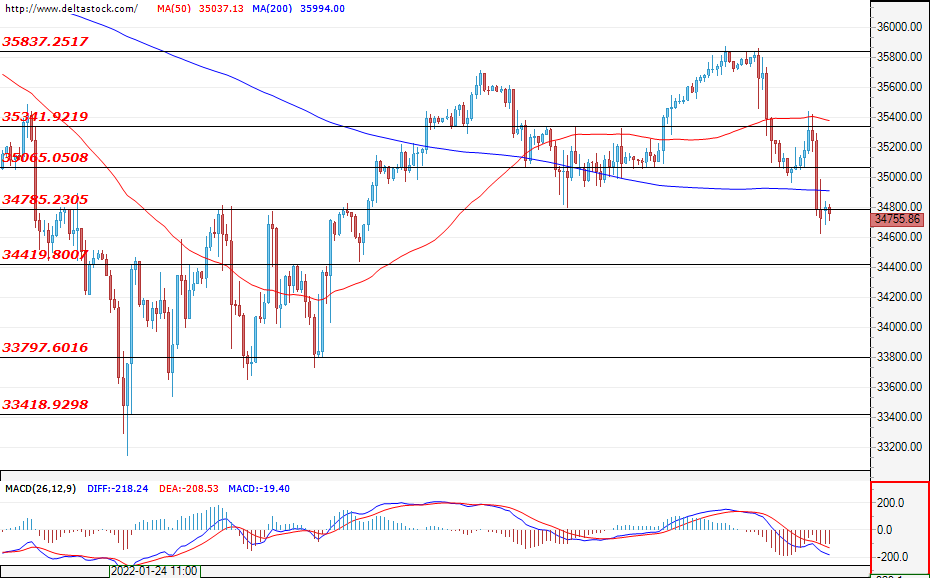
The US30 also sold out late last week, with the index breaking several supports on the way, the most significant of which is at 35065. In the early hours of today, prices are hovering around the support at 34785. They are likely to bounce back from that level and test the breach at 35065. If the zone is cleared, the recovery may continue to 35340. Several risks weigh on the market, such as inflation in the US, the Federal Reserve and the crisis in Ukraine, and currently gains are likely to be capped. A new wave of sell-offs could plunge prices to 34420, however the main support for the bulls remains at 33800. The uptrend on the highest time frames seems to be broken,and a breach of 33144 would confirm the reversal of the main direction of the market.
US 30 Seeks Support
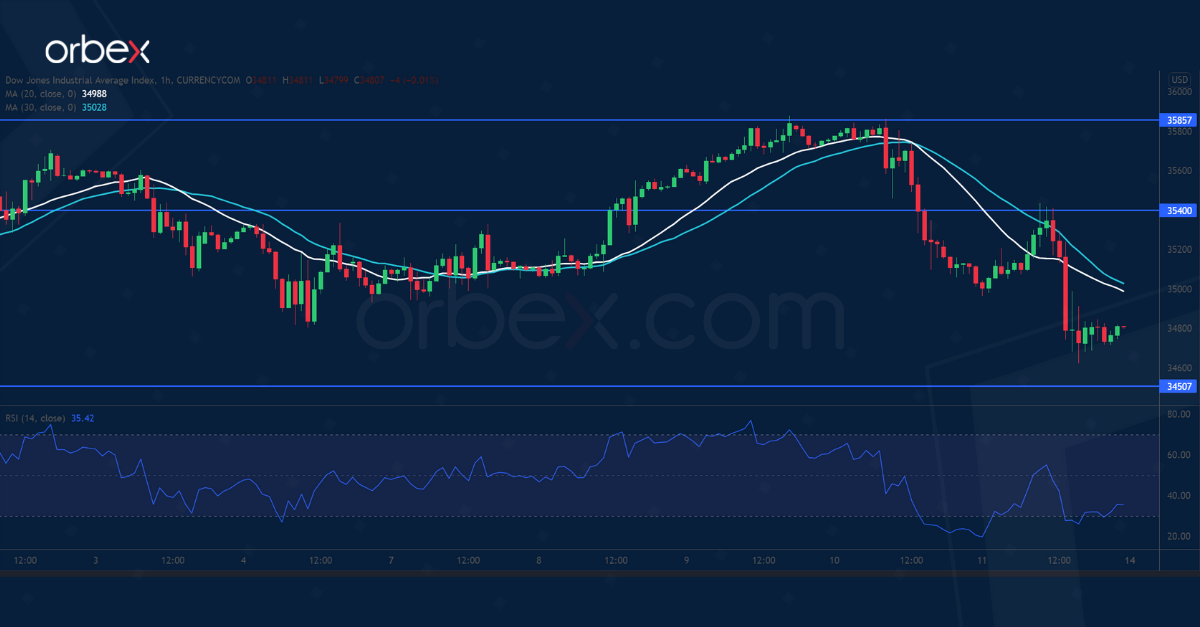
The Dow Jones 30 struggled as white-hot US inflation fanned fears of aggressive rate hikes.
Nonetheless, a break above the 30-day moving average on the daily chart indicates improved market sentiment. An overbought RSI prompted momentum traders to exit.
A fall below 34820 would suggest lingering hesitation among market participants and shake out weak hands. The bulls may see a pullback towards 34500 as a buying opportunity. The rebound may only resume if the price lifts offer around 35400.
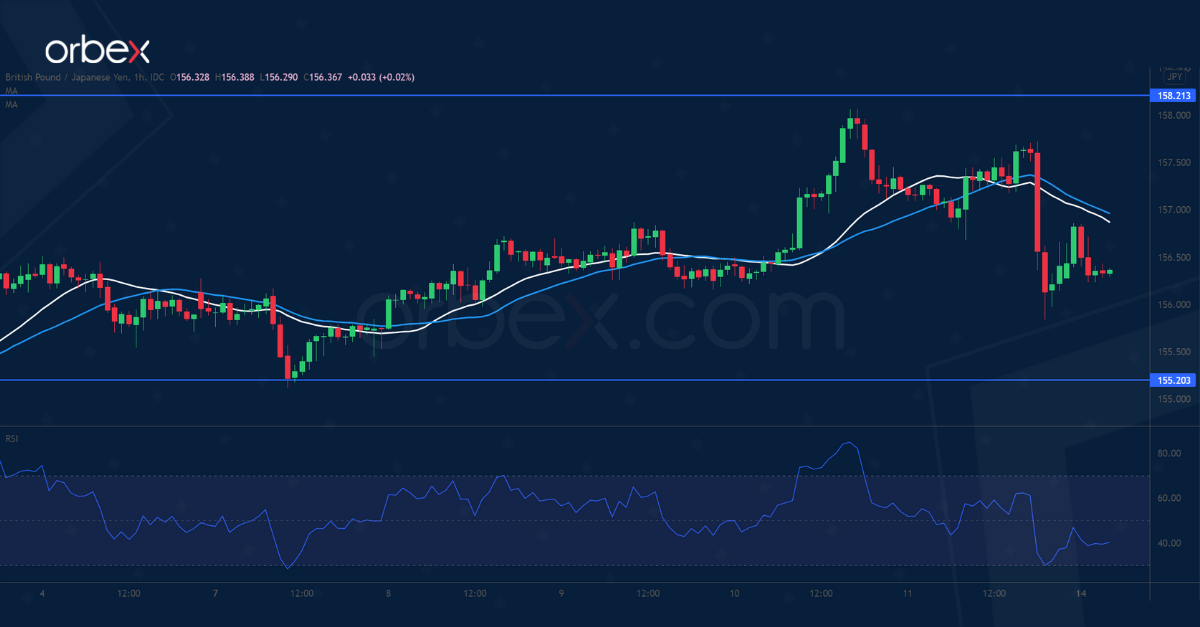
GBP/JPY Tests Demand Zone
The pound may find support from Britain’s upbeat GDP in Q4. A break above January’s high at 157.70 suggests that the bulls have reclaimed control of price action.
The next challenging task is to push above last October’s peak at 158.20. This would resume the uptrend in the medium term.
In the meantime, a combination of profit-taking and fresh selling is driving the price towards 155.20. Sentiment would remain steady as long as the sterling met bidders in this demand area.
USD/CHF to Test Resistance
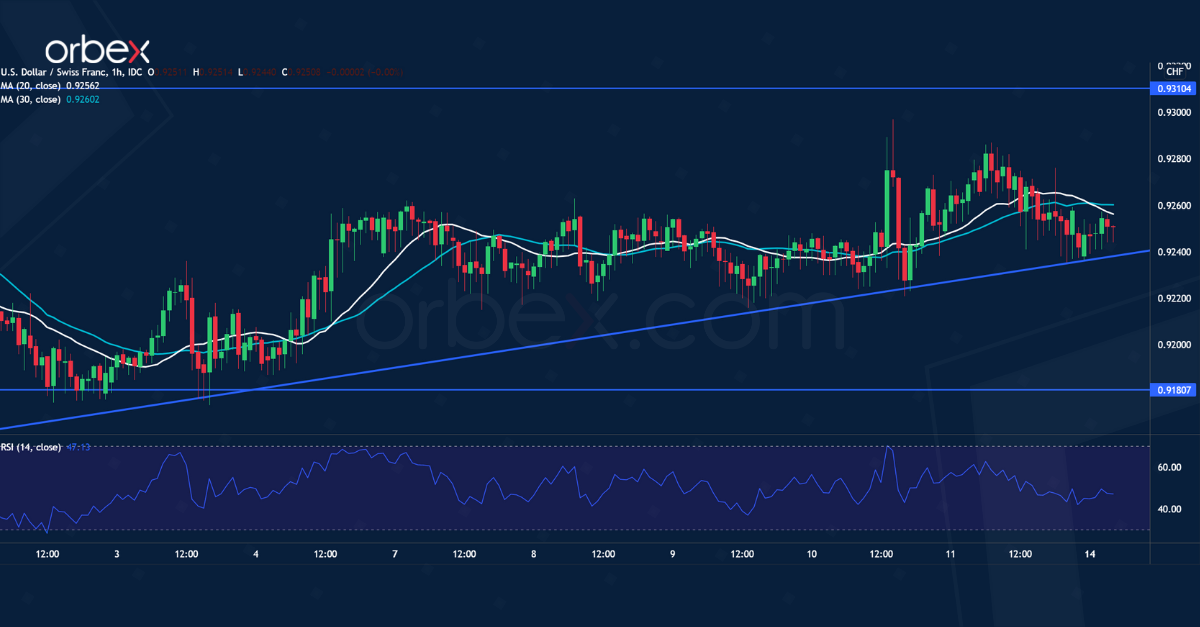
The US dollar rises as traders seek safe haven amid tensions in Ukraine. The pair is grinding up along a rising trendline from support at 0.9180.
A series of higher lows suggests strong buying interest. A break above the intermediate resistance at 0.9275 may boost buyers’ confidence further.
0.9310 is the next hurdle and its breach would bring the greenback to the double top (0.9370) on the daily chart. On the downside, the trendline is the closest support, and then 0.9180 is a critical level to keep the short-term rally intact.
Dollar Outpowered Euro in Late Risk-off Spell
Markets
Souring risk sentiment during Friday’s US trading session eventually offered some relief for ailing US Treasuries. Ahead of late-session, safe haven rebound, the US Note future approached the post-CPI sell-off low after Michigan consumer confidence showed consumers expecting a 5% inflation rate over the next year. The headline index fell to the lowest since October 2011 as the combination of persistent price pressure, a potentially less supportive fiscal stance and a tighter monetary policy all dampen growth perspectives.
In yield terms, the US 10-yr yield failed a sustained break above the psychologic 2% mark in the weekly close. US stocks were already trading heavy before sinking after US National Security Adviser Jake Sullivan said that Russia could initiate military action even before the end of the Winter Olympics (February 20). He added that it can take a variety of forms. It could be more limited, it could be more expansive, but there are very real possibilities that it will involve the seizure of a significant amount of territory in Ukraine and the seizure of major cities including the capital city.
Main US equity indices eventually lost 1.4% (Dow) to 2.8% (Nasdaq). The S&P 500 closed below the 4451.5 neckline of a short term double top formation, suggesting a return to the 4222.62/4278.94 support zone (YTD sell-off low & Oct2021 low). Brent crude rose from $90.5/b to $95.5/b.
US yields dropped by 7.7 bps (2-yr) to 9.6 bps (5-yr) with the belly of the curve outperforming the wings. The German yield curve still showed a small bear steepening move (0.5 bps for 2-yr; +2.1 bps for 30-yr) because of the timing of the move (after European close). A catch-up move can be expected at today’s opening.
Peripheral spreads extended their post-ECB widening trend, adding up to 5 bps for Greece and Italy even as ECB members keep pushing back against very aggressive market pricing regarding policy rates.
Irish ECB member Makhlouf in an interview with the FT this weekend for example said that the idea of hiking interest rates in June looks very unrealistic. “There’s a bit of difference between the calendar we’re working to and the one some market participants may have in mind.”
The dollar outpowered the euro in the late risk-off spell with EUR/USD closing at 1.135 from an 1.1428 open. The trade weighted dollar managed a first close above the 96 big figure since February 1st. USD/JPY fell from the 116.25 resistance area to 115.33 currently, with JPY obviously the stand-out safe haven currency. EUR/GBP strangely enough followed the EUR/USD move south, to close 0.837 from an 0.8428 open. Risk aversion remains dominant in Asia this morning. The eco calendar is empty suggesting it will be so for the rest of the session.
News Headlines
Members of the ruling Polish Law and Justice Party submitted a bill to the Parliament to change a disciplinary chamber of judges that is at the core of the dispute with the EU over the rule of Law. Under the proposed bill, cases of disciplinary action against judges would be transferred to the Supreme Court. The disciplinary chamber will continue to exist but only handle cases involving other legal professions. According to the justification of the bill, the proposal complies with all facets of the Court of Justice of the EU. The proposal probably won’t be considered as a final answer by the EU but could be a basis for further negotiations. The raft between the EU and Poland on rule of law was an obstacle in executing Poland’s €36bn support of the Next Generation EU Recovery package. Last week, Poland’s President Duda also indicated that it wasn’t opportune for Poland to continue this dispute given the international tensions around Ukraine.
Rating agency Fitch further cut the credit rating of Turkey into junk territory. The agency lowered the country’s foreign currency issuer default rating to B+ from BB-. The outlook remains negative. According to the agency’s statement ‘Policy-driven financial stress episodes of higher frequency and intensity have increased Turkey's vulnerabilities in terms of high inflation, low external liquidity and weak policy credibility’. Fitch does not expect the authorities' policy response to reduce inflation, including FX-protected deposits, targeted credit and capital flow measures, will sustainably ease macroeconomic and financial stability risks.’
EUR/USD Daily Outlook
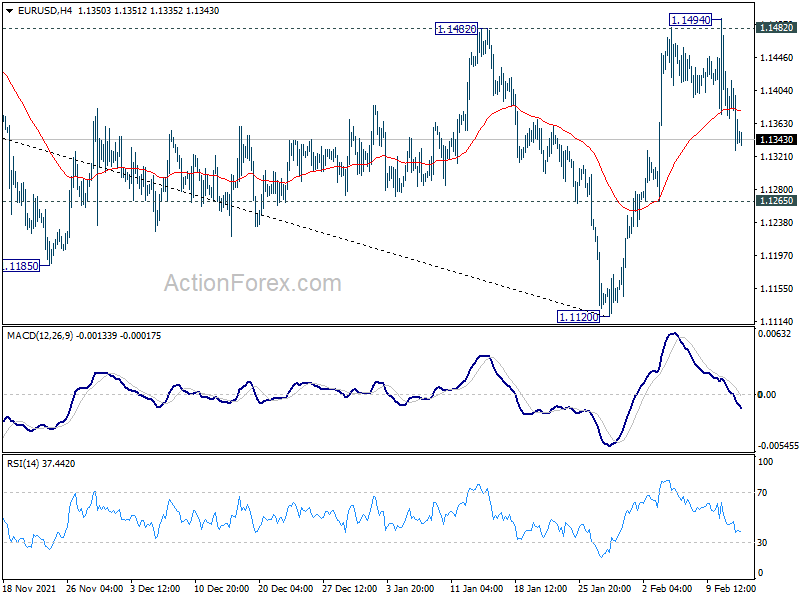
Daily Pivots: (S1) 1.1308; (P) 1.1370; (R1) 1.1409; More...
Intraday bias in EUR/USD remains neutral for the moment. Further rise will remain mildly in favor as long as 1.1265 minor support holds. On the upside break of 1.1482 will target 38.2% retracement of 1.2348 to 1.1120 at 1.1589 next. Sustained break there will argue that whole fall from 1.2348 has completed too and target 61.8% retracement at 1.1879. On the down, however, break of 1.1265 support will dampen this bullish view and bring retest of 1.1120 low instead.
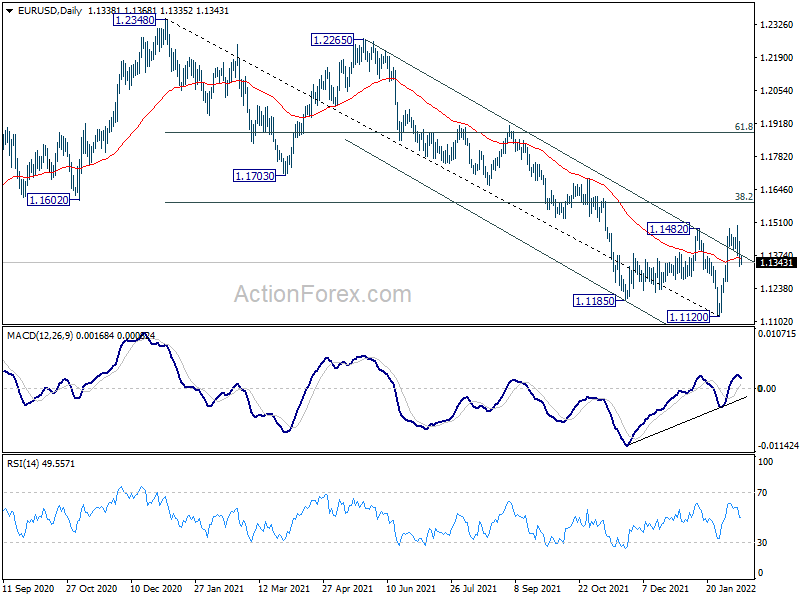
In the bigger picture, the decline from 1.2348 (2021 high) is seen as a leg inside the range pattern from 1.2555 (2018 high). Sustained trading above 55 week EMA (now at 1.1613) will argue that it has completed and stronger rise would be seen back towards top of the range between 1.2348 and 1.2555. However, firm break of 1.0635 (2020 low) will raise the chance of long term down trend resumption and target a retest on 1.0339 (2017 low) next.
GBP/USD Daily Outlook
Daily Pivots: (S1) 1.3515; (P) 1.3562; (R1) 1.3609; More...
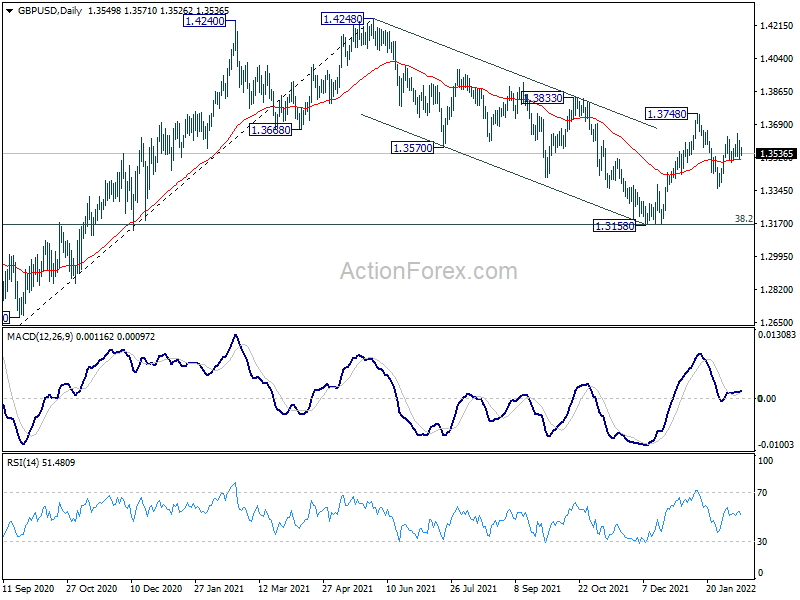
Intraday bias in GBP/USD remains neutral for the moment. On the upside, break of 1.3642 will resume the rebound to 1.3748 resistance. Firm break there will revive the bullish case that correction from 1.4248 has completed with three waves down to 1.3158. Further rally should then be seen to retest 1.4248 high. On the downside, however, break of 1.3356 will bring retest of 1.3158 low.
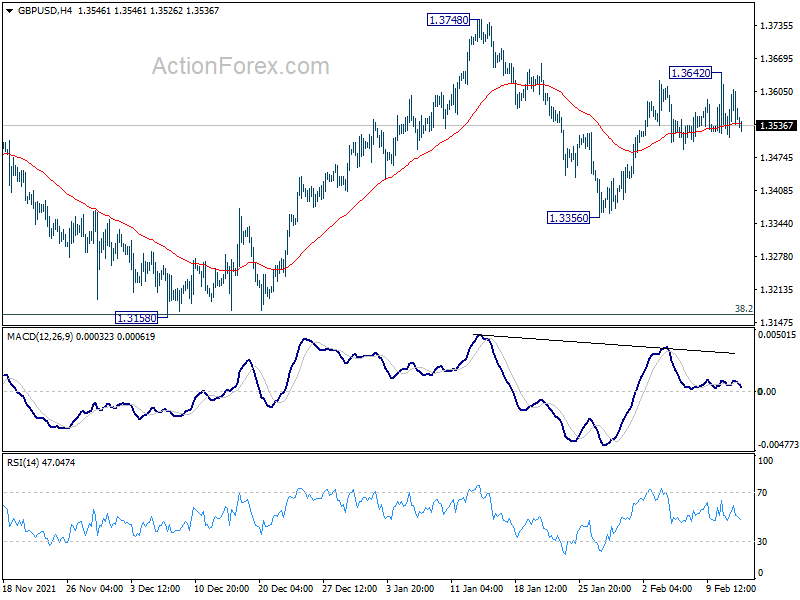
In the bigger picture, as long as 38.2% retracement of 1.1409 to 1.4248 at 1.3164 holds, up trend from 1.1409 (2020 low) is still in progress. On resumption, next target will be 38.2% retracement of 2.1161 to 1.1409 at 1.5134. Nevertheless sustained break of 1.3164 will argue that whole rise from 1.1409 has completed and bring deeper fall to 61.8% retracement at 1.2493.