Sample Category Title
EUR/USD Consolidates in Mid-February
The major currency pair is consolidating in mid-February. On Monday, 14 February 2022, the asset is trading at 1.1340.
Investors are still impressed by the January inflation data from the US. The CPI showed 7.5% y/y – the reading no one has seen in over 40 years. Inflation higher than expected gives the US Fed the ground to raise the rate and reduce its own balance quickly and without any limitations.
On Monday, the Fed is planning to have a meeting and discuss the reserve rate and other aspects. However, the regulator is not expected to discuss the benchmark rate so far.
The thing that intrigues market players the most is the number of rate hikes in 2022. As of now, consensus projections suggest from 4 to 6.
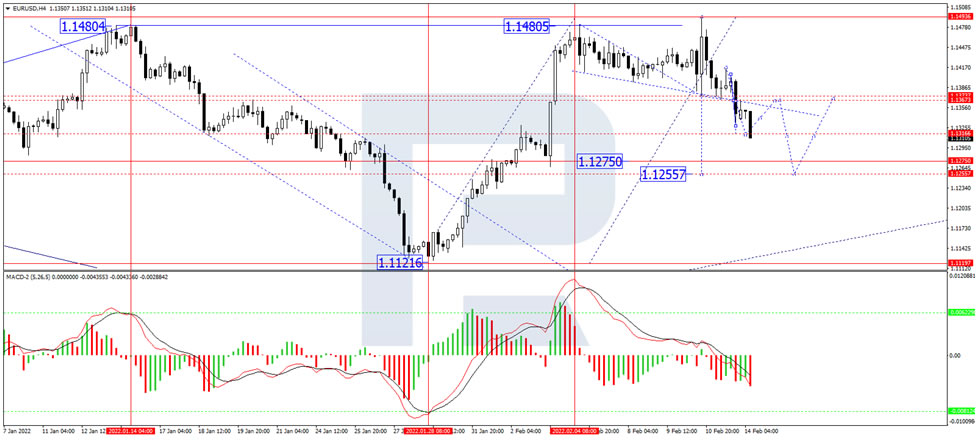
In the H4 chart, having finished another descending wave at 1.1316, EUR/USD is expected to start a new correction towards 1.1370. After that, the instrument may resume falling to reach 1.1280 or even extend this wave down to 1.1255. From the technical point of view, this scenario is confirmed by MACD Oscillator: its signal line is falling below 0 and may continue moving towards new lows.
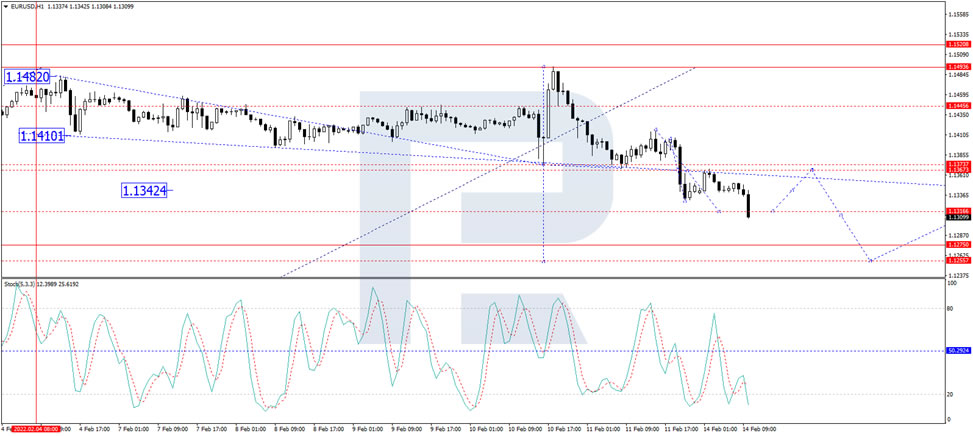
As we can see in the H1 chart, after rebounding from 1.1417, EUR/USD is forming the second descending structure to break 1.1316 and may later correct towards 1.1370. After that, the instrument may resume falling with the target at 1.1310 or even extend this structure down to 1.1255. From the technical point of view, this idea is confirmed by the Stochastic Oscillator: its signal line is moving above 20 and may continue growling to reach 50. Later, the line may rebound from 50 and resume falling to reach 20.
USD/JPY Mid-Day Outlook
Daily Pivots: (S1) 114.91; (P) 115.55; (R1) 116.07; More...
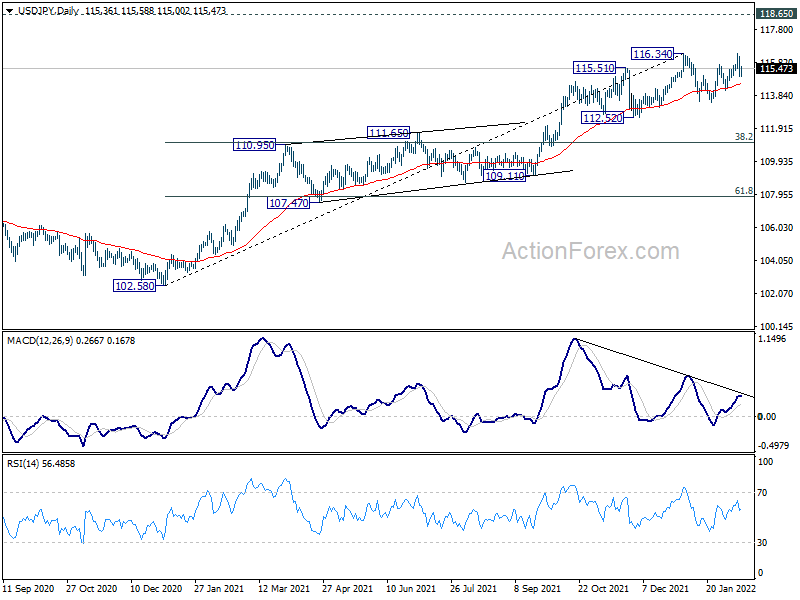
Intraday bias in USD/JPY stays mildly on the downside for the moment. Corrective pattern from 116.34 is in its third leg. Deeper fall would be seen to 114.14 support first. Break will target 113.46 next. On the upside, firm break of 116.34 will resume larger up trend from 102.58. Next target is 118.65 long term resistance.
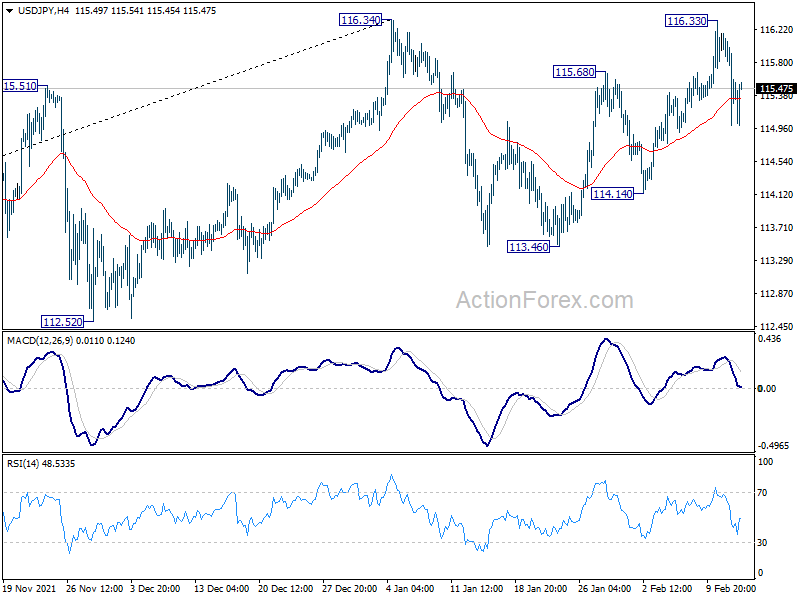
In the bigger picture, no change in the view that rise from 102.58 is the third leg of the up trend from 101.18 (2020 low). Such rally should target a test on 118.65 (2016 high). Sustained break there will pave the way to 120.85 (2015 high) and raise the chance of long term up trend resumption. This will remain the favored case as long as 55 week EMA (now at 111.21) holds.
USD/CHF Mid-Day Outlook
Daily Pivots: (S1) 0.9226; (P) 0.9256; (R1) 0.9274; More....
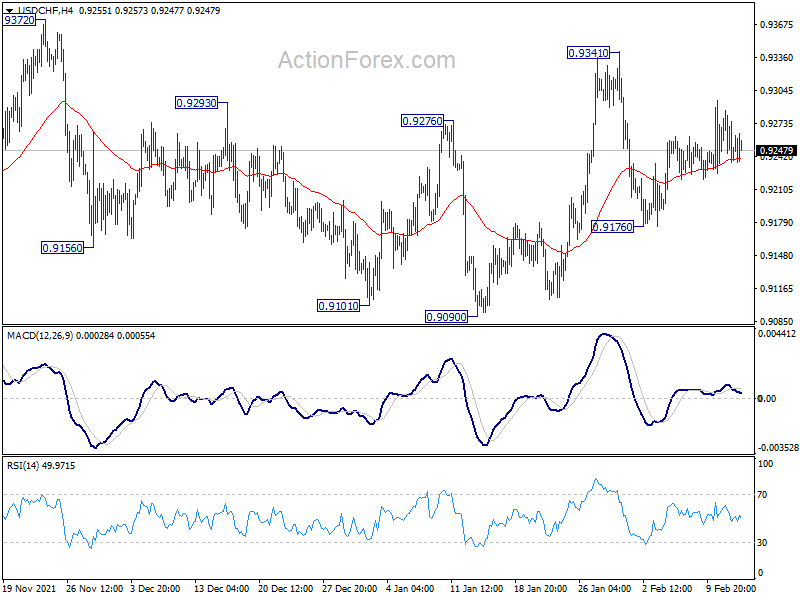
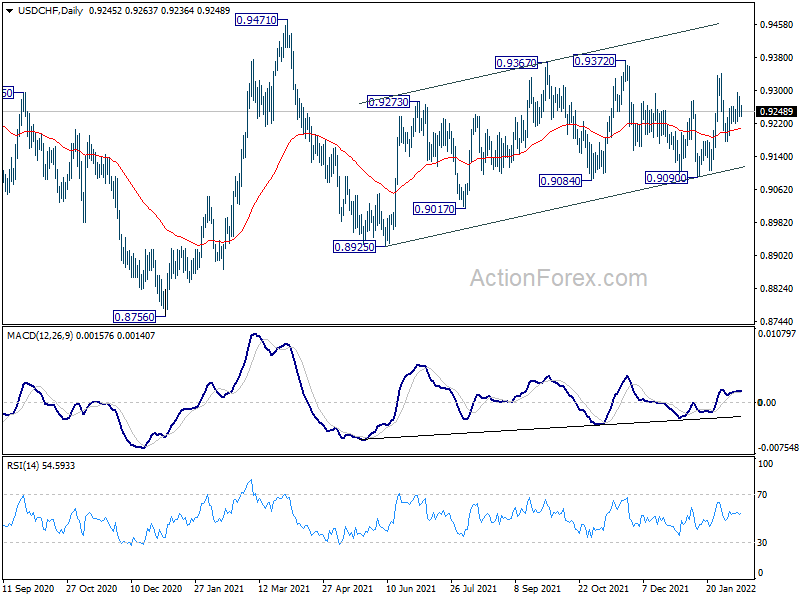
Range trading continues in USD/CHF and intraday bias remains neutral for the moment. Overall, further rally is mildly in favor as long as 0.9090 support holds. On the upside, break of 0.9372 will resume the choppy rally from 0.8925 to 0.9471 high. However, break of 0.9090 will turn bias back to the downside for 0.8925 support instead.
In the bigger picture, medium term outlook will be neutral at best as long as 0.9471 resistance holds. Larger down trend could still extend through 0.8756 (2021 low). However, firm break of 0.9471 will argue that the trend has already reversed and rebound the rally from 0.8756 with another impulsive move.
GBP/USD Mid-Day Outlook
Daily Pivots: (S1) 1.3515; (P) 1.3562; (R1) 1.3609; More...
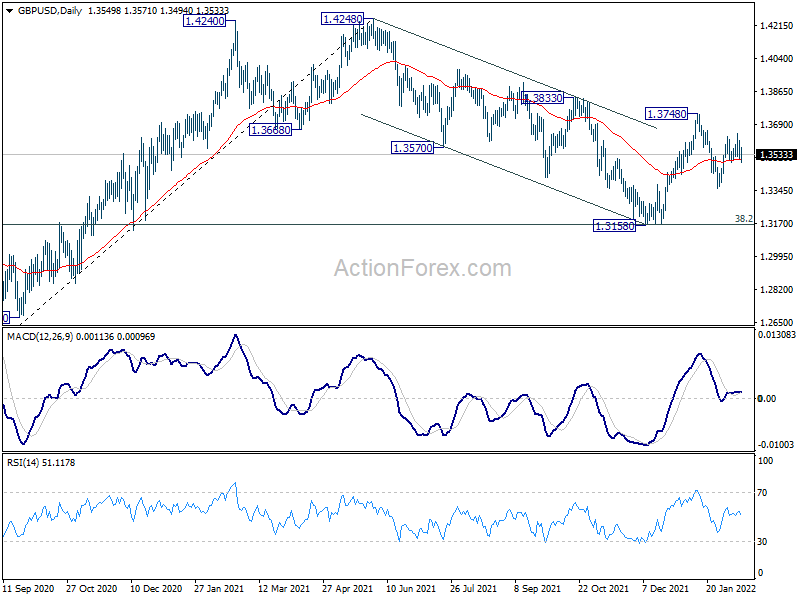
Intraday bias in GBP/USD remains neutral as range trading continues. On the upside, break of 1.3642 will resume the rebound to 1.3748 resistance. Firm break there will revive the bullish case that correction from 1.4248 has completed with three waves down to 1.3158. Further rally should then be seen to retest 1.4248 high. On the downside, however, break of 1.3356 will bring retest of 1.3158 low.
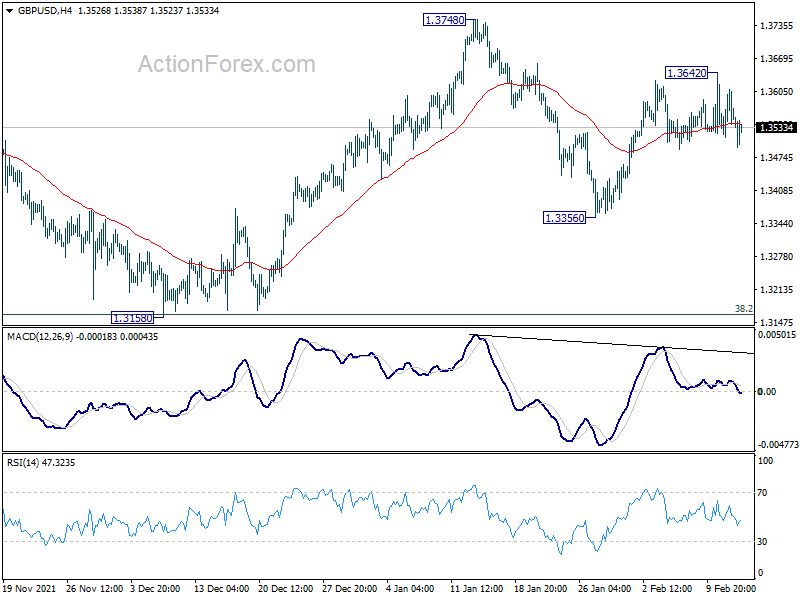
In the bigger picture, as long as 38.2% retracement of 1.1409 to 1.4248 at 1.3164 holds, up trend from 1.1409 (2020 low) is still in progress. On resumption, next target will be 38.2% retracement of 2.1161 to 1.1409 at 1.5134. Nevertheless sustained break of 1.3164 will argue that whole rise from 1.1409 has completed and bring deeper fall to 61.8% retracement at 1.2493.
EUR/USD Mid-Day Outlook
Daily Pivots: (S1) 1.1308; (P) 1.1370; (R1) 1.1409; More...
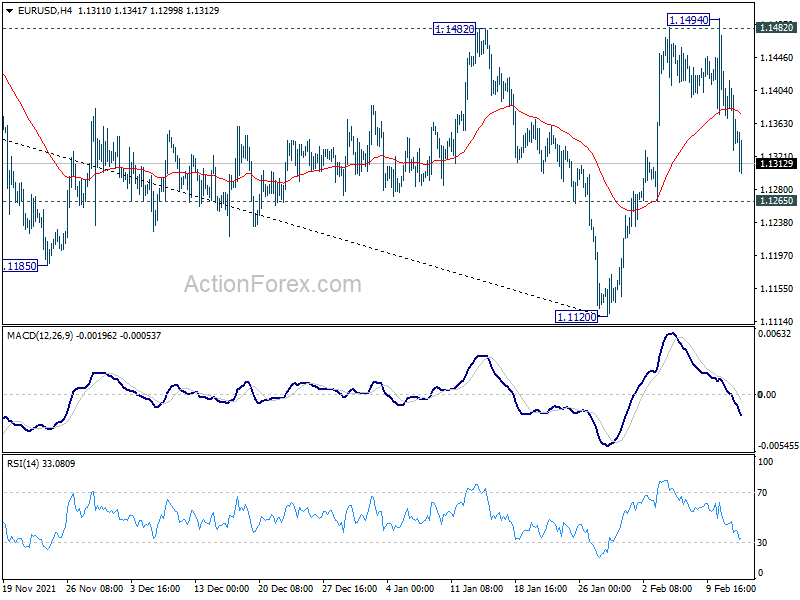
Intraday bias in EUR/USD remains neutral and outlook is unchanged. Further rise will remain mildly in favor as long as 1.1265 minor support holds. On the upside break of 1.1482 will target 38.2% retracement of 1.2348 to 1.1120 at 1.1589 next. Sustained break there will argue that whole fall from 1.2348 has completed too and target 61.8% retracement at 1.1879. On the down, however, break of 1.1265 support will dampen this bullish view and bring retest of 1.1120 low instead.
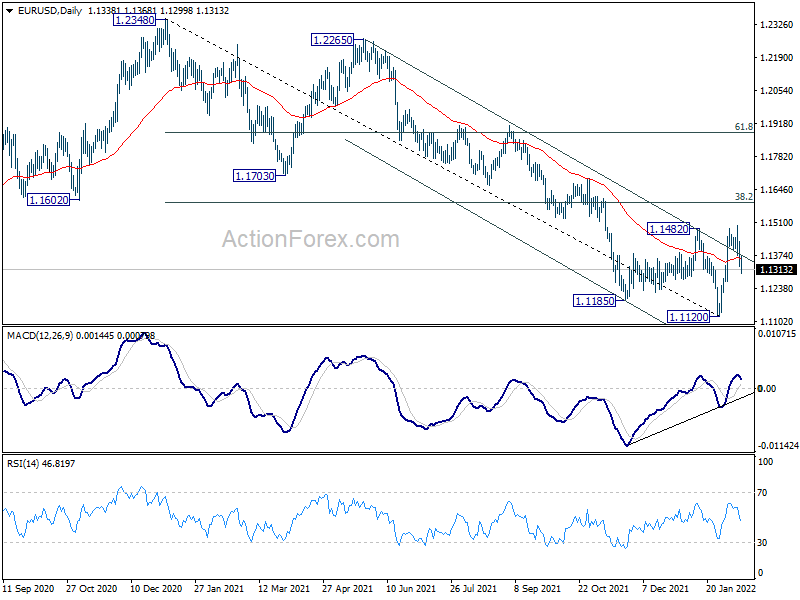
In the bigger picture, the decline from 1.2348 (2021 high) is seen as a leg inside the range pattern from 1.2555 (2018 high). Sustained trading above 55 week EMA (now at 1.1613) will argue that it has completed and stronger rise would be seen back towards top of the range between 1.2348 and 1.2555. However, firm break of 1.0635 (2020 low) will raise the chance of long term down trend resumption and target a retest on 1.0339 (2017 low) next.
Yen Takes a Breather after Lavrov Comments, Dollar Firm
While risk aversion still dominates, sentiments appeared to be lifted by comments from Russian Foreign Minister Sergei Lavrov. In a televised exchanged, Lavrov told President Vladimir Putin, "I must say there are always chances... It seems to me that our possibilities are far from exhausted... At this stage, I would suggest continuing and building them up." US futures are staging a u-turn after the comments while European indexes recovered some ground.
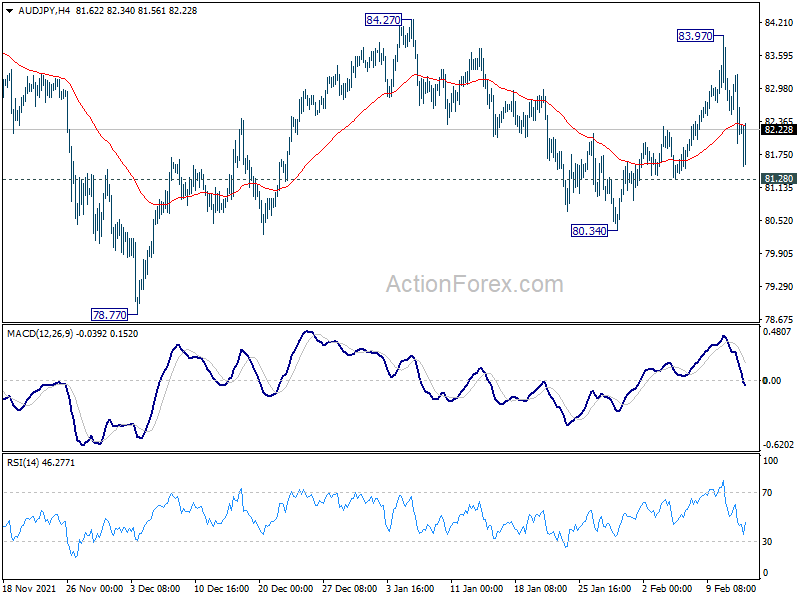
In the currency markets, Dollar is currently the strongest one for today, followed by Yen which is retreating slightly. New Zealand Dollar is the worst performing one, followed by Sterling and then Euro. Technically, there is no clear development yet. But attention will be paid to some levels in Yen crosses including 155.11 minor support in GBP/JPY, and 81.28 minor support in AUD/JPY. Break of these levels will argue that Yen buying is picking up momentum again.
In Europe, at the time of writing, FTSE is down -1.41%. DAX is down -2.21%. CAC is down -2.33%. Germany 10-year yield is down -0.046 at 0.253. Earlier in Asia, Nikkei dropped -2.23%. Hong Kong HSI dropped -1.41%. China Shanghai SSE dropped -0.98%. Singapore Strait Times dropped -0.23%. Japan 10-year JGB yield dropped -0.0117 to 0.218.
Fed George: We have got to get to neutral really fast
In a WSJ interview, Kansas City Fed Esther George said that with inflation at at 7.5% in January, and the benchmark interest a rate near zero, Fed's policy is "out of sync". But she said it's too soon to say if Fed should hike by 50bps in March. She also hasn't form a view on how much interest rate has to go up this year.
"What we have to do is be systematic," George said. "It is always preferable to go gradual…Given where we are, the uncertainties around the pandemic effects and other things, I'd be hard-pressed to say we have got to get to neutral really fast."
"If we get to March and the data says we should be talking about that [a half-point rate increase], I'm sure that will be in play, but I'm not sure that is the answer, per se, to how we get there," George added.
She also dismissed the idea of holding an emergency FOMC meeting to raise interest rate. "I don't know that I'd call the markets reacting to data an emergency here, because frankly, in my own forecast of looking where inflation was moving, the print was not a surprise," she said.
Nikkei lost -2.2% on risk aversion, heading back to 26k first
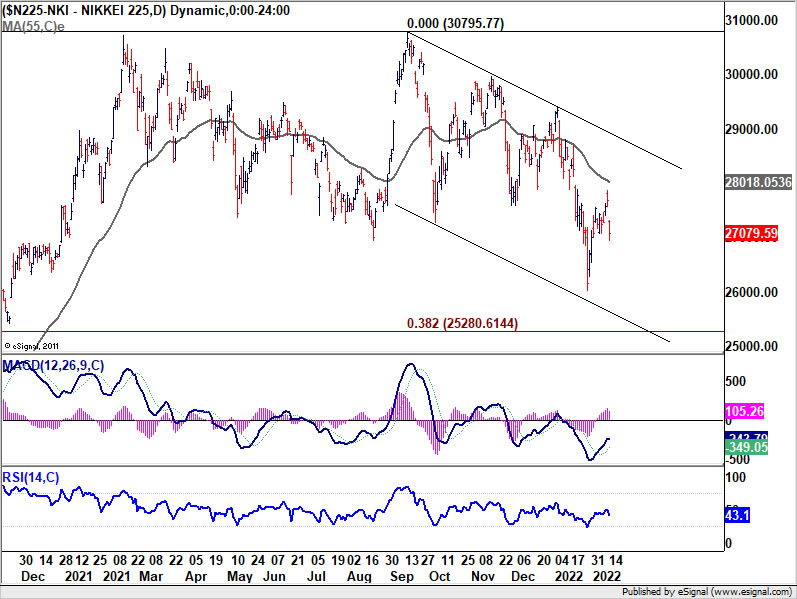
Markets are generally staying in risk-off mode today as there is no sign of de-escalation in Russia-Ukraine situation. Nikkei tumbled sharply by -616.49 pts, or -2.23%, to close at 27079.59.
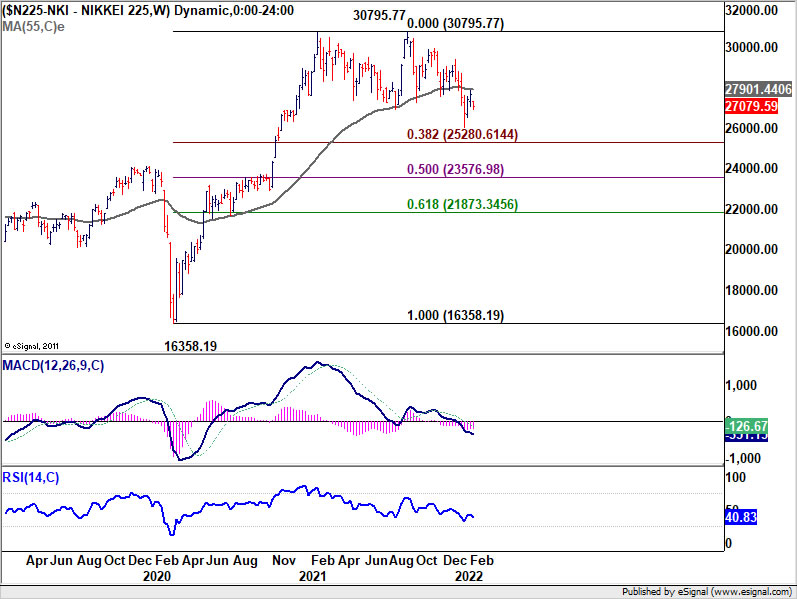
Near term bearishness in Nikkei remains after rejection by 55 day EMA. The choppy decline from 30795.77 is in progress for retesting 26044.52 low. But, the major line of defense is at 38.2% retracement of 16358.9 to 30795.77 at 25280.61. We'd expect strong support from there to bring rebound.
However, the rejection by 55 week EMA is also a medium term bearish sign, which argues that the fall from 30795.77, as a correction to the up trend from 16358.19, might last longer than originally expected. Indeed, sustained break of 25280.61 could send Nikkei further to the zone between 50% retracement at 23576.98 and 61.8% retracement at 21873.34 before bottoming.
New Zealand BNZ services dropped to 45.9, lowest since Oct
New Zealand BusinssNZ Performance of Services index dropped -3.9 to 45.9 in January. That was the lowest result since October 2021. Looking at some details, activity/sales dropped sharply from 50.7 to 44.1. Employment ticked down from 49.1 to 48.1. New orders/businesses dropped deeply from 52.0 to 41.8. Stocks/inventories dropped from 51.0 to 47.6. Supplier deliveries also tumbled from 49.8 to 43.6.
BNZ Senior Economist Craig Ebert said that "the PSI can jag around quite a lot from month to month – upwards and downwards. However, it's also worth pointing out that the long-term average of the PSI is 53.6, which is starting to feel some distance away. So much for the new traffic light system releasing the brakes on activity."
EUR/USD Mid-Day Outlook
Daily Pivots: (S1) 1.1308; (P) 1.1370; (R1) 1.1409; More...
Intraday bias in EUR/USD remains neutral and outlook is unchanged. Further rise will remain mildly in favor as long as 1.1265 minor support holds. On the upside break of 1.1482 will target 38.2% retracement of 1.2348 to 1.1120 at 1.1589 next. Sustained break there will argue that whole fall from 1.2348 has completed too and target 61.8% retracement at 1.1879. On the down, however, break of 1.1265 support will dampen this bullish view and bring retest of 1.1120 low instead.
In the bigger picture, the decline from 1.2348 (2021 high) is seen as a leg inside the range pattern from 1.2555 (2018 high). Sustained trading above 55 week EMA (now at 1.1613) will argue that it has completed and stronger rise would be seen back towards top of the range between 1.2348 and 1.2555. However, firm break of 1.0635 (2020 low) will raise the chance of long term down trend resumption and target a retest on 1.0339 (2017 low) next.
Economic Indicators Update
| GMT | Ccy | Events | Actual | Forecast | Previous | Revised |
|---|---|---|---|---|---|---|
| 07:30 | CHF | Producer and Import Prices M/M Jan | 0.60% | 0.10% | -0.10% | |
| 07:30 | CHF | Producer and Import Prices Y/Y Jan | 5.40% | 5.60% | 5.10% |
NZDUSD Elliott Wave : Selling The Rallies At The Blue Box
In this technical blog we’re going to take a quick look at the Elliott Wave charts of NZDUSD. The pair has reached extremes in the cycle from the February 2021 peak. However cycle from the October 21st 2021 peak still shows incomplete sequences. Besides that, AUDUSD and USDCAD still have not reached their extremes in equivalent cycles, which suggested potential extension down in NZDUSD. As our members know, NZDUSD has given us nice selling opportunity recently. The pair has made 3 waves bounce against the 0.6892 peak. We recommended members to avoid buying and keep selling rallies in 3,7,11 swings. In the further text we are going to explain the Elliott Wave Pattern and the Forecast.
NZDUSD H4 Elliott Wave Analysis 02.09.2022
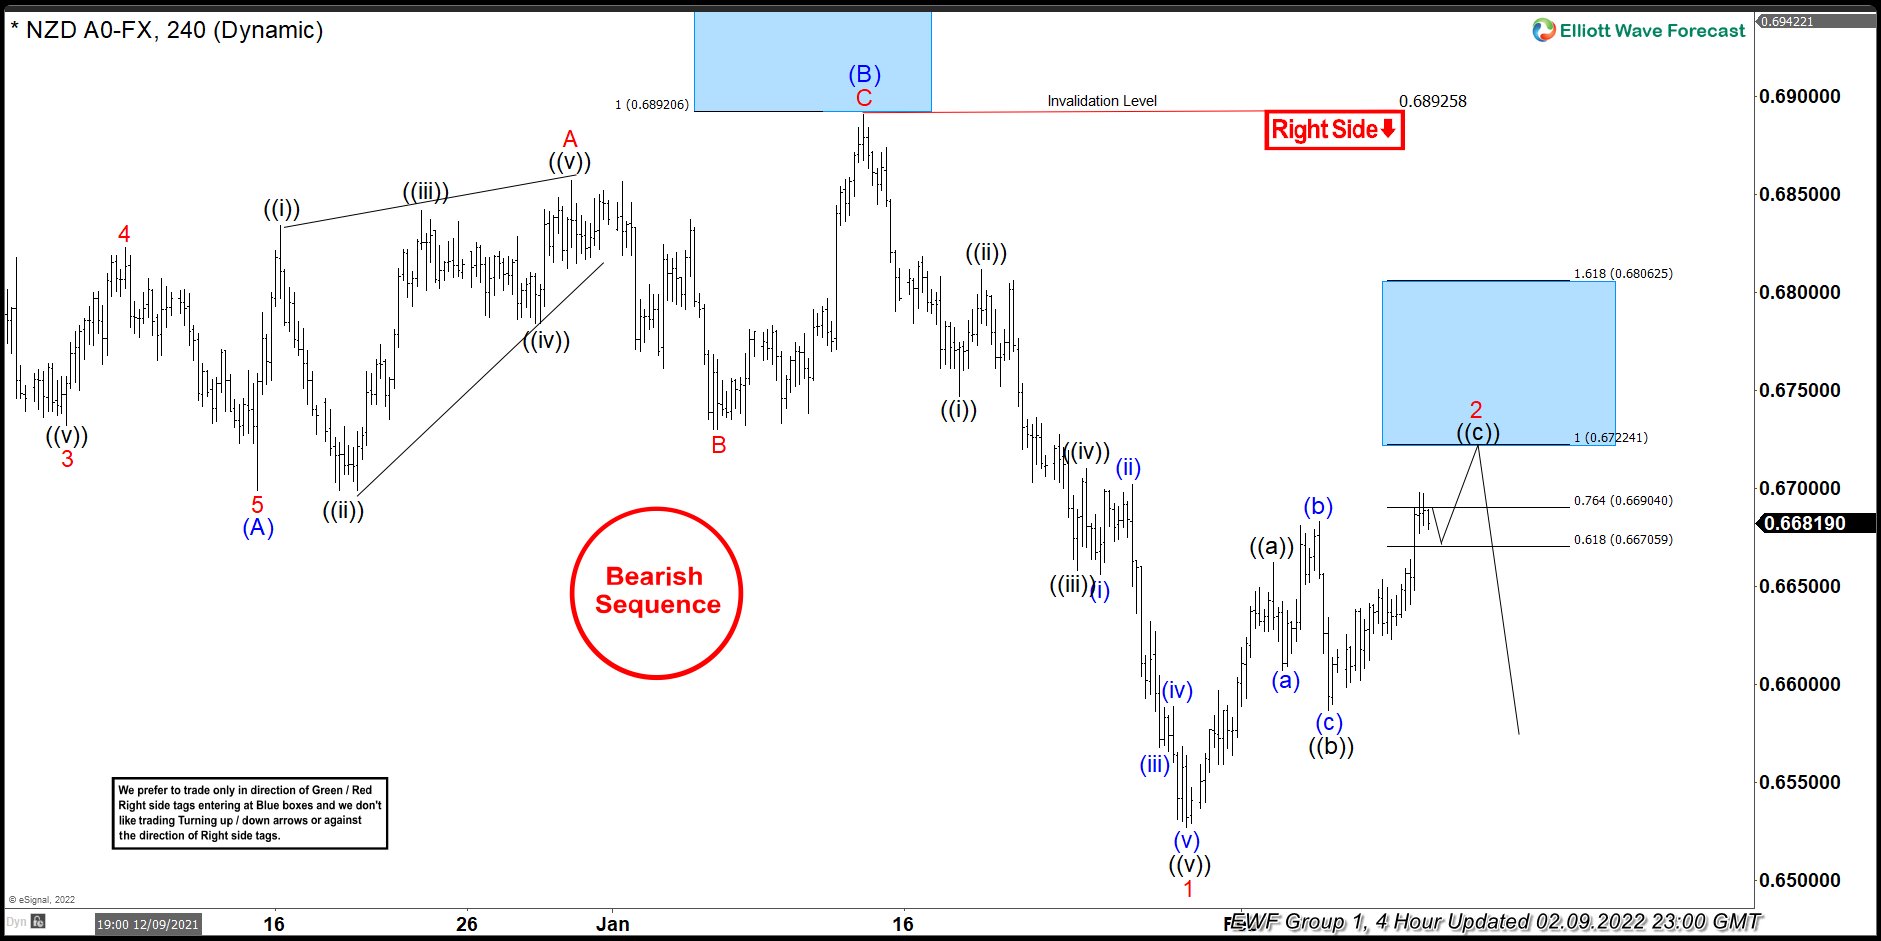
NZDUSD is correcting the cycle from the 0.6892 peak. Recovery shows higher high- incomplete sequences at the moment. Consequently we are calling for more short term strength toward 0.67224-0.6806 area to complete 2 red as potential Elliott Wave Zig Zag pattern. We recommended members to avoid buying the pair in proposed push up. Strategy is waiting for Blue Box to be reached before selling the pair again. As the main trend is bearish we expect sellers to appear at the blue box for 3 waves pull back at least. Once pull back reaches 50 Fibs against the ((b)) black low, we will make short position risk free ( put SL at BE). Invalidation for the trade would be break above 1.618 fibs extension: 0.6806
As our members know Blue Boxes are no enemy areas , giving us 85% chance to get a pull back.
Now let’s take a look at H1 charts, to see what the price structure looks like in shorter time frames.
NZDUSD H1 Elliott Wave Analysis 02.12.2022
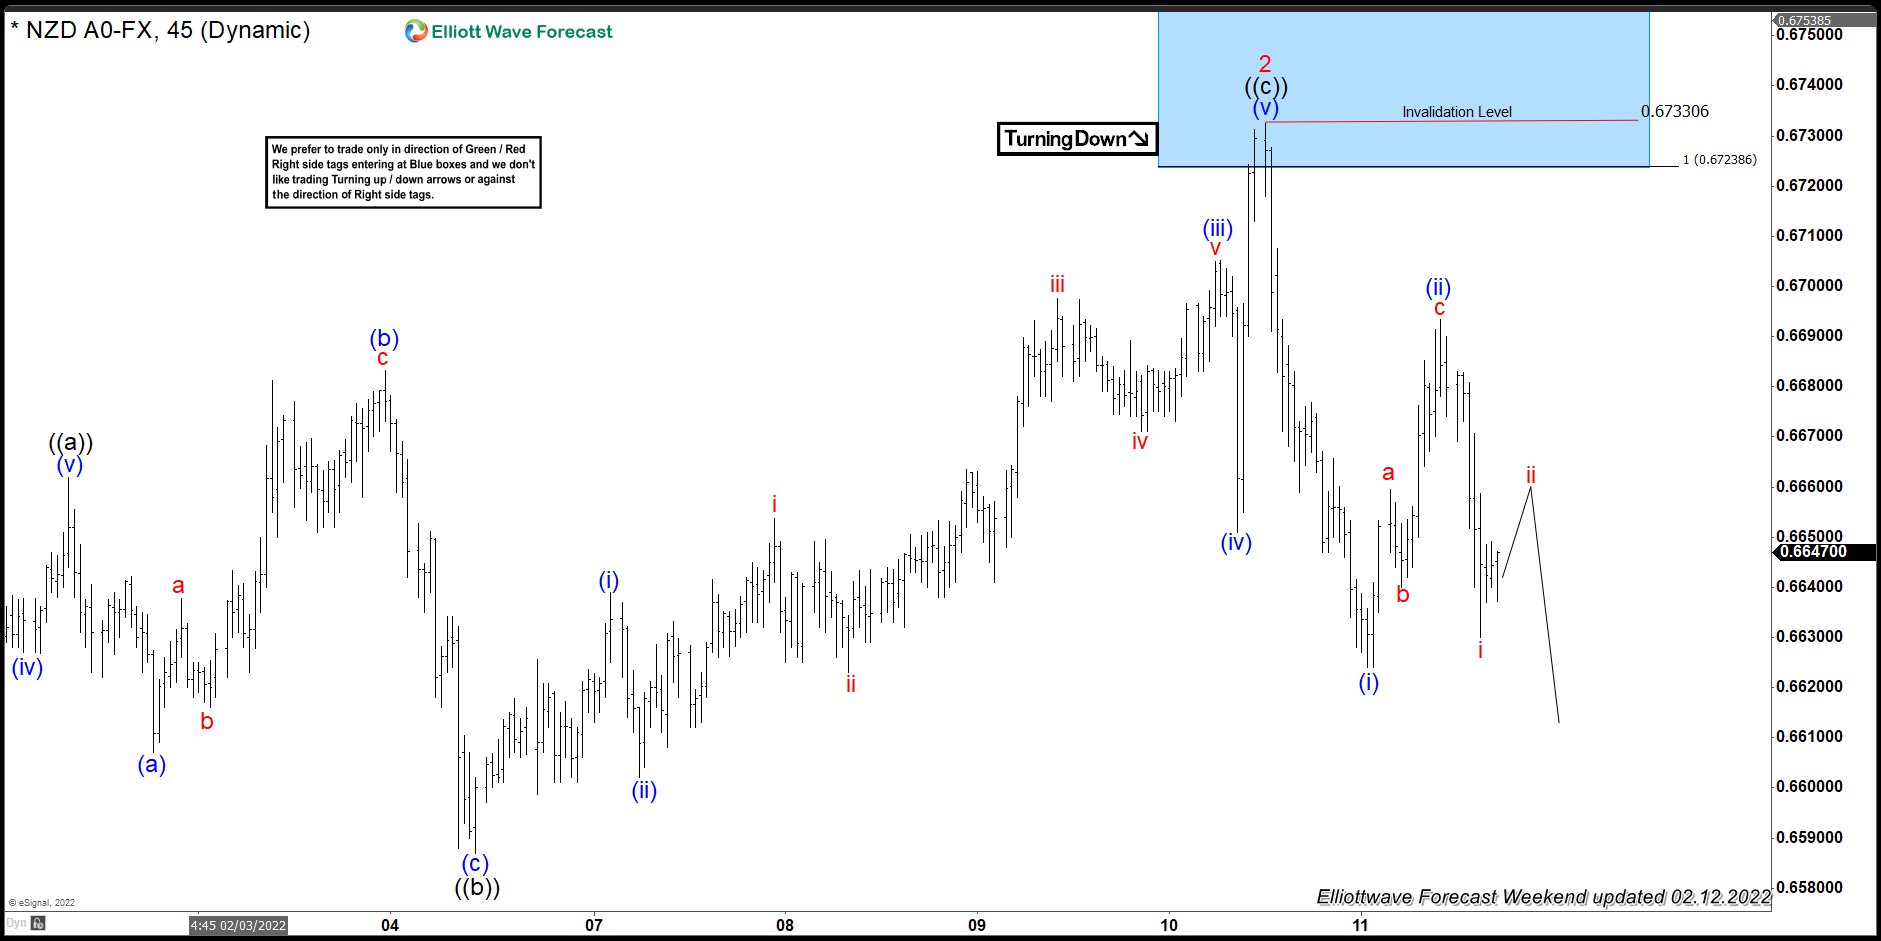
The pair reached equal legs area at 0.67224-0.6806 ( blue box) and made turn lower from there. At this stage we are calling recovery completed at 0.6733 high. Short term cycle from the mentioned peak ended as 5 waves decline- (i) blue. Then, we got 3 waves bounce in (ii) blue. Now we would like to see break of (i) blue low, to confirm further extension down and more separations from the latest high. The decline has already reached 50 fibs against the ((b)) black connector, so all short positions from the blue box are risk free. (SL put at BE)
NZDUSD H1 Elliott Wave Analysis 02.14.2022
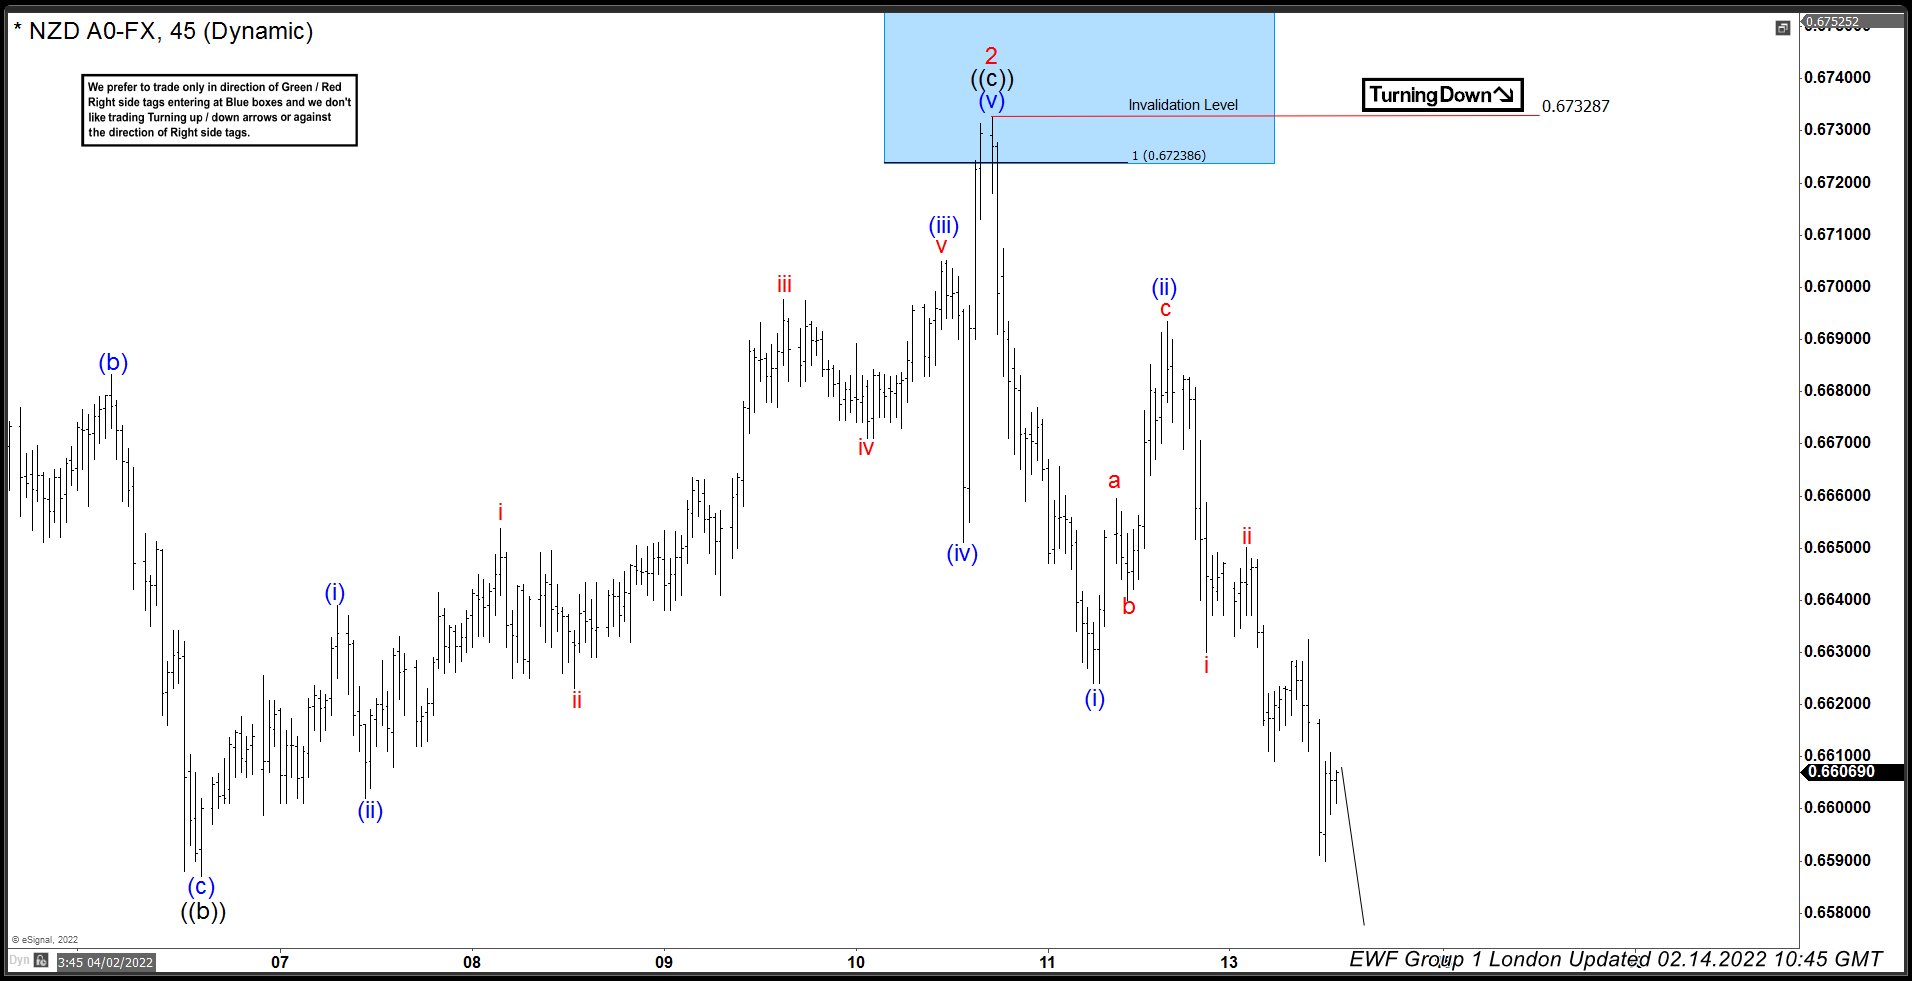
Eventually NZDUSD made further extension down and broke (i) blue low. While (ii) blue peak holds, xext short term tech zone to the downside comes at 0.6586-0.6521. We would like to see break of 01/28 low to confirm next leg down is in progress.
Keep in mind market is dynamic and presented view could have changed in the mean time. You can check most recent charts in the membership area of the site. Best instruments to trade are those having incomplete bullish or bearish swings sequences.We put them in Sequence Report and best among them are shown in the Live Trading Room.
USD/CAD Eyes More Upside: Elliott Wave Analysis
Stocks are coming down at the start of the European sessions due to geopolitical uncertainties over Ukraine. We see USD moving higher at the same time. Even crude oil has slowed down which can be bullish for the buck as well. We see energy in a potential higher degree irregular/flat correction as structure from 87.56 can be in three waves. An overlap with 90.73 would be another indication that energy will stay sideways for a flat. Nice support should then be at 87.56. If crude would really come south, then USDCAD can see more upside ahead.
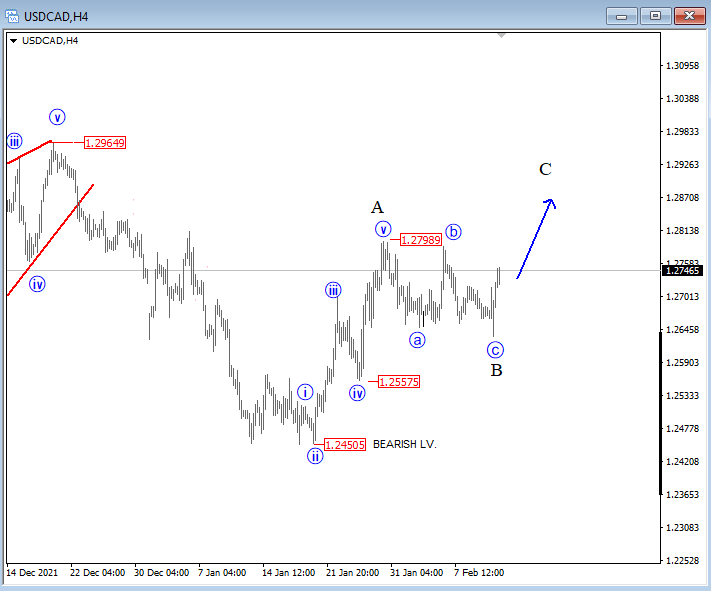
USDCAD made five waves up from 1.2450 to 1.2800 as shown on the 4h chart, followed by a three-wave pullback that we see as wave B, so we think that recovery is incomplete, and that third leg up can be coming towards 1.2850/1.29 area in the short-term.
USD/CAD 4h Elliott Wave analysis
Aussie Weakens as Risk Appetite Slides
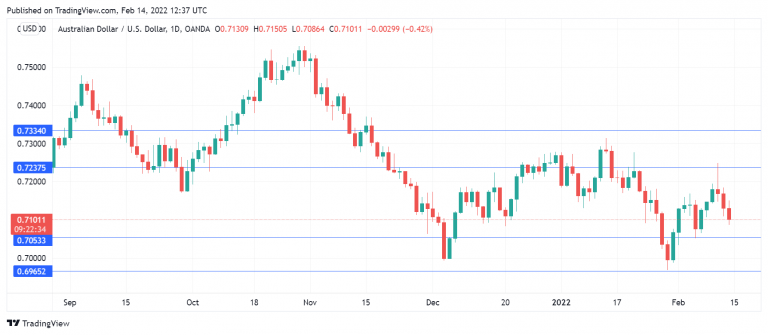
The Australian dollar slide continues. AUD/USD is down 0.53% at the start of the week and has fallen below the 0.71 level.
Ukraine crisis at fever pitch
War in Europe? The crisis on the Ukraine/Russia border shows no signs of easing, as hopes for a diplomatic solution have not borne fruit. German President Olaf Scholz is in Kyiv and will travel to Moscow for a last-ditch effort to reach some agreement that would prevent a Russian invasion. The US has said Russia might invade as early as Wednesday and the situation remains extremely volatile.
Global equity markets have taken a beating on invasion jitters and oil prices are fast approaching the USD 100 level. On the forex front, the safe-haven US dollar continues to post broad gains as investors are shunning high beta currencies and snapping up safer assets. This is putting strong pressure on the Australian dollar, which is a risk-sensitive currency.
The Aussie is also under pressure as the dovish RBA continues to diverge from market expectations, which is leading to an increase in short positions. The markets have priced in a rate hike before the end of the year, while RBA Governor Lowe has said that the central bank has no plans to raise rates prior to 2023.
In the US, the hot inflation report last week has the markets focused on the number of rate hikes the Fed will deliver this week. The range is from 3-7 hikes, which means there is plenty of uncertainty, and it’s likely that even the Fed hasn’t finalized a course of action. A rate hike next month is a virtual certainty, but the size of the increase is still up in the air, with the likelihood of a 0.50% jumping since the inflation release, which showed that inflation accelerated to 7.5% in January, up from 7.0% beforehand.
AUD/USD Technical
- AUD/USD continues to rally and is testing resistance at 0.7168. Above, there is resistance at 0.7258
- There is support at 0.6987 and 0.6896
XAU/USD Outlook: Gold Remains Well Supported by Overheated Geopoliticals
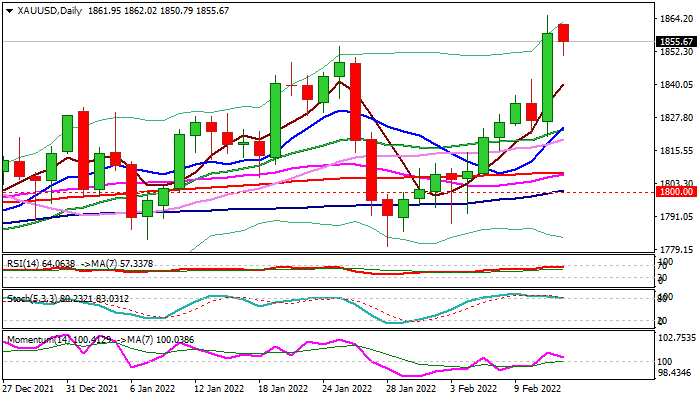
Spot gold price eases from new three month high ($1865) posted last Friday when the metal price rose 1.75% (the biggest one-day advance since 13 Oct 2021).
Overall structure remains firmly bullish as rising tensions over Ukraine continue to boost demand for safe-haven gold.
Bulls are likely to consolidate before resuming higher for attack at $1875/77 targets (50% retracement of $2074/$1676 pullback), violation of which would spark acceleration through $1900 barrier and unmask next Fibo level at $1922 (61.8%).
Probe through the bear-trendline off $2074 record high (at $1846) adds to bullish signals.
Shallow dips should ideally find ground at $1840 zone (rising 5DMA / near Fibo 23.6% of $1780/$1865 upleg) and offer better opportunities to re-enter bullish market and keep intact lower pivots at $1832 (Fibo 38.2% of 1780/$1865) and $1823 (converged 10/20DMA’s).
Res: 1865; 1877; 1881; 1900.
Sup: 1850; 1840; 1832; 1823.