

Sample Category Title
AUDUSD Aims for Recovery as Short-Term Decline Halts
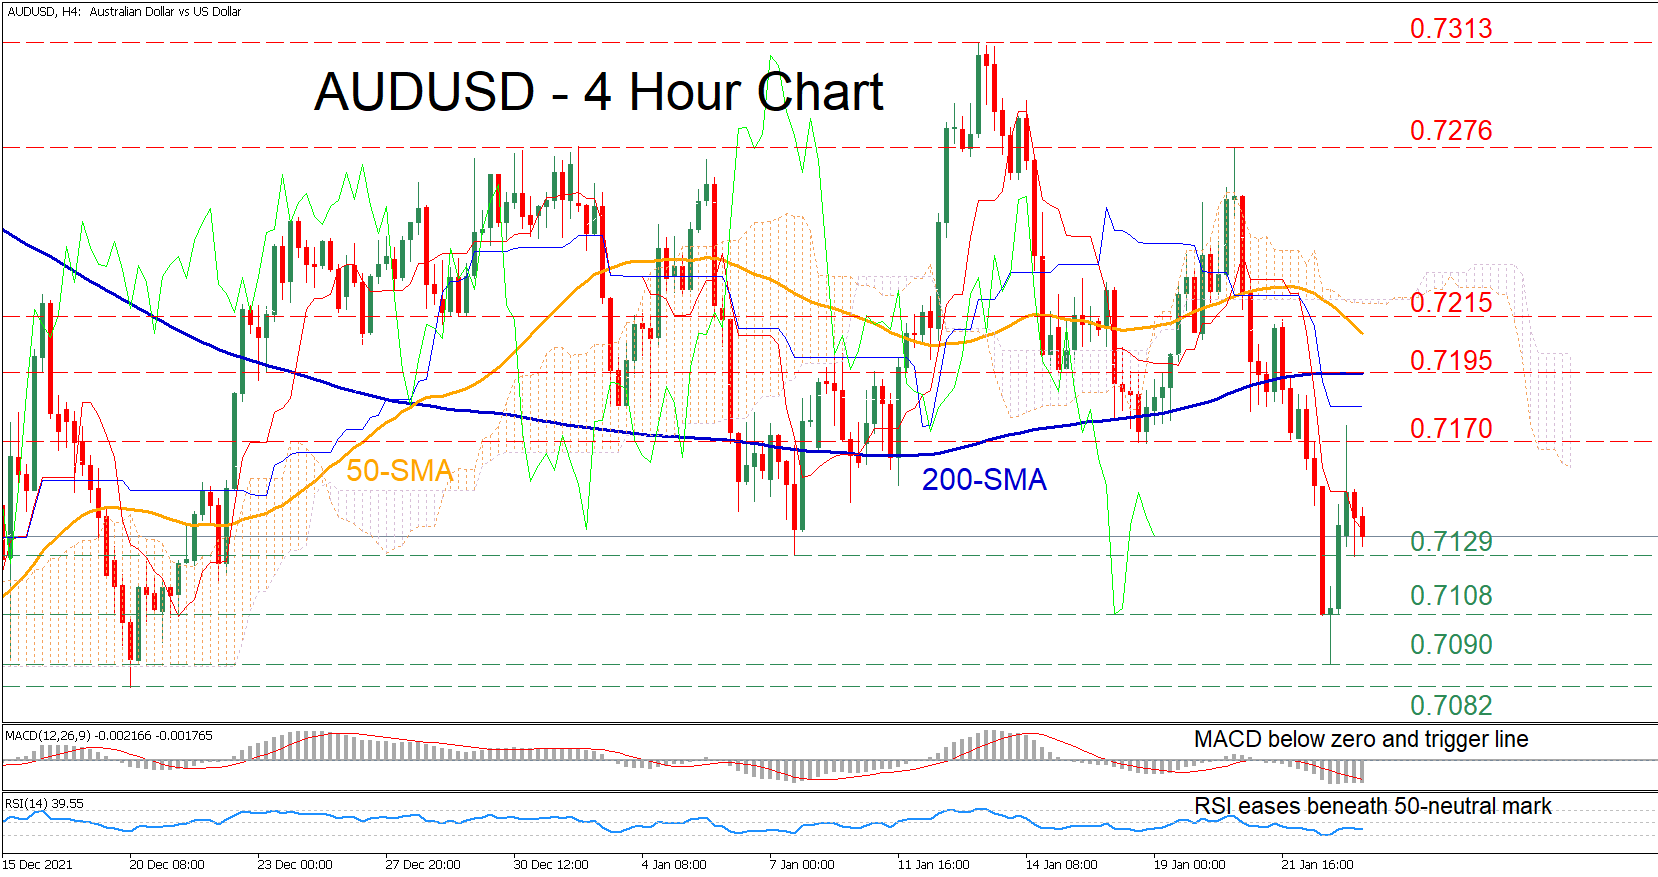
AUDUSD has experienced a sharp dip in the four-hour chart, crossing beneath both its 50- and 200-period simple moving averages (SMAs). However, the pair managed to partially bounce back after finding significant support at the 0.7090 level.
The ongoing rebound seems to be in danger as the short-term oscillators indicate that selling forces continue to have the upper hand. The MACD histogram remains below both zero and its red signal line, while the RSI is hovering in the negative zone. Moreover, the price is currently trading well beneath the Ichimoku cloud further endorsing the negative outlook.
Should the negative momentum intensify, the price might dip towards the recent low of 0.7129. Breaching this barrier, the bears could aim for the 0.7108 obstacle. Further downside pressure could send the price to test 0.7090.
On the flipside, if buyers manage to retake control, the price may meet initial resistance at the 0.7170 hurdle. Conquering this barricade, the spotlight would turn to the 0.7195 level, which overlaps with the 200-period SMA. Higher, the price might jump towards the 0.7215 region before it challenges 0.7276.
In brief, the outlook for AUDUSD remains negative despite the recent minor rebound. For that bearish tone to reverse, the price needs to profoundly cross above the 0.7276 region.
EURCHF Continues its Downtrend Move as Bearish Forces Linger
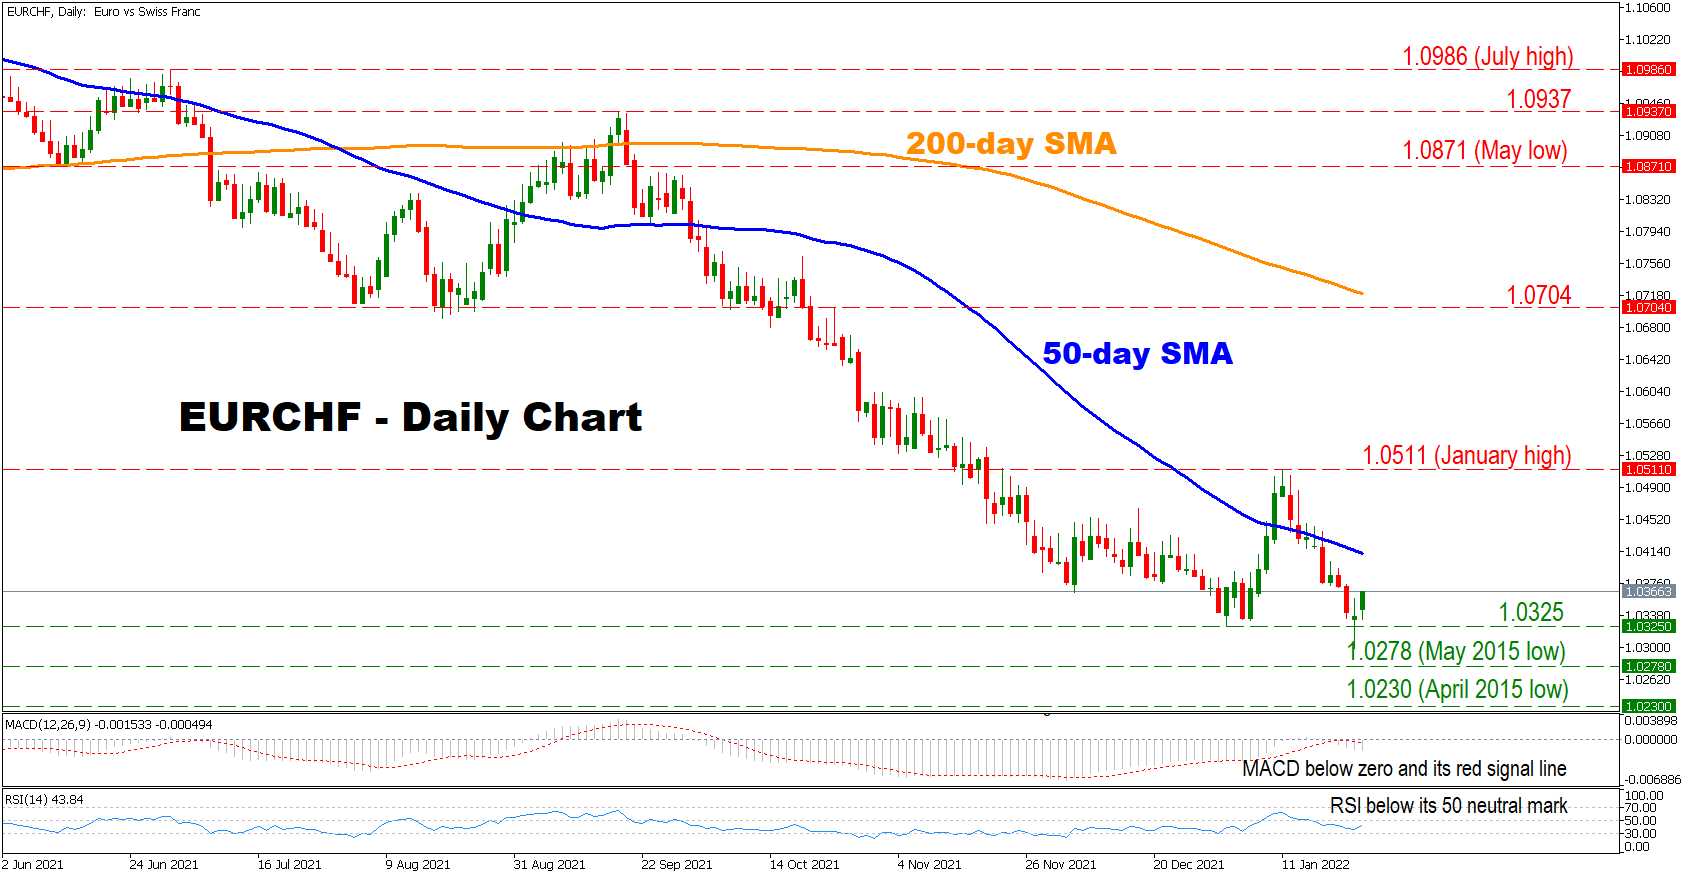
EURCHF continues its downward trend, marking yet more lower lows as negative forces linger. Moreover, the pair is currently trading well below its 50- and 200-day simple moving average (SMA), reflecting an overall bearish outlook.
Short-term momentum indicators are supporting a negative bias as the RSI is located below its 50 neutral mark. Also, the MACD is found below zero and its red signal line, which might indicate that the negative momentum is gaining further traction.
Should the bears maintain control, the first line of support might be found at the 1.0325 barrier. A decisive move below this level could intensify selling pressures, sending the price to test its crucial May 2015 low at 1.0278. A break below the latter could shift bears’ attention towards the April 2015 low at 1.0230.
On the flip side, initial resistance might be found at the 50-day SMA currently at 1.0412 before buyers shift their attention towards the January high at 1.0511. Crossing above this point could open the door towards the region which includes the 1.0704 obstacle and the 200-day SMA currently at 1.0723. A break above the latter could turn the fortunes around for the pair, sending the price to test its May low at 1.0871.
In brief, the overall outlook for the pair is bearish. For sentiment to change, buyers would need to break above the 200-day SMA.
Gold Technical Signals Flash Green; Trendline in Focus
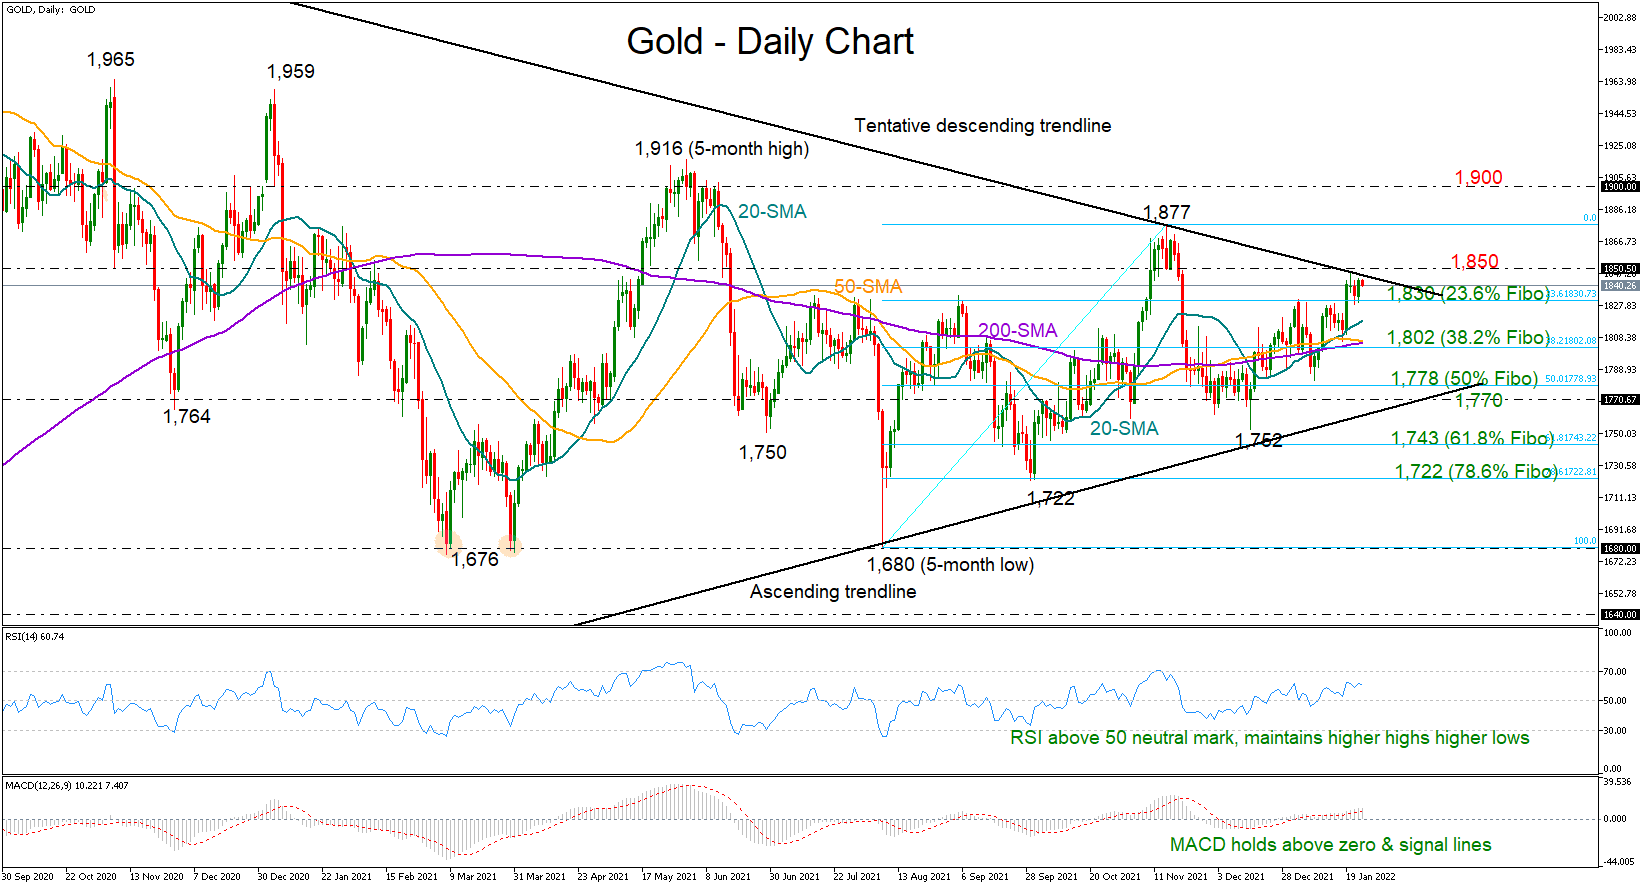
Gold shifted the spotlight to the descending trendline, which is connecting the all-time high of 2,079 from August 2020 with November’s 2021 peak of 1,877, following the break above the tough 1,830 ceiling.
The recent bullish double cross between the 20-day simple moving average (SMA) and the longer-term SMAs is promoting further progress in market trend, while the positive trajectory in the RSI and the MACD suggests an upside move in the price is more likely than a downside one.
Bullion, however, will need to successfully close above the resistance trendline and the 1,850 round-level to raise buying orders towards November’s top of 1,877. Running higher, the precious metal could face a critical test within the 1,900 – 1,916 region, a break of which would officially violate the long-term downtrend from the 2,079 record high, hopefully bringing the medium and long-term bulls into play as well.
Should the bearish scenario unfold, with the price pulling back below the 1,830 mark, the 20-day SMA could immediately attempt to block the way towards the 38.2% Fibonacci retracement of the 1,680 – 1,877 up leg at 1,800. Breaching the latter, the price will probably seek shelter around the 50% Fibonacci before it heads towards the long-term supportive trendline around 1,770. Failure to bounce here could see a more aggressive sell-off towards the 61.8% Fibonacci of 1,743.
In brief, Gold's technical signals continue to flash green despite its latest stabilization, with buyers eagerly waiting for a sustainable move above the resistance trendline and the 1,850 number to further raise exposure in the market.
S&P 500 Sinks into Correction ahead of Microsoft and Verizon Earnings
American stocks tumbled on Monday as worries over ongoing tensions between Russia and western countries escalated. In a statement, UK intelligence officials warned that Russia was targeting the Ukrainian capital in a “lightning war”. The statement came two days after the agency said that Russia was planning on installing a pro-Russian government in Ukraine. The UK and the US have ordered their diplomatic staff out of Ukraine while NATO has sent weapons to Ukraine. The Dow Jones index declined by over 900 points while the S&P 500 moved into the correction zone.
The US dollar tilted higher ahead of the upcoming consumer confidence data. The numbers are expected to show that consumer confidence declined from 115.8 in December to 111.8 in January. The decline will likely be because of the omicron variant and rising consumer inflation in the country. The data will come a day after Markit published relatively weak flash manufacturing and services PMI data. The two declined to 55.0 and 50.9 in January, respectively. The next key catalyst for the US dollar will be the latest Fed interest rate decision.
The earning season will continue today and have an impact on American equities. The top companies that will publish their earnings today are American Express, Xerox, Johnson & Johnson, Raytheon. Archer-Daniels-Midland, Lockheed Martin, Invesco, Verizon, and Microsoft. Most of these companies are expected to report strong quarterly results. At the same time, they are also expected to express concerns about wage inflation. Meanwhile, Ford announced that it was stopping new orders for the Maverick truck because it was straining to fill the backlog.
EURUSD
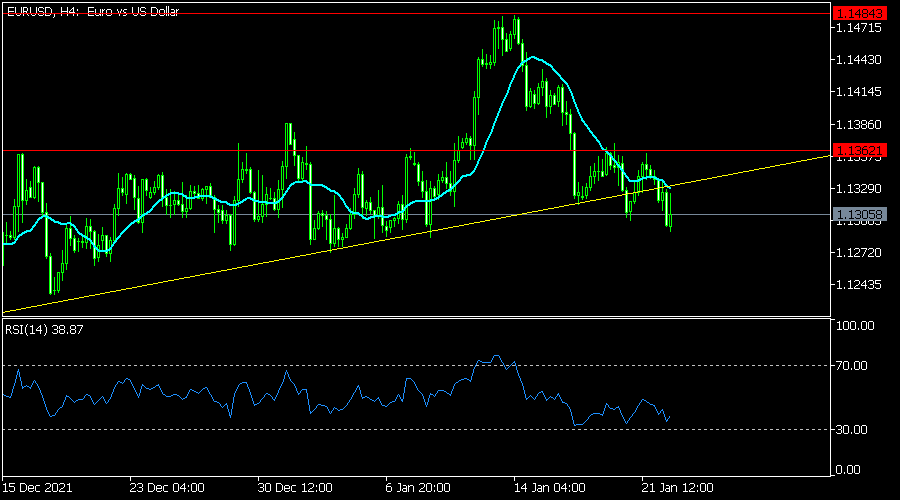
The EURUSD pair declined in the American and Asian sessions as investors rushed to the safety of the US dollar. The pair is trading at 1.1308, which is a few pips above yesterday’s low of 1.1290. On the four-hour chart, the pair has moved below the ascending trendline shown in yellow. It has also moved slightly below the 25-day moving average while the Relative Strength Index (RSI) has been falling. Therefore, the pair will likely keep falling ahead of the US consumer confidence data.
USDCHF
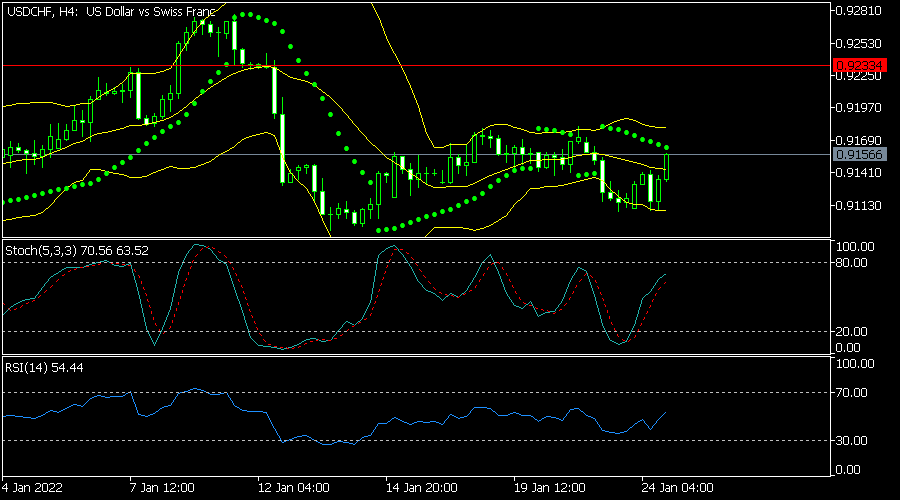
The USDCHF pair tilted higher after weak flash manufacturing and services PMI data. It is trading at 0.9150, which is slightly above last week’s low of 0.9105. On the four-hour chart, the pair is slightly above the middle line of the Bollinger Bands. It has also moved above the 25-day moving average and is slightly below the dots of the parabolic SAR. The pair will likely continue the bullish trend today.
XBRUSD
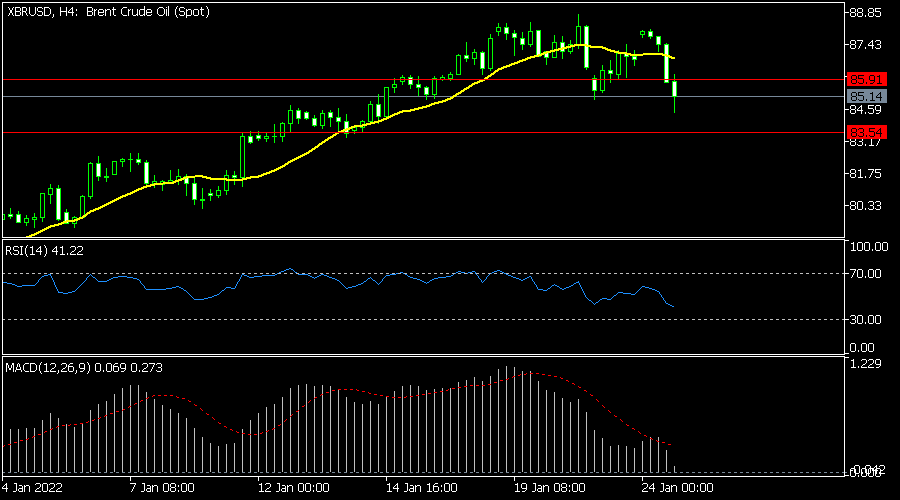
The XBRUSD pair declined to a low of 84.55 as focus shifted to the Federal Reserve. The pair is trading at 85.15, which is slightly lower than last week’s high of 88.73. On the four-hour chart, the pair moved slightly below the key support level at 85.90. It also moved below the 25-day moving average while the MACD and RSI have also retreated. The pair will continue its bearish trend today as bears target the key support at 83.50.
GER 40 Tests Critical Support
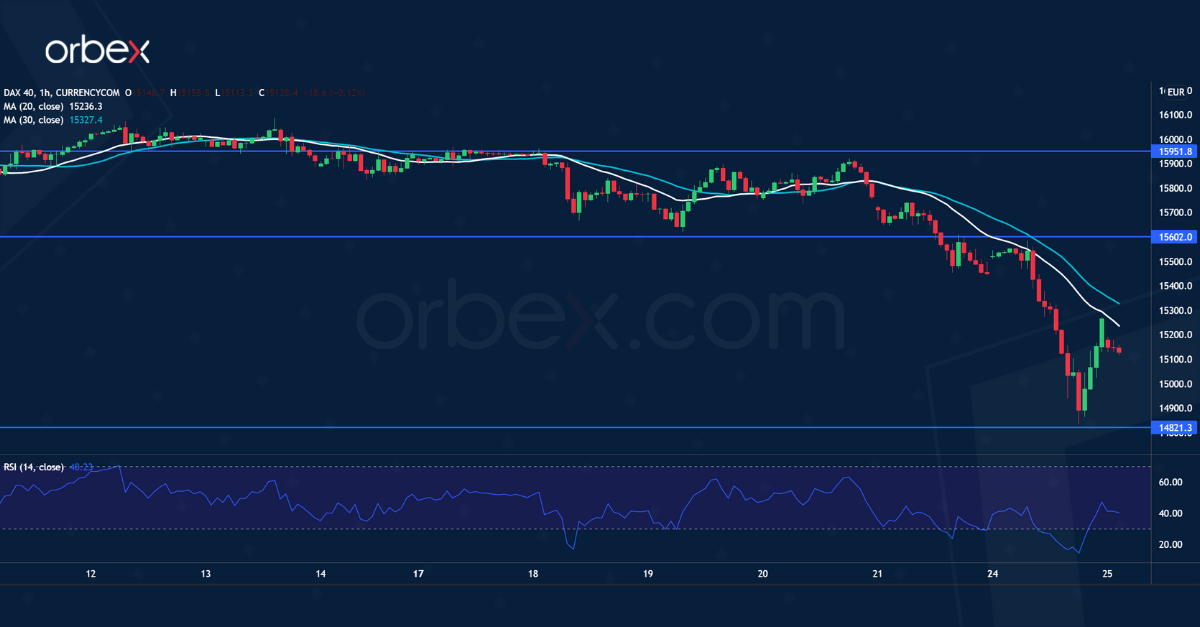
The Dax 40 plunges amid rising tensions in Ukraine. The index has given up all gains from the rebound in late December and cut through the major demand zone around 15070.
The RSI’s repeatedly oversold situation attracted a buying-the-dips crowd. Nevertheless, there is no sign of improvement in the market mood. And price action has not stabilized yet.
A grind of last October’s low at 14820 would test the bulls’ resolve in the medium-term. On the upside, 15600 is the first hurdle to lift.
AUD/USD in Bearish Reversal
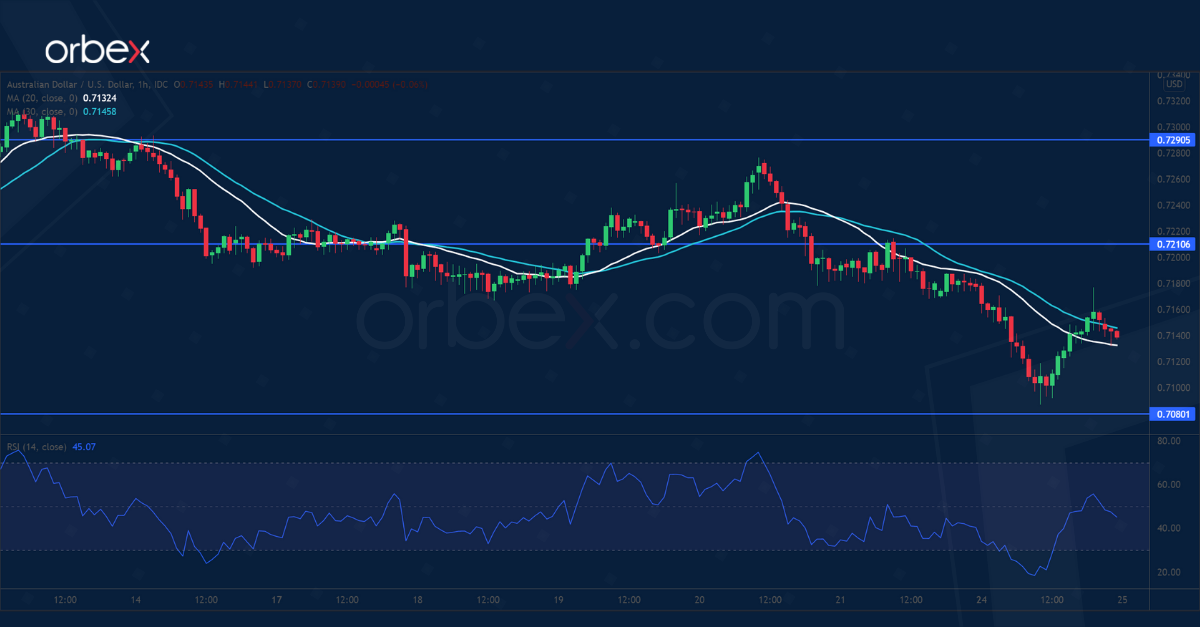
The Australian dollar recovered after the Q4 CPI beat expectations. However, the latest rally took a bearish turn after the price slipped below 0.7170.
The lack of commitment to hold onto recent gains suggests a weak risk appetite. A fall below the daily support at 0.7130 further weighs on the Aussie and prompts buyers to bail out.
The RSI’s oversold situation helped lift the pair temporarily. Nonetheless, the bears might be eager to sell into strength near 0.7210. 0.7080 would be the next stop as the trend turns south.
GBP/USD Remains Under Pressure
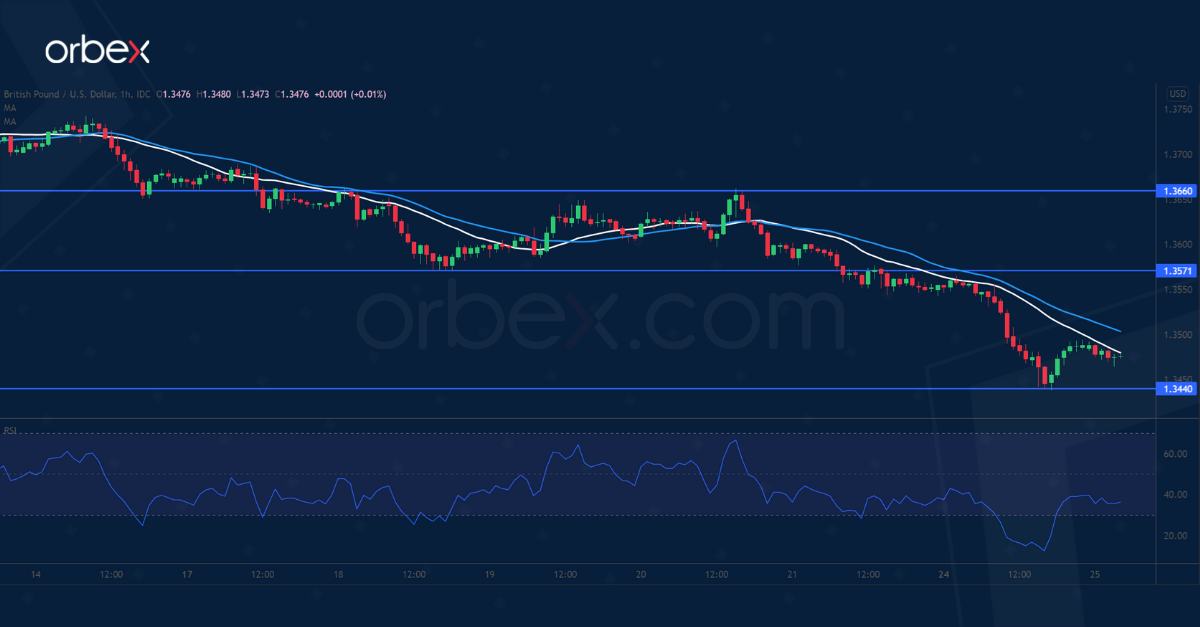
The sterling struggles as global markets remain risk-off. A limited rebound has fought to hold above 1.3570 and the sell-off accelerated after a bearish breakout.
The pair is testing a previous low at 1.3440 which sits along the 30-day moving average. There could be buying interest in this congestion area after the RSI plunged into the oversold band.
1.3570 is now a fresh resistance, then the bulls will need to lift 1.3660 before they could turn sentiment around. On the other hand, a deeper correction may send the price to 1.3400.
Escalated Military Threat of a Russian Invasion in Ukraine Added Another Dark Layer Over Soured Risk Sentiment
Markets
The escalated military threat of a Russian invasion in Ukraine added another dark layer over already soured risk sentiment. Main European equity indices lost around 4% with some of them now also officially in correction territory (>10% sell-off from top; eg AEX). The EuroStoxx50 tested key support at 4046/4025 (November low and incoming trend- or neckline from uptrend or multiple top formation). US stock markets joined the sell-off with losses of a similar magnitude. The S&P 500 tested for example the July (!) low at 4233. However, for the first time since early January some buyers showed up. A late rally even enabled a marginally positive close for key US benchmarks. The jury is still out on the strength of this move. Asian stock markets don’t copy the late Wall Street optimism and lose up to 2%. US equity futures are downwardly oriented again as well. Is the sell-off really over or was yesterday’s action more of a dead cat bounce? At least going into the FOMC meeting, we’d err on the side of caution. We expect the Fed to pre-announce a March rate, potentially end net asset purchases altogether and perhaps already give some more guidance on how it plans to conduct a balance sheet roll-off later this year. Such rapid normalization drift in combination with stubbornly high inflation and its consequences for future growth all suggest a difficult year ahead for risky assets.
Yesterday’s intraday rebound on US stock markets pulled other haven assets like core bonds off their highs. The US yield curve steepened with daily changes ranging between -3.1 bps (2-yr) and +4 bps (30-yr). European markets closed when the US hit bottom levels, explaining the “outperformance” of German Bunds on the daily scorecard. Yields dropped by 3 to 4 bps with the belly performing slightly better than the wings. The dollar for most of the day outperformed all other currencies, but closed off best levels as well. EUR/USD narrowly held withing the slow upward trading trend channel, closing at 1.1326. EUR/GBP moved above first resistance at 0.8381 to close the session at 0.8397. Today’s eco calendar contains US housing prices, US consumer confidence and German Ifo Business sentiment. The IMF launches its world economic outlook update with the US Treasury selling $55bn 5-yr Notes. We expect the eco calendar to maintain subordinated to global sentiment. We think it’s too early to call an end to the risk correction and prefer the traditional haven assets/correlations.
New Headlines
Q4 Australian headline inflation accelerated to 1.3% Q/Q and 3.5% Y/Y. The core trimmed mean measure, which is closely watched by the Reserve Bank of Australia, also rose more than expected, by 1.0% Q/Q and 2.6% Y/Y. Price rises were broad-based, including a substantial 4.4% rise in prices for new dwellings. In this respect, the Australian statistics bureau mentioned that “shortages of building supplies and labour combined with continued strong demand for new dwellings, contributed to price increases for newly built houses, townhouses and apartments”. Today’s data suggest that (core) inflation is moving higher in the 2-3% target range sooner than the RBA expected. The RBA meets on February 1. In its December statement, it indicated to consider the bond buying program at that meeting. Halting net purchases is highly likely. Markets currently discount a RBA rate hike at the June meeting. The Aussie dollar temporarily gained a few ticks this morning, but a fragile global risk sentiment capped any sustained move higher (AUD/USD 0.7140).
The Monetary Authority Singapore today unexpectedly tightened monetary policy. It was the first unscheduled tightening since 2015. The MAS uses the exchange rate as its most important monetary policy tool as the country’s open economy is highly sensitive to global inflationary developments. The MAS said that it would slightly raise the rate of appreciation of its policy band. The MAS already tightened policy in October. It also raised its 2022 forecast for core inflation from 2%-3% from 1%-2% in October. The next regular policy meeting is scheduled for April. The Singapore dollar strengthened to USD/SGD 1.3435 and is near the September/October levels (1.3380/1.3420 area).
Daily Technical Analysis
EUR/USD
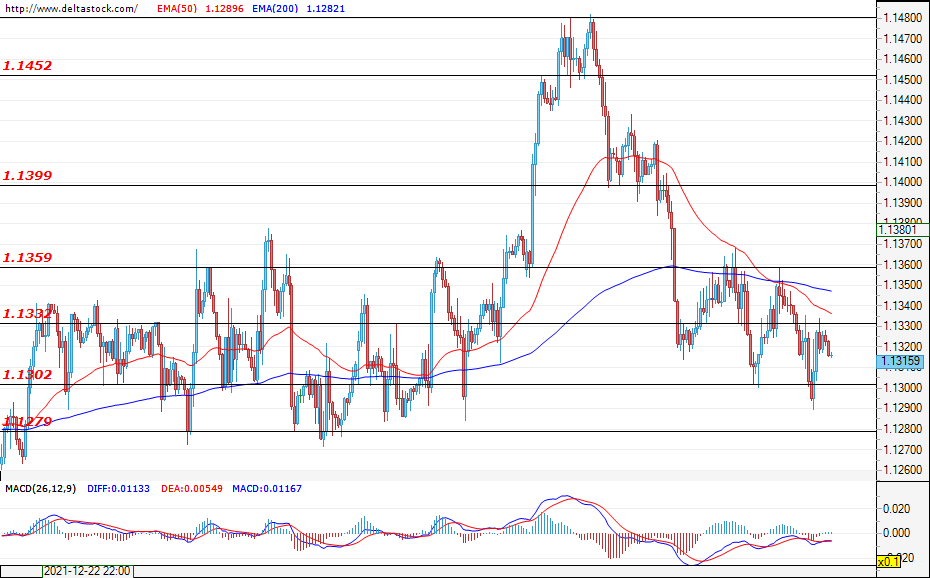
During the early hours of today’s trading session, the currency pair bounced back from the resistance at 1.1330, therefore the current expectations are for the pair to head towards a test of the support at 1.1300 and, if it is successfully breached, to also head towards the critical support at 1.1280. However, if the support at 1.1300 resists the pressure of the bears, then this may lead to a retracement towards the resistance at 1.1330, followed by the next one at 1.1360. Today, increased activity can be expected around the release of the consumer confidence data for the U.S. (15:00 GMT).
USD/JPY
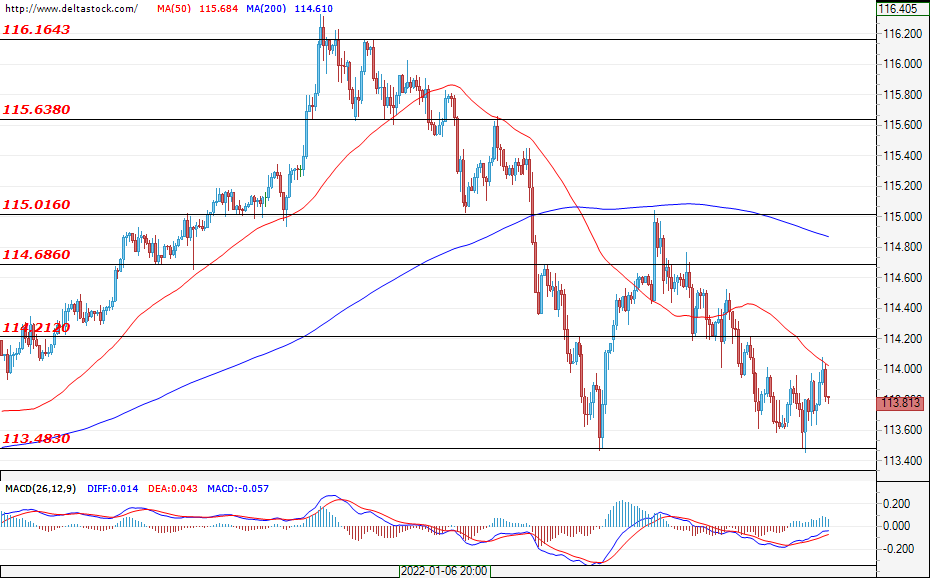
During yesterday’s trading session, the bears attacked the important support at 113.50, but the test was unsuccessful and, at the time of writing this analysis, the pair is consolidating in the range of 113.50 – 114.21. The forecasts for today’s trading session are for the pair to continue trading in the mentioned range, but only a successful breach of the support at 113.50 would give the bears a chance to re-enter the market and head the pair towards the support at 113.00. On the other hand, if the bulls manage to take control over the market and violate the resistance at 114.20, then the next target would be the resistance at 114.70.
GBP/USD
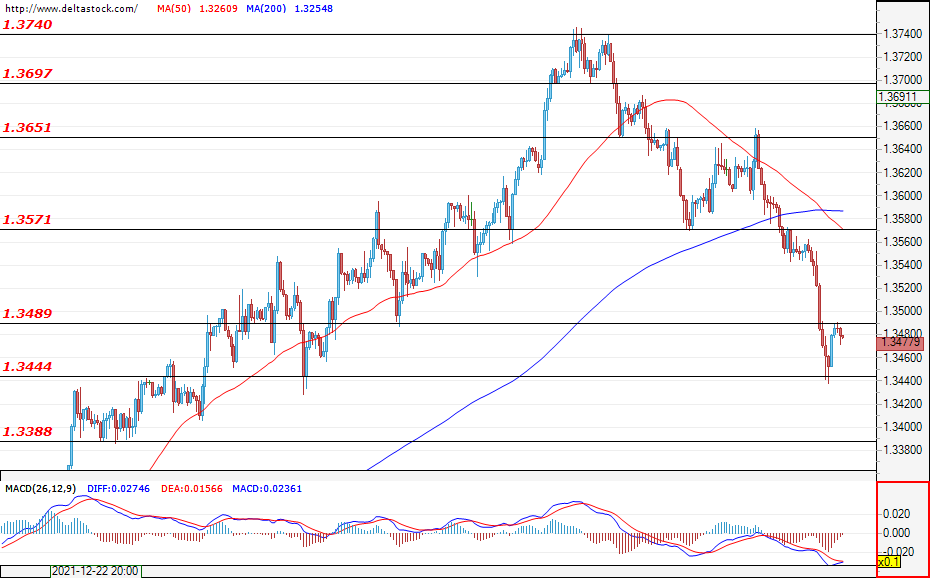
After the major sell-off, the bears lost momentum around the support at 1.3444. We have so far witnessed a short corrective move and a test of the resistance at 1.3490 and so the expectations are for the downward movement to be restored, but only a breach of the support at 1.3444 would strengthen the negative market sentiments for a depreciation of the sterling against the U.S. dollar towards the support at 1.3388. However, if the mentioned support remains unbreached, then the bulls would probably once again test the resistance at 1.3490.
EUGERMANY40
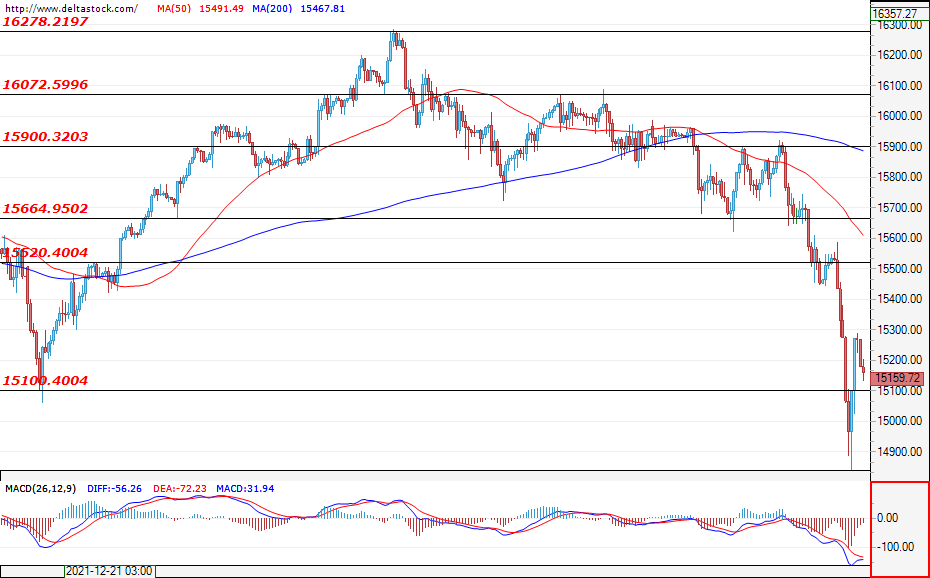
Yesterday, we witnessed a massive sell-off, but the bears started to take their profits around the level of support at 14840 and the index partially recovered its losses. The recovery may be considered as a short-lived correction and the bears would probably try to regain control and head the price towards a test of the psychological level of 15000. In the opposite direction, the first significant resistance lies at 15620.
USD30
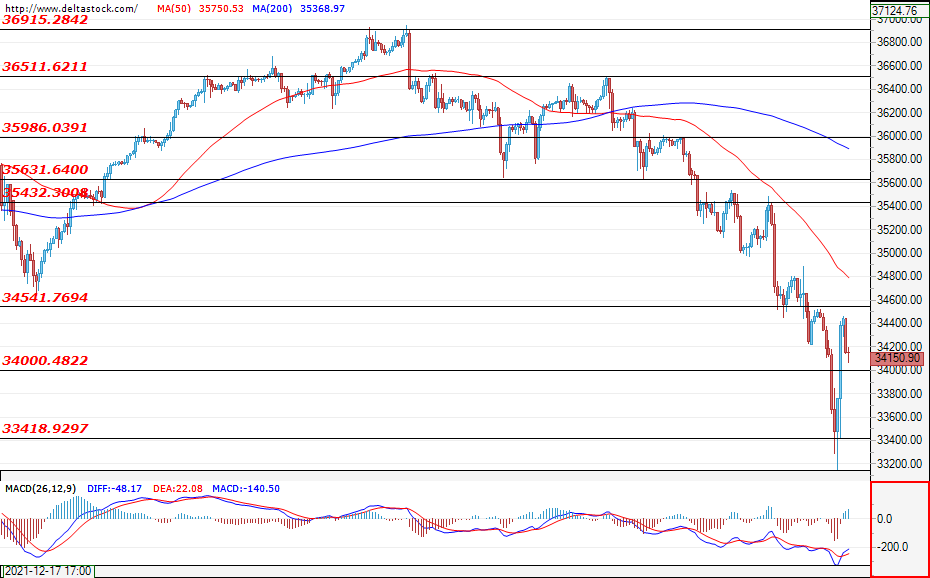
After yesterday’s panic sell-off, the drop was limited to the support at 33418 and the index managed to recover some of its losses. However, during the early hours of today`s trading, the bulls couldn’t overcome the resistance zone at 34541 and a new decline seems to be taking place. The expectations are for the bears to re-enter the market and, if they manage to overcome the support at 34000, then this would strengthen the negative expectations for a decline towards 33418. On the other hand, if the psychological level of 34000 is not breached, then we could expect the bulls to take control and attack the resistance at 34541.
Markets Tense into the Fed Meeting
Happy ending to yesterday’s bloodbath was highly unlikely but it happened. The S&P500 and Nasdaq closed Monday’s session in the positive after having dived more than 4% within the session.
Nasdaq extended losses below its 200-DMA, while the S&P500 briefly entered the correction territory, as the index lost more than 10% from the latest record high.
Yesterday’s rebound raised one important question: is it the end of the selloff wave?
It depends on two major factors:
- How aggressive the Federal Reserve (Fed) will fight back inflation and what it’s ready to risk in terms of market pricing.
- Who will survive to the tighter rate environment.
Obviously, there is a slim chance we see meme stocks, SPAC deals, or highly speculative names doing well in an environment of tighter Fed liquidity. There is, on the other hand, a better chance for companies like Apple and Microsoft to navigate through a high turbulence market.
So the Fed tightening will certainly support the reflation trade, but it will more importantly trigger a flight to quality.
Fed can’t sound too sanguine
The Fed starts its two-day policy meeting today. But after the January selloff, the Fed is not in a position to provoke the hawks.
Fed’s goal is to fight back the inflation crisis, and not to trigger a renewed financial crisis. And the Fed can’t afford to trigger a financial crisis when inflation is so high.
As such, the recent market turmoil will certainly soften the Fed’s tone, or at least prevent the Fed from sounding too hawkish. The Fed will still continue tapering the bond purchases, it will likely proceed with the first rate hike in March and follow up with three other rate hikes throughout the year. But the officials may sound be more gentle on the balance sheet reduction strategy, and more.
Beyond the Fed
And the market is challenging beyond the Fed tightening. Besides the growing tensions at the Ukrainian border, Biden’s Build Back Better package is stuck among the politicians who can’t agree what to do with it right now, the measures that have been taken to decrease the trade deficit with China didn’t work well, and there is news that the White House is increasingly under pressure to punish Chinese for their lack of commitment. But punishing Chinese by blocking or taxing the cheap Chinese goods from coming into the US is not very efficient in fighting back inflation at a time consumer prices hover around four-decade high levels.
In the FX, commodities
The US dollar is a generally a good place to go when you have a war threat, or a heavy selloff in markets. The US dollar index is gaining back the 50-DMA level.
Gold comes certainly back to the safe-havener’s scope, yet the investors should get over the rising US yields to push the yellow metal above its long-term downtrending triangle top, which lies about the $1860 mark.
And well, the Swiss franc is boosted by important safe-haven inflows- The EURCHF slid to the lowest levels since 2015. But I wouldn’t bet too much on a further downside as the stronger the franc, the bigger the chance of an SNB intervention which would slowdown the move, and even reverse it.