

Sample Category Title
Elliott Wave View: 5 Swing Sequence in USDJPY Favors More Downside
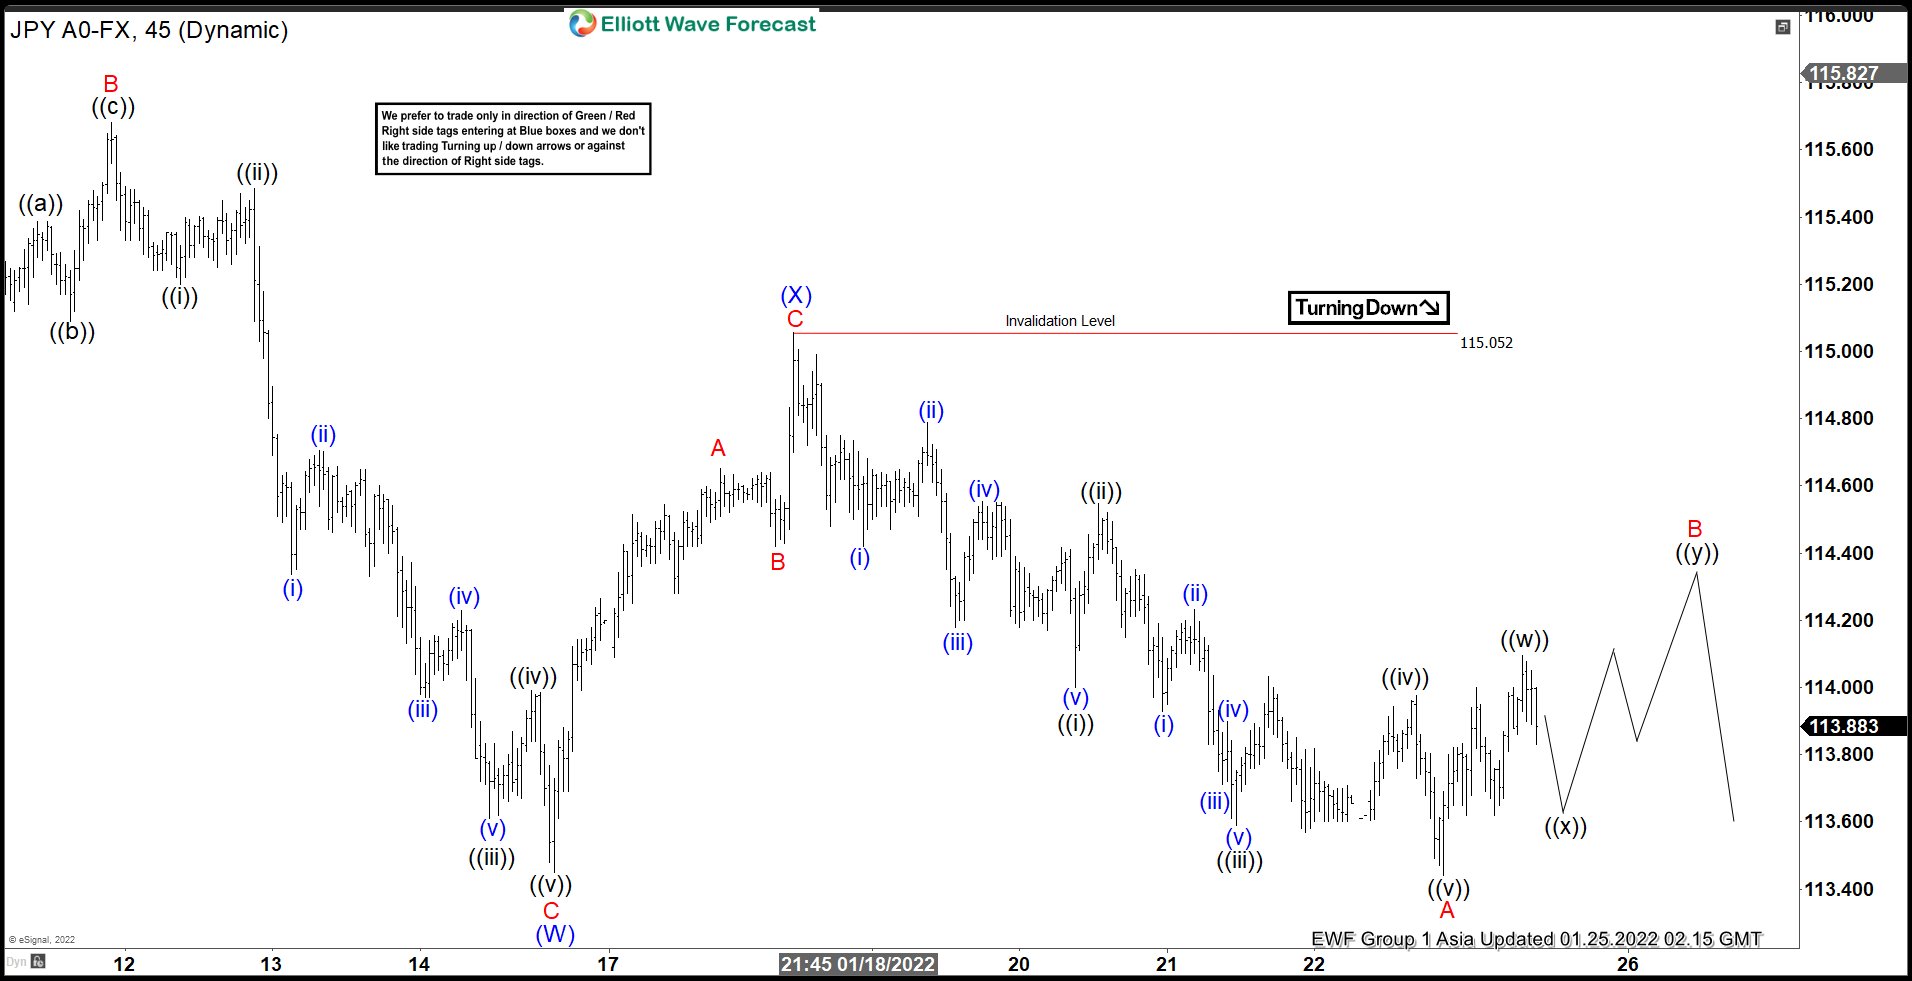
Short Term Elliott Wave view in USDJPY suggests the decline from January 4, 2022 high is unfolding as a double three Elliott Wave structure. Down from January 4, wave A ended at 115 and rally in wave B ended at 115.68. Pair then resumed lower in wave C towards 113.45. This completed wave (W) in higher degree. Rally in wave (X) ended at 115.06 with internal subdivision as a zigzag. Up from wave (W), wave A ended at 114.65, wave B ended at 114.42, and wave C ended at 115.05. This completed wave (X) in higher degree.
Pair has resumed lower in wave (Y) an broken below wave (W) at 113.45. This suggests the next leg lower has started. The internal subdivision of wave (Y) is in progress as another zigzag in lesser degree. Down from wave (X), wave A ended at 113.44 as an impulse. Wave B corrective rally is in progress to correct cycle from January 18, 2022 high before the decline resumes. Near term, as far as pivot at 115.05 high stays intact, expect rally to fail in the sequence of 3, 7, or 11 swing for further downside. Potential target lower is 100% – 123.6% Fibonacci extension from January 4, 2022 high which comes at 110.4 – 112.1 area.
USDJPY 45 Minutes Elliott Wave Chart
Technical Outlook and Review
DXY:
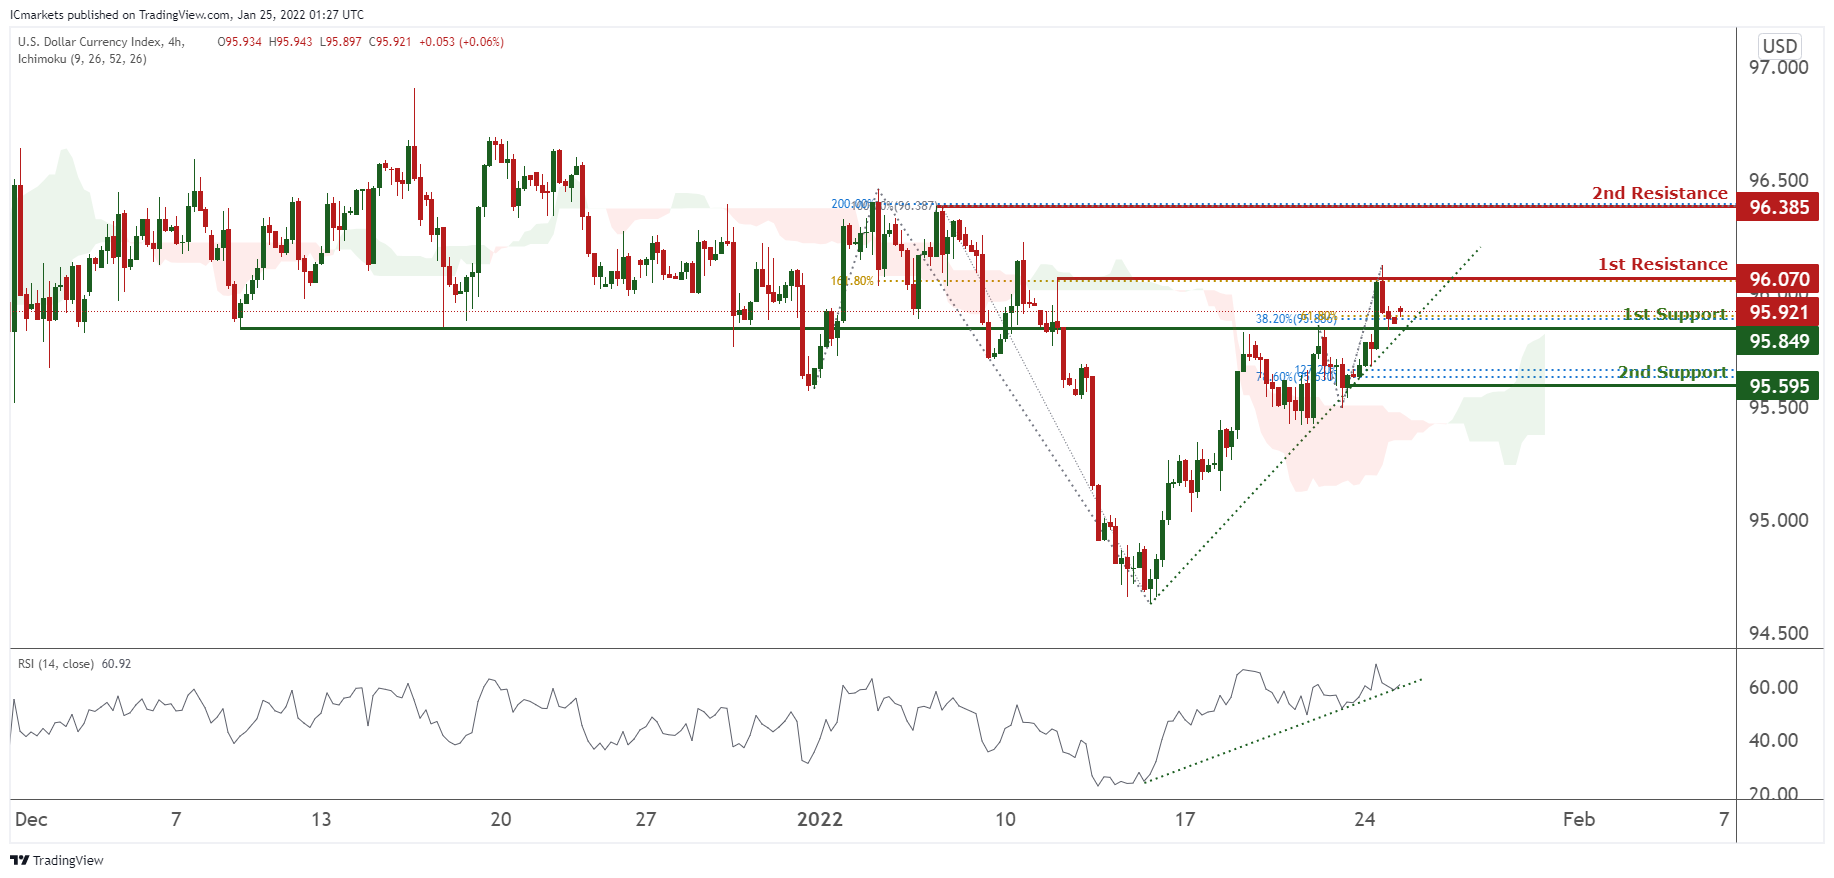
On the H4 timeframe, prices are on bullish momentum and abiding to our ascending trendline. We would expect potentially a bounce from our 1st support at 95.921 in line with 38.2% Fibonacci retracement and 61.8% Fibonacci extension towards our 1st resistance at 96.070 in line with 161.8% Fibonacci projection. RSI is showing bullish momentum and prices are trading above our Ichimoku clouds, further supporting our bullish bias.
Areas of consideration:
- H4 time frame, 1st resistance at 96.070
- H4 time frame, 1st support at 95.849
XAU/USD (GOLD):
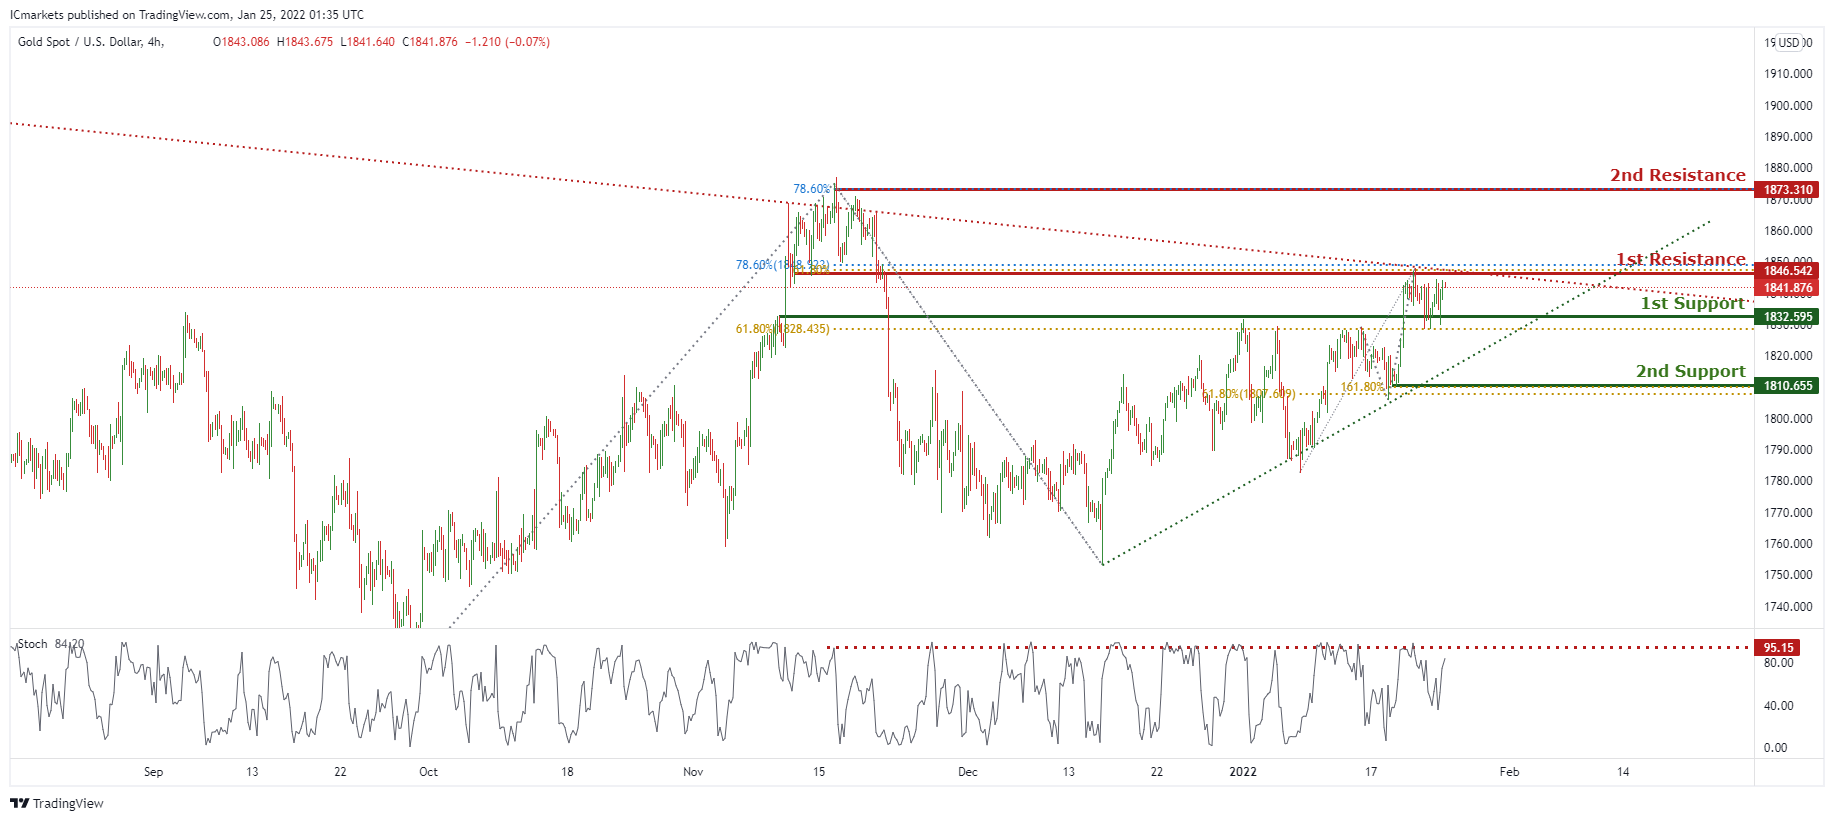
On the H4 chart, prices are on bullish momentum and consolidating in a triangle pattern. We see a potential for a dip from our 1st resistance at 1846.542 in line with 78.6% Fibonacci extensions and 61.8% Fibonacci retracement towards our 1st support at 1832.595 in line with 61.8% Fibonacci retracement. Stochastics are close to a level where dips previously occurred.
Areas of consideration:
- 4h 1st support at 1832.595
- 4h 1st resistance at 1846.542
GBP/USD
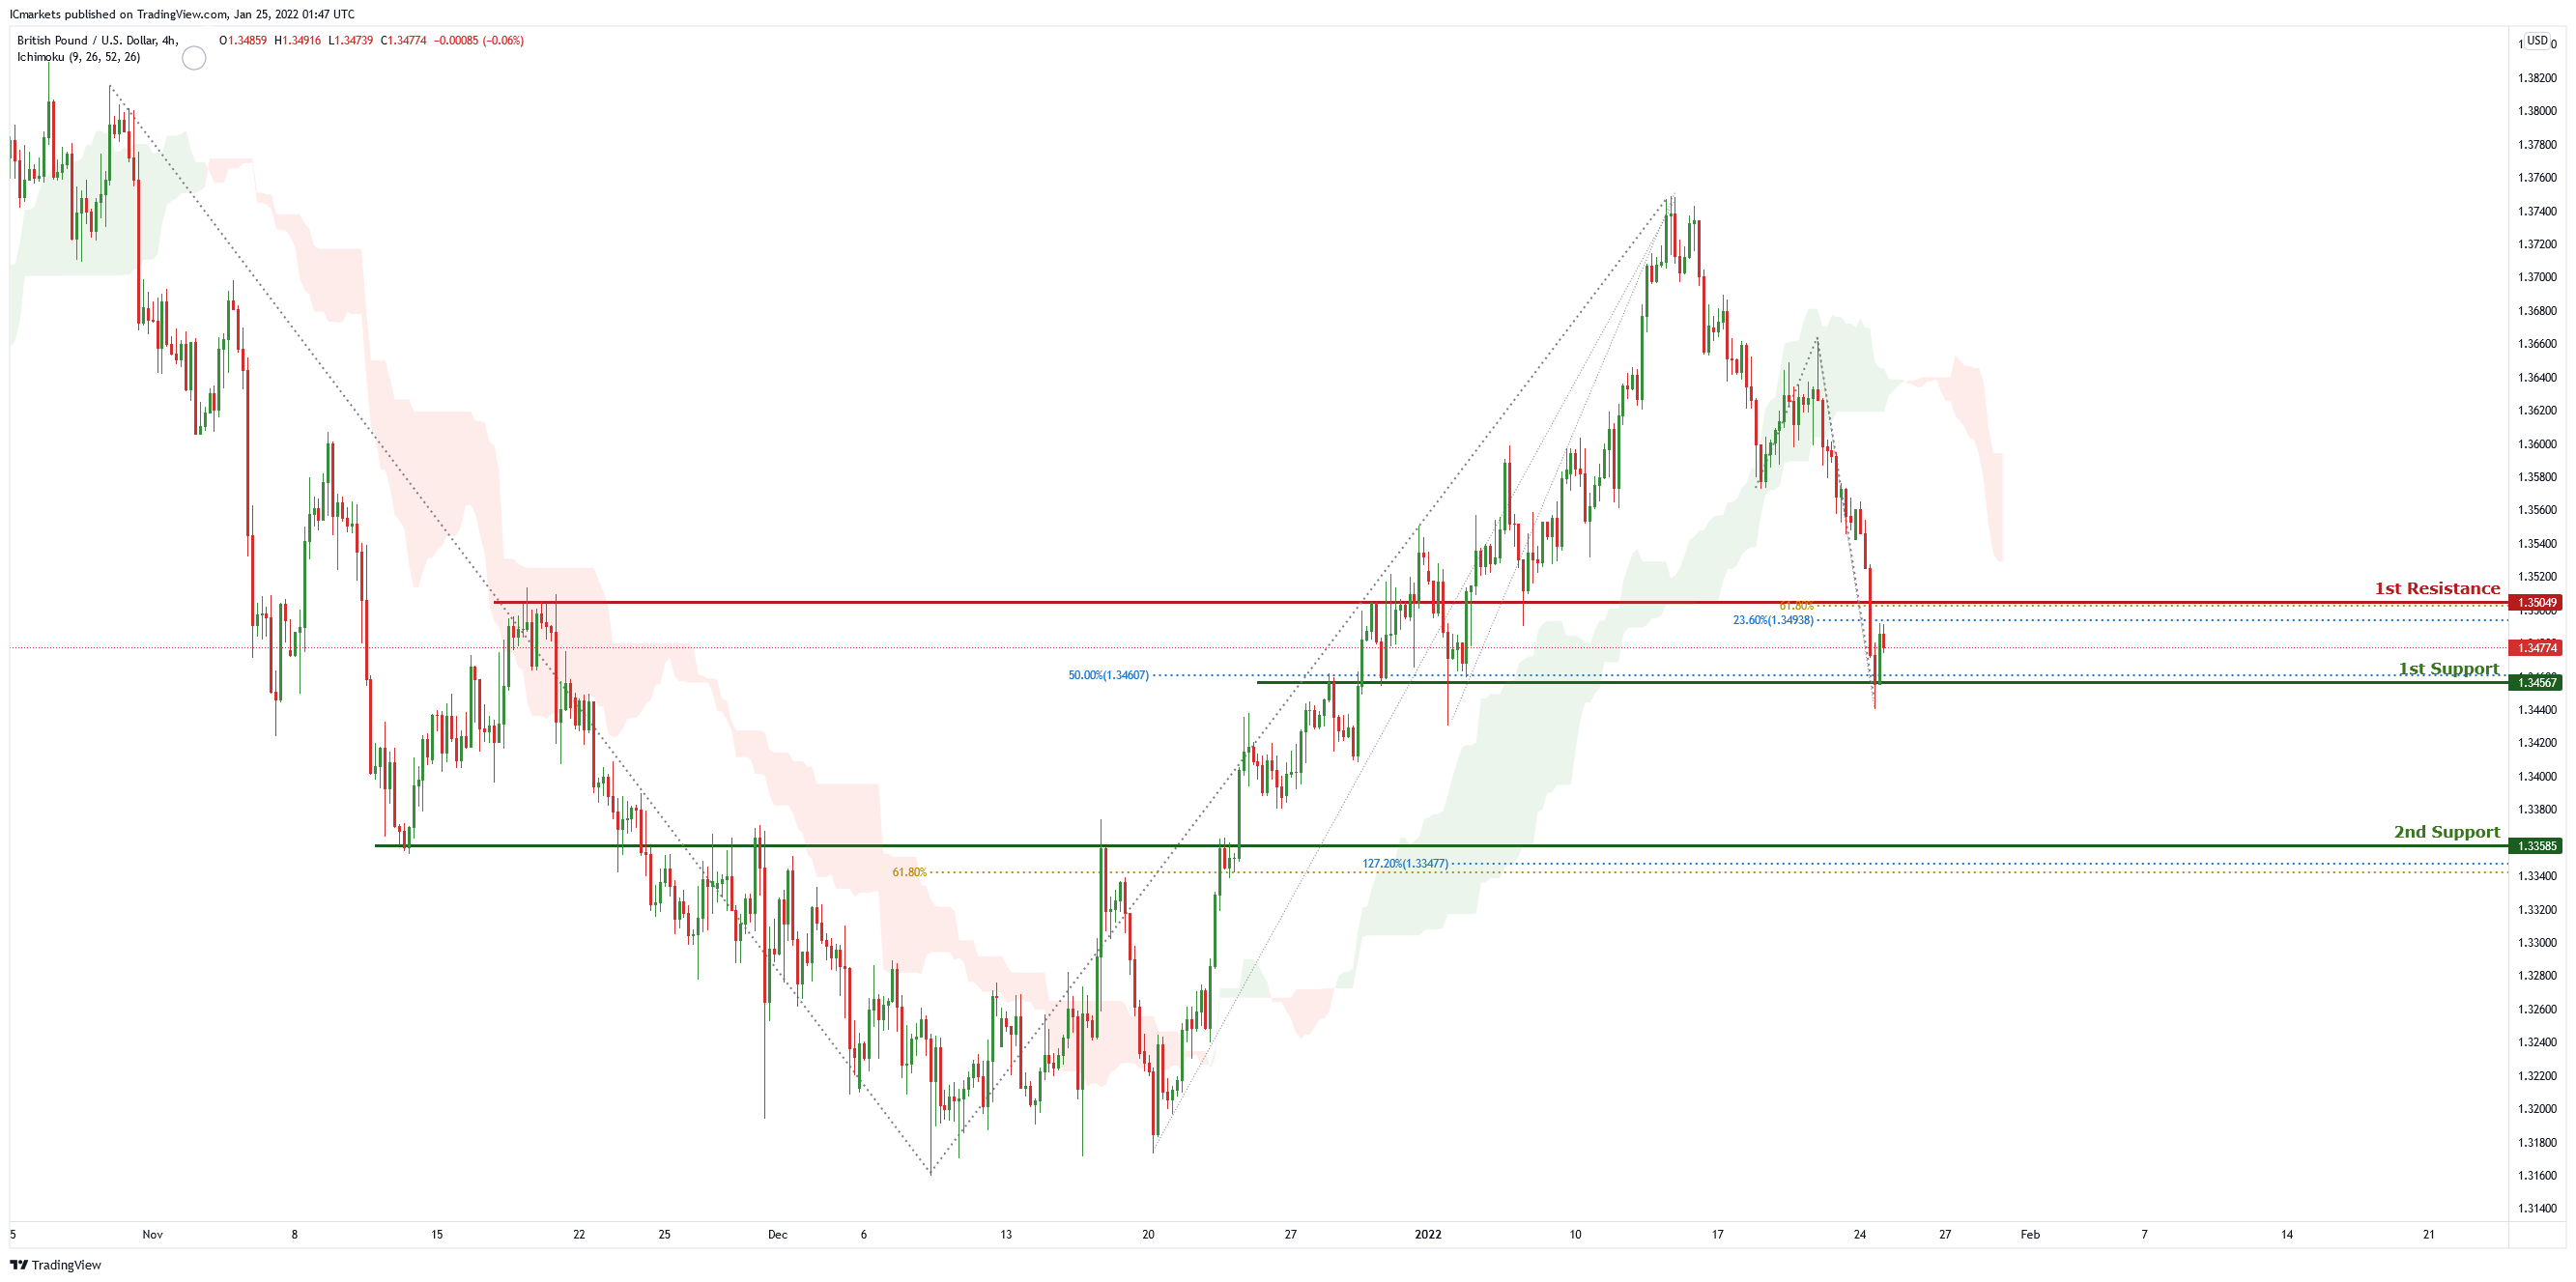
On the H4 chart price is near 1st support level of 1.34567 which is also 50% Fibonacci retracement. Price can potentially dip to the 2nd support level of 1.33585 which is also 127.2% Fibonacci retracement and 61.8% Fibonacci projection. Our bearish bias is supported by the ichimoku cloud indicator as price is trading below it.
Areas of consideration
- H4 1st support 1.34567
- H4 2nd support 1.33585
USD/CHF:
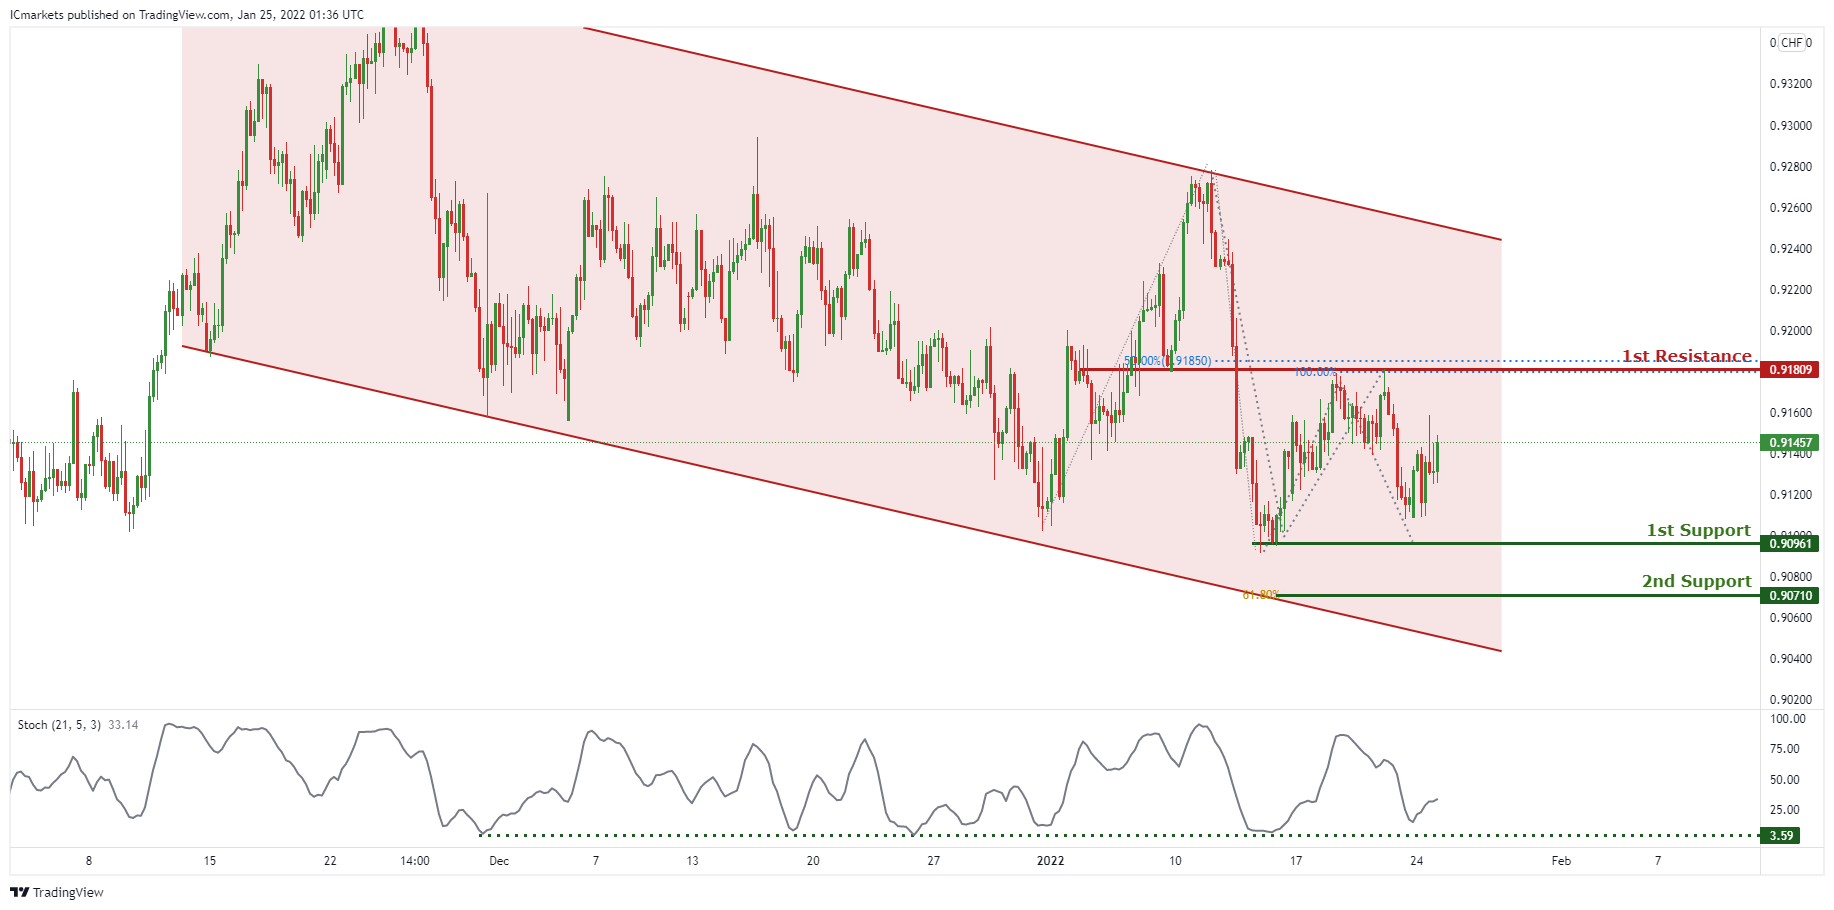
In reference to last week’s analysis, price indeed dropped from 1st Resistance and approaching 1st Support @ 0.90961. On the H4 timeframe, price is abiding to a descending channel, signifying a bearish momentum. However, we can expect price to make a short-term bullish bounce from 1st Support in line with previous swing low towards 1st Resistance in line with 100% Fibonacci projection and 50% Fibonacci retracement. Our short-term bullish bias is further supported by stochastic indicator where the %K line is approaching the support level. Traders can wait for prices to swing higher or lower before entering.
Areas of consideration:
- Watch 1st Support at 0.90961
- Watch 1st Resistance at 0.91809
EUR/USD :
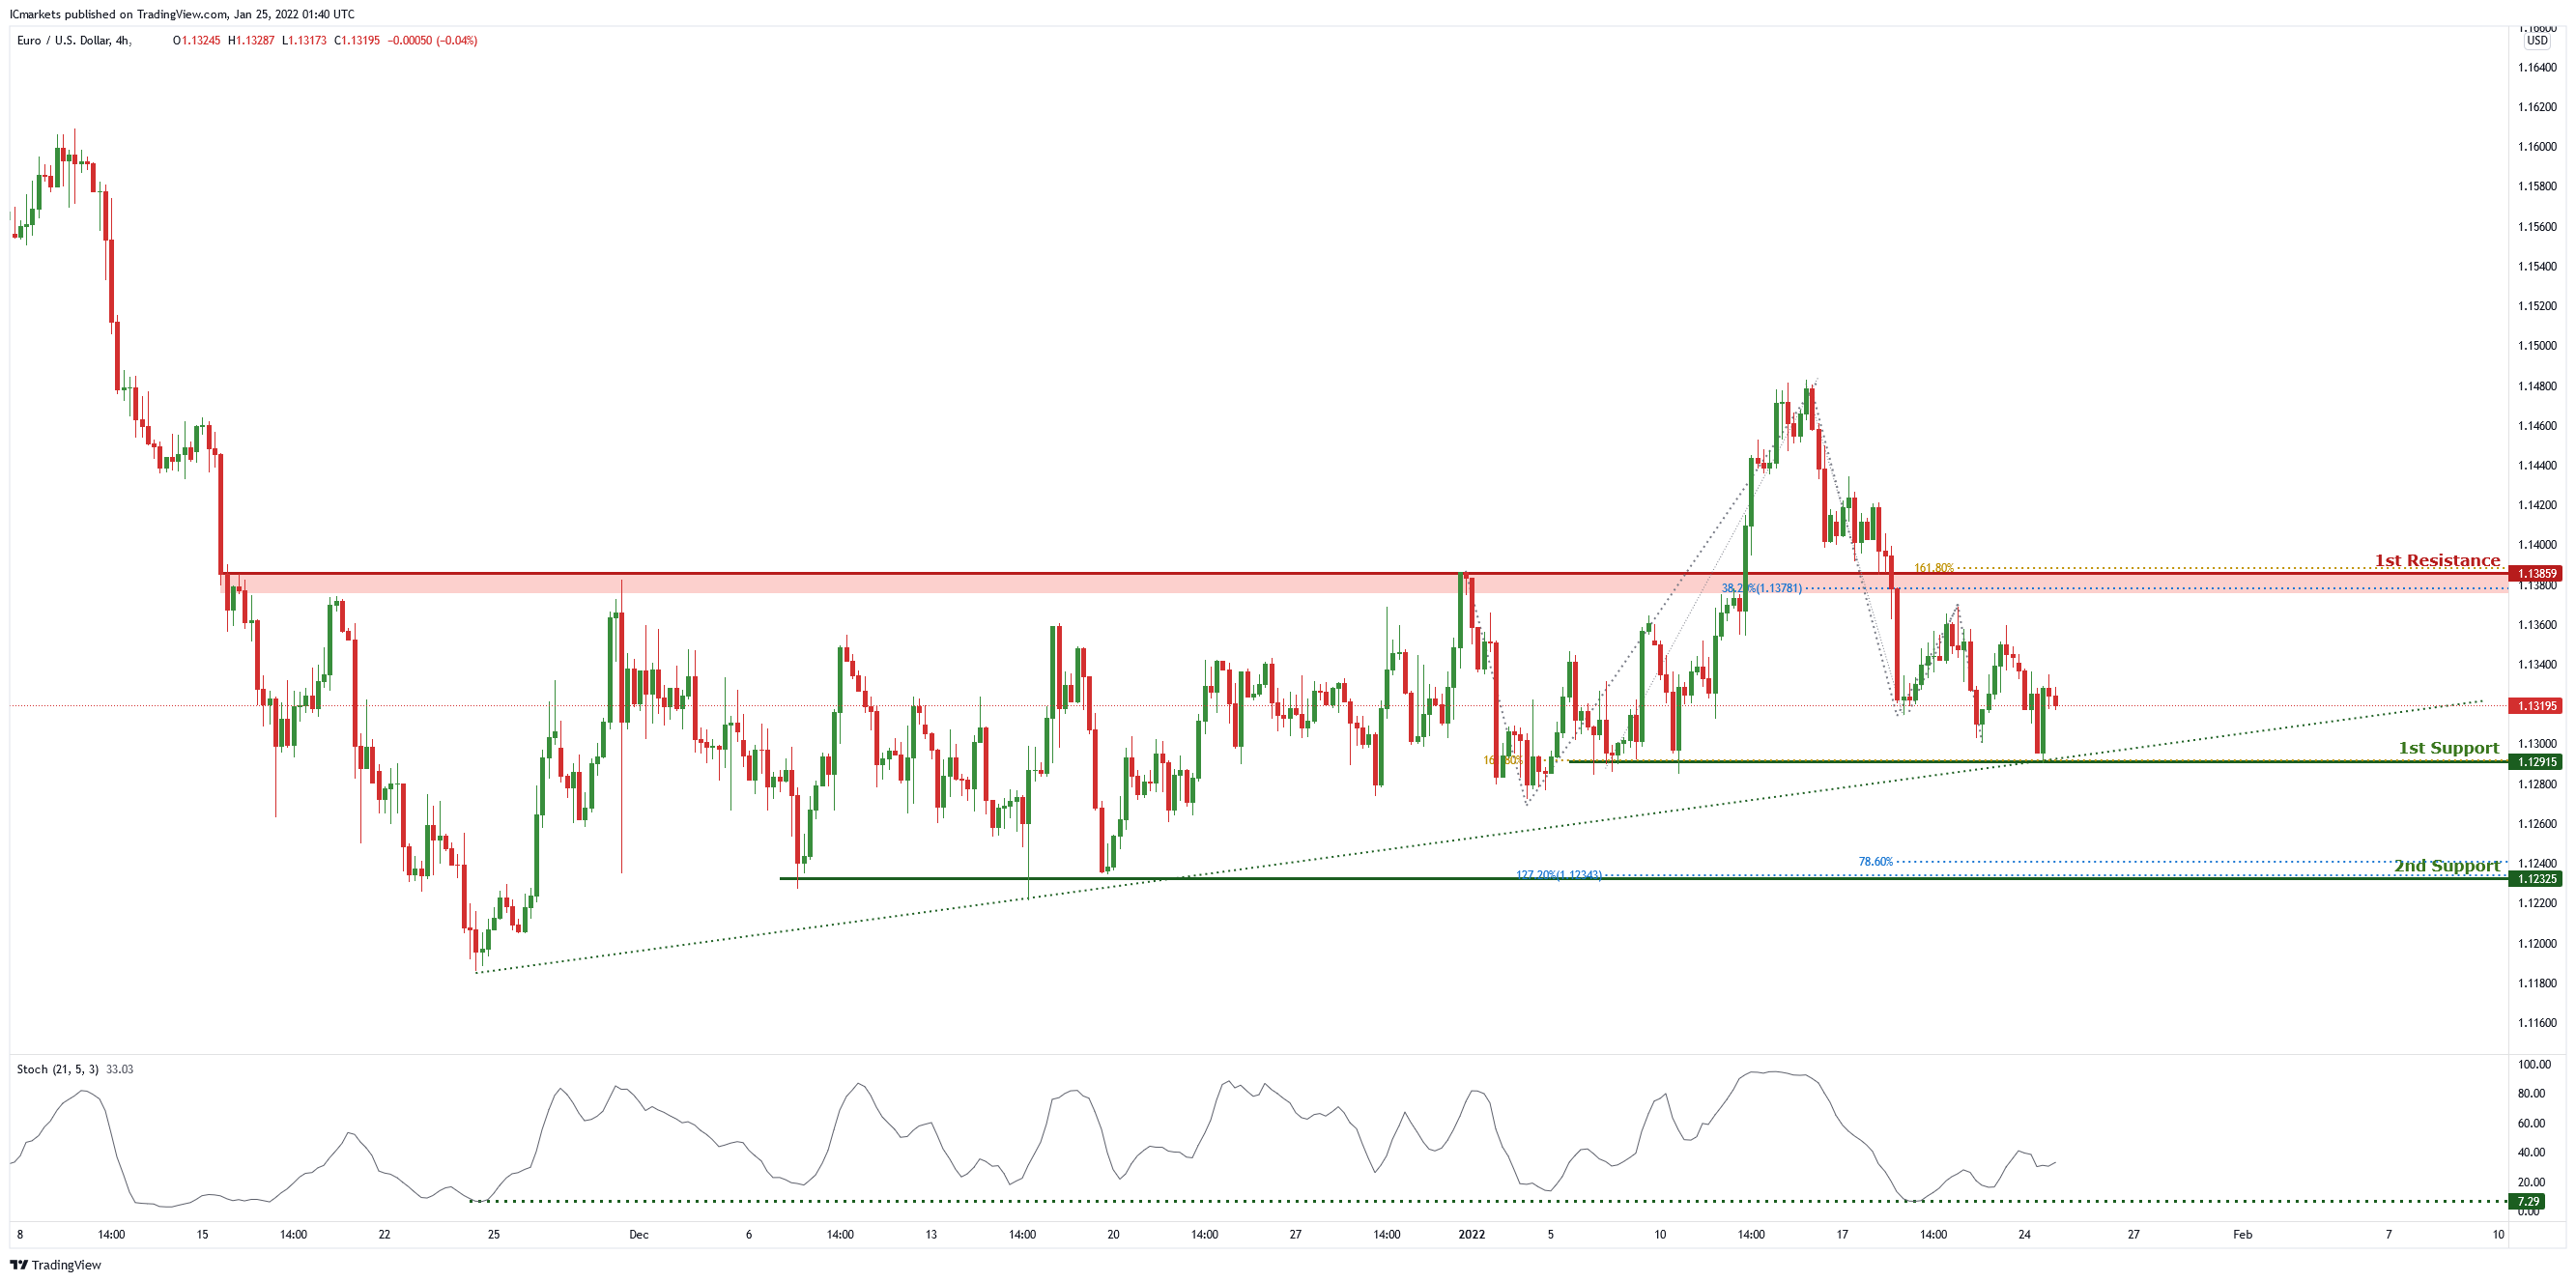
On the H4 chart , price is abiding by the ascending trendline and is in the middle of the 1st resistance of 1.13859 which is also 38.2% Fibonacci retracement, 61.8% Fibonacci projection and 1st support level of 1.12915 which is also 161.8% Fibonacci projection. Price can potentially go to the 1st resistance level. Our bullish bias is supported by the stochastic indicator as it is near support level.
Areas of consideration
- 1st resistance at 1.13859
- 1st support at 1.12915
USD/JPY:
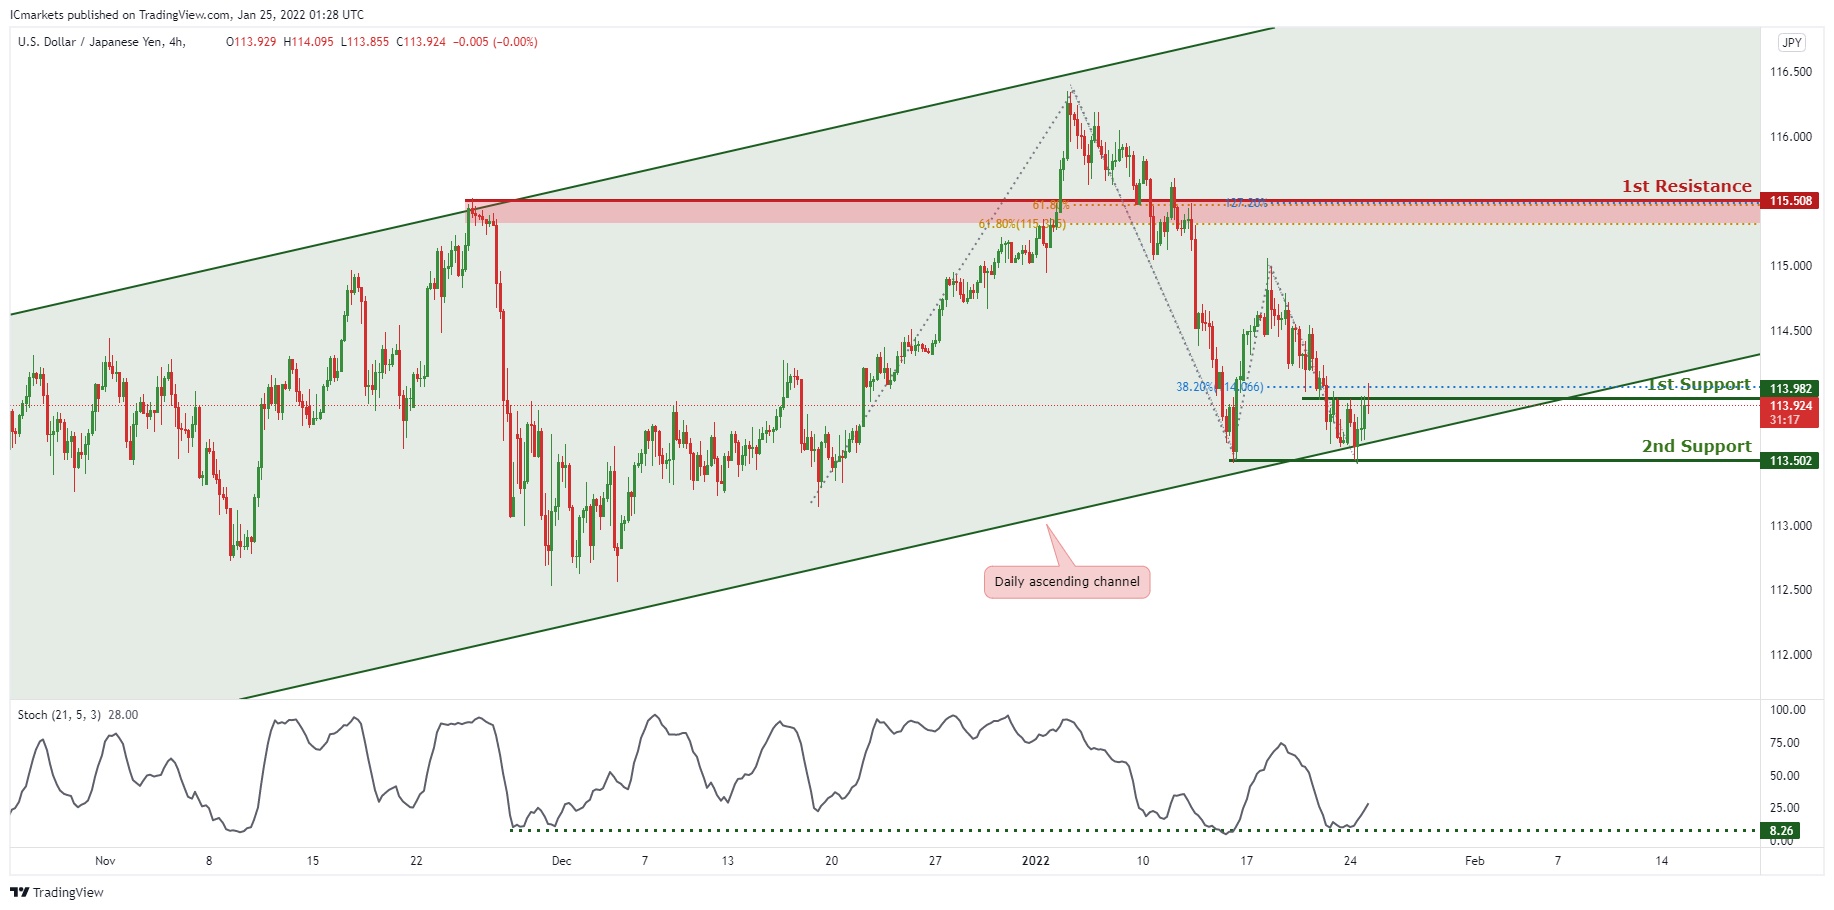
On the H4 timeframe, is abiding to the ascending channel on the daily, signifying an overall bullish momentum. We can now expect the price to bounce from 1st Support in line with 38.2% Fibonacci retracement towards 1st Resistance in line with 61.8% Fibonacci projection and 61.8% Fibonacci retracement. Our bullish bias is further supported by the stochastic indicator where the %K line is at the support level.
Areas of consideration:
- H4 1st resistance level 115.508
- H4 1st support level 113.982
AUD/USD:
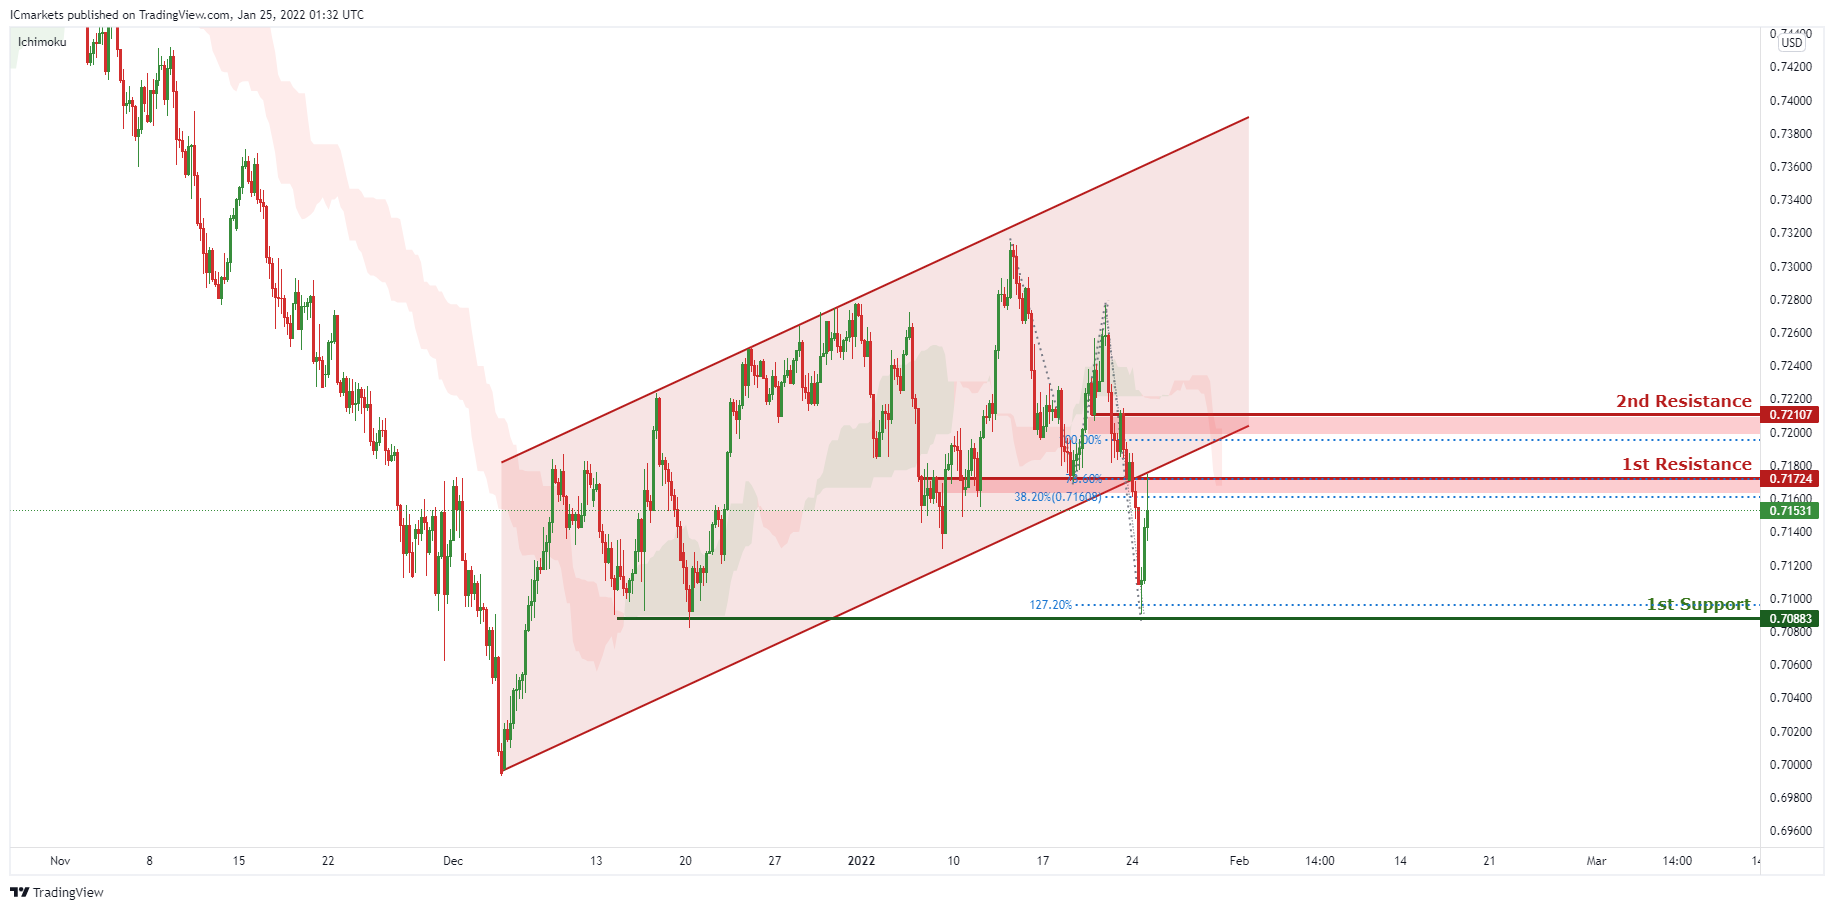
On the H4, price broke out of the ascending channel, signifying an overall bearish momentum. We can expect price to drop from 1st Resistance in line with 78.6% Fibonacci projection and 38.2% Fibonacci retracement towards 1st Support in line with graphical support level and 127.2% Fibonacci projection. Our bearish bias is further supported by the Ichimoku cloud indicator where the price is holding below it.
Areas of consideration:
- H4 1st Support level 0.70883
- H4 1st resistance level 0.71724
NZD/USD:
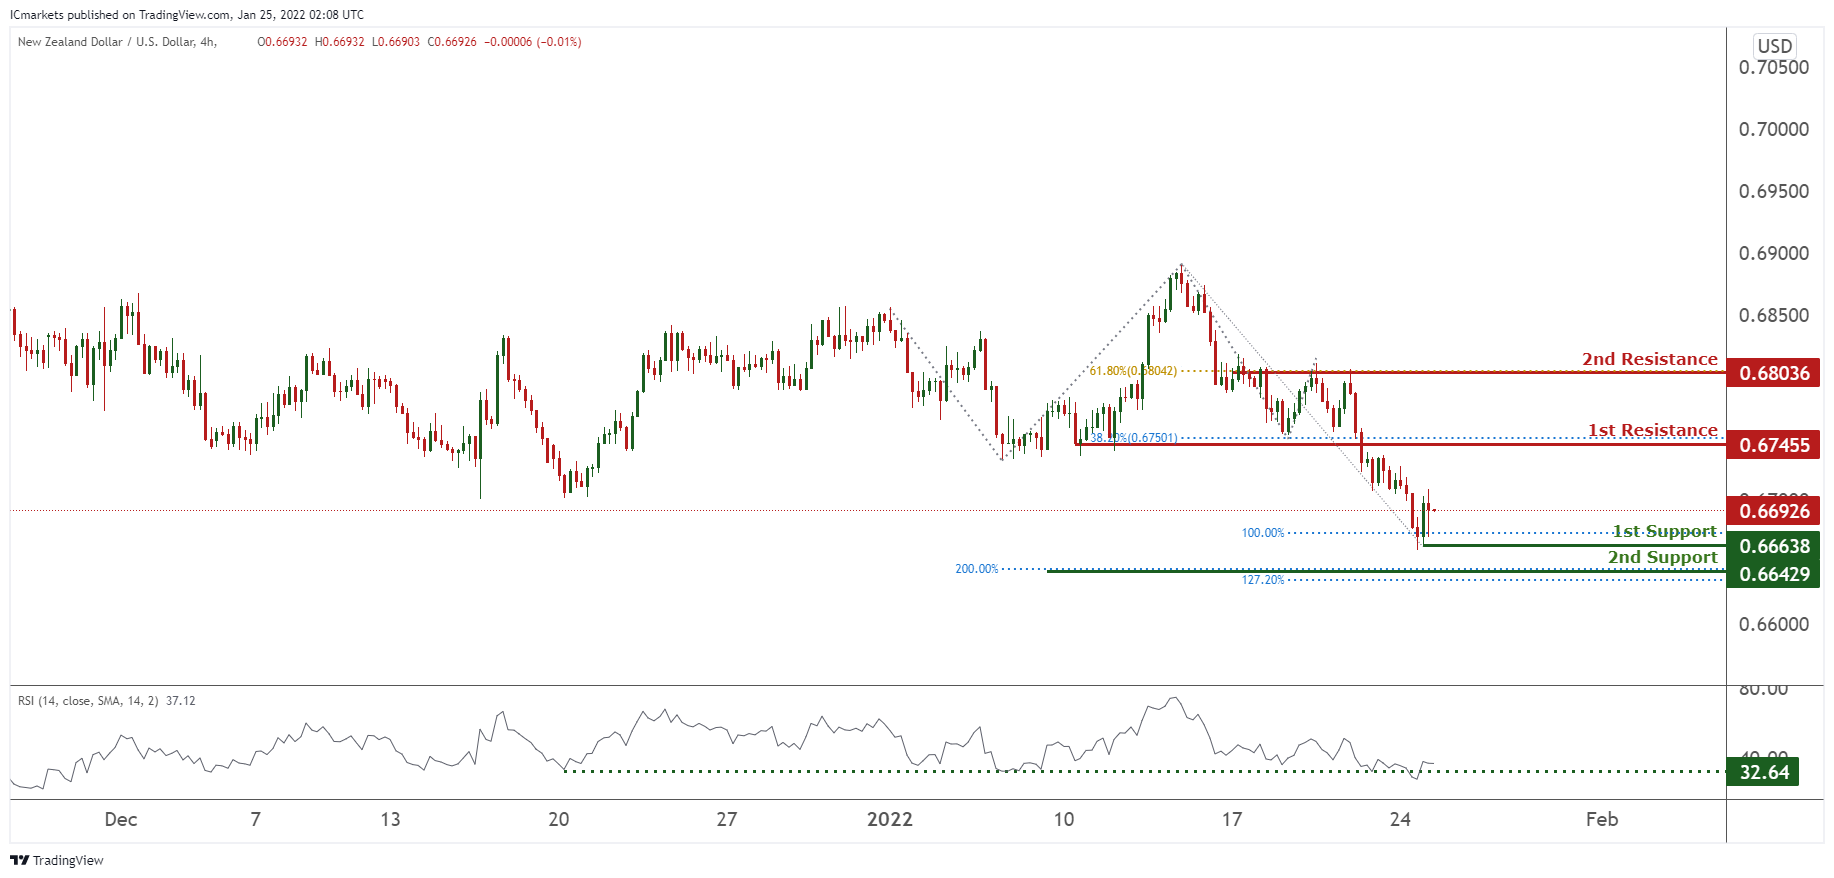
On the H4, prices are at a pivot at 0.67455 in line with 38.2% Fibonacci retracement. We see the potential for a bounce from our 1st support at 0.66638 in line with 100% Fibonacci extension towards our 1st resistance at 0.67455 in line with 38.2% Fibonacci retracement. RSI is at a level where bounces occurred previously. Alternatively, our stop loss will be placed at our 2nd support at 0.66429 in line with 200% Fibonacci Projection and 127.2% Fibonacci extension.
Areas of consideration:
- H4 time frame, 1st resistance at 0.67455
- H4 time frame, 1st support at 0.66638
USD/CAD:
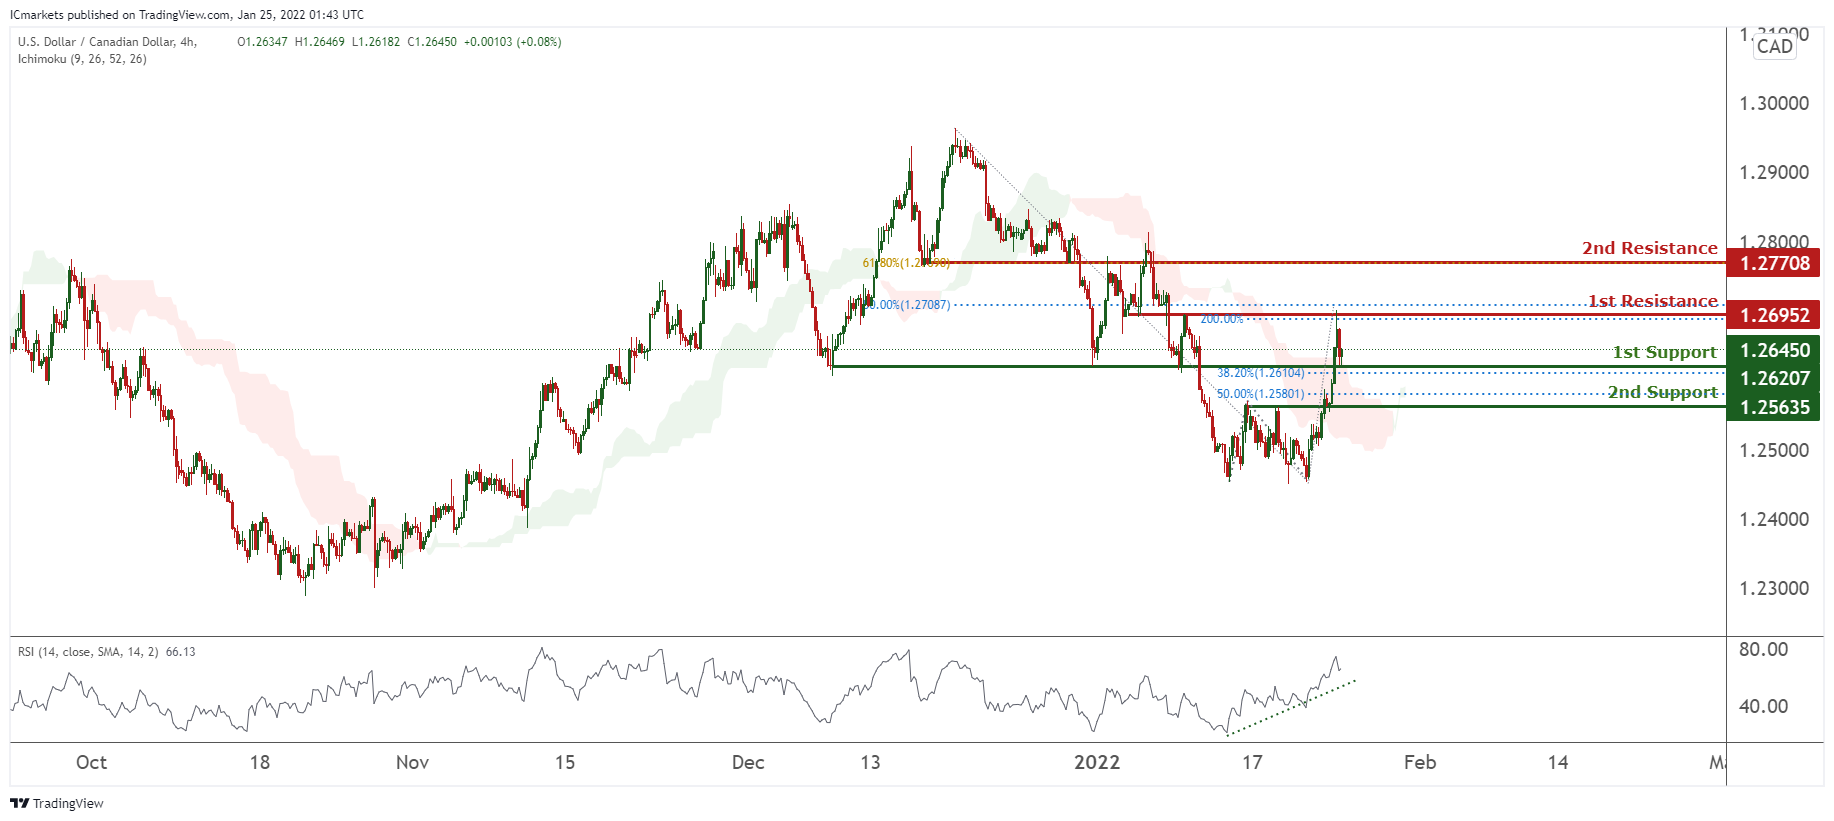
On the H4, with prices currently resting on the ichimoku cloud support, we foresee potentially a bullish bounce that price will bounce from our 1st support at 1.26207 which is in line with horizontal overlap resistance and 38.2% Fibonacci retracement to 1st resistance at 1.26952 in line with 200% Fibonacci Projection and 50% Fibonacci retracement, which is a horizontal overlap resistance. Alternatively, price may break 1st support structure and head for 2nd support at 1.25635, in line with 50% Fibonacci retracement. RSI is showing bullish momentum.
Areas of consideration:
- H4 time frame, 1st support at 1.26207
- H4 time frame, 1st resistance at 1.26952
OIL:
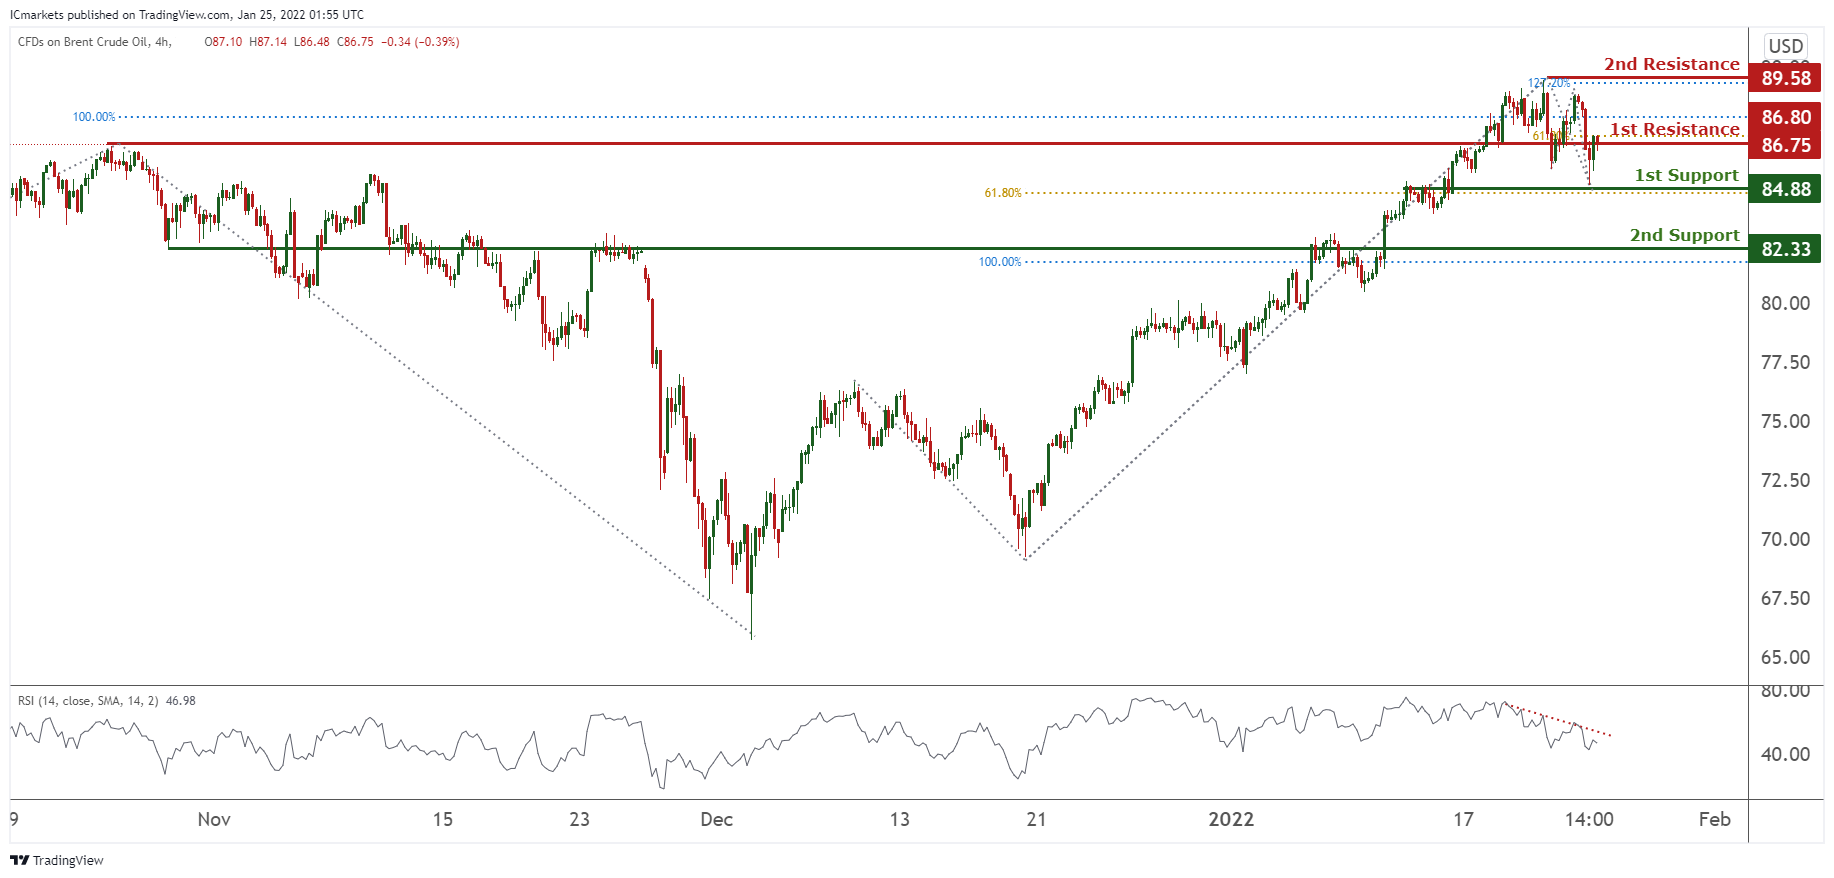
On the H4, prices are at an all time high. We expect potentially a trend reversal, and a dip from our 1st resistance at 86.71 in line with 61.8% Fibonacci extension towards our 1st support at 84.88 in line with 61.8% Fibonacci extension. Alternatively, price may break 1st resistance structure and head for 2nd resistance at 89.58, which is graphically swing high and in line with 127.2% Fibonacci extension. RSI is showing bearish momentum.
Areas of consideration:
- H4 time frame, 1st resistance of 86.71
- H4 time frame, 1st support of 84.88
Dow Jones Industrial Average:
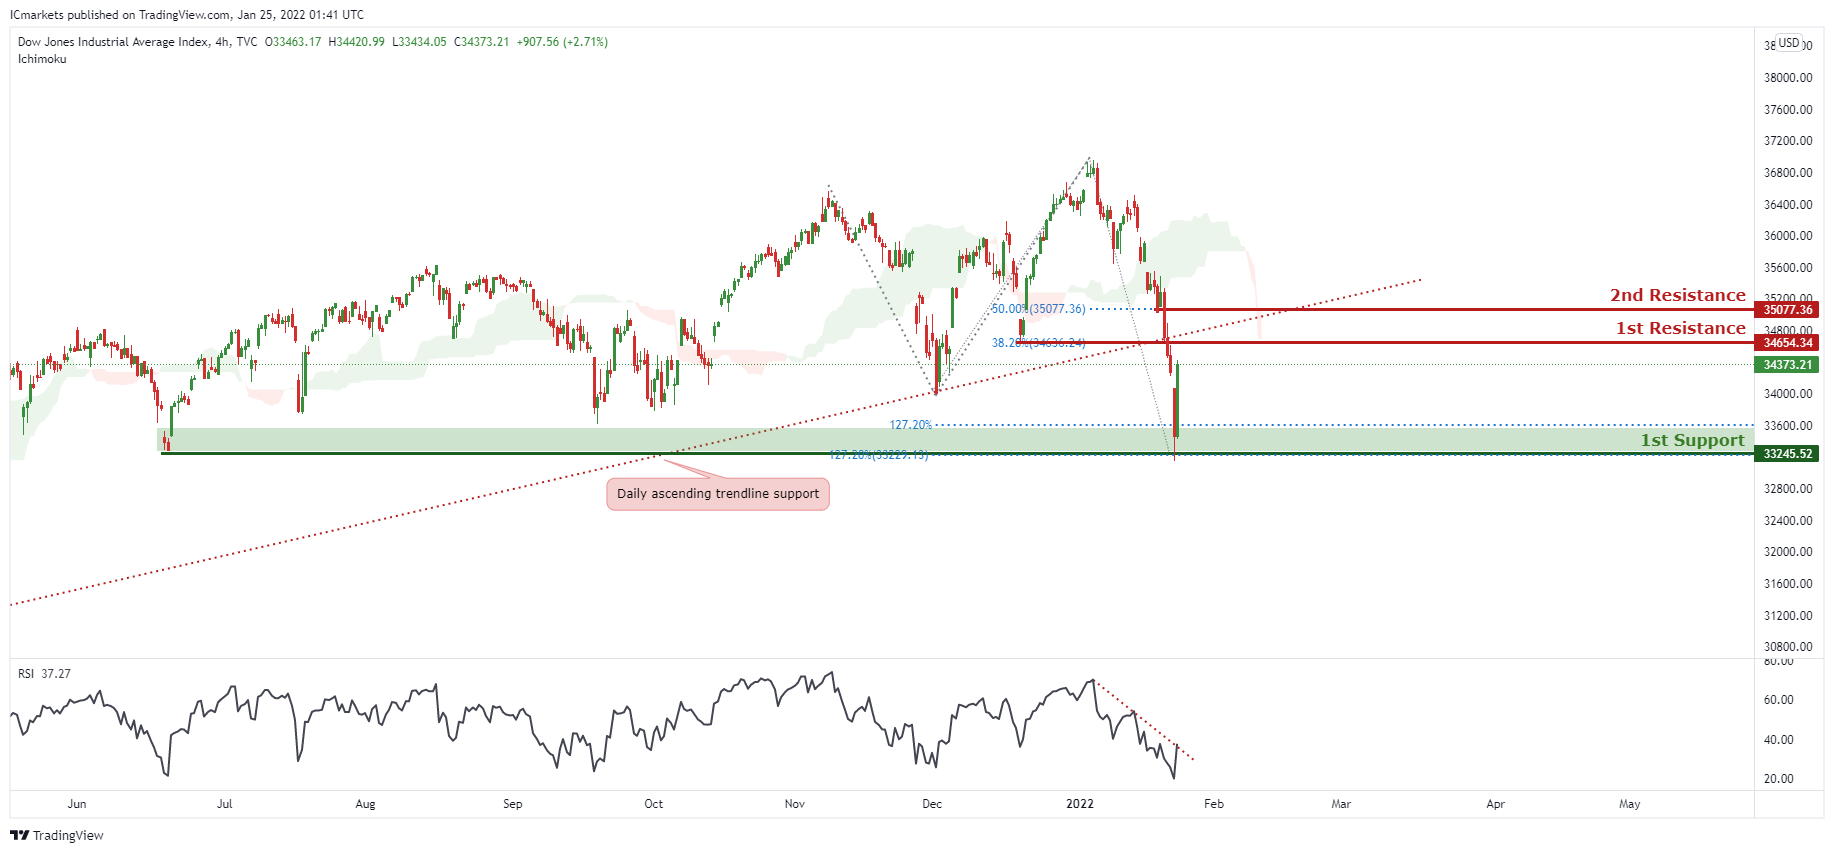
On the H4, price broke out of the ascending trendline support,signifying an overall bearish momentum. We can expect price to drop from our 1st resistance in line horizontal graphical overlap and 38.2% Fibonacci retracement towards 1st support in line with horizontal overlap support ,127.2% Fibonacci extension level and 127.2% Fibonacci projection. Alternatively, price may break 1st resistance structure and head for 2nd resistance, which coincides with 50% Fibonacci retracement.
Areas of consideration:
- H4 time frame, 1st resistance of 34654.34
- H4 time frame, 1st support of 33245.52
GBP/JPY Daily Outlook
Daily Pivots: (S1) 152.96; (P) 153.73; (R1) 154.54; More...
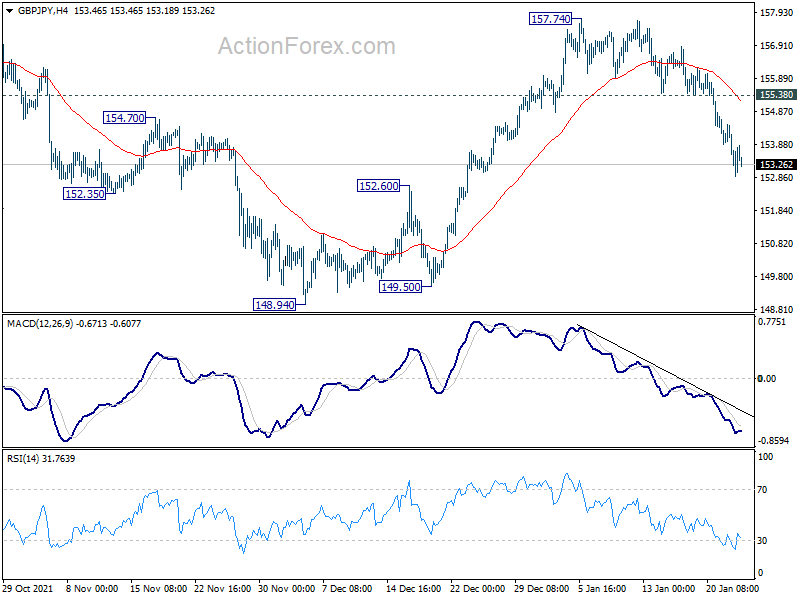
Intraday bias in GBP/JPY remains on the downside as fall from 157.74 is in progress. Such decline is seen as the third leg of the consolidative pattern from 158.19. Deeper fall would be seen to 148.94 support next. On the upside, above 155.38 minor resistance will flip bias back to the upside for 157.74/158.19 resistance zone instead.
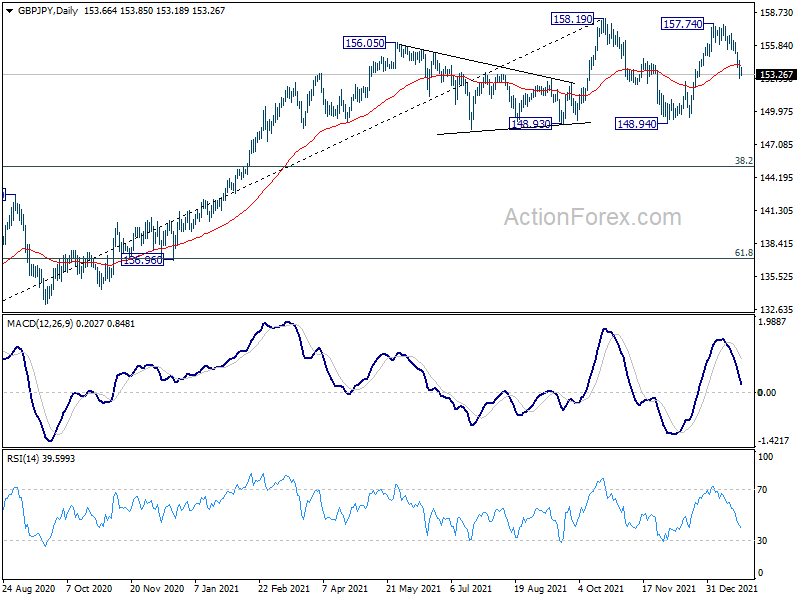
In the bigger picture, price actions from 158.19 are currently seen as developing into a consolidation pattern to up trend from 123.94 (2020 low). Downside should be contained by 123.94 to 158.19 at 145.10 to bring rebound. Firm break of 158.19 will resume the up trend to long term fibonacci level at 167.93. However, sustained break of 145.10 will raise the chance of trend reversal and target 61.8% retracement at 137.02.
Sentiment Still Weak Despite Big U-Turn in US Stocks, Dollar Firm With Yen
US stocks staged a strong comeback overnight, with DOW staging the first-ever 1000-point-plus intraday U-turn. It's down -1100 pts at initially trading but closed up 11 pts eventually. Yet, risk-off sentiment remains dominant in Asia. Dollar is currently the strongest, followed by Yen. Sterling is the worst performer, followed by Kiwi and Loonie. Aussie managed to pare back some losses after much stronger than expected consumer inflation reading. Overall, sentiment would remain vulnerable on developments surrounding Ukraine.
Technically, we'll keep our eyes on EUR/USD, USD/CHF and USD/JPY, which are still range bound. We're talking about 1.1284/1482 in EUR/USD, 0.9090/9276 in USD/CHF and 113.47/115.05 in USD/JPY. The breakouts will reveal much about the underlying dynamics in both Dollar and Yen.
In Asia, at the time of writing, Nikkei is down -1.82%. Hong Kong HSI is down -1.32%. China Shanghai SSE is down -1.12%. Singapore Strait Times is down -1.04%. Japan 10-year JGB yield is down -0.005 at 0.134. Overnight, DOW rose 0.29%. S&P 500 rose 0.28%. NASDAQ rose 0.63%. 10-year yield dropped -0.012 to 1.735.
Australia CPI surged to 3.5% yoy in Q4, trimmed mean CPI at 7-yr high
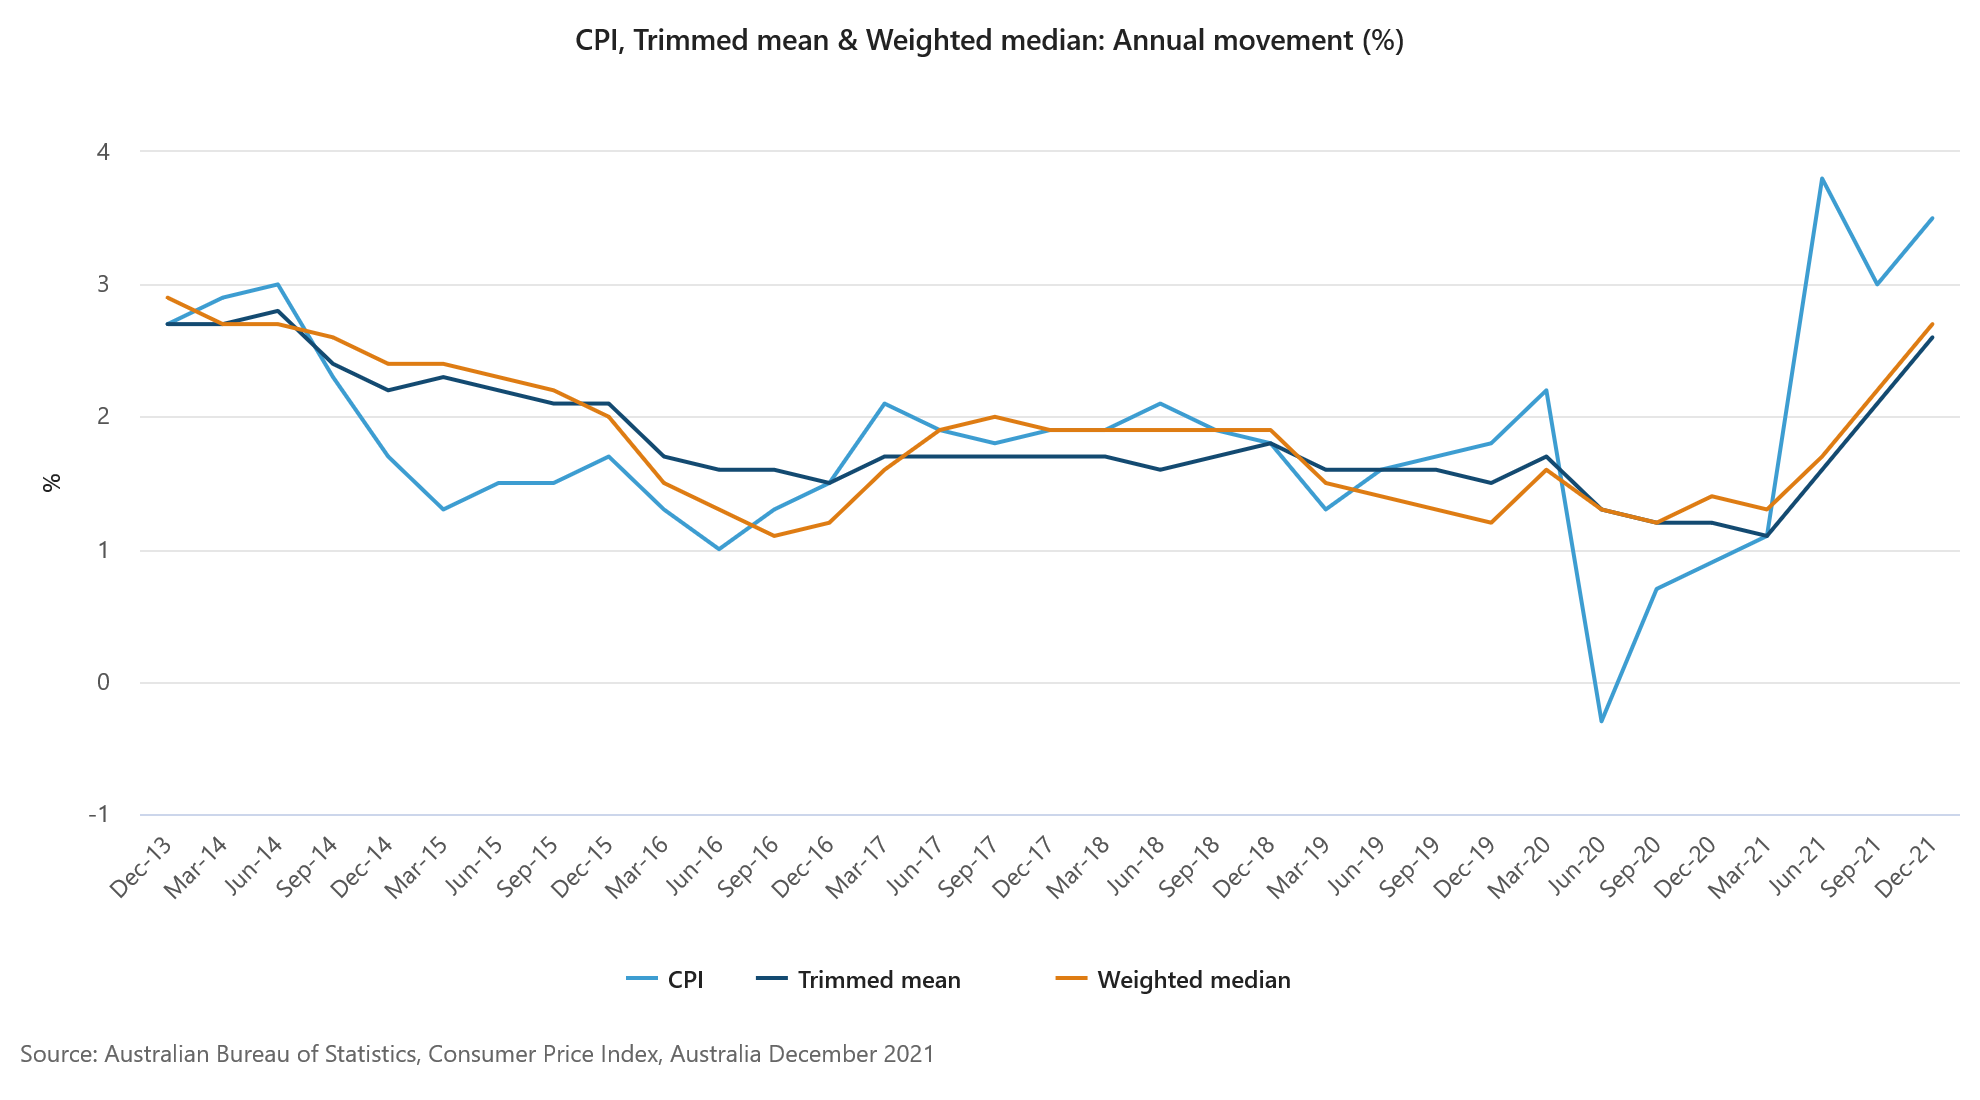
Australia CPI rose 1.3% qoq, 3.5% yoy in Q4, well above expectation of 1.0% qoq, 3.2% yoy. RBA trimmed mean CPI rose 1.0% qoq, 2.6% yoy, also above expectation of 0.7% qoq, 2.4% yoy. The 2.6% yoy rise was the highest since June 2014.
Head of Prices Statistics at the ABS, Michelle Marquardt, said the most significant price rises in the December quarter were new dwellings (+4.2%) and automotive fuel (+6.6%).
Marquardt said: "Annual trimmed mean inflation is the highest since 2014, reflecting the broad-based nature of price increases, particularly for goods."
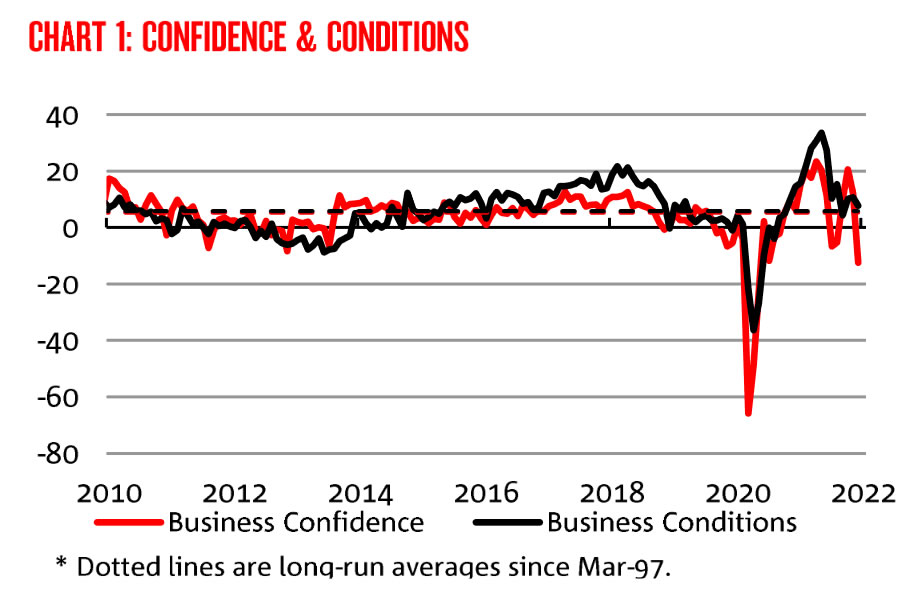
Australia NAB business confidence dropped sharply to -12
Australia NAB business confidence dropped sharply from 12 to -12 in December. Business conditions dropped from 11 to 8. Trading conditions was unchanged at 14. Profitability conditions rose from 8 to 10. Employment conditions dropped from 11 to 2.
"Overall, the December survey results are consistent with an economy that's starting to slow, with some similarities to the data when NSW and Victoria were first entering lockdown," said NAB Chief Economist Alan Oster. "That probably means conditions will fall in early 2022. However, we don't expect the Omicron variant to derail the recovery longer-term."
BoJ Kuroda keeps an eye on inflation risks while maintaining ultra-easy policy
BoJ Governor Haruhiko Kuroda told the parliament today, "the BOJ will continue its ultra-easy policy so improvements in corporate profits and the economy prop up wages and gradually accelerate consumer inflation."
"We remain vigilant to the risk prices may shoot up before wages begin to rise, or how (rising raw material costs) could hurt smaller firms. We must keep an eye out on these risks, while maintaining our current easy monetary policy," Kuroda said.
Meanwhile, Prime Minister Fumio Kishida said, "it's desirable to create an environment in which companies can pass on rising costs and raise wages, so that increasing consumption spurs economic growth and inflation."
Looking ahead
Germany Ifo business climate will be the main focus in European session. UK will release public sector net borrowing. Later in the day, US will release consumer confidence and house price index.
GBP/JPY Daily Outlook
Daily Pivots: (S1) 152.96; (P) 153.73; (R1) 154.54; More...
Intraday bias in GBP/JPY remains on the downside as fall from 157.74 is in progress. Such decline is seen as the third leg of the consolidative pattern from 158.19. Deeper fall would be seen to 148.94 support next. On the upside, above 155.38 minor resistance will flip bias back to the upside for 157.74/158.19 resistance zone instead.
In the bigger picture, price actions from 158.19 are currently seen as developing into a consolidation pattern to up trend from 123.94 (2020 low). Downside should be contained by 123.94 to 158.19 at 145.10 to bring rebound. Firm break of 158.19 will resume the up trend to long term fibonacci level at 167.93. However, sustained break of 145.10 will raise the chance of trend reversal and target 61.8% retracement at 137.02.
Economic Indicators Update
| GMT | Ccy | Events | Actual | Forecast | Previous | Revised |
|---|---|---|---|---|---|---|
| 00:30 | AUD | NAB Business Confidence Dec | -12 | 12 | ||
| 00:30 | AUD | NAB Business Conditions Dec | 8 | 12 | ||
| 00:30 | AUD | CPI Q/Q Q4 | 1.30% | 1.00% | 0.80% | |
| 00:30 | AUD | CPI Y/Y Q4 | 3.50% | 3.20% | 3.00% | |
| 00:30 | AUD | RBA Trimmed Mean CPI Q/Q Q4 | 1.00% | 0.70% | 0.70% | |
| 00:30 | AUD | RBA Trimmed Mean CPI Y/Y Q4 | 2.60% | 2.40% | 2.10% | |
| 07:00 | GBP | Public Sector Net Borrowing (GBP) Dec | 14.5B | 16.6B | ||
| 09:00 | EUR | Germany IFO Business Climate Jan | 94.7 | 94.7 | ||
| 09:00 | EUR | Germany IFO Current Assessment Jan | 96.1 | 96.9 | ||
| 09:00 | EUR | Germany IFO Expectations Jan | 93 | 92.6 | ||
| 14:00 | USD | S&P/Case-Shiller Home Price Indices Y/Y Nov | 17.80% | 18.40% | ||
| 14:00 | USD | Housing Price Index M/M Nov | 1.00% | 1.10% | ||
| 15:00 | USD | Consumer Confidence Jan | 112.3 | 115.8 |
Australia NAB business confidence dropped sharply to -12
Australia NAB business confidence dropped sharply from 12 to -12 in December. Business conditions dropped from 11 to 8. Trading conditions was unchanged at 14. Profitability conditions rose from 8 to 10. Employment conditions dropped from 11 to 2.
"Overall, the December survey results are consistent with an economy that's starting to slow, with some similarities to the data when NSW and Victoria were first entering lockdown," said NAB Chief Economist Alan Oster. "That probably means conditions will fall in early 2022. However, we don't expect the Omicron variant to derail the recovery longer-term."
Australia CPI surged to 3.5% yoy in Q4, trimmed mean CPI at 7-yr high
Australia CPI rose 1.3% qoq, 3.5% yoy in Q4, well above expectation of 1.0% qoq, 3.2% yoy. RBA trimmed mean CPI rose 1.0% qoq, 2.6% yoy, also above expectation of 0.7% qoq, 2.4% yoy. The 2.6% yoy rise was the highest since June 2014.
Head of Prices Statistics at the ABS, Michelle Marquardt, said the most significant price rises in the December quarter were new dwellings (+4.2%) and automotive fuel (+6.6%).
Marquardt said: "Annual trimmed mean inflation is the highest since 2014, reflecting the broad-based nature of price increases, particularly for goods."
BoJ Kuroda keeps an eye on inflation risks while maintaining ultra-easy policy
BoJ Governor Haruhiko Kuroda told the parliament today, "the BOJ will continue its ultra-easy policy so improvements in corporate profits and the economy prop up wages and gradually accelerate consumer inflation."
"We remain vigilant to the risk prices may shoot up before wages begin to rise, or how (rising raw material costs) could hurt smaller firms. We must keep an eye out on these risks, while maintaining our current easy monetary policy," Kuroda said.
Meanwhile, Prime Minister Fumio Kishida said, "it's desirable to create an environment in which companies can pass on rising costs and raise wages, so that increasing consumption spurs economic growth and inflation."
GBP/USD Nosedives, Upsides Could Be Capped
Key Highlights
- GBP/USD started a fresh decline below the 1.3600 support.
- A key bearish trend line is forming with resistance near 1.3520 on the 4-hours chart.
- EUR/USD declined below the 1.1320 support, with risk of more downsides.
- USD/JPY is struggling to recover above the 114.20 and 114.30 levels.
GBP/USD Technical Analysis
The British Pound started a fresh decline from the 1.3750 zone against the US Dollar. GBP/USD traded below many important supports near 1.3620 to enter a bearish zone.
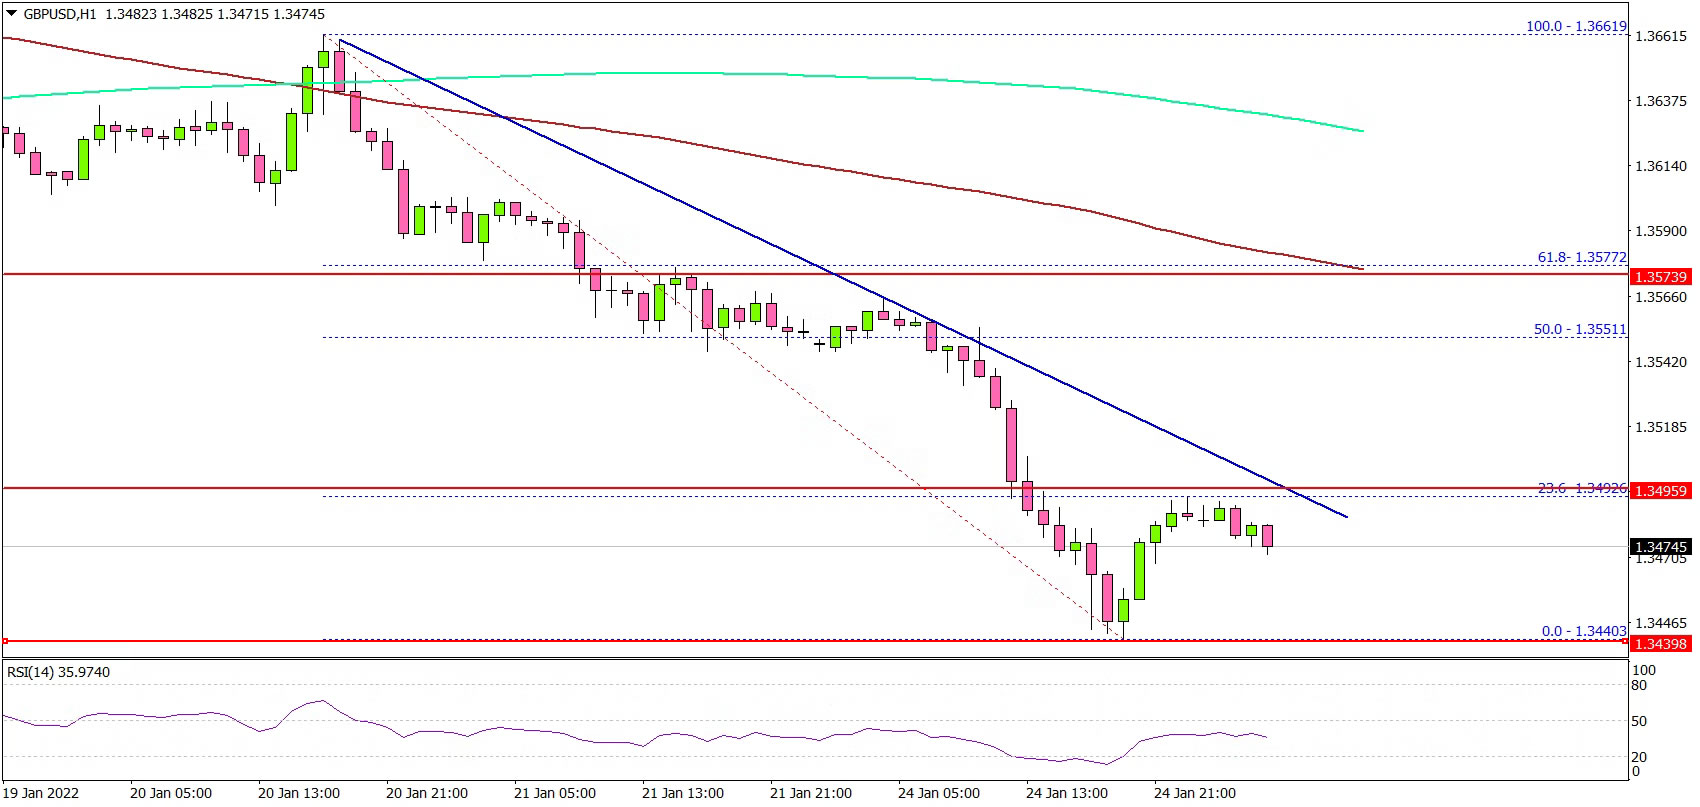
Looking at the 4-hours chart, the pair settled below the 1.3600 level and the 100 simple moving average (red, 4-hours). The pair even traded below the 1.3500 support and the 200 simple moving average (green, 4-hours).
It traded as low as 1.3444 and currently consolidating losses. On the upside, the pair is facing resistance near 1.3490 and 1.3500 levels.
Besides, there is a key bearish trend line forming with resistance near 1.3520 on the same chart. The next major resistance is near the 1.3550 level. It is near the 50% Fib retracement level of the downward move from the 1.3661 swing high to 1.3444 low.
If there is a fresh increase above 1.3550, the pair could rise above 1.3600. If not, there is a risk of more downsides below the 1.3440 level. The next major support sits near the 1.3320 level.
Looking at EUR/USD, the pair traded below the 1.1320 support and seems like there is a risk of more downsides below 1.1300 in the near term.
Economic Releases
- German IFO Business Climate Index for Jan 2022 – Forecast 94.7, versus 94.7 previous.
- US House Price Index for Nov 2021 (MoM) - Forecast +1%, versus +1.1% previous.
Aust Q4 CPI – Core Inflation Already Exceeds Peak in RBA’s Forecasts
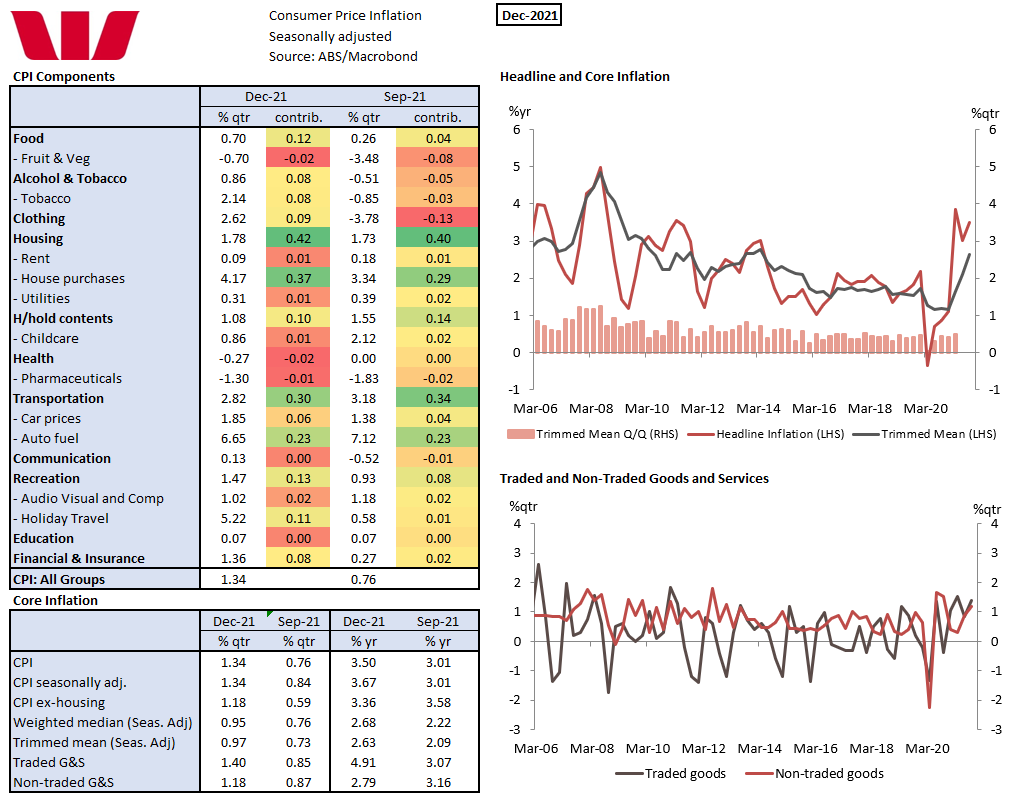
Headline CPI 1.3%qtr/3.5%yr; trimmed mean 0.97%qtr/2.6%yr, weighted median 0.95%qtr/2.7%yr. Core inflation is now above the mid-point of the RBA’s inflation target, not something the RBA was expecting in its forecast profile this early nor of this magnitude.
Headline inflation came in stronger than expected at 1.3% exceeding the top of the range forecast at 1.2%. Westpac and the market were forecasting 1.1%. At two decimal places it was 1.34% % so a solid 1.3%. The annual pace lifted from 3.0% to 3.5% not too far off the June 2021 12yr high of 3.8%.
As we noted in the June CPI update, the acceleration to almost 4%yr was due to base effects of the negative prints in 2020 due to government grants and subsidies. As such, this was expected to be a transitory blip in inflation. This time the ending of the HomeBuilder grants are part, but not all, of the inflation story.
The big surprise was the 1.0% rise in the trimmed mean, well exceeding the market expectation of 0.7%, highlighting the broad spread of this inflation surprise. The 1.0% was the largest quarterly rise in the trimmed mean since 1.2% in September 2008 taking the annual pace to 2.6%yr, the fastest pace of core inflation since June 2014. At two decimal places the trimmed mean rose 0.97%; for note the weighted median gained 0.9% for 2.7%yr.
The ABS reports that most significant price rises were for new dwelling purchase by owner-occupiers (4.2% vs 4.8% forecast) and automotive fuel (6.6% vs 6.7% forecast) and domestic holidays (4.8% vs 5.1% forecast).
The ABS noted that high levels of building construction activity combined with shortages of materials and labour contributed to two consecutive quarters of the largest rise in new dwelling prices since the introduction of the GST in September 2020. As we noted in our preview, fewer payments of HomeBuilder grants compared to the previous quarter also contributed to the rise. These grants have the effect of reducing out of pocket expenses for new dwellings being purchased.
The strong rise in auto fuel was due to post lockdown surge in global demand and constrained supplies while domestic holiday travel & accommodation prices lifted as border closures eased leading to increased demand for domestic air travel and accommodation.
In our preview we argued there was a high degree of uncertainty about how the Black Friday and Boxing Day sales would unfold this year. Black Friday Sales are growing in their significance for Australian retailers but the December quarter was when the economy reopened in NSW and Victoria and retail sales surged as a result. As such there were solid gains in clothing & footwear (2.6% vs 0.1% forecast), household contents & services (1.1% vs flat forecast) and audio visual & computing (1.0% vs 0.3% forecast).
The ABS is also now publishing a wider series of analytical indexes to help understand the drivers of inflation. The ABS noted that the rise in automotive fuel and new dwelling prices were the main contributors to goods inflation. As noted earlier there were also increased across a broad range of other goods with strong demand and supply disruptions leading to price rises for goods such as furniture and motor vehicles. Goods inflation is running at a 4.3%yr pace, services at a 2.3%yr pace. There is the exact reverse of the trend we have seen for the past few decades.
The ABS also noted that non-discretionary inflation (4.5%yr) is higher than the CPI (3.5%) and more than twice the rate of discretionary inflation (1.9%yr). Non-discretionary inflation includes goods and services that households are less likely to reduce their consumption of, such as food, automotive fuel, housing and health costs.
We will process all this data and review of near-term CPI forecasts based on this new information. While we don’t know what the overall impact will be it is clear that at 3.5%yr the current pace of inflation is running ahead of where we thought it would be at the end of 2021 (3.2%yr for headline, 2.4%yr for the trimmed mean) pointing to upside risk to our June 2022 forecasts of 3.3%yr of the CPI, 2.9%yr for the trimmed mean.
Fed meeting: Will Asset Purchases End Early?
The main event this week will be the Fed’s policy decision at 19:00 GMT Wednesday. No action is expected, but with the markets pricing in four rate increases for this year, the central bank is likely to signal that normalization is imminent. There is also some speculation that asset purchases could come to an immediate end. That will likely decide the reaction in the dollar.
Economic boom
The US economic recovery has been very impressive. The economy is already much larger than it was before the crisis, the labor market is tight by several metrics, consumption is strong, and inflation is running at the fastest pace in four decades.
Wages have also started to fire up as companies compete to attract workers. That’s crucial for the Fed because it implies that inflationary pressures might not cool by themselves once supply chains normalize and energy prices stabilize.
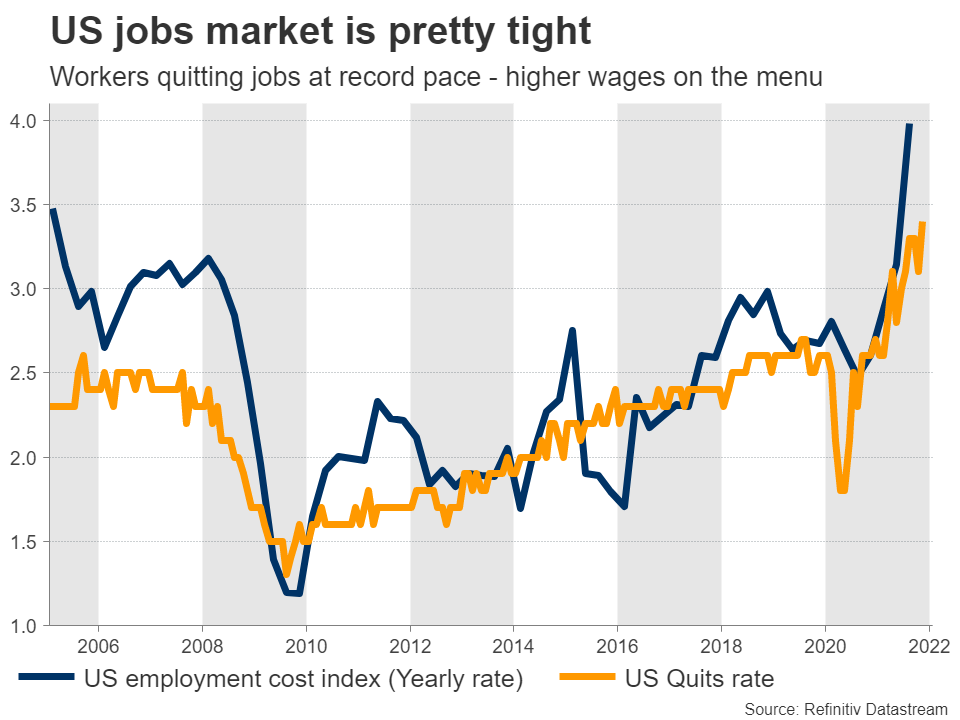
As a result, market participants are betting the Fed will step on the brakes, currently pricing in four rate increases for this year. Beyond rate hikes, another crucial variable for traders is when and how aggressively the Fed will begin shrinking its balance sheet.
Meeting playbook
Turning to this week’s meeting, no action is anticipated. Instead, the central bank is merely expected to signal that rate hikes are on the menu soon, essentially preparing the ground for liftoff in March.
The twist is that some strategists are calling for asset purchases to come to an immediate halt. At its previous meeting the Fed said it would stop them in March, but with the US economy being so strong and inflation roaring, many argue there’s no real benefit in continuing to buy Treasuries and mortgage-backed securities.
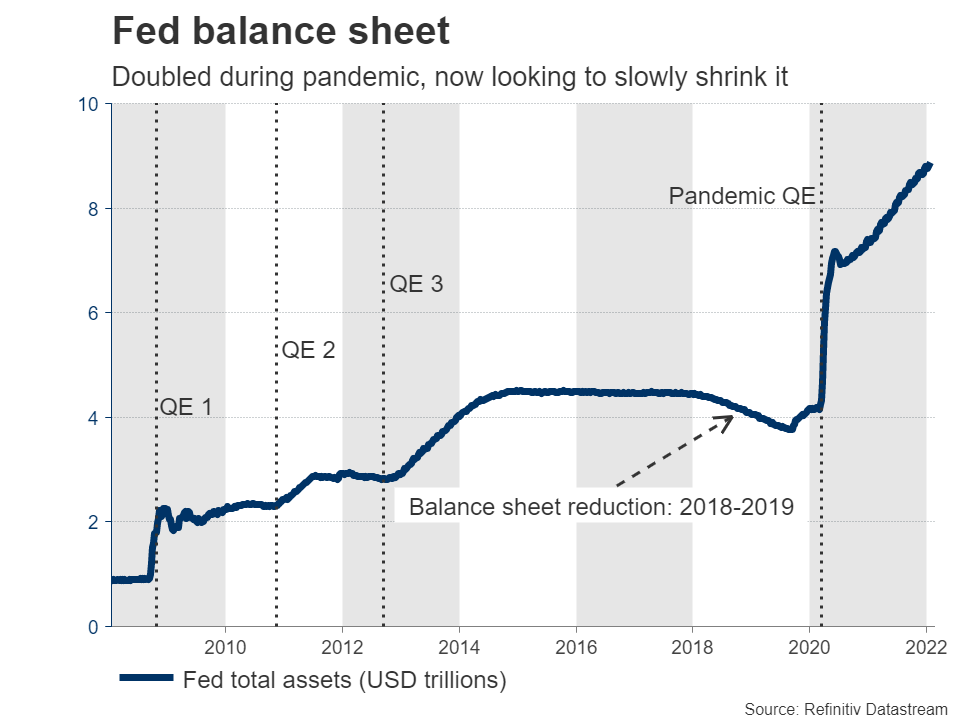
While that is true, the Fed also doesn’t want to shock financial markets. Even though equity markets have declined substantially and Treasury yields have soared in the past few weeks as traders priced in much of what the Fed will do this year, there hasn’t been any sense of panic selling.
The Fed wants to keep it that way. Ending asset purchases one month early would only stoke panic, without delivering any meaningful benefits in fighting inflation. Such a move wouldn’t make much sense from a risk management perspective.
Therefore, if the Fed sticks to its current plan to end asset purchases in March, the initial reaction in the dollar may be slightly negative as those looking for an early stop are left disappointed.
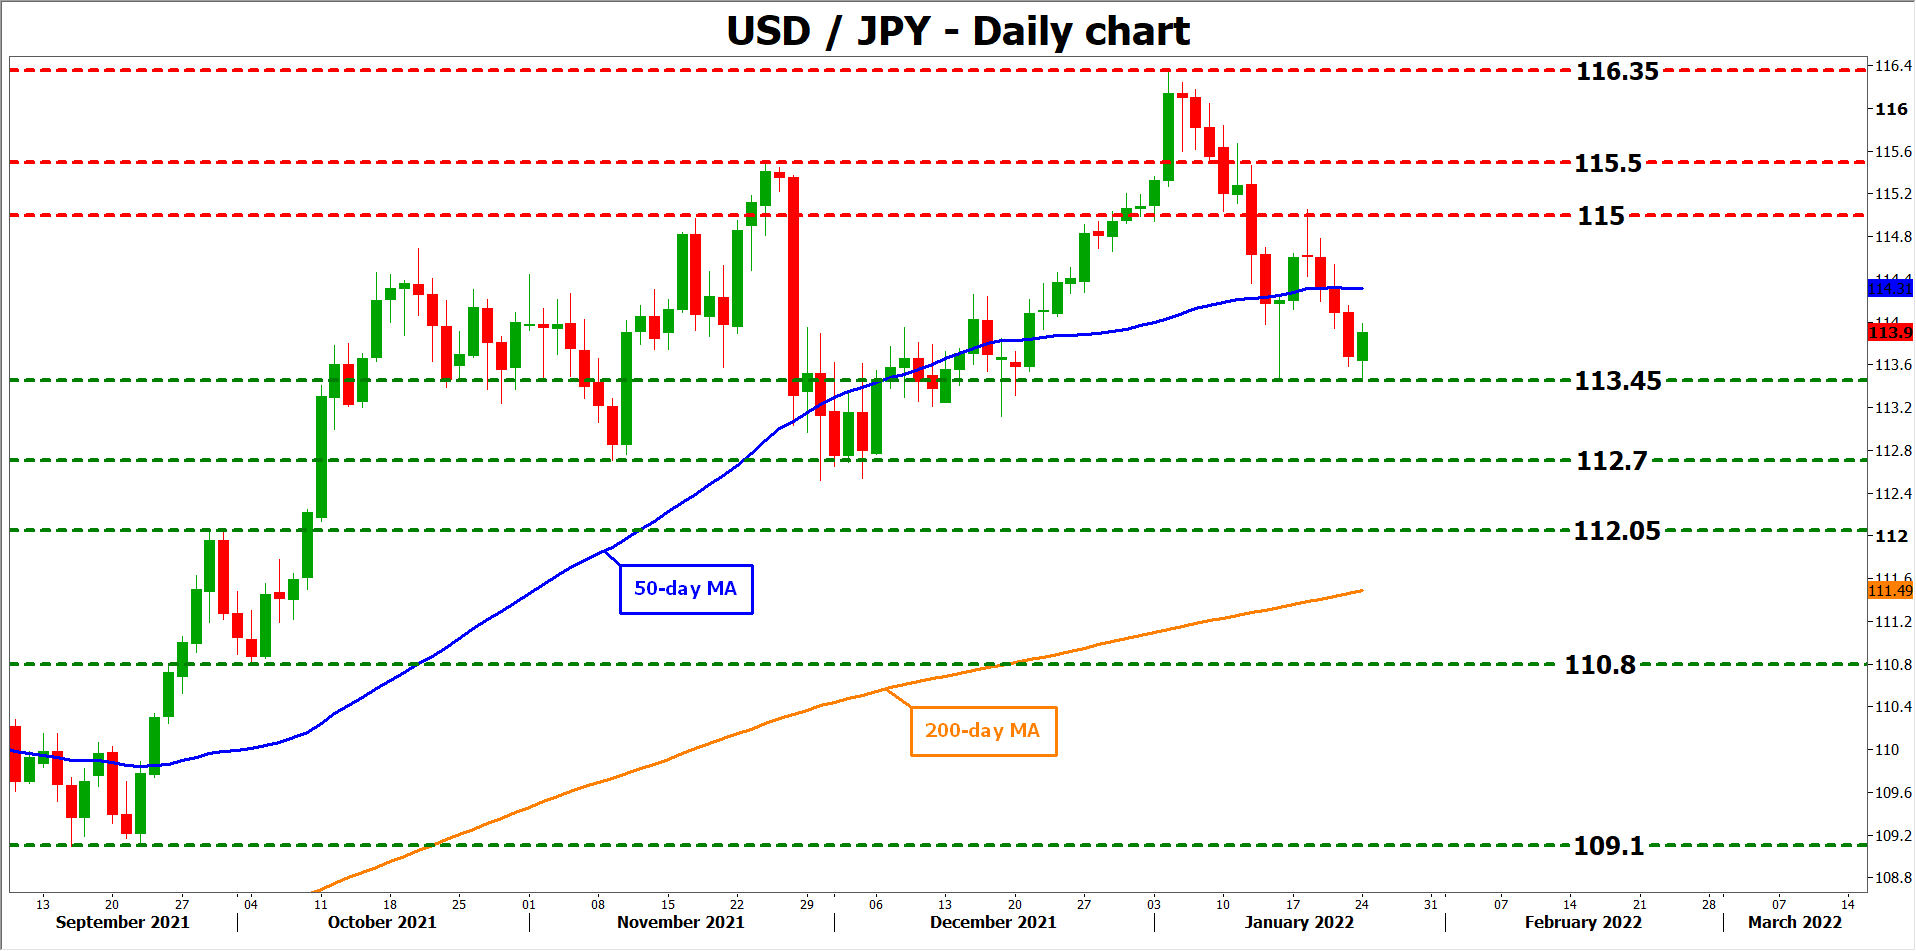
Looking at dollar/yen from a technical perspective, the pair could encounter immediate support near the 113.45 level, a violation of which would turn the focus towards 112.70.
On the upside, the first target for the bulls may be the 115.00 region.
Dollar still attractive overall
In the bigger picture, the outlook for the dollar remains favorable over the next few months. The US economy is booming and although the markets have already priced in much of what the Fed will do this year, the pricing for next year still has some room to grow.
Money markets are currently pricing in less than three hikes for next year, which may turn out to be too conservative. Hence, Treasury yields can still move higher, widening the dollar’s interest rate advantage.
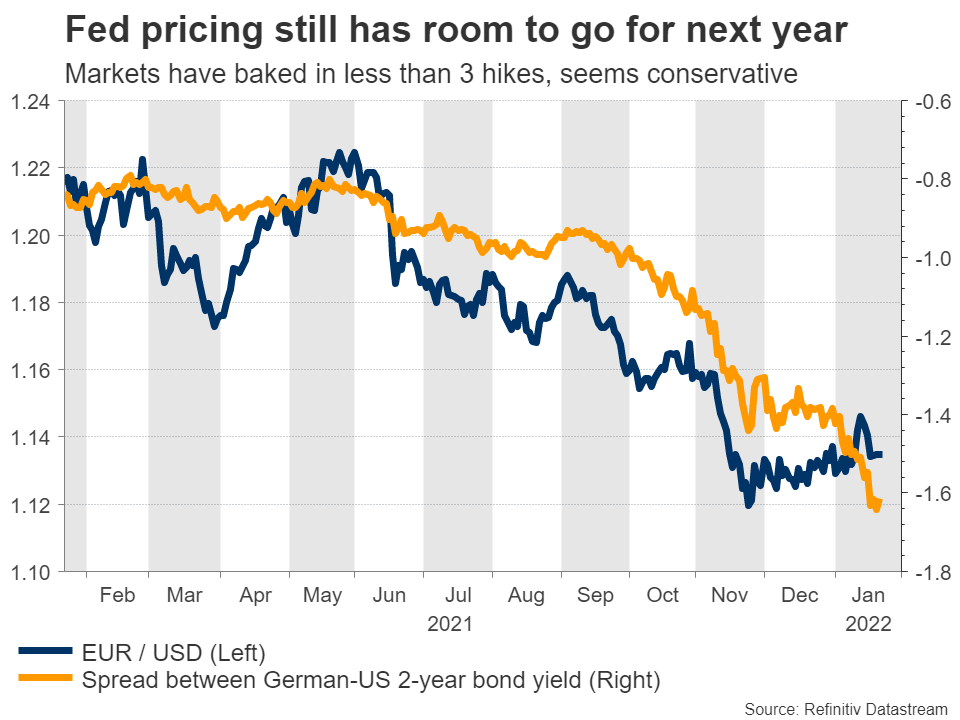
Likewise, the dollar tends to perform well during periods of market stress thanks to its status as the reserve currency, which may come in handy if the rest of the year is as volatile as January has been.
The main risk to this view would be any signs of ‘peak inflation’ in the coming months. If investors sense that the wild days of inflation are behind us already, they could dial back bets for aggressive Fed tightening. However, that’s probably a story for March or even later.
Finally, note that beyond the Fed meeting, there’s also a barrage of US data releases this week, including the first estimate of GDP for the last quarter on Thursday.